| 1 Response Show forest plot | 31 | 3228 | Odds Ratio (M‐H, Random, 95% CI) | 2.64 [2.28, 3.06] |
|
| 1.1 at 1 to 5 weeks | 13 | 1241 | Odds Ratio (M‐H, Random, 95% CI) | 2.59 [2.03, 3.29] |
| 1.2 at 6 to 12 weeks | 18 | 1987 | Odds Ratio (M‐H, Random, 95% CI) | 2.67 [2.21, 3.23] |
| 2 Remission Show forest plot | 2 | 120 | Odds Ratio (M‐H, Random, 95% CI) | 3.29 [1.48, 7.31] |
|
| 2.1 at 1 to 5 weeks | 0 | 0 | Odds Ratio (M‐H, Random, 95% CI) | 0.0 [0.0, 0.0] |
| 2.2 at 6 to 12 weeks | 2 | 120 | Odds Ratio (M‐H, Random, 95% CI) | 3.29 [1.48, 7.31] |
| 3 Mean severity of depression ‐ change scores Show forest plot | 11 | 1496 | Std. Mean Difference (IV, Random, 95% CI) | ‐0.63 [‐0.73, ‐0.52] |
|
| 3.1 at 1 to 5 weeks | 3 | 498 | Std. Mean Difference (IV, Random, 95% CI) | ‐0.61 [‐0.83, ‐0.40] |
| 3.2 at 6 to 12 weeks | 8 | 998 | Std. Mean Difference (IV, Random, 95% CI) | ‐0.63 [‐0.76, ‐0.50] |
| 4 Mean severity of depression ‐ endpoint scores Show forest plot | 21 | 1599 | Std. Mean Difference (IV, Random, 95% CI) | ‐0.59 [‐0.69, ‐0.49] |
|
| 4.1 at 1 to 5 weeks | 10 | 720 | Std. Mean Difference (IV, Random, 95% CI) | ‐0.61 [‐0.77, ‐0.46] |
| 4.2 at 6 to 12 weeks | 11 | 879 | Std. Mean Difference (IV, Random, 95% CI) | ‐0.57 [‐0.71, ‐0.43] |
| 5 Drop‐out: total Show forest plot | 24 | 2400 | Odds Ratio (M‐H, Random, 95% CI) | 0.71 [0.55, 0.93] |
|
| 5.1 at 1 to 5 weeks | 9 | 770 | Odds Ratio (M‐H, Random, 95% CI) | 0.86 [0.59, 1.25] |
| 5.2 at 6 to 12 weeks | 15 | 1630 | Odds Ratio (M‐H, Random, 95% CI) | 0.65 [0.46, 0.92] |
| 6 Drop‐out: due to inefficacy Show forest plot | 19 | 2017 | Odds Ratio (M‐H, Random, 95% CI) | 0.20 [0.14, 0.28] |
|
| 6.1 at 1 to 5 weeks | 7 | 584 | Odds Ratio (M‐H, Random, 95% CI) | 0.25 [0.14, 0.43] |
| 6.2 at 6 to 12 weeks | 12 | 1433 | Odds Ratio (M‐H, Random, 95% CI) | 0.17 [0.10, 0.29] |
| 7 Drop‐out: due to adverse events Show forest plot | 19 | 2174 | Odds Ratio (M‐H, Random, 95% CI) | 4.15 [2.71, 6.35] |
|
| 7.1 at 1 to 5 weeks | 8 | 756 | Odds Ratio (M‐H, Random, 95% CI) | 4.29 [2.19, 8.38] |
| 7.2 at 6 to 12 weeks | 11 | 1418 | Odds Ratio (M‐H, Random, 95% CI) | 4.15 [2.31, 7.43] |
| 8 Side effects ‐ total number of patients experiencing at least one side effect Show forest plot | 7 | 802 | Odds Ratio (M‐H, Random, 95% CI) | 4.64 [2.45, 8.78] |
|
| 8.1 1 to 5 weeks | 2 | 162 | Odds Ratio (M‐H, Random, 95% CI) | 1.77 [0.33, 9.57] |
| 8.2 at 6 to 12 weeks | 5 | 640 | Odds Ratio (M‐H, Random, 95% CI) | 6.27 [2.95, 13.29] |
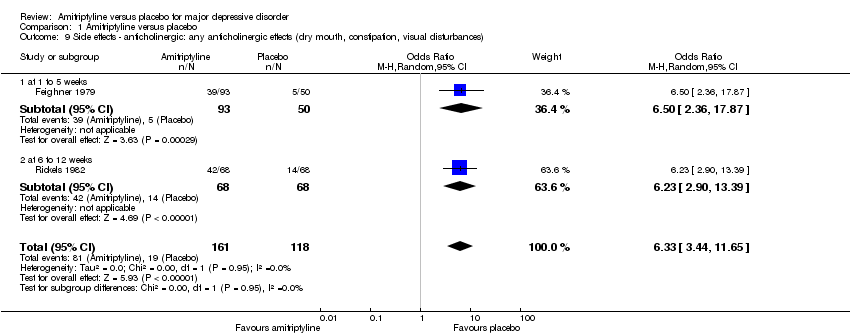
| 9 Side effects ‐ anticholinergic: any anticholinergic effects (dry mouth, constipation, visual disturbances) Show forest plot | 2 | 279 | Odds Ratio (M‐H, Random, 95% CI) | 6.33 [3.44, 11.65] |
|
| 9.1 at 1 to 5 weeks | 1 | 143 | Odds Ratio (M‐H, Random, 95% CI) | 6.5 [2.36, 17.87] |
| 9.2 at 6 to 12 weeks | 1 | 136 | Odds Ratio (M‐H, Random, 95% CI) | 6.23 [2.90, 13.39] |
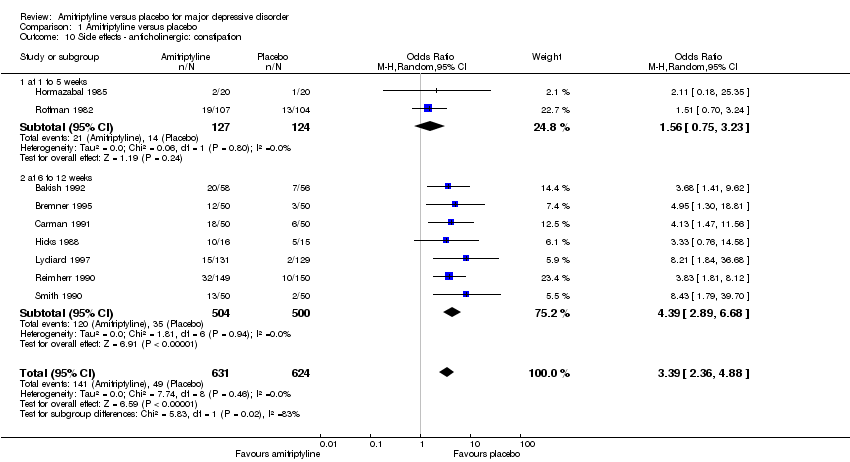
| 10 Side effects ‐ anticholinergic: constipation Show forest plot | 9 | 1255 | Odds Ratio (M‐H, Random, 95% CI) | 3.39 [2.36, 4.88] |
|
| 10.1 at 1 to 5 weeks | 2 | 251 | Odds Ratio (M‐H, Random, 95% CI) | 1.56 [0.75, 3.23] |
| 10.2 at 6 to 12 weeks | 7 | 1004 | Odds Ratio (M‐H, Random, 95% CI) | 4.39 [2.89, 6.68] |
| 11 Side effects ‐ anticholinergic: dry mouth Show forest plot | 11 | 1414 | Odds Ratio (M‐H, Random, 95% CI) | 13.50 [9.38, 19.42] |
|
| 11.1 at 1 to 5 weeks | 3 | 311 | Odds Ratio (M‐H, Random, 95% CI) | 8.76 [4.80, 15.98] |
| 11.2 at 6 to 12 weeks | 8 | 1103 | Odds Ratio (M‐H, Random, 95% CI) | 15.15 [9.73, 23.61] |
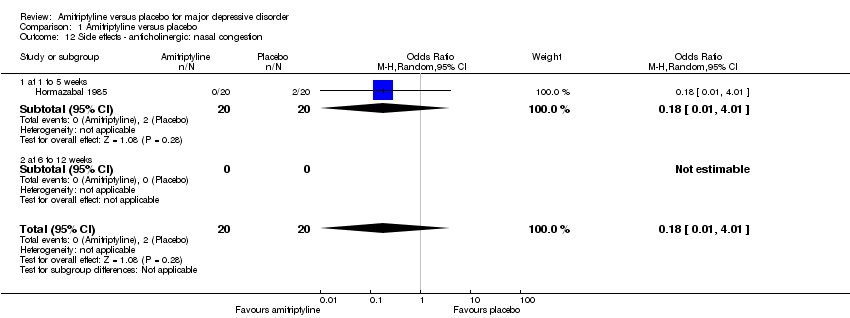
| 12 Side effects ‐ anticholinergic: nasal congestion Show forest plot | 1 | 40 | Odds Ratio (M‐H, Random, 95% CI) | 0.18 [0.01, 4.01] |
|
| 12.1 at 1 to 5 weeks | 1 | 40 | Odds Ratio (M‐H, Random, 95% CI) | 0.18 [0.01, 4.01] |
| 12.2 at 6 to 12 weeks | 0 | 0 | Odds Ratio (M‐H, Random, 95% CI) | 0.0 [0.0, 0.0] |
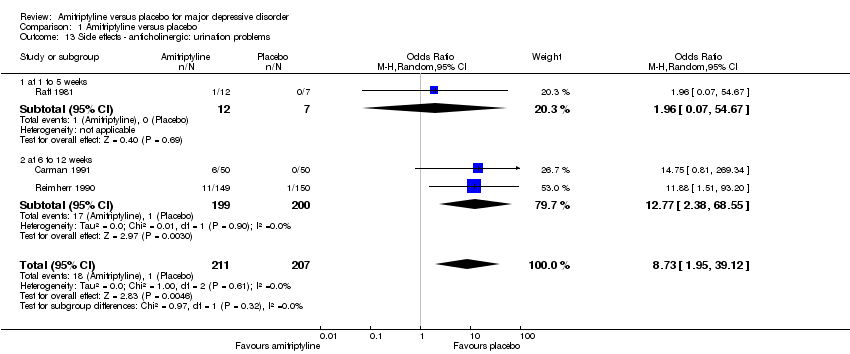
| 13 Side effects ‐ anticholinergic: urination problems Show forest plot | 3 | 418 | Odds Ratio (M‐H, Random, 95% CI) | 8.73 [1.95, 39.12] |
|
| 13.1 at 1 to 5 weeks | 1 | 19 | Odds Ratio (M‐H, Random, 95% CI) | 1.96 [0.07, 54.67] |
| 13.2 at 6 to 12 weeks | 2 | 399 | Odds Ratio (M‐H, Random, 95% CI) | 12.77 [2.38, 68.55] |
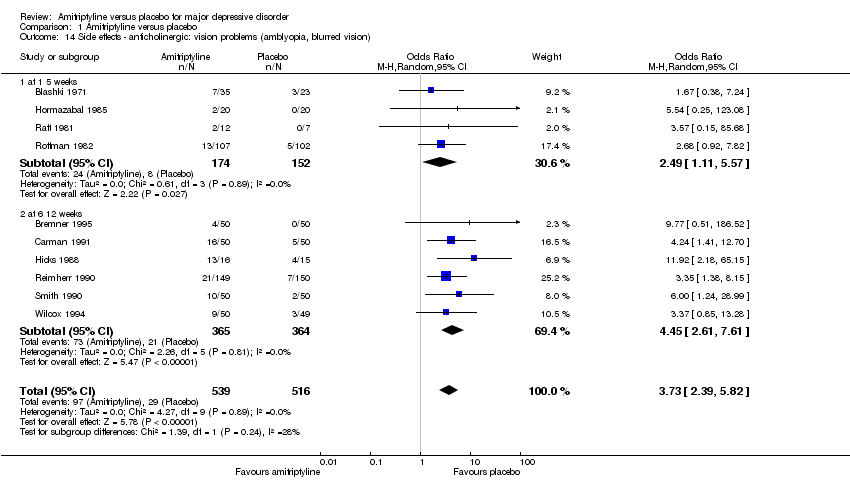
| 14 Side effects ‐ anticholinergic: vision problems (amblyopia, blurred vision) Show forest plot | 10 | 1055 | Odds Ratio (M‐H, Random, 95% CI) | 3.73 [2.39, 5.82] |
|
| 14.1 at 1 5 weeks | 4 | 326 | Odds Ratio (M‐H, Random, 95% CI) | 2.49 [1.11, 5.57] |
| 14.2 at 6 12 weeks | 6 | 729 | Odds Ratio (M‐H, Random, 95% CI) | 4.45 [2.61, 7.61] |
| 15 Side effects ‐ cardiovascular: hypertension Show forest plot | 1 | 100 | Odds Ratio (M‐H, Random, 95% CI) | 2.14 [0.50, 9.07] |
|
| 15.1 at 1 to 5 weeks | 0 | 0 | Odds Ratio (M‐H, Random, 95% CI) | 0.0 [0.0, 0.0] |
| 15.2 at 6 to 12 weeks | 1 | 100 | Odds Ratio (M‐H, Random, 95% CI) | 2.14 [0.50, 9.07] |
| 16 Side effects ‐ cardiovascular: hypotension Show forest plot | 1 | 100 | Odds Ratio (M‐H, Random, 95% CI) | 3.91 [0.77, 19.83] |
|
| 16.1 at 1 to 5 weeks | 0 | 0 | Odds Ratio (M‐H, Random, 95% CI) | 0.0 [0.0, 0.0] |
| 16.2 at 6 to 12 weeks | 1 | 100 | Odds Ratio (M‐H, Random, 95% CI) | 3.91 [0.77, 19.83] |
| 17 Side effects ‐ cardiovascular: lightheadedness Show forest plot | 1 | 31 | Odds Ratio (M‐H, Random, 95% CI) | 3.79 [0.75, 19.04] |
|
| 17.1 at 1 to 5 weeks | 0 | 0 | Odds Ratio (M‐H, Random, 95% CI) | 0.0 [0.0, 0.0] |
| 17.2 at 6 to 12 weeks | 1 | 31 | Odds Ratio (M‐H, Random, 95% CI) | 3.79 [0.75, 19.04] |
| 18 Side effects ‐ cardiovascular: palpitations Show forest plot | 1 | 299 | Odds Ratio (M‐H, Random, 95% CI) | 3.15 [0.84, 11.87] |
|
| 18.1 at 1 to 5 weeks | 0 | 0 | Odds Ratio (M‐H, Random, 95% CI) | 0.0 [0.0, 0.0] |
| 18.2 at 6 to 12 weeks | 1 | 299 | Odds Ratio (M‐H, Random, 95% CI) | 3.15 [0.84, 11.87] |
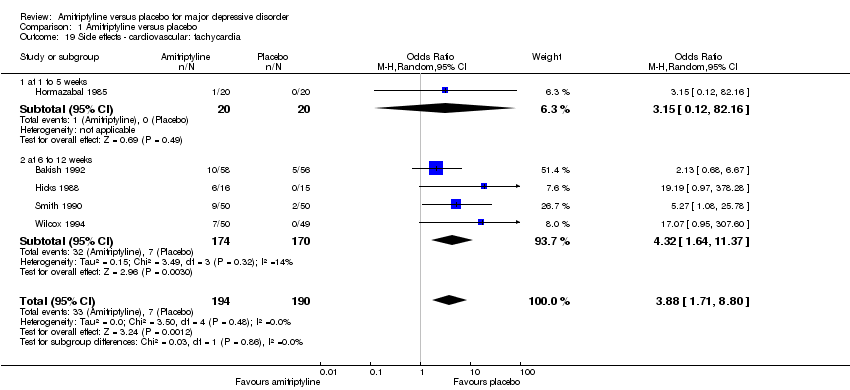
| 19 Side effects ‐ cardiovascular: tachycardia Show forest plot | 5 | 384 | Odds Ratio (M‐H, Random, 95% CI) | 3.88 [1.71, 8.80] |
|
| 19.1 at 1 to 5 weeks | 1 | 40 | Odds Ratio (M‐H, Random, 95% CI) | 3.15 [0.12, 82.16] |
| 19.2 at 6 to 12 weeks | 4 | 344 | Odds Ratio (M‐H, Random, 95% CI) | 4.32 [1.64, 11.37] |
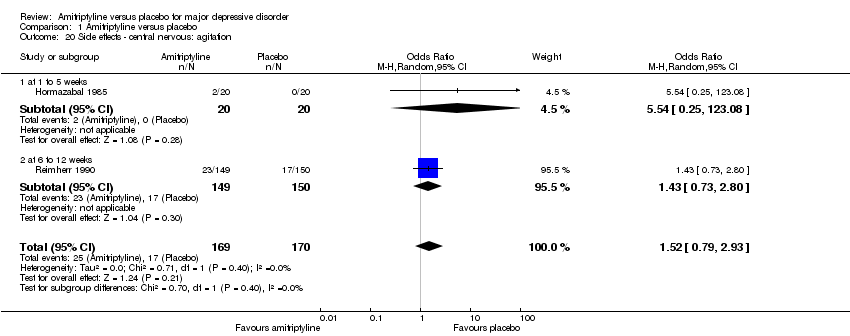
| 20 Side effects ‐ central nervous: agitation Show forest plot | 2 | 339 | Odds Ratio (M‐H, Random, 95% CI) | 1.52 [0.79, 2.93] |
|
| 20.1 at 1 to 5 weeks | 1 | 40 | Odds Ratio (M‐H, Random, 95% CI) | 5.54 [0.25, 123.08] |
| 20.2 at 6 to 12 weeks | 1 | 299 | Odds Ratio (M‐H, Random, 95% CI) | 1.43 [0.73, 2.80] |
| 21 Side effects ‐ central nervous: amnesia Show forest plot | 1 | 299 | Odds Ratio (M‐H, Random, 95% CI) | 13.63 [0.76, 244.23] |
|
| 21.1 at 1 to 5 weeks | 0 | 0 | Odds Ratio (M‐H, Random, 95% CI) | 0.0 [0.0, 0.0] |
| 21.2 at 6 to 12 weeks | 1 | 299 | Odds Ratio (M‐H, Random, 95% CI) | 13.63 [0.76, 244.23] |
| 22 Side effects ‐ central nervous: confusion Show forest plot | 4 | 228 | Odds Ratio (M‐H, Random, 95% CI) | 2.76 [0.50, 15.33] |
|
| 22.1 at 1 to 5 weeks | 2 | 98 | Odds Ratio (M‐H, Random, 95% CI) | 0.79 [0.19, 3.32] |
| 22.2 at 6 to 12 weeks | 2 | 130 | Odds Ratio (M‐H, Random, 95% CI) | 6.06 [0.85, 43.07] |
| 23 Side effects ‐ central nervous: disco‐ordination Show forest plot | 1 | 100 | Odds Ratio (M‐H, Random, 95% CI) | 6.68 [0.77, 57.70] |
|
| 23.1 at 1 to 5 weeks | 0 | 0 | Odds Ratio (M‐H, Random, 95% CI) | 0.0 [0.0, 0.0] |
| 23.2 at 6 to 12 weeks | 1 | 100 | Odds Ratio (M‐H, Random, 95% CI) | 6.68 [0.77, 57.70] |
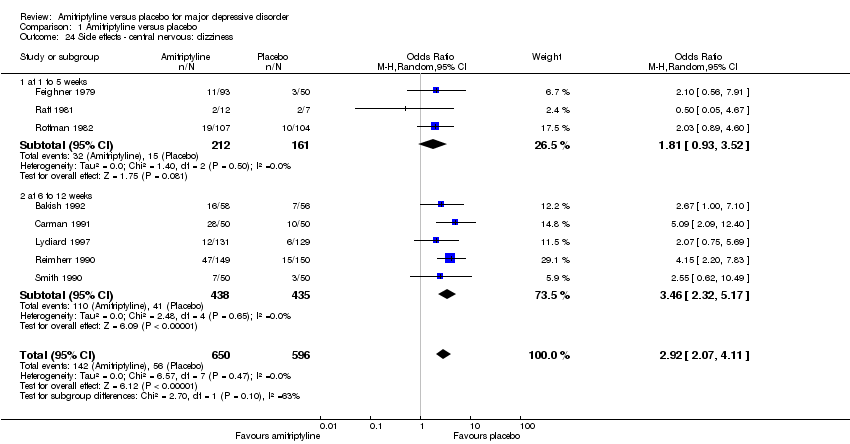
| 24 Side effects ‐ central nervous: dizziness Show forest plot | 8 | 1246 | Odds Ratio (M‐H, Random, 95% CI) | 2.92 [2.07, 4.11] |
|
| 24.1 at 1 to 5 weeks | 3 | 373 | Odds Ratio (M‐H, Random, 95% CI) | 1.81 [0.93, 3.52] |
| 24.2 at 6 to 12 weeks | 5 | 873 | Odds Ratio (M‐H, Random, 95% CI) | 3.46 [2.32, 5.17] |
| 25 Side effects ‐ central nervous: headache Show forest plot | 9 | 1173 | Odds Ratio (M‐H, Random, 95% CI) | 0.84 [0.54, 1.29] |
|
| 25.1 at 1 to 5 weeks | 3 | 269 | Odds Ratio (M‐H, Random, 95% CI) | 0.90 [0.29, 2.75] |
| 25.2 at 6 to 12 weeks | 6 | 904 | Odds Ratio (M‐H, Random, 95% CI) | 0.85 [0.50, 1.43] |
| 26 Side effects ‐ central nervous: increased activity Show forest plot | 1 | 40 | Odds Ratio (M‐H, Random, 95% CI) | 3.15 [0.12, 82.16] |
|
| 26.1 at 1 to 5 weeks | 1 | 40 | Odds Ratio (M‐H, Random, 95% CI) | 3.15 [0.12, 82.16] |
| 26.2 at 6 to 12 weeks | 0 | 0 | Odds Ratio (M‐H, Random, 95% CI) | 0.0 [0.0, 0.0] |
| 27 Side effects ‐ central nervous: insomnia Show forest plot | 5 | 923 | Odds Ratio (M‐H, Random, 95% CI) | 0.70 [0.39, 1.24] |
|
| 27.1 at 1 to 5 weeks | 2 | 250 | Odds Ratio (M‐H, Random, 95% CI) | 0.41 [0.12, 1.36] |
| 27.2 at 6 to 12 weeks | 3 | 673 | Odds Ratio (M‐H, Random, 95% CI) | 0.81 [0.42, 1.57] |
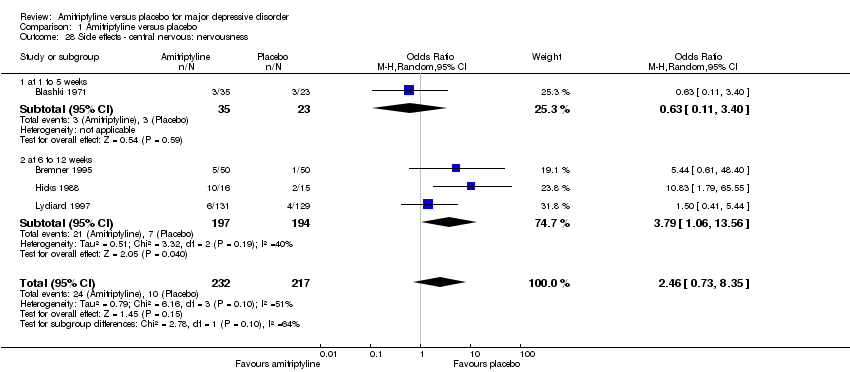
| 28 Side effects ‐ central nervous: nervousness Show forest plot | 4 | 449 | Odds Ratio (M‐H, Random, 95% CI) | 2.46 [0.73, 8.35] |
|
| 28.1 at 1 to 5 weeks | 1 | 58 | Odds Ratio (M‐H, Random, 95% CI) | 0.63 [0.11, 3.40] |
| 28.2 at 6 to 12 weeks | 3 | 391 | Odds Ratio (M‐H, Random, 95% CI) | 3.79 [1.06, 13.56] |
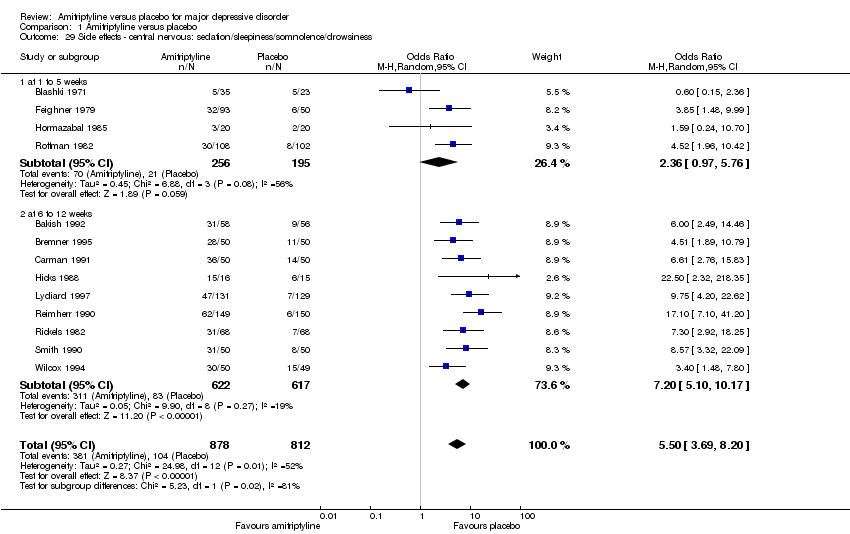
| 29 Side effects ‐ central nervous: sedation/sleepiness/somnolence/drowsiness Show forest plot | 13 | 1690 | Odds Ratio (M‐H, Random, 95% CI) | 5.50 [3.69, 8.20] |
|
| 29.1 at 1 to 5 weeks | 4 | 451 | Odds Ratio (M‐H, Random, 95% CI) | 2.36 [0.97, 5.76] |
| 29.2 at 6 to 12 weeks | 9 | 1239 | Odds Ratio (M‐H, Random, 95% CI) | 7.20 [5.10, 10.17] |
| 30 Side effects ‐ central nervous: tremor Show forest plot | 10 | 1230 | Odds Ratio (M‐H, Random, 95% CI) | 5.68 [3.19, 10.10] |
|
| 30.1 at 1 to 5 weeks | 3 | 241 | Odds Ratio (M‐H, Random, 95% CI) | 2.49 [0.92, 6.71] |
| 30.2 at 6 to 12 weeks | 7 | 989 | Odds Ratio (M‐H, Random, 95% CI) | 8.38 [4.42, 15.89] |
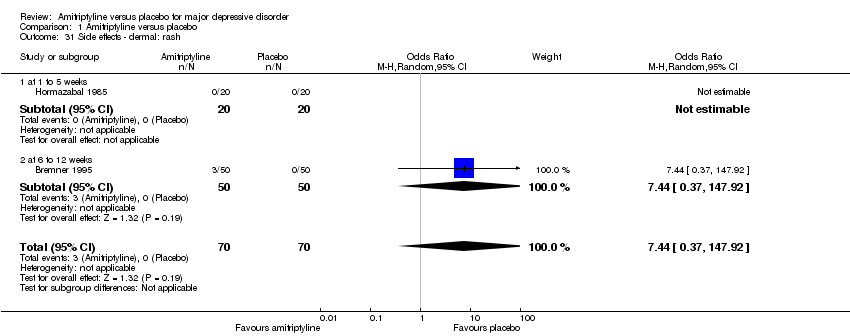
| 31 Side effects ‐ dermal: rash Show forest plot | 2 | 140 | Odds Ratio (M‐H, Random, 95% CI) | 7.44 [0.37, 147.92] |
|
| 31.1 at 1 to 5 weeks | 1 | 40 | Odds Ratio (M‐H, Random, 95% CI) | 0.0 [0.0, 0.0] |
| 31.2 at 6 to 12 weeks | 1 | 100 | Odds Ratio (M‐H, Random, 95% CI) | 7.44 [0.37, 147.92] |
| 32 Side effects ‐ dermal: sweating Show forest plot | 2 | 339 | Odds Ratio (M‐H, Random, 95% CI) | 1.82 [0.28, 12.00] |
|
| 32.1 at 1 to 5 weeks | 1 | 40 | Odds Ratio (M‐H, Random, 95% CI) | 8.2 [0.40, 169.90] |
| 32.2 at 6 to 12 weeks | 1 | 299 | Odds Ratio (M‐H, Random, 95% CI) | 1.01 [0.29, 3.55] |
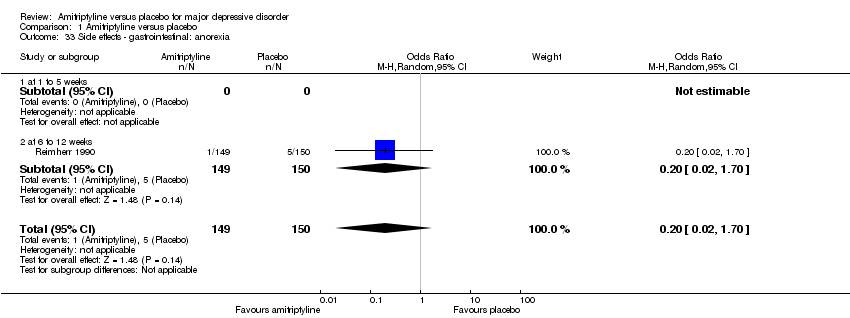
| 33 Side effects ‐ gastrointestinal: anorexia Show forest plot | 1 | 299 | Odds Ratio (M‐H, Random, 95% CI) | 0.20 [0.02, 1.70] |
|
| 33.1 at 1 to 5 weeks | 0 | 0 | Odds Ratio (M‐H, Random, 95% CI) | 0.0 [0.0, 0.0] |
| 33.2 at 6 to 12 weeks | 1 | 299 | Odds Ratio (M‐H, Random, 95% CI) | 0.20 [0.02, 1.70] |
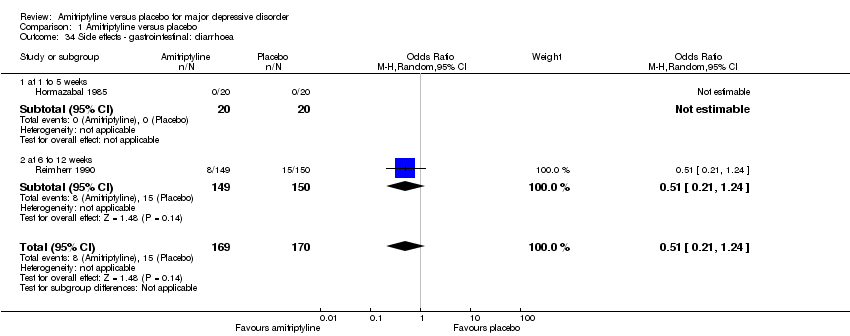
| 34 Side effects ‐ gastrointestinal: diarrhoea Show forest plot | 2 | 339 | Odds Ratio (M‐H, Random, 95% CI) | 0.51 [0.21, 1.24] |
|
| 34.1 at 1 to 5 weeks | 1 | 40 | Odds Ratio (M‐H, Random, 95% CI) | 0.0 [0.0, 0.0] |
| 34.2 at 6 to 12 weeks | 1 | 299 | Odds Ratio (M‐H, Random, 95% CI) | 0.51 [0.21, 1.24] |
| 35 Side effects ‐ gastrointestinal: dyspepsia Show forest plot | 5 | 859 | Odds Ratio (M‐H, Random, 95% CI) | 6.79 [2.49, 18.52] |
|
| 35.1 at 1 to 5 weeks | 0 | 0 | Odds Ratio (M‐H, Random, 95% CI) | 0.0 [0.0, 0.0] |
| 35.2 at 6 to 12 weeks | 5 | 859 | Odds Ratio (M‐H, Random, 95% CI) | 6.79 [2.49, 18.52] |
| 36 Side effects ‐ gastrointestinal: gastralgia Show forest plot | 2 | 172 | Odds Ratio (M‐H, Random, 95% CI) | 1.89 [0.82, 4.35] |
|
| 36.1 at 1 to 5 weeks | 1 | 58 | Odds Ratio (M‐H, Random, 95% CI) | 6.71 [0.34, 130.90] |
| 36.2 at 6 to 12 weeks | 1 | 114 | Odds Ratio (M‐H, Random, 95% CI) | 1.70 [0.71, 4.04] |
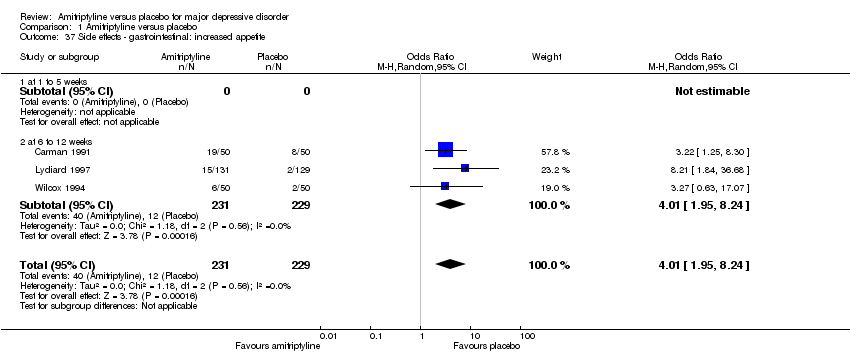
| 37 Side effects ‐ gastrointestinal: increased appetite Show forest plot | 3 | 460 | Odds Ratio (M‐H, Random, 95% CI) | 4.01 [1.95, 8.24] |
|
| 37.1 at 1 to 5 weeks | 0 | 0 | Odds Ratio (M‐H, Random, 95% CI) | 0.0 [0.0, 0.0] |
| 37.2 at 6 to 12 weeks | 3 | 460 | Odds Ratio (M‐H, Random, 95% CI) | 4.01 [1.95, 8.24] |
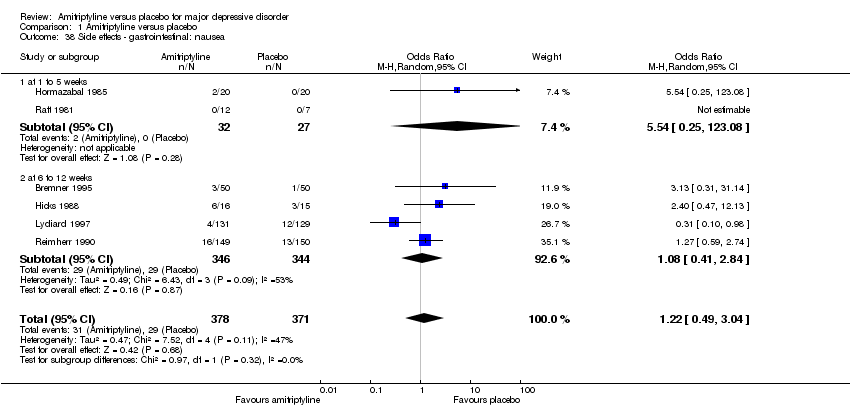
| 38 Side effects ‐ gastrointestinal: nausea Show forest plot | 6 | 749 | Odds Ratio (M‐H, Random, 95% CI) | 1.22 [0.49, 3.04] |
|
| 38.1 at 1 to 5 weeks | 2 | 59 | Odds Ratio (M‐H, Random, 95% CI) | 5.54 [0.25, 123.08] |
| 38.2 at 6 to 12 weeks | 4 | 690 | Odds Ratio (M‐H, Random, 95% CI) | 1.08 [0.41, 2.84] |
| 39 Side effects ‐ gastrointestinal: vomiting Show forest plot | 1 | 299 | Odds Ratio (M‐H, Random, 95% CI) | 1.01 [0.14, 7.24] |
|
| 39.1 at 1 to 5 weeks | 0 | 0 | Odds Ratio (M‐H, Random, 95% CI) | 0.0 [0.0, 0.0] |
| 39.2 at 6 to 12 weeks | 1 | 299 | Odds Ratio (M‐H, Random, 95% CI) | 1.01 [0.14, 7.24] |
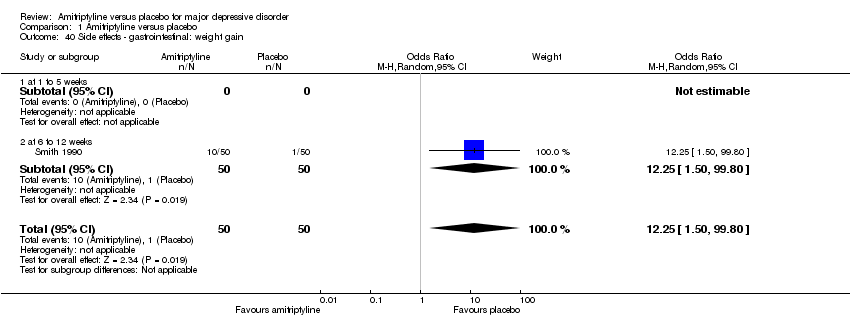
| 40 Side effects ‐ gastrointestinal: weight gain Show forest plot | 1 | 100 | Odds Ratio (M‐H, Random, 95% CI) | 12.25 [1.50, 99.80] |
|
| 40.1 at 1 to 5 weeks | 0 | 0 | Odds Ratio (M‐H, Random, 95% CI) | 0.0 [0.0, 0.0] |
| 40.2 at 6 to 12 weeks | 1 | 100 | Odds Ratio (M‐H, Random, 95% CI) | 12.25 [1.50, 99.80] |
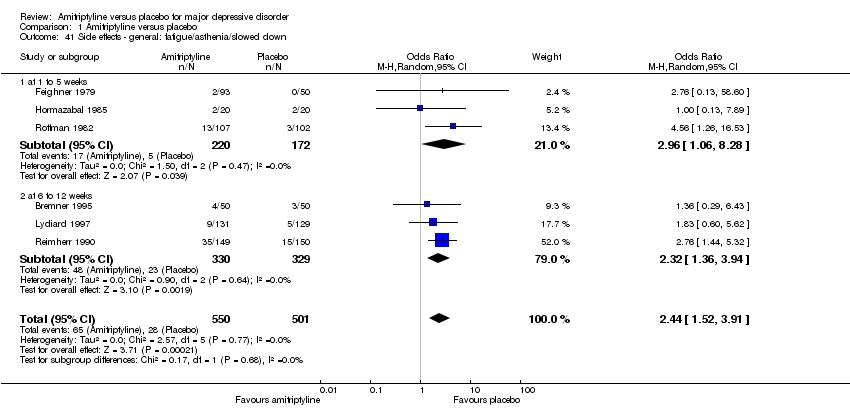
| 41 Side effects ‐ general: fatigue/asthenia/slowed down Show forest plot | 6 | 1051 | Odds Ratio (M‐H, Random, 95% CI) | 2.44 [1.52, 3.91] |
|
| 41.1 at 1 to 5 weeks | 3 | 392 | Odds Ratio (M‐H, Random, 95% CI) | 2.96 [1.06, 8.28] |
| 41.2 at 6 to 12 weeks | 3 | 659 | Odds Ratio (M‐H, Random, 95% CI) | 2.32 [1.36, 3.94] |
| 42 Side effects ‐ sexual: impotence Show forest plot | 1 | 100 | Odds Ratio (M‐H, Random, 95% CI) | 9.77 [0.51, 186.52] |
|
| 42.1 at 1 to 5 weeks | 0 | 0 | Odds Ratio (M‐H, Random, 95% CI) | 0.0 [0.0, 0.0] |
| 42.2 at 6 to 12 weeks | 1 | 100 | Odds Ratio (M‐H, Random, 95% CI) | 9.77 [0.51, 186.52] |
| 43 Side effects ‐ sexual: any sexual dysfunction Show forest plot | 2 | 442 | Odds Ratio (M‐H, Random, 95% CI) | 16.59 [4.54, 60.64] |
|
| 43.1 at 1 to 5 weeks | 1 | 143 | Odds Ratio (M‐H, Random, 95% CI) | 7.50 [0.41, 135.98] |
| 43.2 at 6 to 12 weeks | 1 | 299 | Odds Ratio (M‐H, Random, 95% CI) | 20.24 [4.75, 86.20] |
| 44 Subgroup analysis: industry sponsored ‐ response to treatment Show forest plot | 29 | 2903 | Odds Ratio (M‐H, Random, 95% CI) | 2.66 [2.28, 3.12] |
|
| 44.1 industry sponsored | 21 | 2427 | Odds Ratio (M‐H, Random, 95% CI) | 2.66 [2.25, 3.15] |
| 44.2 not industry sponsored | 8 | 476 | Odds Ratio (M‐H, Random, 95% CI) | 2.68 [1.77, 4.05] |
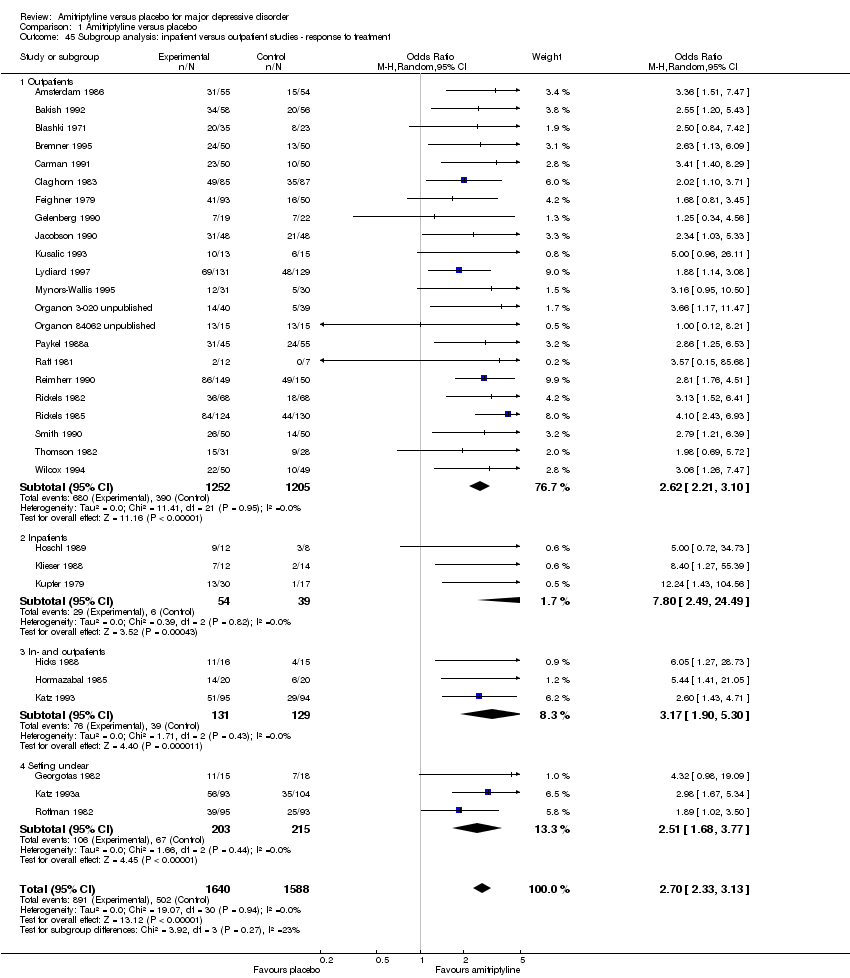
| 45 Subgroup analysis: inpatient versus outpatient studies ‐ response to treatment Show forest plot | 31 | 3228 | Odds Ratio (M‐H, Random, 95% CI) | 2.70 [2.33, 3.13] |
|
| 45.1 Outpatients | 22 | 2457 | Odds Ratio (M‐H, Random, 95% CI) | 2.62 [2.21, 3.10] |
| 45.2 Inpatients | 3 | 93 | Odds Ratio (M‐H, Random, 95% CI) | 7.80 [2.49, 24.49] |
| 45.3 In‐ and outpatients | 3 | 260 | Odds Ratio (M‐H, Random, 95% CI) | 3.17 [1.90, 5.30] |
| 45.4 Setting unclear | 3 | 418 | Odds Ratio (M‐H, Random, 95% CI) | 2.51 [1.68, 3.77] |
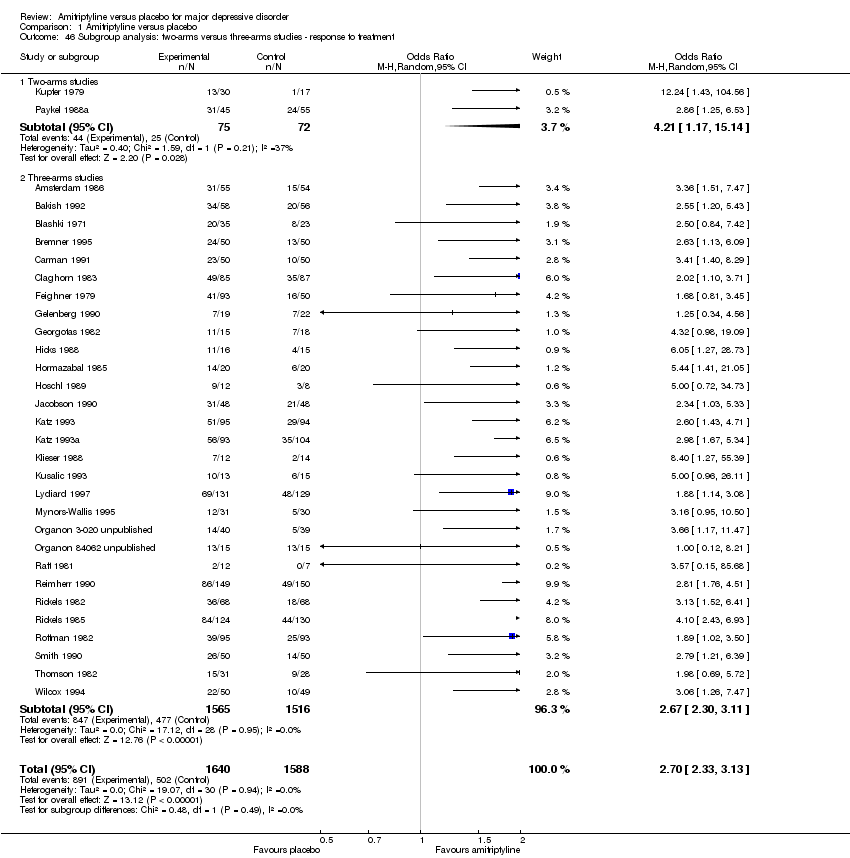
| 46 Subgroup analysis: two‐arms versus three‐arms studies ‐ response to treatment Show forest plot | 31 | 3228 | Odds Ratio (M‐H, Random, 95% CI) | 2.70 [2.33, 3.13] |
|
| 46.1 Two‐arms studies | 2 | 147 | Odds Ratio (M‐H, Random, 95% CI) | 4.21 [1.17, 15.14] |
| 46.2 Three‐arms studies | 29 | 3081 | Odds Ratio (M‐H, Random, 95% CI) | 2.67 [2.30, 3.11] |
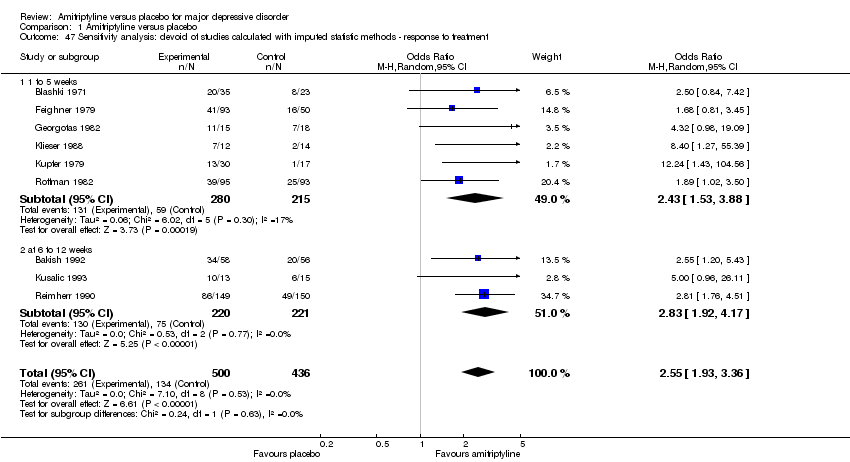
| 47 Sensitivity analysis: devoid of studies calculated with imputed statistic methods ‐ response to treatment Show forest plot | 9 | 936 | Odds Ratio (M‐H, Random, 95% CI) | 2.55 [1.93, 3.36] |
|
| 47.1 1 to 5 weeks | 6 | 495 | Odds Ratio (M‐H, Random, 95% CI) | 2.43 [1.53, 3.88] |
| 47.2 at 6 to 12 weeks | 3 | 441 | Odds Ratio (M‐H, Random, 95% CI) | 2.83 [1.92, 4.17] |
| 48 Sensitivity analysis: fixed instead of random‐effects model ‐ response to treatment Show forest plot | 31 | 3228 | Odds Ratio (M‐H, Fixed, 95% CI) | 2.71 [2.34, 3.14] |
|
| 48.1 at 1 to 5 weeks | 13 | 1241 | Odds Ratio (M‐H, Fixed, 95% CI) | 2.62 [2.07, 3.33] |
| 48.2 at 6 to 12 weeks | 18 | 1987 | Odds Ratio (M‐H, Fixed, 95% CI) | 2.77 [2.30, 3.34] |