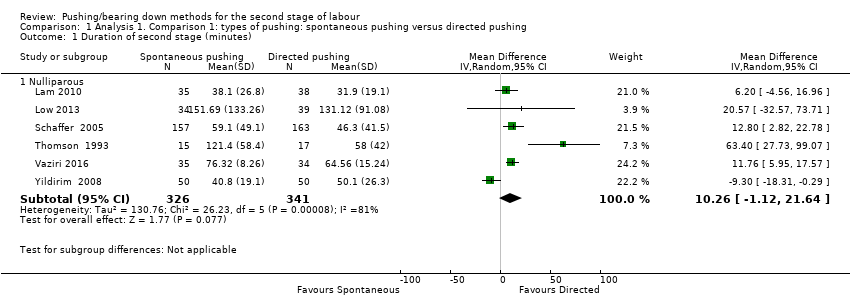
| 1 Duration of second stage (minutes) Show forest plot | 11 | 3049 | Mean Difference (IV, Random, 95% CI) | 56.40 [42.05, 70.76] |
|
| 1.1 Nulliparous | 10 | 2885 | Mean Difference (IV, Random, 95% CI) | 56.12 [39.29, 72.96] |
| 1.2 Multiparous | 1 | 123 | Mean Difference (IV, Random, 95% CI) | 38.80 [29.16, 48.44] |
| 1.3 Mixed parity | 1 | 41 | Mean Difference (IV, Random, 95% CI) | 91.0 [50.37, 131.63] |
| 2 Perineal Laceration (3rd or 4th degree) Show forest plot | 7 | 2775 | Risk Ratio (M‐H, Fixed, 95% CI) | 0.94 [0.78, 1.14] |
|
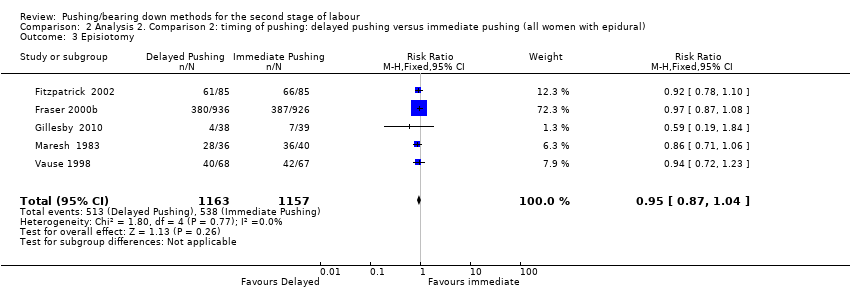
| 3 Episiotomy Show forest plot | 5 | 2320 | Risk Ratio (M‐H, Fixed, 95% CI) | 0.95 [0.87, 1.04] |
|
| 4 Admission to neonatal intensive care Show forest plot | 3 | 2197 | Risk Ratio (M‐H, Fixed, 95% CI) | 0.98 [0.67, 1.41] |
|
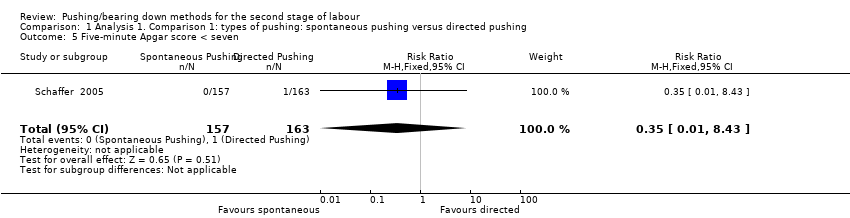
| 5 Five‐minute Apgar score < seven Show forest plot | 3 | 413 | Risk Ratio (M‐H, Fixed, 95% CI) | 0.15 [0.01, 3.00] |
|
| 6 Duration of pushing (minutes) Show forest plot | 11 | 2932 | Mean Difference (IV, Random, 95% CI) | ‐19.05 [‐32.27, ‐5.83] |
|
| 6.1 Nulliparous | 10 | 2768 | Mean Difference (IV, Random, 95% CI) | ‐21.30 [‐36.87, ‐5.73] |
| 6.2 Multiparous | 1 | 123 | Mean Difference (IV, Random, 95% CI) | ‐11.35 [‐18.19, ‐4.51] |
| 6.3 Mixed parity | 1 | 41 | Mean Difference (IV, Random, 95% CI) | ‐2.0 [‐30.35, 26.35] |
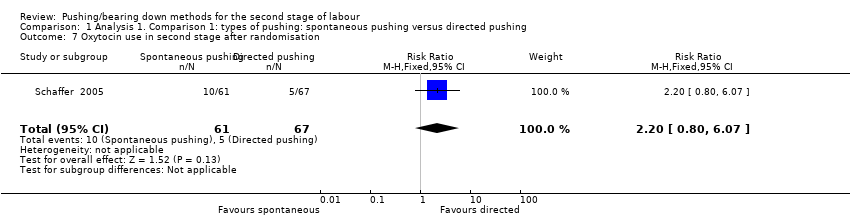
| 7 Oxytocin use in second stage after randomisation Show forest plot | 2 | 177 | Risk Ratio (M‐H, Fixed, 95% CI) | 1.00 [0.79, 1.27] |
|
| 8 Spontaneous vaginal delivery Show forest plot | 12 | 3114 | Risk Ratio (M‐H, Fixed, 95% CI) | 1.07 [1.02, 1.11] |
|
| 8.1 Nulliparous | 11 | 2953 | Risk Ratio (M‐H, Fixed, 95% CI) | 1.07 [1.03, 1.12] |
| 8.2 Multiparous | 1 | 120 | Risk Ratio (M‐H, Fixed, 95% CI) | 1.11 [1.00, 1.24] |
| 8.3 Mixed parity | 1 | 41 | Risk Ratio (M‐H, Fixed, 95% CI) | 0.47 [0.22, 1.03] |
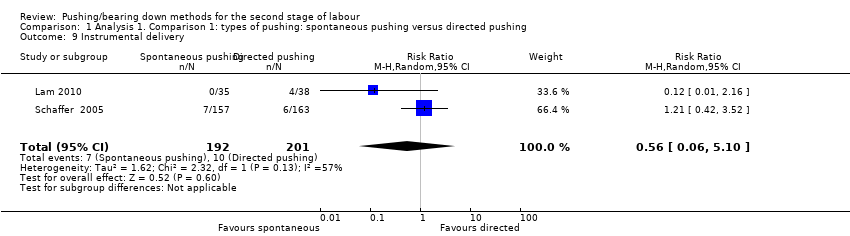
| 9 Instrumental delivery Show forest plot | 10 | 3007 | Risk Ratio (M‐H, Random, 95% CI) | 0.89 [0.74, 1.07] |
|
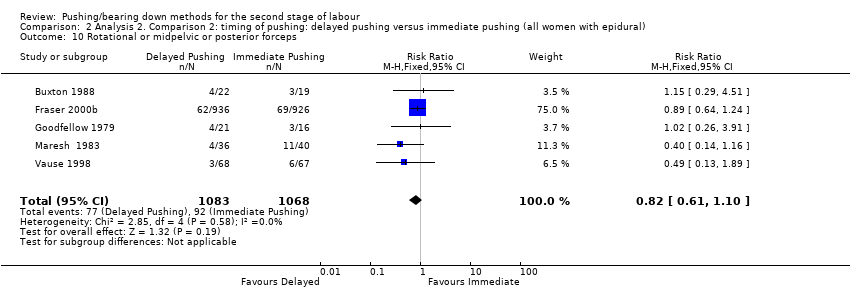
| 10 Rotational or midpelvic or posterior forceps Show forest plot | 5 | 2151 | Risk Ratio (M‐H, Fixed, 95% CI) | 0.82 [0.61, 1.10] |
|
| 11 Caesarean delivery Show forest plot | 9 | 2783 | Risk Ratio (M‐H, Fixed, 95% CI) | 0.83 [0.65, 1.05] |
|
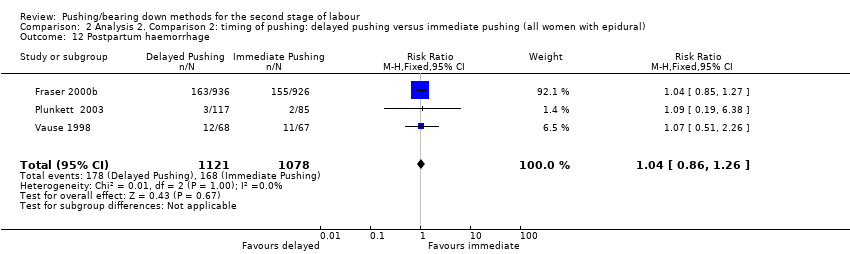
| 12 Postpartum haemorrhage Show forest plot | 3 | 2199 | Risk Ratio (M‐H, Fixed, 95% CI) | 1.04 [0.86, 1.26] |
|
| 13 Fatigue after delivery Show forest plot | 1 | 73 | Mean Difference (IV, Fixed, 95% CI) | ‐6.40 [‐21.00, 8.20] |
|
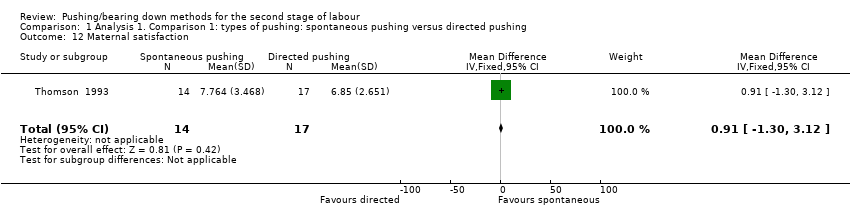
| 14 Maternal satisfaction Show forest plot | 1 | 73 | Mean Difference (IV, Fixed, 95% CI) | 0.40 [‐7.34, 8.14] |
|
| 15 Dyspareunia Show forest plot | 1 | 162 | Risk Ratio (M‐H, Fixed, 95% CI) | 1.15 [0.63, 2.10] |
|
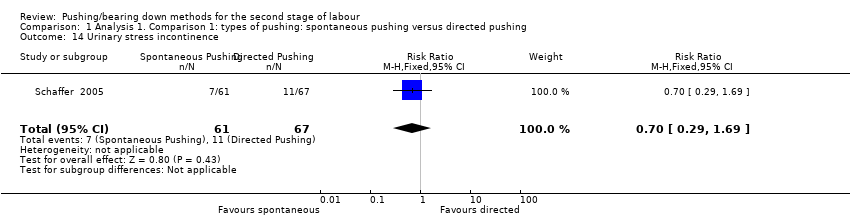
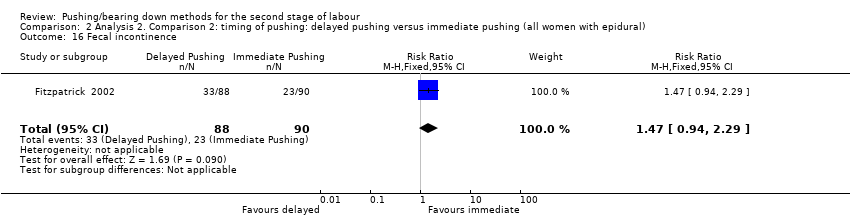
| 16 Fecal incontinence Show forest plot | 1 | 178 | Risk Ratio (M‐H, Fixed, 95% CI) | 1.47 [0.94, 2.29] |
|
| 17 Low umbilical cord pH Show forest plot | 4 | 2145 | Risk Ratio (M‐H, Fixed, 95% CI) | 2.24 [1.37, 3.68] |
|
| 17.1 Arterial umbilical cord pH < 7.2 | 2 | 244 | Risk Ratio (M‐H, Fixed, 95% CI) | 1.84 [0.55, 6.16] |
| 17.2 Venous umbilical cord pH < 7.3 | 1 | 41 | Risk Ratio (M‐H, Fixed, 95% CI) | 1.70 [0.44, 6.66] |
| 17.3 Arterial < 7.2 and/or venous < 7.3 umbilical cord pH | 1 | 1860 | Risk Ratio (M‐H, Fixed, 95% CI) | 2.45 [1.35, 4.43] |
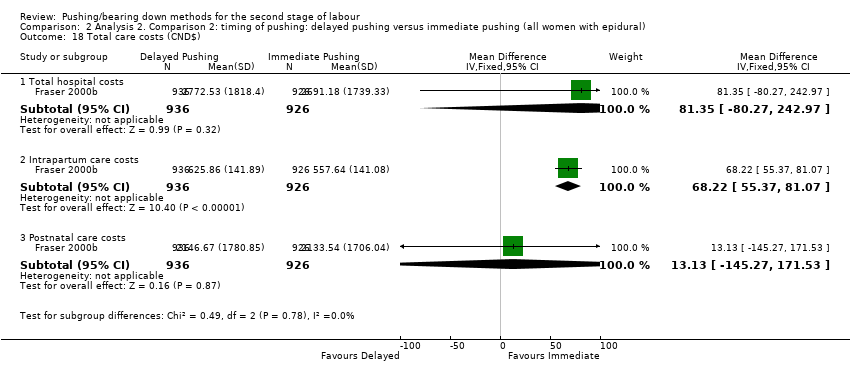
| 18 Total care costs (CND$) Show forest plot | 1 | | Mean Difference (IV, Fixed, 95% CI) | Subtotals only |
|
| 18.1 Total hospital costs | 1 | 1862 | Mean Difference (IV, Fixed, 95% CI) | 81.35 [‐80.27, 242.97] |
| 18.2 Intrapartum care costs | 1 | 1862 | Mean Difference (IV, Fixed, 95% CI) | 68.22 [55.37, 81.07] |
| 18.3 Postnatal care costs | 1 | 1862 | Mean Difference (IV, Fixed, 95% CI) | 13.13 [‐145.27, 171.53] |
| 19 Sensitivity analysis (trial quality): Duration of second stage (minutes) Show forest plot | 10 | 2973 | Mean Difference (IV, Random, 95% CI) | 53.46 [38.82, 68.10] |
|
| 19.1 Nulliparous | 9 | 2809 | Mean Difference (IV, Random, 95% CI) | 52.54 [35.14, 69.93] |
| 19.2 Multiparous | 1 | 123 | Mean Difference (IV, Random, 95% CI) | 38.80 [29.16, 48.44] |
| 19.3 Mixed parity | 1 | 41 | Mean Difference (IV, Random, 95% CI) | 91.0 [50.37, 131.63] |
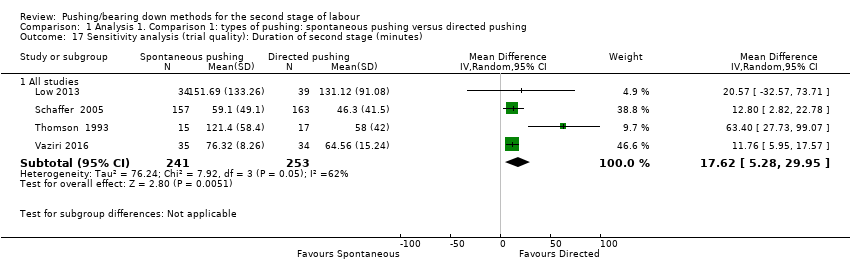
| 20 Sensitivity analysis (trial quality): Duration of pushing (minutes) Show forest plot | 10 | 2856 | Mean Difference (IV, Random, 95% CI) | ‐21.30 [‐34.97, ‐7.63] |
|
| 20.1 Nulliparous | 9 | 2692 | Mean Difference (IV, Random, 95% CI) | ‐24.25 [‐40.43, ‐8.07] |
| 20.2 Multiparous | 1 | 123 | Mean Difference (IV, Random, 95% CI) | ‐11.35 [‐18.19, ‐4.51] |
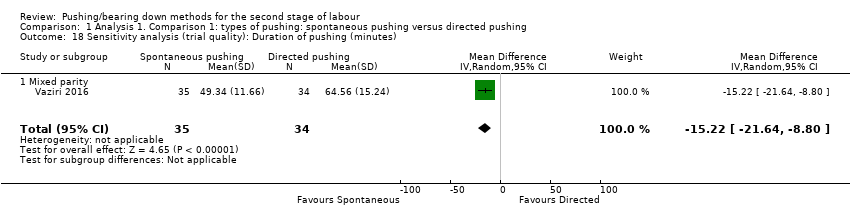
| 20.3 Mixed parity | 1 | 41 | Mean Difference (IV, Random, 95% CI) | ‐2.0 [‐30.35, 26.35] |
| 21 Sensitivity analysis (median and IQR): Duration of second stage (minutes) Show forest plot | 7 | 684 | Mean Difference (IV, Random, 95% CI) | 56.48 [34.24, 78.72] |
|
| 21.1 Nulliparous | 6 | 520 | Mean Difference (IV, Random, 95% CI) | 55.17 [25.33, 85.01] |
| 21.2 Multiparous | 1 | 123 | Mean Difference (IV, Random, 95% CI) | 38.80 [29.16, 48.44] |
| 21.3 Mixed parity | 1 | 41 | Mean Difference (IV, Random, 95% CI) | 91.0 [50.37, 131.63] |
| 22 Sensitivity analysis (median and IQR): Duration of pushing (minutes) Show forest plot | 6 | 531 | Mean Difference (IV, Random, 95% CI) | ‐17.22 [‐28.92, ‐5.52] |
|
| 22.1 Nulliparous | 5 | 367 | Mean Difference (IV, Random, 95% CI) | ‐22.51 [‐41.53, ‐3.50] |
| 22.2 Multiparous | 1 | 123 | Mean Difference (IV, Random, 95% CI) | ‐11.35 [‐18.19, ‐4.51] |
| 22.3 Mixed parity | 1 | 41 | Mean Difference (IV, Random, 95% CI) | ‐2.0 [‐30.35, 26.35] |