分娩第二阶段向下推动的方法
Abstract
研究背景
在第二阶段的分娩过程中,产妇的推动是对子宫收缩所产生的无意识的驱逐力的一个重要而不可缺少的帮助。对促进这些分娩的理想策略尚无共识,并且对母亲和胎儿的影响存在矛盾。
研究目的
在分娩后产妇及胎儿的结局中,我们需要评估关于产妇推动、呼吸的各种技术其优点及可能的缺点。
检索策略
我们检索了Cochrane妊娠和分娩试验登记册(2016年9月19日)和研究的参考文献目录。
标准/纳入排除标准
在分娩第二阶段期间,针对孕产妇和新生儿的结局,随机对照试验(RCTs)和半随机对照试验评估了推压技术(类型和/或时间)的影响。整群随机对照试验均符合纳入标准,但没有被发现。使用交叉设计的研究和那些仅以摘要形式发表的研究不符合纳入这个系统综述的标准。
数据收集与分析
两名评价者独立进行试验纳入和数据提取的评估,以及偏倚风险评估。为确保准确性对数据进行了核查。
主要结果
在这次更新的系统综述中,我们一共纳入21项研究,其中8项研究(884名妇女)比较了自发推动与有或没有硬膜外镇痛的定向推动,13项研究(2879名妇女)比较了延迟推动与有硬膜外镇痛的即时推动。我们对证据的等级评估范围从中等到非常低质量;下降的主要原因是研究设计的局限性和不精确性的影响估计。总的来说,所纳入进来的研究在偏差风险方面各不相同,其中大部分被判定为偏倚风险不确定。
比较一:推动类型:自发推动与定向推动
分娩第二阶段的持续时间没有明显差异(平均差(MD)10.26分钟;95%置信区间(CI)为1.12至21.64分钟,六项研究,667名妇女,随机效应,I²=81%)(非常低质量证据)。在第三或第四度会阴裂伤上无明显差异(风险比(RR)0.87;95%CI为0.45至1.66,一项研究,320名妇女)(低质量证据),会阴切开术(平均RR 1.05;95%CI为0.60至1.85,两项研究,420名妇女,随机效应,I²=81%),推动的持续时间(MD 9.76分钟,95%CI为0.02至19.54;两项研究;169名妇女;I²=88%)(非常低质量证据),或自然分娩率(RR 1.01,95%CI为0.97到1.05;五项研究;688名妇女;I²=2%)(中等质量证据)。对于原发性新生儿结局,如5分钟阿普加评分低于7分,组间无明显差异(RR 0.35;95%CI为0.01至8.43,1项研究,320名婴儿)(非常低质量证据),且在自发推动和定向推动中,新生儿重症监护病例数(RR 1.08;95%CI为0.30至3.79,两项研究,393例婴儿)(非常低质量证据)也无明显差异。没有关于缺氧缺血性脑病的资料。
比较2:推动时间:延迟推动与立即推动(所有妇女硬膜外)
对于主要的孕产妇结局,延迟推动与在分娩第二阶段持续时间增加56分钟相关(MD 56.40,95%CI为42.05至70.76;11项研究;3049名妇女;I²=91%)(非常低质量证据),但在第三或第四度会阴裂伤方面没有明显差异(RR 0.94;95%CI为0.78至1.14,七项研究2775名妇女)(中等质量证据)或外阴切开术(RR 0.95;95%CI为0.87至1.04,五项研究,2320名妇女)。延迟推动也与推动持续时间缩短19分钟(MD 19.05,95%CI为5.83‐32.27;11项研究;2932名妇女;I²=95%)(非常低质量证据)和自然分娩增加相关(RR 1.07;95%CI为1.02‐1.11,12项研究,3114名妇女)(中等质量证据)。
对于原发性新生儿结局,在入组新生儿重症监护组(RR 0.98;95%CI为0.67至1.41,三项研究,n=2197)(低质量证据)和5分钟阿普加评分低于7分中,组间无明显差异(RR 0.15;95%CI为0.01至3.00;3项研究;413名婴儿)(非常低质量证据)。没有关于缺氧缺血性脑病的资料。延迟推动与低脐血液pH值的较高发生率相关(RR 2.24;95%CI为1.37至3.68,4项研究,2145名婴儿),并且通过CDN提高产后护理费用68.22美元(MD 68.22,95%CI为55.37至81.07,一项研究,1862名妇女)。
作者结论
这项更新的系统综述是基于21项包括中度至非常低质量证据等级的研究(由于研究设计限制和效应估计不精确而主要降级的证据)。
硬膜外麻醉推动的时间是一致的,即延迟推动导致实际推动时间缩短,并且在分娩第二阶段的更长持续时间中,自然分娩机会增加,和低脐带pH值的风险增加(仅基于一项研究)。然而,在延迟和即时推动之间,严重的会阴撕裂和外阴切开术以及其他新生儿结局(入院新生儿重症监护,5分钟阿普加评分低于7分和分娩室复苏)没有明显差异。
因此,对于推动类型,有或没有硬膜外麻醉,都没有确凿证据支持或反驳任何一种推动类型作为常规临床实践的一部分,而且在没有强有力的证据支持某种推动类型或推动时间时,妇女的偏好和舒适度以及临床背景应作为指导决策。
为进一步的完善随机对照试验设计,解决临床上重要的孕产妇和新生儿结局,需要我们将以证据为基础的信息添加到当前知识体系中去。这些试验将为本次系统综述以后的更新,提供更完整的资料。
PICO
Plain language summary
分娩第二阶段向下推动的方法
问题是什么?
在分娩的第二阶段过程中,一个普遍的做法就是鼓励妇女在子宫开始收缩时做深呼吸,然后在子宫收缩过程中,继续深呼吸并用力产出胎儿(这就是所谓的“定向推动”)。在自发推动下,妇女可以自由地跟着自己的直觉,一般子宫每收缩一次,推动3到5次。除非有不可抗拒因素或者当婴儿的先露部下降到会阴时,才需要推动,延迟推动会涉及指导妇女以避免推动。
为什么这个问题很重要?
在分娩后的产妇及胎儿结局中,我们需要了解到关于产妇推动、呼吸的各种技术其优点及可能的缺点。
我们发现了什么证据?
我们检索证据(检索时间为2016年9月19日)且经鉴定有8组试验(884名妇女)比较了推动的类型:自发推动与使用或未使用硬膜外镇痛的定向推动,和13组试验(2879名妇女)比较了推动时间:延迟推动与使用或未使用硬膜外镇痛的即时推动。这一项更新的系统综述的证据质量处于中等到非常低的范围。
比较一:自发推动与定向推动
对于推压类型(自发推动与定向推动),在自发推动的妇女和定向推动的妇女之间,第二阶段的持续时间(非常低质量证据),会阴撕裂(低质量证据),外阴切开术,推压所花费时间(非常低质量证据),或自发性阴道分娩妇女的数量(中等质量证据)均无明显差异。关于婴儿的结果(如五分钟阿普加评分低于7分(非常低质量证据),进入新生儿重症监护(非常低质量证据))均无明显差异。所有的研究都没有报道低氧缺血性脑病婴儿的结局。
比较2:延迟推动与即时推动(妇女硬膜外麻醉)
对于推动时间:延迟推动与即时推动(所有妇女硬膜外麻醉)延迟推动与分娩第二阶段持续时间增加约56分钟相关(非常低质量证据)。这两组在会阴撕裂(中等质量证据)据切开术方面没有明显差异。延迟推动减少了约19分钟的推动持续时间(非常低质量证据),并且略微增加了自发阴道分娩妇女人数(中等质量证据)。就婴儿的重要结局而言,延迟和即时推动组之间没有明显差异:五分钟阿普加评分低于7分(非常低质量证据),进入新生儿重症监护(低质量证据)。所有的研究都没有报告婴儿大脑因缺氧造成大脑损伤的结局。此外,延迟推动与低脐带pH发病率的增加相关,并通过CDN增加68.22美元的产后保健成本。
这是什么意思?
我们无法说自发推动或定向推动方法哪种最好。在进一步高质量的研究出来之前,还是应该鼓励妇女按照自己的舒适和偏好选择推动方式,产出胎儿。
对硬膜外麻醉妇女进行延迟推动可以减少分娩推动时间,而且会增加自然分娩的可能性。然而,它增加了分娩第二阶段的持续时间。在重要的新生儿结局和产妇阴道损伤方面,其可能影响仍不明确。因此,一旦没有确凿证据表明在临床实践中使用适当的推动方式,这些证据仍不够充分可信的支持任何具体推动时间和推动方式。
还需要进一步精心设计的随机对照试验,以产生更多以证据为基础的信息。这些试验应该解决临床上重要的孕产妇和新生儿结局,为本次系统综述以后的更新,提供更完整的资料。
Authors' conclusions
Summary of findings
| Spontaneous pushing compared to directed pushing for the second stage of labour (types of pushing) | ||||||
| Patient or population: women in the second stage of labour | ||||||
| Outcomes | Anticipated absolute effects* (95% CI) | Relative effect | № of participants | Quality of the evidence | Comments | |
| Risk with directed pushing | Risk with spontaneous pushing | |||||
| Duration of second stage (minutes) | The mean duration of second stage (minutes) was 0 | MD 10.26 higher | ‐ | 667 | ⊕⊝⊝⊝ | |
| Perineal laceration (3rd or 4th degree) | Study population | RR 0.87 | 320 | ⊕⊕⊝⊝ | ||
| 110 per 1000 | 96 per 1000 | |||||
| Admission to neonatal intensive care | Study population | RR 1.08 | 393 | ⊕⊝⊝⊝ | ||
| 20 per 1000 | 21 per 1000 | |||||
| Hypoxic ischaemic encephalopathy | Study population | ‐ | (0 study) | ‐ | Outcome not reported in the included studies under this comparison. | |
| see comment | see comment | |||||
| 5‐minute Apgar score < 7 | Study population | RR 0.35 | 320 | ⊕⊝⊝⊝ | ||
| 6 per 1000 | 2 per 1000 | |||||
| Duration of pushing (minutes) | The mean duration of pushing (minutes) was 0 | MD 9.76 lower | ‐ | 169 | ⊕⊝⊝⊝ | |
| Spontaneous vaginal delivery | Study population | RR 1.01 | 688 | ⊕⊕⊕⊝ | ||
| 922 per 1000 | 932 per 1000 | |||||
| *The risk in the intervention group (and its 95% confidence interval) is based on the assumed risk in the comparison group and the relative effect of the intervention (and its 95% CI). | ||||||
| GRADE Working Group grades of evidence | ||||||
| 1 Most studies contributing data had design limitations, with more than 40% of weight from studies with serious design limitations. (‐2) 2 Statistical Heterogeneity (I2>60%). Variation in size of effect. (‐1) 3 Wide confidence intervals crossing the line of no effect. (‐1) 4 One study with design limitations. (‐1) 5 Wide confidence intervals crossing the line of no effect and few events. (‐2) 6 One study contributing >40% of data had serious design limitations. One other study had design limitations. (‐2) 7 Wide confidence intervals just crossing the line of no effect and small sample size. (‐2) 8 Study contributing most data (46.9%) has design limitations, other studies have design limitations or serious design limitations. (‐1) 9 Although confidence intervals cross the line of no effect, the effect estimate is precise. (not downgraded) | ||||||
| Delayed pushing compared to immediate pushing (all women with epidural) for the second stage of labour (timing of pushing) | ||||||
| Patient or population: women in the second stage of labour with epidural in situ | ||||||
| Outcomes | Anticipated absolute effects* (95% CI) | Relative effect | № of participants | Quality of the evidence | Comments | |
| Risk with immediate pushing (all women with epidural) | Risk with delayed pushing | |||||
| Duration of second stage (minutes) | The mean duration of second stage (minutes) was 0 | MD 56.40 higher | ‐ | 3049 | ⊕⊝⊝⊝ | 1 trial contributing data for multiparous women, 1 trial included both nulliparous and multiparous women. |
| Perineal laceration (3rd or 4th degree) | Study population | RR 0.94 | 2775 | ⊕⊕⊕⊝ | 1 of the studies contributing data reported all lacerations (i.e. did not specify 3rd or 4th degree) | |
| 122 per 1000 | 115 per 1000 | |||||
| Admission to neonatal intensive care | Study population | RR 0.98 | 2197 | ⊕⊕⊝⊝ | ||
| 49 per 1000 | 48 per 1000 | |||||
| Hypoxic ischaemic encephalopathy | Study population | ‐ | (0 study) | ‐ | Outcome not reported in the included studies under this comparison. | |
| see comment | see comment | |||||
| 5‐minute Apgar score < 7 | Study population | RR 0.15 | 413 | ⊕⊝⊝⊝ | Only 1 trial contributing data. | |
| 10 per 1000 | 2 per 1000 | |||||
| Duration of pushing (minutes) | The mean duration of pushing (minutes) was 0 | MD 19.05 lower | ‐ | 2932 | ⊕⊝⊝⊝ | 1 trial contributing data for multiparous women, 1 trial included both nulliparous and multiparous women. |
| Spontaneous vaginal delivery | Study population | RR 1.07 | 3114 | ⊕⊕⊕⊝ | ||
| 713 per 1000 | 762 per 1000 | |||||
| *The risk in the intervention group (and its 95% confidence interval) is based on the assumed risk in the comparison group and the relative effect of the intervention (and its 95% CI). | ||||||
| GRADE Working Group grades of evidence | ||||||
| 1 All studies have design limitations, two studies contributing <40% have serious design limitations. (‐1) 2 Heterogeneity (I2>60%). Considerable variation in size of effect. (‐2) 3 Although confidence intervals cross the line of no effect, the effect estimate is precise. (not downgraded) 4 All studies have design limitations. (‐1) 5 Wide confidence intervals crossing the line of no effect. (‐1) 6 One study contributing data has design limitations. (‐1) 7 Wide confidence intervals crossing the line of no effect and very few events. (‐2) | ||||||
Background
Description of the condition
The pattern of breathing that helps women during vaginal labour, especially during the second stage, is a controversial topic in the literature (Beynon 1957; Bloom 2006). Breathing, which is normally an unconscious act, becomes a voluntary and controlled activity induced by the physiological mechanisms of labour.
During the second stage of labour, the fetal presentation comes down and a compression occurs in both the bladder and rectum, generating a reflex which causes a strong urge to bear down, or 'push'. Therefore, the combination of involuntary intrauterine contractions and voluntary expulsive effort, through the abdominal and respiratory muscles, will help fetus delivery (Cunningham 2005). Arbitrarily directing women on how to push or bear down (both terms used) once the cervix is fully dilated is still a common practice (Buhimschi 2002; Thompson 1995).
Description of the intervention
A common technique is to encourage women to use a closed‐glottis pushing (holding breath while pushing) duration of 10 seconds or more, once the cervix has reached 10 cm dilation (Roberts 2002; Yeates 1984). In this procedure, women are coached to take a deep breath at the beginning of a contraction, then hold the breath as long and hard as possible and bear down towards the vagina throughout the contraction (Parnell 1993).
The process of taking a deep breath and holding it with a closed‐glottis is called the Valsalva Maneuver (VM). Several physiological findings oppose the use of the VM of 10 seconds or more, as this type of directed pushing can negatively affect fetal acid‐base balance, Apgar scores and cerebral oxygenation. It can also interfere with the length of the second stage of labour, increase maternal fatigue, cause damage to the maternal pelvic floor structures and impair bladder function (Aldrich 1995; Barnett 1982; Caldeyro‐Barcia 1981; Mayberry 1999; Schaffer 2005; Yildirim 2008).
In contrast, some authors argue that breathing control interventions should not be imposed during the expulsive stage, and that rather than follow direct instructions for the VM, women should be free to follow their own instincts in response to the physiology of this stage in labour (Beynon 1957; Caldeyro‐Barcia 1981; Minato 2001; Roberts 1996). This approach is known as ‘spontaneous or involuntary pushing’ and most of the respiratory effort to help in this type of bearing down occurs with an open glottis (with only about 25% of the breaths carried out using the VM, or closed glottis, and only for a maximum duration of four to six seconds) (Aderhold 1991; Hanson 2009; Roberts 1987). Additionally, women who use spontaneous pushing begin at a resting respiratory volume, push three to five times per contraction and take several breaths between each bearing down effort (Roberts 1987; Yeates 1984). Spontaneous pushing occurs as a result of optimal obstetric conditions for fetal descent which includes fetal station of at least +1 and fetal position (approaching occipito anterior position). This condition evokes the Ferguson's reflex, through increased oxytocin release, which augments maternal bearing down efforts by making them more effective and less fatiguing (Roberts 2002).
The same uncertainty occurs in relation to the second‐stage labour care of women with epidural anaesthesia. The usual practice is to begin encouraging the mother to bear down when the cervix is fully dilated, known as 'early, active or immediate pushing' (Hansen 2002; Maresh 1983; Simpson 2005). However, it has been found that women who have epidural analgesia, for relieving the pain of labour and childbirth, show a weak desire to push due to a diminution of the bearing down reflex (Bates 1985; Thorp 1996). As a result, this interferes with the normal mechanisms of labour and leads to an increase in instrumental deliveries.
Since the 1980s, trials have proposed a 'delayed pushing' method in labours where epidural analgesia is used (Fraser 2000a; Lai 2009;Vause 1998). This method involves instructing women to avoid pushing either until there is an irresistible urge to push, or when the presenting part has descended to the perineum, and is also known as the 'passive descent or labouring down method' (Maresh 1983; Mayberry 1999). This method is associated with a number of benefits in terms of less maternal fatigue, perineal injury, fetal acidosis and a reduction in instrumental deliveries despite an increase in the length of the second stage (Albers 2007; Hansen 2002).
How the intervention might work
It has been suggested that spontaneous pushing allows a slower and controlled descent of the fetus and therefore a gradual stretching of the perineal muscles. This type of pushing may lead to less pressure on the anterior vaginal wall and on the cervical ligaments and connective tissue that support the vaginal walls, as it does not start until the fetus has already started to descend. When the expulsive effort begins before the desire to push, this effort causes a downward pressure on the vaginal wall, the bladder and the support structure in front of the fetal head, which may obstruct the descent of the fetus and contribute to a greater biomechanical misalignment (Beynon 1957; Knauth 1986; Roberts 2007). Thus spontaneous pushing tends to show better maternal perineal results in the short and long term (Schaffer 2005). In addition, spontaneous pushing provides less fatigue and better umbilical cord gasometrics values (Chang 2011; Yildirim 2008).
Those that propose delayed pushing suggest that delay in the onset of pushing would allow spontaneous descent and rotation of the fetal head, thereby maximising the efficiency of pushing efforts and reducing the risk of the parturient fatigue and instrumental delivery (Fraser 2000b; Minato 2001). Delayed pushing aims to reduce the adverse effects of epidural analgesia and facilitate the second stage of labour in those conditions (Hansen 2002; Roberts 2002).
Why it is important to do this review
The involuntary urge to bear down may occur before or after the recognition of complete cervical dilatation. Therefore, the time when the woman should begin to push will have a significant effect on both mother and fetus. However, there is no consensus in the literature about the optimal time for the woman to begin pushing or bearing down.
There are no data to support a policy of directed maternal pushing. Despite several publications showing the adverse maternal and fetal effects from the use of the sustained VM, this choice of method is still common practice worldwide, and the scientific evidence base supporting the recommendation of breathing control for the expulsive stage is scant.
This review will concentrate on all eligible studies using spontaneous versus directed pushing and delayed versus early pushing for bearing down during the second stage of labour, with and without analgesia.
Objectives
The objectives of this review are to determine the benefits and possible disadvantages of different kinds of techniques regarding maternal pushing/breathing during the expulsive stage of labour on maternal and fetal outcomes.
Methods
Criteria for considering studies for this review
Types of studies
Randomised controlled trials (RCTs) and quasi‐RCTs comparing different instructions regarding maternal pushing in the second stage of labour. Cluster‐RCTs were eligible for inclusion, but none were identified.
Studies using a cross‐over design and those published in abstract form only were not eligible for inclusion.
Types of participants
Low‐risk pregnant women during the second stage of labour with all of the following:
-
nulliparous or multiparous;
-
between 37 and 42 weeks' gestation;
-
vertex presentation;
-
alive fetus;
-
with or without epidural analgesia;
-
singleton pregnancy;
-
absence of intrapartal complications.
Types of interventions
Any kind of breathing/pushing techniques performed during the second stage of labour. We considered the following comparisons.
-
Timing of pushing: to compare pushing which begins as soon as full dilatation has been determined versus pushing which begins after the urge to push is felt.
-
Type of pushing: to compare pushing techniques that involve the Valsalva Maneuver (VM) versus all other pushing techniques.
Types of outcome measures
Primary outcomes
Maternal outcomes
-
Duration of the second stage of labour (as defined by trial author)
-
Perineal laceration (3rd or 4th degree)
-
Episiotomy
Neonatal outcomes
-
Admission to neonatal intensive care
-
Hypoxic ischaemic encephalopathy
-
Apgar scores (less than seven at five minutes)
Secondary outcomes
Maternal outcomes
-
Duration of pushing
-
Oxytocin use in second stage after randomisation
-
Mode of delivery (spontaneous vaginal delivery, instrumental delivery, rotational or midpelvic or posterior forceps, caesarean delivery)
-
Maternal hypertension (as defined by trial author)
-
Postpartum haemorrhage (as defined by trial author)
-
Maternal report of severe pain in second stage labour
-
Fatigue after delivery
-
Maternal satisfaction
Long‐term outcomes
-
Perineal pain (as defined by trial author)
-
Dyspareunia
-
Urinary incontinence (as defined by trial author)
-
Detrusor overactivity
-
Fecal incontinence (as defined by trial author)
-
Pelvic floor prolapse (as defined by trial author)
Neonatal outcomes
-
Low umbilical cord blood pH (arterial less than 7.2 and venous less than 7.3)
-
Delivery room resuscitation
Total care costs (as defined by trial author)
Search methods for identification of studies
The following methods section of this review is based on a standard template used by Cochrane Pregnancy and Childbirth.
Electronic searches
We searched Cochrane Pregnancy and Childbirth’s Trials Register by contacting their Information Specialist (19 September 2016).
The Register is a database containing over 22,000 reports of controlled trials in the field of pregnancy and childbirth. For full search methods used to populate Pregnancy and Childbirth’s Trials Register including the detailed search strategies for CENTRAL, MEDLINE, Embase and CINAHL; the list of handsearched journals and conference proceedings, and the list of journals reviewed via the current awareness service, please follow this link to the editorial information about the Cochrane Pregnancy and Childbirth in the Cochrane Library and select the ‘Specialized Register ’ section from the options on the left side of the screen.
Briefly, Cochrane Pregnancy and Childbirth’s Trials Register is maintained by their Information Specialist and contains trials identified from:
-
monthly searches of the Cochrane Central Register of Controlled Trials (CENTRAL);
-
weekly searches of MEDLINE (Ovid);
-
weekly searches of Embase (Ovid);
-
monthly searches of CINAHL (EBSCO);
-
handsearches of 30 journals and the proceedings of major conferences;
-
weekly current awareness alerts for a further 44 journals plus monthly BioMed Central email alerts.
Search results are screened by two people and the full text of all relevant trial reports identified through the searching activities described above is reviewed. Based on the intervention described, each trial report is assigned a number that corresponds to a specific Pregnancy and Childbirth review topic (or topics), and is then added to the Register. The Information Specialist searches the Register for each review using this topic number rather than keywords. This results in a more specific search set which has been fully accounted for in the relevant review sections (Included studies; Excluded studies; Ongoing studies).
Searching other resources
We searched the reference lists of retrieved studies.
We did not apply any language or date restrictions.
Data collection and analysis
For methods used in the previous version of this review, seeLemos 2015.
For this update, the following methods were used for assessing the seven reports that were identified as a result of the updated search plus the one report in the ongoing studies section of Lemos 2015.
The following methods section of this review is based on a standard template used by Cochrane Pregnancy and Childbirth.
Selection of studies
Two review authors (A Lemos and A Dornelas de Andrade) independently assessed for inclusion all the potential studies that were identified as a result of the search strategy. We resolved any disagreement through discussion and when required, we consulted a third review author (MMR Amorim).
Data extraction and management
We designed a form to extract data. For eligible studies, at least two review authors extracted the data using the agreed form. We resolved differences and discrepancies by discussion and when necessary we consulted a third review author. We entered data into Review Manager software (RevMan 2014) and checked them for accuracy. There was no blinding of authorship or results.
When information regarding any of the above was unclear, we attempted to contact authors of the original reports to provide further details.
Assessment of risk of bias in included studies
Two review authors independently assessed risk of bias for each study using the criteria outlined in the Cochrane Handbook for Systematic Reviews of Interventions (Higgins 2011).
(1) Sequence generation (checking for possible selection bias)
We described for each included study whether the method used to generate the allocation sequence was reported in sufficient detail to allow an assessment of whether it should produce comparable groups.
We assessed the method as:
-
low risk of bias (any truly random process, e.g. random number table; computer random number generator);
-
high risk of bias (any non‐random process, e.g. odd or even date of birth; hospital or clinic record number);
-
unclear risk of bias.
(2) Allocation concealment (checking for possible selection bias)
We described for each included study the method used to conceal allocation to interventions prior to assignment and assessed whether intervention allocation could have been foreseen in advance of, or during recruitment, or changed after assignment.
We assessed the methods as:
-
low risk of bias (e.g. telephone or central randomisation; consecutively numbered sealed opaque envelopes);
-
high risk of bias (open random allocation; unsealed or non‐opaque envelopes, alternation; date of birth);
-
unclear risk of bias.
(3) Blinding (checking for possible performance bias)
(3.1) Blinding of participants and personnel
We described for each included study the methods used, if any, to blind study participants and personnel from knowledge of which intervention a participant received. We considered that studies were at low risk of bias if they were blinded, or if we judged that the lack of blinding would be unlikely to affect results. We assessed blinding separately for different outcomes or classes of outcomes.
We assessed the methods as:
-
low, high or unclear risk of bias for participants;
-
low, high or unclear risk of bias for personnel.
(3.2) Blinding of outcome assessment (checking for possible detection bias)
We described for each included study the methods used, if any, to blind outcome assessors from knowledge of which intervention a participant received. We assessed blinding separately for different outcomes or classes of outcomes.
We assessed methods used to blind outcome assessment as:
-
low, high or unclear risk of bias.
(4) Incomplete outcome data (checking for possible attrition bias due to the amount, nature and handling of incomplete outcome data)
We described for each included study, and for each outcome or class of outcomes, the completeness of data including attrition and exclusions from the analysis. We stated whether attrition and exclusions were reported and the numbers included in the analysis at each stage (compared with the total randomised participants), reasons for attrition or exclusion where reported, and whether missing data were balanced across groups or were related to outcomes. Where sufficient information was reported, or could be supplied by the trial authors, we re‐included missing data in the analyses which we undertook.
We assessed methods as:
-
low risk of bias (20% or less missing data);
-
high risk of bias (e.g. more than 20% missing data; numbers or reasons for missing data imbalanced across groups; ‘as treated’ analysis done with substantial departure of intervention received from that assigned at randomisation);
-
unclear risk of bias.
(5) Selective reporting bias
We described for each included study how we investigated the possibility of selective outcome reporting bias and what we found.
We assessed the methods as:
-
low risk of bias (where it is clear that all of the study’s pre‐specified outcomes and all expected outcomes of interest to the review have been reported);
-
high risk of bias (where not all the study’s pre‐specified outcomes have been reported; one or more reported primary outcomes were not pre‐specified; outcomes of interest are reported incompletely and so cannot be used; study fails to include results of a key outcome that would have been expected to have been reported);
-
unclear risk of bias.
(6) Other bias (checking for bias due to problems not covered by (1) to (5) above)
We described for each included study any important concerns we have about other possible sources of bias.
We assessed whether each study was free of other problems that could put it at risk of bias:
-
low risk of other bias;
-
high risk of other bias;
-
unclear whether there is risk of other bias.
(7) Overall risk of bias
We made explicit judgements about whether studies were at high risk of bias, according to the criteria given in the Handbook (Higgins 2011). With reference to (1) to (6) above, we assessed the likely magnitude and direction of the bias and whether we considered it was likely to impact on the findings. We explored the impact of the level of bias through undertaking sensitivity analyses ‐ seeSensitivity analysis.
Assessment of the quality of the evidence using the GRADE approach
For this update, we assessed the quality of the evidence using the GRADE approach as outlined in the GRADE handbook in order to assess the quality of the body of evidence relating to the outcomes listed below for the main comparisons: types of pushing: spontaneous pushing versus directed pushing (with or without epidural analgesia) and timing of pushing: delayed pushing versus immediate pushing (all women with epidural).
The following outcomes were included in the 'Summary of findings´ tables' (summary of findings Table for the main comparison; summary of findings Table 2):
-
Duration of second stage (minutes)
-
Perineal laceration (3rd or 4th degree)
-
Admission to neonatal intensive care
-
Hypoxic ischaemic encephalopathy
-
Five‐minute Apgar score less than seven
-
Duration of pushing (minutes)
-
Spontaneous vaginal delivery
We used the GRADEpro Guideline Development Tool to import data from Review Manager 5.3 (RevMan 2014) in order to create ’Summary of findings’ tables. A summary of the intervention effect and a measure of quality for each of the above outcomes was produced using the GRADE approach. The GRADE approach uses five considerations (study limitations, consistency of effect, imprecision, indirectness and publication bias) to assess the quality of the body of evidence for each outcome. The evidence can be downgraded from 'high quality' by one level for serious (or by two levels for very serious) limitations, depending on assessments for risk of bias, indirectness of evidence, serious inconsistency, imprecision of effect estimates or potential publication bias.
Measures of treatment effect
Dichotomous data
For dichotomous data, we present results as summary risk ratio with 95% confidence intervals.
Continuous data
For continuous data, we used the mean difference if outcomes were measured in the same way between trials. We planned to use the standardised mean difference to combine trials that measured the same outcome, but used different methods. For the studies that reported medians and ranges for continuous data, we estimated means and standard deviations through the method proposed by Hozo (Hozo 2005).
Unit of analysis issues
Cluster‐randomised trials
We did not identify any cluster‐randomised trials for inclusion in this version of the review. If we identify any cluster‐randomised trials in future updates, we will include cluster‐randomised trials in the analyses along with individually‐randomised trials. We will adjust their sample sizes using the methods described in the Handbook [Section 16.3.4 or 16.3.6] using an estimate of the intracluster correlation co‐efficient (ICC) derived from the trial (if possible), from a similar trial or from a study of a similar population. If we use ICCs from other sources, we will report this and conduct sensitivity analyses to investigate the effect of variation in the ICC. If we identify both cluster‐randomised trials and individually‐randomised trials, we plan to synthesise the relevant information. We will consider it reasonable to combine the results from both if there is little heterogeneity between the study designs and the interaction between the effect of intervention and the choice of randomisation unit is considered to be unlikely.
We will also acknowledge heterogeneity in the randomisation unit and perform a sensitivity analysis to investigate the effects of the randomisation unit.
Cross‐over trials
Cross‐over trials are not eligible for inclusion because we consider this is not an adequate study design to verify the efficacy of this kind of intervention. There is no time for a trustful washout period, hence this period would be contaminated by the other intervention and the results would not be reliable.
Dealing with missing data
For included studies, we noted the levels of attrition. We explored the impact of including studies with high levels of missing data in the overall assessment of treatment effect by using sensitivity analysis.
For all outcomes, we carried out analyses, as far as possible, on an intention‐to‐treat basis, i.e. we attempted to include all participants randomised to each group in the analyses, and all participants were analysed in the group to which they were allocated, regardless of whether or not they received the allocated intervention. The denominator for each outcome in each trial was the number randomised minus any participants whose outcomes were known to be missing.
Assessment of heterogeneity
We assessed statistical heterogeneity in each meta‐analysis using the T², I² and Chi² statistics. We regarded heterogeneity as substantial if an I² was greater than 30% and either a T² was greater than zero, or there was a low P value (less than 0.10) in the Chi² test for heterogeneity. We used a random‐effects meta‐analysis as an overall summary, if this was considered appropriate.
Assessment of reporting biases
If there were 10 or more studies in the meta‐analysis, we planned to investigate reporting biases (such as publication bias) using funnel plots. We planned to assess funnel plot asymmetry visually. If asymmetry was suggested by a visual assessment, we planned to perform exploratory analyses to investigate it.
Where we suspected reporting bias, we contacted study authors, whenever possible, to ask them to provide missing outcome data. Where this was not possible, and the missing data were thought to introduce serious bias, we have explored the impact of including such studies in the overall assessment of results by sensitivity analysis.
Data synthesis
We carried out statistical analysis using the Review Manager software (RevMan 2014). We used fixed‐effect meta‐analysis for combining data where it was reasonable to assume that studies were estimating the same underlying treatment effect: i.e. where trials examined the same intervention, and we judged that the trials’ populations and methods were sufficiently similar. If there was clinical heterogeneity sufficient to expect that the underlying treatment effects differed between trials, or if substantial statistical heterogeneity was detected, we used random‐effects meta‐analysis to produce an overall summary, if an average treatment effect across trials was considered clinically meaningful. The random‐effects summary was treated as the average range of possible treatment effects and we discuss the clinical implications of treatment effects differing between trials. If the average treatment effect was not clinically meaningful, we did not combine trials.
Where we used random‐effects analyses, the results are presented as the average treatment effect with 95% confidence intervals, and the estimates of T² and I².
Subgroup analysis and investigation of heterogeneity
When we identified substantial heterogeneity, we investigated it using subgroup analyses and sensitivity analyses. We considered whether an overall summary was meaningful, and if it was, we used random‐effects analysis to produce it.
We planned to carry out subgroup analysis by use of epidural analgesia in situ or not (including discontinuation of epidural analgesia) for the maternal and neonatal primary outcomes, but this was not possible.
We also carried a subgroup analysis by parity (nulliparous (primigravida) and multiparous with or without epidural analgesia) for three maternal outcomes (duration of the second stage of labour, duration of pushing, and spontaneous vaginal delivery).
For fixed‐effect inverse variance meta‐analyses, we assessed differences between subgroups by interaction tests. For random‐effects and fixed‐effect meta‐analyses using methods other than inverse variance, we assessed differences between subgroups by inspection of the subgroups’ confidence intervals; non‐overlapping confidence intervals indicate a statistically significant difference in treatment effect between the subgroups.
Sensitivity analysis
We planned to carry out a sensitivity analysis to explore the effects of fixed‐effect or random‐effects analyses for outcomes with statistical heterogeneity, but instead used random‐effects analysis where we identified substantial heterogeneity. We carried out sensitivity analyses to explore the effect of trial quality (excluding quasi‐RCTs, and trials assessed to be at high risk of bias for random sequence generation or allocation concealment) for the primary outcome, duration of the second stage of labour, and for the secondary outcome, duration of pushing because of the high heterogeneity found. Lam 2010, Maresh 1983 and Yildirim 2008 were excluded for being at high risk of selection bias.
We performed other sensitivity analyses to explore the effect of possible errors in the estimates of the mean and standard deviations of the trials that reported the continuous data in median and range (Fitzpatrick 2002; Fraser 2000b; Plunkett 2003; Vause 1998) (excluding trials reporting median and ranges) for the primary outcome, duration of the second stage and the secondary outcome duration of pushing.
In future updates, if we include cluster‐randomised trials in meta‐analysis with individually‐randomised trials, we will carry out a sensitivity analysis in order to investigate the effect of the randomisation unit.
Results
Description of studies
Results of the search
The search of the Cochrane Pregnancy and Childbirth Group's Trials Register retrieved 64 trial reports and we identified a further four reports from reference lists of retrieved studies (Chang 2011; Gleeson 1991; Lai 2009; Yeates 1984) (see: Figure 1). We included 21 studies (42 reports) and excluded 22 studies (24 reports). Two trials are ongoing (Cahill 2014; Hauspurg 2014).
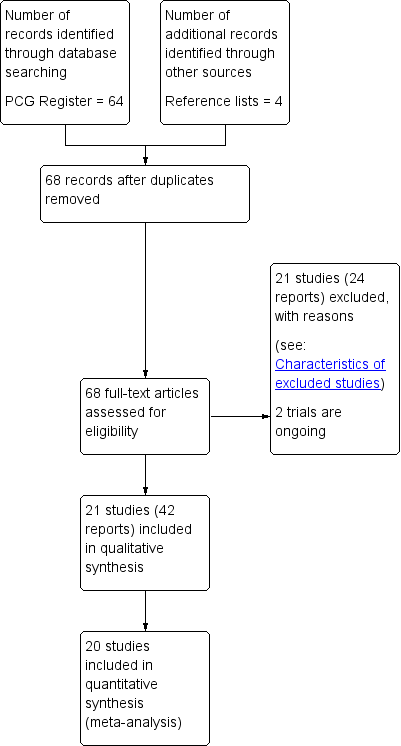
Study flow diagram.
Included studies
This updated review now has 21 included studies.
Eight trials (Jahdi 2011; Knauth 1986; Lam 2010; Low 2013; Schaffer 2005; Thomson 1993;Vaziri 2016; Yildirim 2008) compared the types of pushing and 13 trials (Buxton 1988; Fitzpatrick 2002; Fraser 2000b; Gillesby 2010; Goodfellow 1979; Hansen 2002; Kelly 2010; Maresh 1983; Mayberry 1999; Plunkett 2003; Ravindran 1981; Simpson 2005; Vause 1998) compared the timing of pushing.
One included trial (Ravindran 1981) did not contribute data to our analysis because it did not report on the outcomes of interest in this review.
Some of the included studies assessed the types of pushing, whilst others evaluated the timing of pushing. Consequently, we carried out two separate comparisons.
-
Comparison 1: Types of pushing: spontaneous pushing versus directed pushing (with or without epidural analgesia)
-
Comparison 2: Timing of pushing: delayed pushing versus immediate pushing (all women with epidural)
Comparison 1: Types of pushing: spontaneous pushing versus directed pushing (with or without epidural analgesia)
For the eight trials comparing the types of pushing, the women involved (884 women) were low‐risk nulliparous (Knauth 1986; Lam 2010; Low 2013; Schaffer 2005; Vaziri 2016), or primiparous (Jahdi 2011; Thomson 1993; Yildirim 2008), and multiparous (Jahdi 2011), with a singleton fetus in cephalic presentation between 39 and 40 weeks of gestation.
The women's age ranged between 18 and 40 years old and there was no use of epidural analgesia during labour in seven trials (Jahdi 2011; Knauth 1986; Lam 2010; Schaffer 2005; Thomson 1993; Vaziri 2016; Yildirim 2008). One trial (Low 2013) used epidural, but not all women made use of this option.
The studies were conducted in different countries: United States of America (USA) (Knauth 1986; Low 2013; Schaffer 2005), Turkey (Yildirim 2008), England (Thomson 1993), Iran (Jahdi 2011; Vaziri 2016) and Hong Kong (Lam 2010).
Seven trials compared spontaneous pushing with direct Valsalva/closed glottis type pushing (Jahdi 2011; Lam 2010; Low 2013; Schaffer 2005; Thomson 1993;Vaziri 2016; Yildirim 2008). One trial (Knauth 1986) compared Valsalva pushing with slow exhalation through pursed lips (see Characteristics of included studies). There were no specific instructions for spontaneous pushing regarding timing and duration of pushing, and the women were encouraged to follow their body sensations and do what comes naturally.
The timing of pushing was reported in three studies (Lam 2010; Schaffer 2005; Yildirim 2008) and this varied between studies. Four studies (Jahdi 2011; Lam 2010; Schaffer 2005; Vaziri 2016) started pushing with the onset of the second stage of labour for the directed group, and for the spontaneous group when the urge to push was felt. One study (Yildirim 2008), started pushing at full dilation and also with the fetal head at least 1+ level in the pelvis for both groups. The other three trials (Knauth 1986; Low 2013; Thomson 1993) did not mention the timing.
The randomisation was done at full dilation in three studies (Jahdi 2011; Lam 2010; Schaffer 2005) and at 6 cm of dilation in one study (Thomson 1993), whereas three trials (Knauth 1986; Vaziri 2016; Yildirim 2008), did not report this information. One trial (Low 2013) randomised the groups during the prenatal visit.
The posture used for labouring down varied among the studies: free option as the women desire (Schaffer 2005), lithotomy (Yildirim 2008), and birthing chair or sitting (Knauth 1986), while the other three trials did not mention the posture used (Lam 2010; Low 2013; Thomson 1993). For one study (Jahdi 2011), besides the method of pushing used, they also included different postures for each arm of the trial. The group coached to a directed pushing assumed the supine position (Jahdi 2011), while the group selected to do the spontaneous pushing used an upright position (standing, sitting and squatting). The last study (Vaziri 2016) also included different postures for each arm of the trial. The spontaneous pushing group used the lateral position and the directed group used the supine position.
Only two trials (Schaffer 2005; Yildirim 2008) reported that they had used oxytocin, but the dosage was not described. One trial (Schaffer 2005), had used oxytocin after randomisation, and in the other trial (Yildirim 2008), it is not clear when it was used.
The intervention was conducted by certified nurse‐midwives (Low 2013; Schaffer 2005), midwives (Jahdi 2011; Lam 2010; Low 2013; Thomson 1993), nurse, obstetrician, or family medicine physician (Low 2013), and certified childbirth educators (Knauth 1986). Two trials did not mention this aspect of the methods (Vaziri 2016; Yildirim 2008). Three trials (Knauth 1986; Low 2013; Schaffer 2005), included training for the team responsible for the intervention in the labour ward, while the others five trials (Jahdi 2011; Lam 2010; Thomson 1993; Vaziri 2016; Yildirim 2008), did not mention any training sessions.
In one study (Low 2013), the spontaneous group received a video that provided instructions on the breathing technique, but in the remainder of the trials it is not stated that the women receive prenatal education about how to push.
One study (Schaffer 2005), derived two reports, one published in 2006 (Bloom 2006) showed the obstetrical outcomes, and the other one, published in 2005 (Schaffer 2005b), was a three‐month follow‐up to determine the effect of a direct pushing on the urogynaecologic measures and pelvic floor structure and function.
Low 2013 compared the effect of spontaneous pushing (either with or without prenatal perineal massage) with directed pushing (with and without prenatal massage) and involved four groups. Therefore, we considered the two groups (spontaneous versus directed without perineal massage). This study published another report with one‐year follow‐up on the presence or not of fecal incontinence (Brincat 2009), and a secondary analysis based on audio tapes designated women into spontaneous pushing or directed pushing groups based on the actual pushing method which was not used in the results.
Comparison 2: Timing of pushing: delayed pushing versus immediate pushing (all women with epidural analgesia)
The 12 trials comparing timing of pushing and that contributed to the data analysis involved 2879 women. The sample was nulliparous (Fraser 2000b; Gillesby 2010; Goodfellow 1979; Kelly 2010; Maresh 1983; Mayberry 1999; Plunkett 2003; Simpson 2005; Vause 1998), primiparous (Fitzpatrick 2002), or nulliparous and multiparous (Buxton 1988; Hansen 2002), with a singleton fetus in cephalic presentation, between 36 and 42 weeks of gestation. The age ranged between 17 to 40 years old.
The studies were from different countries: USA (Buxton 1988; Gillesby 2010; Hansen 2002; Kelly 2010; Mayberry 1999; Plunkett 2003; Simpson 2005), England (Goodfellow 1979; Vause 1998), Ireland (Fitzpatrick 2002), Malaysia (Maresh 1983), and there was one multicentre trial (Fraser 2000b) involving three countries: USA, Canada and Switzerland that resulted in two reports, one aimed to determine the efficacy of delayed pushing for nulliparous with epidural analgesia on the risk of difficult delivery (Fraser 2000a), and the other aimed to estimate the economic efficiency of this policy of delayed pushing with the same sample (Petrou 2000).
All the trials had used epidural analgesia and compared an immediate pushing technique versus delayed pushing. The immediate group began pushing after the cervix was identified as being completely dilated and the time for the delayed group to start pushing varied among the studies. The delay for the onset of pushing was until the woman experienced an irresistible urge to push, or to one, two or three hours (see Characteristics of included studies). The randomisation process was conducted upon diagnosis of full dilation in five studies (Fitzpatrick 2002; Fraser 2000b; Gillesby 2010; Goodfellow 1979; Simpson 2005), before complete dilation in two studies (Kelly 2010; Mayberry 1999), and either the first or within the first hour of the start of the second stage (Vause 1998); the other four trials (Buxton 1988; Hansen 2002; Maresh 1983; Plunkett 2003) did not report this information.
In relation to the type of pushing used, eight studies (Buxton 1988; Fitzpatrick 2002; Fraser 2000b; Goodfellow 1979; Gillesby 2010; Maresh 1983; Plunkett 2003; Vause 1998), did not report this. Three trials provided this information. One trial used a closed glottis (Hansen 2002), two used both closed and open glottis (Kelly 2010), or breath holding no longer than six to eight seconds (Mayberry 1999). One trial (Simpson 2005), divided the type of pushing according to the group, whilst the immediate group bore down with a Valsalva type pushing; the delayed group used an open‐glottis breath.
All the trials comparing timing of pushing used analgesia. Different doses and schemes of epidural analgesia were used, but only six trials described the epidural dosage used (0.125% or 0.12 mg to 0.25 mg or 4 mL to 10 mL of 0.25% and occasionally 0.35% or 0.5%) of bupivacaine and 2 ug/mL of fentanyl to a rate of 6 mL/hr to 12 mL/hr (Fraser 2000b; Goodfellow 1979; Kelly 2010; Mayberry 1999; Plunkett 2003; Simpson 2005), while the others six studies did not report the dosage (Buxton 1988; Fitzpatrick 2002; Gillesby 2010; Hansen 2002; Maresh 1983; Vause 1998).
The description of oxytocin used among trials was confusing. Nine trials (Buxton 1988; Fitzpatrick 2002; Fraser 2000b; Gillesby 2010; Goodfellow 1979; Kelly 2010; Maresh 1983; Simpson 2005; Vause 1998) reported oxytocin use. Five trials (Buxton 1988; Fitzpatrick 2002; Fraser 2000b; Simpson 2005; Vause 1998) reported the time this medication was used (first and/or second stage), but this was not clear in the other two trials (Kelly 2010; Maresh 1983). One trial (Goodfellow 1979), used oxytocin only in the treatment group, and an other trial (Simpson 2005) reported oxytocin use for all women in both groups. In one trial (Gillesby 2010), we contacted the authors and they provided this information, stating that oxytocin was either used in the first or second stage.
The posture used during labouring down was described in only five trials and varied between studies: no limit to changing position (Gillesby 2010; Kelly 2010), sitting or lateral position for the intervention group (Buxton 1988; Simpson 2005), lateral or decubitos position for both groups (Hansen 2002). The other seven studies (Fitzpatrick 2002; Fraser 2000b; Goodfellow 1979; Maresh 1983; Mayberry 1999; Plunkett 2003; Vause 1998), did not mention the posture used by the women. The intervention was conducted by nurse or physician (Gillesby 2010; Hansen 2002; Maresh 1983; Mayberry 1999; Simpson 2005; Vause 1998), and midwives (Fitzpatrick 2002; Goodfellow 1979), and four trials did not describe who assisted the woman at the labour (Buxton 1988; Fraser 2000b; Kelly 2010; Plunkett 2003). Only one trial (Kelly 2010), referred to training of the health team responsible for the pushing orientation.
None of the women in the included studies had received prenatal education about how to push.
Excluded studies
We excluded 22 trials (24 reports). Ten studies were not randomised controlled trials (RCTs) (Barnett 1982; Caldeyro Barcia 1990; Chang 2011; Gleeson 1991; Haseeb 2014; Lai 2009; Martinez Lopez 1984; Mc Queen 1977; Parnell 1993; Yeates 1984), and four were trial registrations for trials that do not appear to have been completed (Liston 1987; Mulvey 2008; Snyder 1996; Spiby 1990). Two were published in abstract form only (Boulvain 1998; Pickrell 1989), two trials used different interventions to those considered in this review (Matsuo 2009; Phipps 2009), one trial compared different positions and did not report the pushing method used in the groups (Moraloglu 2016), another trial (Aviram 2016), aimed to determine the effect of a dental support device on the course of labour and delivery (it did not report the type of pushing used), and in the Walker 2012 study, the same intervention was used in both study arms.
Risk of bias in included studies
For a summary of the risk of bias for the included studies, see Figure 2 and Figure 3.
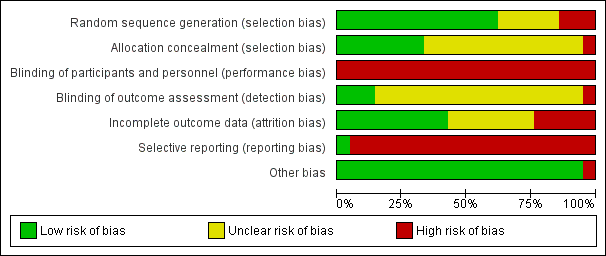
'Risk of bias' graph: review authors' judgements about each risk of bias item presented as percentages across all included studies.

'Risk of bias' summary: review authors' judgements about each risk of bias item for each included study.
Allocation
Sequence generation
Comparison 1: Types of pushing: spontaneous pushing versus directed pushing (with or without epidural analgesia)
We considered that the randomisation process was adequate in only four trials (Low 2013; Schaffer 2005; Thomson 1993; Vaziri 2016). Two trials (Lam 2010; Yildirim 2008) were considered to be at a high risk of bias as only envelopes were described as being used for randomisation. We classified two trials (Jahdi 2011; Knauth 1986) as unclear as there was no information on the method used for random generation.
Comparison 2: Timing of pushing: delayed pushing versus immediate pushing (all women with epidural analgesia)
The randomisation sequence generation was adequate for nine trials (Buxton 1988; Fitzpatrick 2002; Gillesby 2010; Hansen 2002; Kelly 2010; Mayberry 1999; Plunkett 2003; Simpson 2005; Vause 1998). One trial (Maresh 1983), was assessed as having a high risk of bias because we considered the method used to be inadequate (odd and even hospital numbers) (Maresh 1983).
One trial (Fraser 2000b), despite reporting "randomisation was centralized", it was not clear how the sequence generation was done and therefore, it was classified as unclear risk of bias. Similarly, Goodfellow 1979 only reported that women were 'randomly allocated' and no further information was provided so this study was also assessed as having an unclear risk of selection bias.
Allocation concealment
Comparison 1: Types of pushing: spontaneous pushing versus directed pushing (with or without epidural analgesia)
For the seven trials comparing the types of pushing, adequate allocation concealment was described in only two trials (Schaffer 2005; Thomson 1993), and in the other six studies (Jahdi 2011; Knauth 1986; Lam 2010; Low 2013; Vaziri 2016Yildirim 2008), concealment of allocation was not described (unclear risk of selection bias).
Comparison 2: Timing of pushing: delayed pushing versus immediate pushing (all women with epidural analgesia)
For the trials comparing the timing of pushing, there was description of an adequate allocation concealment in five studies (Fitzpatrick 2002; Fraser 2000b; Mayberry 1999; Plunkett 2003; Vause 1998). For six trials (Buxton 1988; Gillesby 2010; Goodfellow 1979; Hansen 2002; Kelly 2010; Simpson 2005), it was 'unclear' if there was adequate allocation concealment, and one trial (Maresh 1983), we rated as high risk of bias as it was a quasi‐randomisation trial.
Blinding
Blinding of the participants and personnel
None of the trials included in this review blinded the participants and personnel and all trials were rated as 'high risk' of performance bias.
Blinding of the outcome assessors
Comparison 1: Types of pushing: spontaneous pushing versus directed pushing (with or without epidural analgesia)
Two studies reported that outcome assessors were blinded (Low 2013; Schaffer 2005). All the others studies did not mention whether the outcome assessors were blinded and were thus considered to be at an unclear risk of detection bias (Jahdi 2011; Knauth 1986; Lam 2010; Thomson 1993; Vaziri 2016; Yildirim 2008).
Comparison 2: Timing of pushing: delayed pushing versus immediate pushing (all women with epidural analgesia)
Of the 12 trials included, 10 (Buxton 1988; Fraser 2000b; Gillesby 2010; Goodfellow 1979; Hansen 2002; Maresh 1983; Mayberry 1999; Plunkett 2003; Simpson 2005; Vause 1998) did not mention blinding of the outcome assessors, and we considered them 'unclear' for this domain. The other two trials (Fitzpatrick 2002; Kelly 2010), described that the investigators were blinded for the assessment of specific outcomes. Fitzpatrick 2002 was assessed as of low risk because most outcomes were blinded to assessors; in Kelly 2010, most outcomes were not blinded, and so this trial was assessed as of high risk of bias.
Incomplete outcome data
Comparison 1: Types of pushing: spontaneous pushing versus directed pushing (with or without epidural analgesia)
For the trials comparing types of pushing, only two trials (Thomson 1993; Vaziri 2016) were at a low risk of attrition bias. Four trials were at high risk of bias (Knauth 1986; Low 2013; Schaffer 2005; Yildirim 2008). In one trial (Jahdi 2011), it was not clear if there were losses or changes between groups, and in the other trial (Lam 2010), it was not clear how many women were lost after randomisation.
One trial (Low 2013), had an 41% of attrition bias for the 12‐month follow‐up.
Comparison 2: Timing of pushing: delayed pushing versus immediate pushing (all women with epidural analgesia)
Seven trials (Fitzpatrick 2002; Fraser 2000b; Gillesby 2010; Kelly 2010; Plunkett 2003; Simpson 2005; Vause 1998), were classified as low risk for this bias and two of them carried out intention‐to‐treat analysis (Gillesby 2010; Kelly 2010).
Four trials (Buxton 1988; Goodfellow 1979; Maresh 1983; Mayberry 1999), did not describe losses or dropouts, therefore it is not clear if there was bias or not and they were classified as unclear risk of bias.
One trial (Hansen 2002), had almost 20% of losses and was thus categorised as high risk of bias.
Selective reporting
Comparison 1: Types of pushing: spontaneous pushing versus directed pushing (with or without epidural analgesia)
We classified one study (Schaffer 2005) as low risk of bias for selective reporting. The other six studies (Jahdi 2011; Knauth 1986; Lam 2010; Thomson 1993; Vaziri 2016; Yildirim 2008), we rated as high risk because they did not report important outcomes, also some of the outcomes of interest in this review were reported incompletely such that some of the data could not be entered in the meta‐analysis.
One trial (Low 2013) was assessed as being at high risk of reporting bias. The study aimed to test the effect of spontaneous pushing on incontinence outcomes at one year after the birth of the woman's first birth. Birth data (including perineal lacerations and episiotomy) were reported for the study population overall but data were not reported by treatment group. A table reporting 'obstetric characteristics by treatment condition' is restricted to the following outcomes: epidural; second stage length; delivery method (vaginal/caesarean section).
Comparison 2: Timing of pushing: delayed pushing versus immediate pushing (all women with epidural analgesia)
There was a high risk of bias for all 12 trials (Buxton 1988; Fitzpatrick 2002; Fraser 2000b; Gillesby 2010; Goodfellow 1979; Hansen 2002; Kelly 2010; Maresh 1983; Mayberry 1999; Plunkett 2003; Simpson 2005; Vause 1998), comparing timing of pushing because most of the outcomes of interest in the review were reported incompletely and as a result, data could not be entered in the meta‐analysis. In addition, other important outcomes were not reported.
Other potential sources of bias
No other potential sources of bias was found for almost all of studies. Only one study (Thomson 1993), from Comparison 1 (types of pushing: spontaneous pushing versus directed pushing ‐ with or without epidural analgesia) reported that the main author from the study was present for all second stages "to ensure reliability of group allocation" and therefore this could be an interference.
Effects of interventions
See: Summary of findings for the main comparison Spontaneous pushing compared to directed pushing for the second stage of labour (types of pushing); Summary of findings 2 Delayed pushing compared to immediate pushing (all women with epidural) for the second stage of labour (timing of pushing)
Comparison 1: Types of pushing: spontaneous pushing versus directed pushing (with or without epidural analgesia)
Selected outcomes have been downgraded using the GRADE approach. See summary of findings Table for the main comparison for further details.
Primary outcomes
Maternal outcomes
1. Duration of the second stage (minutes)
Data from six trials (Lam 2010; Low 2013; Schaffer 2005; Thomson 1993; Vaziri 2016; Yildirim 2008) of nulliparous women, showed no clear difference in the duration of the second stage (mean difference (MD) 10.26 minutes; 95% confidence interval (CI) ‐1.12 to 21.64; six studies, 667 women, random‐effects: I² = 81%; very low‐quality evidence;Analysis 1.1) between spontaneous and directed pushing. The overall result comes from a meta‐analysis with substantial heterogeneity. This outcome was downgraded to very low‐quality of evidence because of very serious study limitations, high heterogeneity and wide confidence intervals crossing the line of no effect (see summary of findings Table for the main comparison).
A sensitivity analysis was performed for this outcome. Lam 2010 and Yildirim 2008 were excluded for inadequate random sequence generation. These results are documented below (Analysis 1.17).
2. Perineal laceration (3rd and 4th degree)
The overall evidence from one study (Schaffer 2005), involving 320 women, shows that there is no clear difference in the risk of perineal trauma (3rd and 4th degree tears) between the use of spontaneous pushing compared to directed pushing (risk ratio (RR) 0.87; 95% CI 0.45 to 1.66; one study; 320 women;low‐quality evidence; Analysis 1.2).
3. Episiotomy
Two studies contributed to this analysis (Schaffer 2005; Yildirim 2008); the final result showed no clear difference in the risk of episiotomy between groups (average RR 1.05; 95% CI 0.60 to 1.85; 420 women; random‐effects; I² = 81%; Analysis 1.3).
Neonatal outcomes
1. Admission to neonatal intensive care
Two studies (Lam 2010; Schaffer 2005), reported this outcome and there was no difference between groups (RR 1.08, 95% CI 0.30 to 3.79; 393 infants; I² = 0%;very low‐quality evidence;Analysis 1.4).
2. Hypoxic ischaemic encephalopathy
None of the included studies reported on this outcome.
3. Five‐minute Apgar score less than seven
Only one trial (Schaffer 2005), reported this outcome as a binary variable and there was no difference between groups (RR 0.35; 95% CI 0.01 to 8.43; 320 infants; very low‐quality evidence;Analysis 1.5). Data were also reported in another trial (Yildirim 2008), but as mean and standard deviation, which could not be incorporated into our meta‐analysis.
Secondary outcomes
Maternal outcomes
1. Duration of pushing (outcome not pre‐specified in our published protocol)
Two trials (Vaziri 2016; Yildirim 2008), reported this outcome and the result showed no clear difference between groups (MD ‐9.76 minutes; 95% CI ‐19.54 to 0.02, two studies, 169 women; random‐effects; I² = 88%; T² = 43.98; P < 0.005; Analysis 1.6). This outcome was downgraded to very low‐quality of evidence because of serious study limitations, serious imprecision (null effect) and serious inconsistency (summary of findings Table for the main comparison).
A sensitivity analysis was performed for this outcome, excluding Yildirim 2008, because of inadequate random sequence generation. These results are documented below (Analysis 1.18).
2. Oxytocin use in the second stage after randomisation
Only one study (Schaffer 2005), reported this outcome and there was no clear difference between the pushing groups in the risk of this outcome (RR 2.20, 95% CI 0.80 to 6.07; 128 women; Analysis 1.7).
3. Spontaneous vaginal delivery
Five trials (Schaffer 2005; Jahdi 2011; Lam 2010; Low 2013; Thomson 1993), reported this outcome and there was no clear difference in the risk of spontaneous vaginal delivery between groups (RR 1.01; 95% CI 0.97 to 1.05; five studies; 688 women; moderate‐quality evidence;Analysis 1.8).
4. Instrumental delivery
Two studies (Lam 2010; Schaffer 2005) reported this outcome. There was no clear difference in the risk of instrumental delivery between spontaneous pushing and directed pushing groups (average RR 0.56; 95% CI 0.06 to 5.10; 393 women; random‐effects; I² = 57%; Analysis 1.9).
5.Rotational or midpelvic or posterior forceps
No studies provided data for this analysis.
6. Caesarean delivery
Three trials (Jahdi 2011; Low 2013; Schaffer 2005), reported this outcome and showed no clear difference in the risk of caesarean delivery between groups (average RR 0.79; 95% CI 0.14 to 4.39; 583 women; random‐effects; I² = 64%; Analysis 1.10).
7. Maternal hypertension
No trials reported maternal hypertension as an outcome.
8. Postpartum haemorrhage
No trials report postpartum haemorrhage as a binary variable. Only two trials (Lam 2010; Thomson 1993) reported "estimated blood loss" but data were expressed as a continuous variable and so could not be combined in meta‐analysis.
9. Maternal report of severe pain in second stage
Maternal report of severe pain in second stage was not reported by these trials.
10. Fatigue after delivery (outcome not pre‐specified in our published protocol)
Two trials (Lam 2010; Vaziri 2016), measured this outcome using a visual analogue scale (VAS). There was no clear difference between groups (standardised mean difference (SMD) ‐1.14, 95% CI ‐3.29 to 1.02; random‐effects; 142 women; I² = 97%; Analysis 1.11).
11. Maternal satisfaction (outcome not pre‐specified in our published protocol)
Only one trial (Thomson 1993), reported this outcome (measured using a VAS) and reported there was no clear difference (MD 0.91; 95% CI ‐1.30 to 3.12; 31 women; Analysis 1.12).
12. Perineal pain
No trials reported data for perineal pain.
13. Dyspareunia
No trials reported data for dyspareunia.
14. Urinary incontinence
Urodynamic stress incontinence was reported by one trial (Schaffer 2005). The results showed no clear difference in urinary incontinence between groups (RR 0.70, 95% CI 0.29 to 1.69; 128 women; Analysis 1.14).
One trial (Low 2013), reported urinary incontinence 12 months postpartum through the Leakage Index Questionnaire with potential index scores ranged from zero to eight, with larger numbers indicating greater severity of incontinence. The results showed no difference (P = 0.57) between the groups (directed group: mean and SD 2.17 + 2.5 and spontaneous group: mean and SD 1.20 + 1.76).
15. Detrusor overactivity (outcome not pre‐specified in our published protocol)
Detrusor overactivity measured by urodynamic testing was reported by one trial (Schaffer 2005); results showed no clear difference in the risk of detrusor overactivity between groups ((RR 0.50, 95% CI 0.18 to 1.36; 128 women; Analysis 1.13).
16. Fecal incontinence
Fecal incontinence was reported in a secondary analysis of one study (Low 2013), but the data were analysed only by the presence or not of fecal incontinence one year postpartum, independent of the types of pushing groups. Therefore, there were no available data by each group to inform a meta‐analysis. The results only reported that "the women in the “spontaneous pushing” group were equally likely to have fecal incontinence at 1 year (5%) as those in the other 2 groups (6%) (P=0.985) ".
17. Pelvic floor prolapse
Pelvic floor prolapse was not reported by the trials in this review.
Neonatal outcomes
1. Low umbilical cord blood pH
Only one trial (Schaffer 2005) reported this outcome as a binary variable. There was no clear difference between the spontaneous group and the directed pushing group for the risk of umbilical arterial cord pH less than 7.1 (RR 0.74, 95% CI 0.24 to 2.29; 320 women; Analysis 1.15).
2. Delivery room resuscitation (outcome not pre‐specified in our published protocol)
Only two trials (Schaffer 2005; Thomson 1993) reported delivery room resuscitation and there was no clear difference between the groups (RR 0.83, 95% CI 0.40 to 1.75; 352 women; I² = 0%; Analysis 1.16).
3. Total care costs (outcome not pre‐specified in our published protocol)
For this comparison, none of the included studies reported this outcome.
Sensitivity analysis for comparison 1
Trial quality
Duration of second stage: When we carried out a sensitivity analysis, excluding the quasi‐randomised trials (Lam 2010; Yildirim 2008), there was an increase in the effect size favouring the direct group with a reduced pushing time of about 17 minutes (MD 17.62, 95% CI 5.28 to 29.95; random‐effects; four studies; 494 women; I² = 62%; T² = 76.24; P < 0.05; Analysis 1.17).
Duration of pushing: When we carried out a sensitivity analysis, excluding the quasi‐randomised trial (Yildirim 2008), results showed that the group who pushed spontaneously spent less time (about 15 minutes) on pushing, but results were based on findings from a single trial with a small sample size (MD: ‐15.22 minutes; 95% CI ‐21.64 to ‐8.80; random‐effects; one study; 69 women; Analysis 1.18).
Comparison 2: Timing of pushing: delayed pushing versus immediate pushing (all women with epidural analgesia)
Selected outcomes have been downgraded using the GRADE approach. See summary of findings Table 2 for further details.
Primary outcomes
Maternal outcomes
1. Duration of the second stage (minutes)
There was an increase in the duration of the second stage of 56.40 minutes with the use of a delayed pushing in labour with epidural analgesia, based on data from 10 trials (Buxton 1988; Fitzpatrick 2002; Fraser 2000b; Gillesby 2010; Kelly 2010; Maresh 1983; Mayberry 1999; Plunkett 2003; Simpson 2005; Vause 1998) (MD 56.40, 95% CI 42.05 to 70.76; 11 trials; 3049 women; random‐effects; I² = 91%; T² = 524.61; very low‐quality evidence; Analysis 2.1).
Subgroup analysis by parity also demonstrated this increase among nulliparous (MD 56.12, 95% CI 39.29 to 72.96; 10 trials; 2885 women; random‐effects; I² = 92%; T² = 627.33; P < 0.00001) (Fraser 2000b; Gillesby 2010; Kelly 2010; Maresh 1983; Mayberry 1999; Plunkett 2003; Simpson 2005; Vause 1998; Fitzpatrick 2002; Hansen 2002); and multiparous women (MD 38.80 minutes; 95% CI 29.16 to 48.44; one trial; 123 women ‐ Hansen 2002). This larger effect in the nulliparous subgroup was supported by the interaction test when we performed the test for subgroup differences (Test for subgroups differences: Chi² = 8.19; df = 2; P = 0.02). However, since there is only one study included in both the multiparous and mixed parity subgroups, this result should be interpreted with caution.
A sensitivity analysis was performed for this outcome, excluding the quasi randomised trial, Maresh 1983, from the analysis (see below and Analysis 2.19).
We carried out another sensitivity analysis excluding the trials (Fitzpatrick 2002; Fraser 2000b; Plunkett 2003; Vause 1998) where we used a statistical method (Hozo 2005) to estimate means and standard deviations, because these trials reported data as medians and ranges. See below for sensitivity analysis of this outcome (Analysis 2.21).
Perineal laceration (3rd and 4th degree)
For seven trials (Fitzpatrick 2002; Fraser 2000b; Gillesby 2010; Hansen 2002; Kelly 2010; Mayberry 1999; Plunkett 2003), there was no clear difference in the risk of perineal laceration (3rd and 4th degree) between the use of delayed pushing compared with immediate pushing (RR 0.94, 95% CI 0.78 to 1.14; seven studies; 2775 women; I² = 0%; moderate‐quality evidence; Analysis 2.2). (Six of the seven studies included in this analysis reported 3rd and 4th degree tears; in one study trialists reported the total number of women with "lacerations" and did not provide separate data for women with more serious trauma (Hansen 2002); temporarily removing this study from the analysis did not cause any substantial change in the results; data not shown.)
3. Episiotomy
There was no clear difference between groups (RR 0.95; 95% CI 0.87 to 1.04; Analysis 2.3) from five trials (2320 women) (Fitzpatrick 2002;Fraser 2000b; Gillesby 2010; Maresh 1983; Vause 1998).
Neonatal outcomes
1. Admission to neonatal intensive care
Three trials (Fraser 2000b; Plunkett 2003; Vause 1998) assessed this outcome; there was no clear difference between groups in admission to neonatal intensive care (RR 0.98, 95% CI 0.67 to 1.41; three studies; 2197 women; I² = 0%; low‐quality evidence; Analysis 2.4).
2. Hypoxic ischaemic encephalopathy
None of the included studies reported on this outcome.
3. Five‐minute Apgar score less than seven
Despite three trials (Maresh 1983; Plunkett 2003; Vause 1998) providing data for this meta‐analysis, data from two of the studies (Maresh 1983; Vause 1998), were non‐estimable because the number of events was zero for both groups. The final result was therefore from one trial (Plunkett 2003), and there was no clear difference in the risk of a five‐minute Apgar score less than seven between delayed pushing and immediate pushing (RR 0.15, 95% CI 0.01 to 3.00; three studies; 413 infants; I² = 0%; very low‐quality evidence; Analysis 2.5). Five trials (Gillesby 2010; Hansen 2002; Kelly 2010; Mayberry 1999; Simpson 2005), reported this outcome as means and standard deviations. Wherever possible, we contacted the study authors by e‐mail to get these missing data, with success for one author (Gillesby 2010), who informed us that there were no five‐minute Apgar scores less than seven in both groups.
Secondary outcomes
Maternal outcomes
1. Duration of pushing (outcome not pre‐specified in our published protocol)
Eleven trials (Buxton 1988; Fitzpatrick 2002; Fraser 2000b; Gillesby 2010; Goodfellow 1979; Hansen 2002; Kelly 2010; Maresh 1983; Vause 1998; Plunkett 2003; Simpson 2005), contributed to this analysis. Compared to spontaneous pushing, delayed pushing was associated with a reduction of 19.05 minutes in the duration of pushing (MD ‐19.05, 95% CI ‐32.27 to ‐5.83; random‐effects; 11 studies; 2932 women; I² = 95%; very low‐quality evidence;Analysis 2.6).
The subgroup analysis shows a slightly larger effect among nulliparous women (MD ‐21.30, 95% CI ‐36.87 to ‐5.73; random‐effects; 10 studies; 2768 women; I² = 96%) (Fitzpatrick 2002; Fraser 2000b; Gillesby 2010; Goodfellow 1979; Hansen 2002; Kelly 2010; Maresh 1983; Plunkett 2003; Simpson 2005; Vause 1998), and less effect for multiparous women (MD ‐11.35, 95% CI ‐18.19 to ‐4.51; random‐effects; one trial; 123 women; (Hansen 2002). Despite the apparent difference between the subgroups, this is not supported by the subgroup interaction test (Chi2 = 1.86; df = 2; P = 0.39).
A sensitivity analysis was performed for this outcome, excluding the quasi‐randomised trial, Maresh 1983, from the analysis (see below and Analysis 2.20).
We carried out another sensitivity analysis excluding the trials (Fitzpatrick 2002; Fraser 2000b; Goodfellow 1979; Plunkett 2003; Vause 1998) where we used a statistical method (Hozo 2005) to estimate means and standard deviations, because these trials reported data as medians and ranges. See below for sensitivity analysis of this outcome (Analysis 2.22).
2. Oxytocin use in the second stage after randomisation
Only two studies (Buxton 1988; Vause 1998), could contribute to the meta‐analysis because they specified the time of use of oxytocin (second stage). There was no clear difference between delayed and immediate pushing groups in the risk of oxytocin use in the second stage (RR 1.00, 95% CI 0.79 to 1.27; two studies; 177 women; I² = 0; Analysis 2.7).
3. Spontaneous vaginal delivery
The overall result of this outcome from 12 trials (Buxton 1988; Fitzpatrick 2002; Fraser 2000b; Gillesby 2010; Goodfellow 1979; Hansen 2002; Kelly 2010; Maresh 1983; Mayberry 1999; Plunkett 2003; Simpson 2005; Vause 1998), showed a slight increase in spontaneous vaginal delivery in delayed pushing group (RR 1.07; 95% CI 1.03 to 1.11; 12 studies; 3114 women; I² = 0%; moderate‐quality evidence; Analysis 2.8) compared to the immediate pushing group.
The same results were found in the subgroup analysis for nulliparous women (RR 1.07, 95% CI 1.03 to 1.12; 11 studies; 2953 women; I² = 0%), from 11 trials (Fitzpatrick 2002; Fraser 2000b; Gillesby 2010; Goodfellow 1979; Hansen 2002; Kelly 2010; Mayberry 1999; Mayberry 1999; Plunkett 2003; Simpson 2005; Vause 1998). There was no apparent difference for the multiparous subgroup (RR 1.11; 95% CI 1.00 to 1.24; P = 0.06; 120 women) from one trial (Hansen 2002). The interaction test for subgroup differences suggests that there is no difference between these subgroups (test for subgroups differences: Chi² = 0.48; df = 2; P = 0.79).
4. Instrumental delivery
Overall, 10 studies (Buxton 1988; Fitzpatrick 2002; Fraser 2000b; Gillesby 2010; Goodfellow 1979; Hansen 2002; Maresh 1983; Mayberry 1999; Plunkett 2003; Vause 1998), contributed to this analysis. No clear difference was found between the spontaneous pushing and the directed pushing groups (average RR 0.89; 95% CI 0.74 to 1.07; random‐effects; 10 studies; 3007 women; I² = 46%; Analysis 2.9).
5.Rotational or midpelvic or posterior forceps
Overall, five studies (Buxton 1988; Fraser 2000b; Goodfellow 1979; Maresh 1983; Vause 1998) contributed data to this analysis. There was no clear difference between groups (RR 0.82, 95% CI 0.61 to 1.10; five studies; 2151 women; I² = 0%; Analysis 2.10)
6. Caesarean delivery
There was no clear difference between groups in terms of the risk of caesarean section (RR 0.83, 95% CI 0.65 to 1.05; nine studies; 2783 women; I² = 0%; Analysis 2.11) with data from nine trials (Buxton 1988; Fitzpatrick 2002; Fraser 2000b; Gillesby 2010; Kelly 2010; Maresh 1983; Mayberry 1999; Plunkett 2003; Vause 1998).
7. Maternal hypertension
No trials reported maternal hypertension as an outcome.
8. Postpartum haemorrhage
There was no clear difference in postpartum haemorrhage between groups (RR 1.04, 95% CI 0.86 to 1.26; three studies; 2199 women; I² = 0%; Analysis 2.12).
The results come from three trials (Fraser 2000b; Plunkett 2003; Vause 1998) that reported this outcome as a binary variable. One trial (Fraser 2000b), measured postpartum haemorrhage as an estimated blood loss greater than 500 mL, Plunkett 2003 did not specify the amount of blood loss they considered to be postpartum haemorrhage, and Vause 1998 considered blood loss at delivery > 500 mL.
9. Maternal report of severe pain in second stage
Maternal report of severe pain in second stage was not reported by these trials.
10. Fatigue after delivery (outcome not pre‐specified in our published protocol)
Only one trial (Gillesby 2010), reported this outcome (measured using a VAS) and reported no clear difference between groups (MD ‐6.40; 95% CI ‐21.00 to 8.20; 73 women; Analysis 2.13).
11. Maternal satisfaction (outcome not pre‐specified in our published protocol)
Maternal satisfaction with delivery (measured using a VAS) was reported by only one trial (Gillesby 2010); there was no clear difference (MD 0.40; 95% CI ‐7.34 to 8.14; Analysis 2.14). Another trial also measured maternal satisfaction with the second stage and reported the following result: "maternal satisfaction was similar between groups (median 80 min for both groups)".
12. Perineal pain
No trials reported data for perineal pain.
13. Dyspareunia
There was no clear difference in the risk of dyspareunia (RR 1.15; 95% CI 0.63 to 2.10; one study; 162 women; Analysis 2.15) reported only by one trial (Fitzpatrick 2002).
14. Urinary incontinence
Urinary incontinence was not reported by the trials included for this comparison.
15. Detrusor overactivity (outcome not pre‐specified in our published protocol)
Detrusor overactivity was not reported by the included trials for this comparison.
16. Fecal incontinence
Fecal incontinence was reported by one trial (Fitzpatrick 2002) and it showed no clear difference in the risk of this outcome (RR 1.47; 95% CI 0.94 to 2.29; one study; 178 women; Analysis 2.16). This outcome was documented using a modified continence score which a score of zero implying complete continence and a score of 20 implying complete incontinence.
17. Pelvic floor prolapse
Pelvic floor prolapse was not reported by the trials in this review.
Neonatal outcomes
1. Low umbilical cord blood pH
Four trials (Buxton 1988; Fraser 2000b; Plunkett 2003; Vause 1998) reported data on umbilical cord blood pH. The risk of a low umbilical cord blood pH was higher with the use of delayed compared to immediate pushing (RR 2.24, 95% CI 1.37 to 3.68; four studies; 2145 women; I² = 0%; Analysis 2.17). These results came mainly from one trial (Fraser 2000b), which show data from abnormal pH values that considered low values of venous pH less than 7.15 or an arterial pH less than 7.10.
Three trials (Hansen 2002; Maresh 1983; Simpson 2005) reported this outcome by mean and standard deviation and two trials (Fitzpatrick 2002) by median and ranges.
2. Delivery room resuscitation (outcome not pre‐specified in our published protocol)
For this comparison, none of the included studies reported this outcome.
3. Total care costs (outcome not pre‐specified in our published protocol)
Only one trial (Fraser 2000b) reported this outcome. There was an increase of about 80.00 CND$ in the total costs of hospital care (intrapartum and postnatal) (MD 81.35 CND$, 95% CI ‐80.27 to 242.97; Analysis 2.18) for the use of delayed pushing. A breakdown of the costs by care period (intrapartum/postnatal), showed that there was no difference between groups in the costs of postnatal care (MD 13.13 CND$, 95% CI ‐145.27 to 171.53; Analysis 2.18), but there was an increase in cost of intrapartum care for the delayed group (MD 68.22 CND$; 95% CI 55.37 to 81.07; Analysis 2.18).
Sensitivity analysis for comparison 2
Trial quality
Duration of second stage: We found high heterogeneity in the overall result meta‐analysis (random‐effects; I² = 91%, T² = 524.61, P < 0.00001; Analysis 2.1), but our sensitivity analysis excluding the inadequately randomised trials did not change the overall result and heterogeneity remained high (MD 53.46, 95% CI 38.82 to 68.10; 10 studies; 2973 women; I2 = 91%) (only one study Maresh 1983 was considered to be quasi‐randomised). The exclusion of Maresh 1983 in the nulliparous subgroup meta‐analysis did not alter the result either (MD 52.54, 95% CI 35.14 to 69.93; 9 studies; 2809 women; I² = 93%; Analysis 2.19).
Duration of pushing: There was a high heterogeneity for the overall result (random‐effects; I² = 95%; T² = 483.92; P < 0.00001; Analysis 2.6). After the sensitivity analysis, excluding one trial (Maresh 1983), with a compromised randomisation process, there was a slight increase in the overall effect size (MD ‐21.30 minutes, 95% CI ‐34.97 to ‐7.63; random‐effects; 10 studies; 2856 women; I² = 95%; Analysis 2.20), and in the nulliparous group (MD ‐24.25 minutes, 95% CI ‐40.43 to ‐8.07; random‐effects; 9 studies; 2692 women; I² = 96%; Analysis 2.20) although high heterogeneity remained in both these analyses.
Trials reporting median and interquartile ranges
Duration of second stage: We also carried out a sensitivity analysis excluding the trials that reported the data as medians and ranges (Fitzpatrick 2002; Fraser 2000b; Plunkett 2003; Vause 1998), where we had to use a statistical method (Hozo 2005) to convert to mean and standard deviation. The results from this sensitivity analysis slightly lowered the heterogeneity and did not change the direction of the overall result (MD 56.48, 95% CI 34.24 to 78.72; random‐effects; seven studies; 684 women; I² = 88%; Analysis 2.21), and the nulliparous group result (MD 55.17, 95% CI 25.33 to 85.01; random‐effects; six studies; 520 women; I² = 89%; Analysis 2.21).
Duration of pushing: We carried out another sensitivity analysis excluding the trials (Fitzpatrick 2002; Fraser 2000b; Goodfellow 1979; Plunkett 2003; Vause 1998) where we used a statistical method (Hozo 2005) to calculate mean and standard deviation, because these trials reported data as median and ranges. The results from this sensitivity analysis slightly reduced the effect size although heterogeneity remained high (MD ‐17.22, 95% CI ‐28.92 to ‐5.52; random‐effects; six studies; 531 women; I² = 75%; Analysis 2.22). The same was true for the nulliparous group (MD ‐22.51, 95% CI ‐41.53 to ‐3.50; random‐effects; five studies; 367 women; I² = 83%; Analysis 2.22).
Discussion
Summary of main results
Comparison 1: types of pushing: spontaneous pushing versus directed pushing (with or without epidural analgesia)
Spontaneous pushing compared with directed pushing did not reduce the duration of the second stage of labour when all trials were included, although there was high heterogeneity for this outcome; when inadequately randomised trials were excluded the duration of second stage of the directed group decreased by 17 minutes; however, there remained high heterogeneity between trials and results should be interpreted with caution.
The posture used in the trials could have influenced the results of the duration of second stage and the duration of pushing. There was no consensus in the trials about the posture adopted. One study divided the groups according to posture, allowing the spontaneous group to have upright position, while the directed pushing group remained in the supine posture for the bearing down (Vaziri 2016). The posture used by the spontaneous group in this trial could have influenced the results, as there is evidence that lateral postures may shorten the second stage of labour (Gupta 2012).
There is no evidence that spontaneous pushing reduces serious perineal laceration and episiotomy, These results come from two studies that controlled the posture, which means that this variable probably did not interfere with the results. Urinary incontinence and overactive bladder results were not different between spontaneous and directed types of pushing. There is no difference between groups for the risk of caesarean and instrumental deliveries, and no evidence that spontaneous pushing increases spontaneous vaginal delivery. The included trials did not report on maternal self‐report of severe pain in the second stage of labour, maternal hypertension, postpartum haemorrhage, perineal pain, dyspareunia, fecal incontinence and pelvic floor prolapse; evidence on these outcomes is needed. Consequently, the possibility of these maternal adverse effects (particularly in relation to damage to the pelvic floor) remains unknown.
There was no difference in the use of oxytocin during the second stage of labour between the directed or spontaneous pushing groups, but this is based on evidence from one small trial (involving 100 women; Schaffer 2005). Similarly, there was no difference between groups in terms of fatigue after delivery, or maternal satisfaction (again, from one small trial involving 31 women, Thomson 1993).
We found no evidence to show that spontaneous or directed pushing was associated with adverse effects on neonatal outcomes. There were no differences between spontaneous and directed pushing groups for admission to neonatal intensive care, five‐minute Apgar score less than seven, low umbilical cord blood pH and delivery room resuscitation. The incidence of hypoxic ischaemic encephalopathy was not reported in the included studies.
Comparison 2: Timing of pushing: delayed pushing versus immediate pushing (all women with epidural analgesia)
Delayed pushing was associated with an increase in the duration of the second stage of labour by about 56 minutes overall. Despite the high heterogeneity found in this analysis, it is notable that all of the subgroup results are in the same direction, which gives some confidence that the effect is likely to be consistent in direction, if not in size.
The use of a delayed pushing in labours with epidural analgesia reduces the duration of pushing by about 19 minutes, which was also seen in the subgroup of nulliparous and multiparous. Despite the primiparous subgroup showing no difference, the interaction test does not suggest strong evidence of a differential effect between subgroups. Nevertheless, the decrease in the duration of pushing did not impact on the outcomes of fatigue after delivery and maternal satisfaction; there was no difference between the delayed and immediate groups.
There was no evidence that delayed pushing reduces third and fourth degree perineal laceration and episiotomy. Moreover, most of the trials reported the posture used by the women. As this variable might have an influence on the risk of perineal trauma, it could be a confounder in these results.
Whilst there was a 7% increase in spontaneous vaginal delivery for the delayed pushing group and even though the subgroups analysis showed no effect for primiparous and multiparous, this observation should be interpreted with caution as it is derived from few studies and the interaction test shows no evidence of any difference between the subgroups.
There was no difference in caesarean and instrumental deliveries, and midpelvic forceps. Despite the non significant results for these outcomes, the overall effects favour the delayed pushing group and the confidence interval upper limit from all these analyses barely overlaps 1.0. Therefore, it seems that delayed pushing tends to reduce caesarean instrumental and midpelvic forceps deliveries.
Some outcomes, such as maternal hypertension, maternal report of severe pain in the second stage of labour, perineal pain, urinary incontinence, detrusor overactivity and pelvic floor prolapse were not reported by the trials and the evidence remains inconclusive for these outcomes. Consequently, the risk of these maternal adverse effects (particularly in relation to damage to the pelvic floor), remains unknown. There were no differences between the delayed and immediate pushing groups in relation to the incidence of postpartum haemorrhage, or the use of oxytocin during the second stage.
The risk of a low umbilical cord blood pH was doubled with delayed pushing, although this result is mainly from one study, suggesting an adverse effect on the fetus. No trials reported hypoxic ischaemic encephalopathy or delivery room resuscitation, and admission to neonatal Intensive unit care was no different between delayed and immediate pushing groups. There was also no difference between groups for five‐minute Apgar score less than seven, however the result comes from just one trial and because of the selective outcome reporting (incomplete data), this finding should not be considered to be truly representative.
Compared to a policy of immediate pushing, delayed pushing did not result in an increase in the total cost of care or the cost of postnatal care. However, delayed pushing was associated with an increase in intrapartum costs by about CND$ 68.22.
Overall completeness and applicability of evidence
The evidence in this review was provided from trials conducted in various countries, but mainly from the USA and Europe. There were no trials from Latin America. The results came exclusively from low‐risk pregnancies of different parities with a singleton fetus in a term gestation in women aged between 18 and 40 years old. Therefore, it is hard to generalise this evidence to high‐risk pregnancies, adolescent pregnant women or to those women with preterm labour. Recruitment to all trials occurred in a hospital setting and mostly there was no prenatal education to teach women about spontaneous pushing, with the exception of one trial that mentioned the method.
Basically, spontaneous pushing with no use of epidural consisted of no instructions about the way (timing and type) that the pregnant women should push, followed by words of encouragement during the process. The protocol of delayed pushing established among the trials was different between the included studies, which makes it difficult to make more precise recommendations. Overall, the trials delayed 'pushing' for one to two hours or until the fetal head was visible at the perineum. This evidence is based on labours in which epidural analgesia was used and therefore may not generalise to labours which do not use epidural analgesia.
It is still not clear what the effects are of delayed pushing versus a spontaneous type of pushing plus the use of an epidural, as most of the trials did not report this method, or used a closed‐glottis pushing. Nevertheless, spontaneous pushing used without epidural analgesia tends to reduce the duration of pushing and increase the duration of the second stage of labour with no effect on pain and fatigue after delivery.
It seems that delayed pushing with epidural analgesia tends to reduce instrumental and caesarean deliveries, despite the evidence found here, which did not reach statistical significance. In the same way, some effect of delayed pushing on reducing rotational or midforceps could not be excluded. However, the use of delayed pushing increased the rate of spontaneous vaginal delivery.
As delayed pushing increases the duration of the second stage of labour and as the largest trial (Fraser 2000b), showed an increase in the abnormal pH umbilical cord values, it is important to explore this possible effect in other trials, as other parameters such as Apgar scores, delivery room resuscitation and neonatal admission to intensive care unit were either no different and/or not described in most of the trials. It is important to mention that although the duration of the second stage of labour seems to increase with delayed pushing, the length of pushing is reduced for this group, indicating a possible "compensatory" effect, once women spend less time pushing. If a longer duration of the second stage, but a reduced length of pushing are beneficial or considered important by the women, it is a point that needs to be investigated in other studies.
Quality of the evidence
For the trials comparing types of pushing: spontaneous pushing versus directed pushing (with or without epidural analgesia), most of the available evidence shows a balance between high and low risk of bias for randomisation and allocation concealment. Selective outcome reporting and attrition bias may affect the reliability of our findings because most of the studies were at high or unclear risk of bias for these domains. Lack of blinding for the women may not cause a bias for objective outcomes, and for this intervention it was impossible to blind the women in this type of study. However, for the outcome assessors, lack of blinding may be a potential source of bias, particularly for the subjective outcomes, as in most of the trials it was not clear whether the outcome assessors were blinded. The global quality of evidence for the seven outcomes (duration of second stage, perineal laceration, hypoxic ischaemic encephalopathy, Apgar scores at five minutes less than seven, admission to neonatal intensive care, duration of pushing, and spontaneous vaginal delivery) listed in the GRADE evaluation was moderate tovery low due mainly due to study limitation bias, inconsistency and imprecision.
Current evidence for the trials comparing timing of pushing: delayed pushing versus immediate pushing (all women with epidural analgesia) comes from studies where the randomisation process was often adequate, but the allocation concealment was often rated to be at unclear or high risk, resulting in bias which may overestimate the final result. Although the non‐blinded design for the patients was present in all trials, the primary outcomes pre‐specified in this review were objective and are less susceptible to bias from lack of blinding compared to subjective outcomes. Since it was not clear whether the outcome assessors were blinded in most of the trials, we are not sure to what extent this could affect some outcomes, such as length of pushing, fatigue after delivery, and maternal satisfaction. According to the GRADE assessment, outcomes for this comparison were graded from moderate to very low quality with downgrading due to inconsistency, imprecision and study limitations.
It is also important to note that selective outcome reporting was present in all but one of the trials. For some trials, we were unable to obtain data for some important outcomes, or data were reported in such a way that they were unsuitable for meta‐analysis.
Potential biases in the review process
We followed the methods set out in the Cochrane Handbook for Systematic Reviews of Interventions (Higgins 2011), in order to try to reduce potential biases in the review process. The evidence for this review came from a detailed search process, which included published and unpublished papers and no language restrictions. It is possible that potentially eligible studies conducted in journals not easy to access have been published and could not be identified by this search strategy. Futhermore, we need to consider the 'lag bias' (studies that have been done, but not yet published). Any additional information about potentially eligible trials to be included in this review will be welcome and should be sent to the contact person for this review.
For Comparison 2: timing of pushing: delayed pushing versus immediate pushing (all women with epidural analgesia), some studies reported continuous variables as medians and ranges for the duration of the second stage of labour (Fitzpatrick 2002; Fraser 2000b; Plunkett 2003; Vause 1998), and for duration of pushing (Fitzpatrick 2002; Fraser 2000b; Goodfellow 1979; Plunkett 2003; Vause 1998), we used a statistical method (Hozo 2005), to estimate means and standard deviations, which can cause an overestimation or underestimation of the overall effect. However, we carried out sensitivity analyses (excluding the studies with the mean calculated by the statistical method) and the direction of the overall result for both outcomes: duration of the second stage and duration of pushing did not change, but there was a decrease in the heterogeneity, which might explain part of the high heterogeneity found before.
For the outcome instrumental delivery (Figure 4), from the trials comparing timing of pushing: delayed pushing to immediate pushing (all women with epidural analgesia), it seems that there was little evidence of potential publication bias, which could be seen from the funnel plots. However, for the outcome duration of the second stage (Figure 5), the studies are concentrated in the upper part of the graph showing different results, which may indicate a possible reporting bias from the lack of studies in the bottom part, and large trials showing minimum effect. There is also an asymmetry for the outcome duration of pushing (Figure 6), and spontaneous vaginal delivery (Figure 7), which could also reflect a reporting bias.
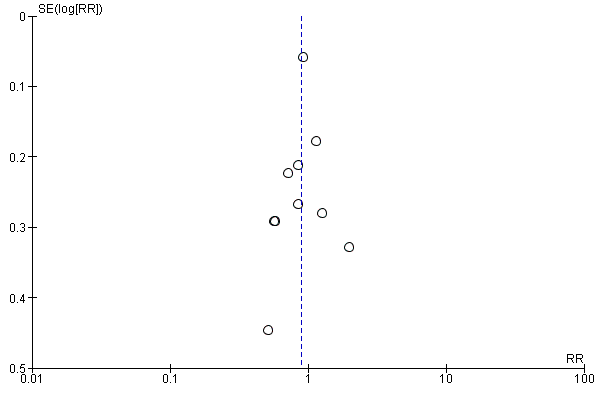
Funnel plot of comparison 2: Delayed pushing versus immediate pushing (all women with epidural), outcome: 2.10 Instrumental delivery.

Funnel plot of comparison 2: Delayed pushing versus immediate pushing (all women with epidural), outcome: 2.1 Duration of second stage.
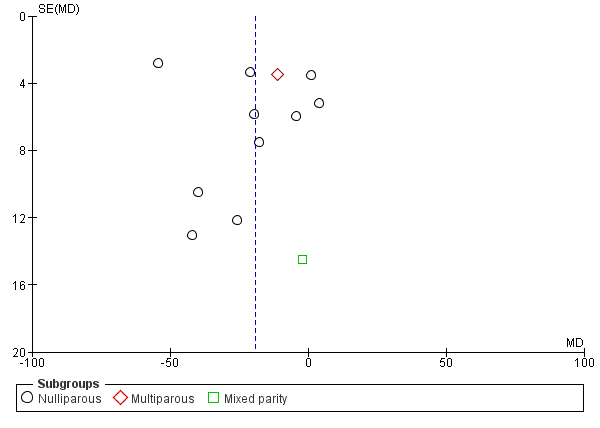
Funnel plot of comparison 2: Delayed pushing versus immediate pushing (all women with epidural), outcome: 2.7 Duration of Pushing.

Funnel plot of comparison 2: Delayed pushing versus immediate pushing (all women with epidural), outcome: 2.9 Spontaneous vaginal delivery.
Agreements and disagreements with other studies or reviews
Comparison 1: Types of pushing: spontaneous pushing versus directed pushing (with or without epidural analgesia)
The new finding from this review is that spontaneous pushing may decrease the duration of pushing by about 10 minutes, although there was no clear difference in the duration of the second stage between spontaneous pushing and directed pushing, while another systematic review that included only three studies (Prins 2011), found a shorter duration of labour in women who used directed pushing. The other maternal and neonatal major findings are consistent with those of this previous systematic review (Prins 2011).
Comparison 2: Timing of pushing: delayed pushing versus immediate pushing (all women with epidural analgesia)
The evidence from this systematic review showed that delayed pushing increases the duration of the second stage of labour and decreases the duration of pushing. These results are consistent with the findings from four other reviews (Brancato 2008; Menez‐Orieux 2005; Roberts 2004; Tuuli 2012). The only review (Roberts 2002) that did not find a difference in the pushing time, did not include studies where data were reported as median and ranges.
This review did not find any difference in perineal laceration and episiotomy, which is consistent with the results of three other meta‐analyses (Brancato 2008; Menez‐Orieux 2005; Roberts 2004). The same consistent result from three reviews (Brancato 2008; Roberts 2002; Tuuli 2012) that showed no difference for caesarean delivery was noted in this review.
For the three reviews (Menez‐Orieux 2005; Roberts 2004; Tuuli 2012) that assessed neonatal outcomes, the evidence was not clear about the effects on these outcomes. One review (Tuuli 2012), highlighted the results of a large study (Fraser 2000b) that found a significantly higher rate of abnormal pH with delayed pushing, which corroborates our results.
This review showed a slight increase in spontaneous vaginal birth with the use of delayed pushing and this finding was consistent with the results from the previous reviews. Three reviews (Brancato 2008; Menez‐Orieux 2005; Roberts 2004) found the delayed pushing group was more likely to have spontaneous vaginal delivery. In two reviews (Menez‐Orieux 2005; Roberts 2002), it is not clear which studies were included in the meta‐analysis and the other review (Brancato 2008), included only seven studies, which differs from our review that included 13 studies for this comparison. The fourth review (Tuuli 2012), only noted this outcome increase in the delayed pushing group when lower quality studies were included.
There was no clear difference in the risk of instrumental delivery between groups found in this review. Two reviews (Brancato 2008; Menez‐Orieux 2005), found a lower risk of instrumental delivery for the delayed pushing group and one review (Roberts 2004), found a decrease in instrumental delivery only when the subgroup of rotational or midpelvic instrumental (RR 0.69; 95% CI 0.55 to 0.87) was considered. However, their analysis considered data from the Fraser study (Fraser 2000b), which included midpelvic forceps, midpelvic vacuum and manual rotation and included one trial that showed no difference (Mc Queen 1977). This trial (Mc Queen 1977) was excluded from our review (see (Excluded studies). In contrast, our analysis considered Fraser 2000b data only for midpelvic forceps and also included another trial (Maresh 1983) not included in Roberts 2004 review.

Study flow diagram.

'Risk of bias' graph: review authors' judgements about each risk of bias item presented as percentages across all included studies.

'Risk of bias' summary: review authors' judgements about each risk of bias item for each included study.

Funnel plot of comparison 2: Delayed pushing versus immediate pushing (all women with epidural), outcome: 2.10 Instrumental delivery.

Funnel plot of comparison 2: Delayed pushing versus immediate pushing (all women with epidural), outcome: 2.1 Duration of second stage.

Funnel plot of comparison 2: Delayed pushing versus immediate pushing (all women with epidural), outcome: 2.7 Duration of Pushing.

Funnel plot of comparison 2: Delayed pushing versus immediate pushing (all women with epidural), outcome: 2.9 Spontaneous vaginal delivery.
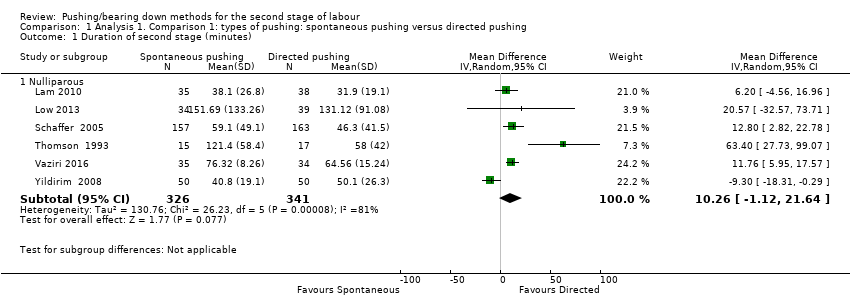
Comparison 1 Analysis 1. Comparison 1: types of pushing: spontaneous pushing versus directed pushing, Outcome 1 Duration of second stage (minutes).

Comparison 1 Analysis 1. Comparison 1: types of pushing: spontaneous pushing versus directed pushing, Outcome 2 Perineal laceration (3rd or 4th degree).

Comparison 1 Analysis 1. Comparison 1: types of pushing: spontaneous pushing versus directed pushing, Outcome 3 Episiotomy.

Comparison 1 Analysis 1. Comparison 1: types of pushing: spontaneous pushing versus directed pushing, Outcome 4 Admission to neonatal intensive care.
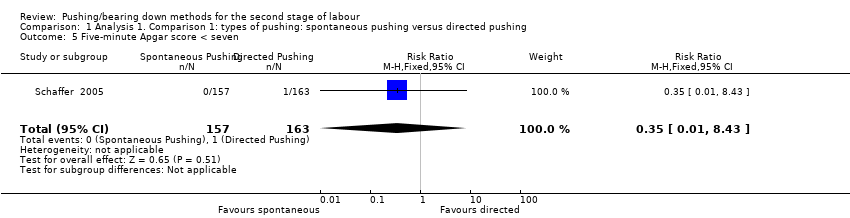
Comparison 1 Analysis 1. Comparison 1: types of pushing: spontaneous pushing versus directed pushing, Outcome 5 Five‐minute Apgar score < seven.

Comparison 1 Analysis 1. Comparison 1: types of pushing: spontaneous pushing versus directed pushing, Outcome 6 Duration of pushing (minutes).
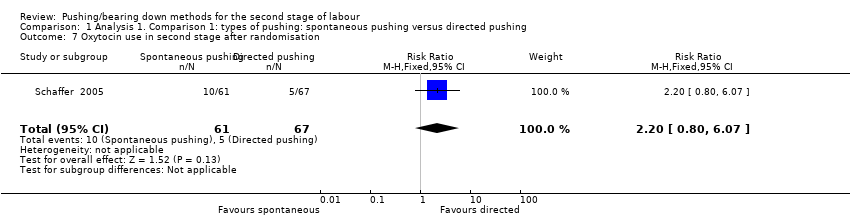
Comparison 1 Analysis 1. Comparison 1: types of pushing: spontaneous pushing versus directed pushing, Outcome 7 Oxytocin use in second stage after randomisation.

Comparison 1 Analysis 1. Comparison 1: types of pushing: spontaneous pushing versus directed pushing, Outcome 8 Spontaneous vaginal delivery.
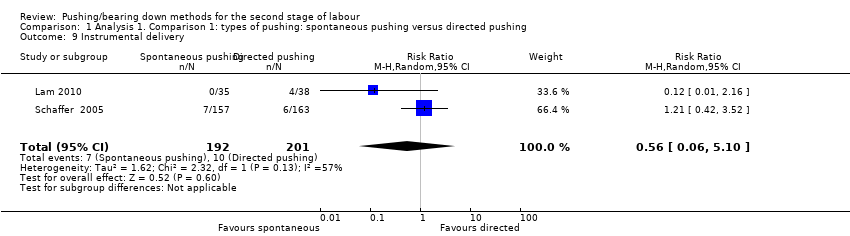
Comparison 1 Analysis 1. Comparison 1: types of pushing: spontaneous pushing versus directed pushing, Outcome 9 Instrumental delivery.

Comparison 1 Analysis 1. Comparison 1: types of pushing: spontaneous pushing versus directed pushing, Outcome 10 Caesarean delivery.

Comparison 1 Analysis 1. Comparison 1: types of pushing: spontaneous pushing versus directed pushing, Outcome 11 Fatigue after delivery.
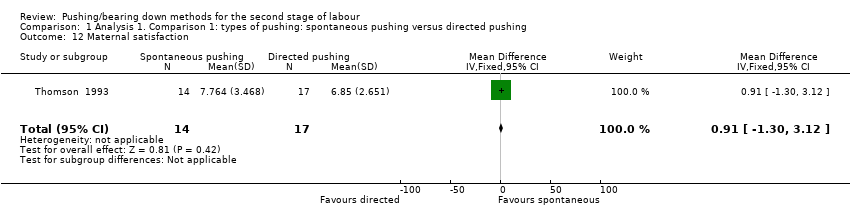
Comparison 1 Analysis 1. Comparison 1: types of pushing: spontaneous pushing versus directed pushing, Outcome 12 Maternal satisfaction.
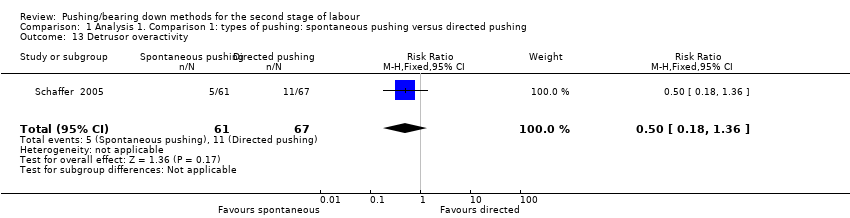
Comparison 1 Analysis 1. Comparison 1: types of pushing: spontaneous pushing versus directed pushing, Outcome 13 Detrusor overactivity.
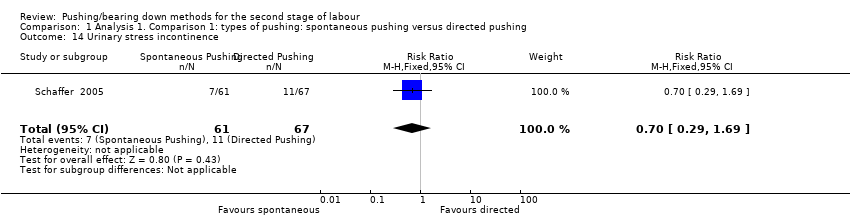
Comparison 1 Analysis 1. Comparison 1: types of pushing: spontaneous pushing versus directed pushing, Outcome 14 Urinary stress incontinence.

Comparison 1 Analysis 1. Comparison 1: types of pushing: spontaneous pushing versus directed pushing, Outcome 15 Low umbilical cord blood.

Comparison 1 Analysis 1. Comparison 1: types of pushing: spontaneous pushing versus directed pushing, Outcome 16 Delivery room resuscitation.
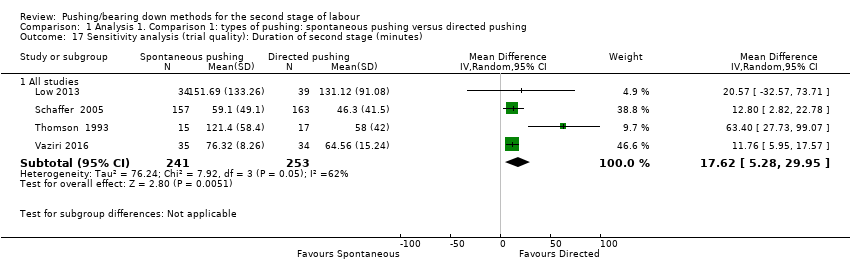
Comparison 1 Analysis 1. Comparison 1: types of pushing: spontaneous pushing versus directed pushing, Outcome 17 Sensitivity analysis (trial quality): Duration of second stage (minutes).
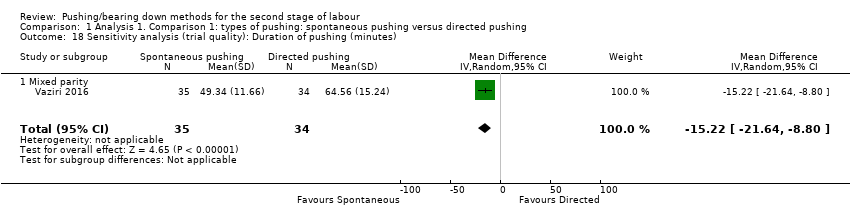
Comparison 1 Analysis 1. Comparison 1: types of pushing: spontaneous pushing versus directed pushing, Outcome 18 Sensitivity analysis (trial quality): Duration of pushing (minutes).

Comparison 2 Analysis 2. Comparison 2: timing of pushing: delayed pushing versus immediate pushing (all women with epidural), Outcome 1 Duration of second stage (minutes).

Comparison 2 Analysis 2. Comparison 2: timing of pushing: delayed pushing versus immediate pushing (all women with epidural), Outcome 2 Perineal Laceration (3rd or 4th degree).
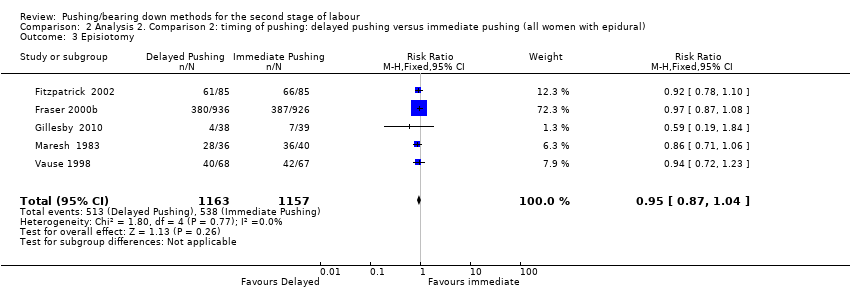
Comparison 2 Analysis 2. Comparison 2: timing of pushing: delayed pushing versus immediate pushing (all women with epidural), Outcome 3 Episiotomy.

Comparison 2 Analysis 2. Comparison 2: timing of pushing: delayed pushing versus immediate pushing (all women with epidural), Outcome 4 Admission to neonatal intensive care.

Comparison 2 Analysis 2. Comparison 2: timing of pushing: delayed pushing versus immediate pushing (all women with epidural), Outcome 5 Five‐minute Apgar score < seven.

Comparison 2 Analysis 2. Comparison 2: timing of pushing: delayed pushing versus immediate pushing (all women with epidural), Outcome 6 Duration of pushing (minutes).

Comparison 2 Analysis 2. Comparison 2: timing of pushing: delayed pushing versus immediate pushing (all women with epidural), Outcome 7 Oxytocin use in second stage after randomisation.

Comparison 2 Analysis 2. Comparison 2: timing of pushing: delayed pushing versus immediate pushing (all women with epidural), Outcome 8 Spontaneous vaginal delivery.

Comparison 2 Analysis 2. Comparison 2: timing of pushing: delayed pushing versus immediate pushing (all women with epidural), Outcome 9 Instrumental delivery.
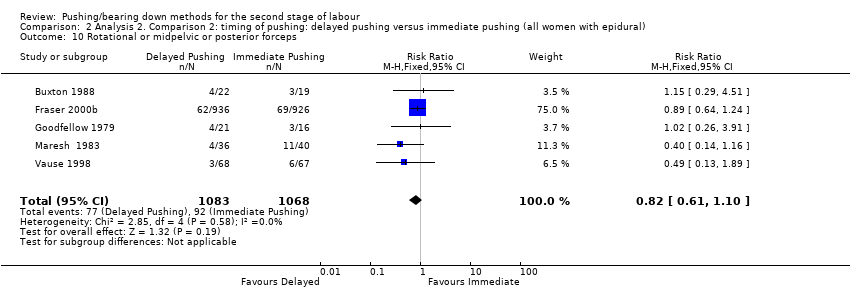
Comparison 2 Analysis 2. Comparison 2: timing of pushing: delayed pushing versus immediate pushing (all women with epidural), Outcome 10 Rotational or midpelvic or posterior forceps.

Comparison 2 Analysis 2. Comparison 2: timing of pushing: delayed pushing versus immediate pushing (all women with epidural), Outcome 11 Caesarean delivery.
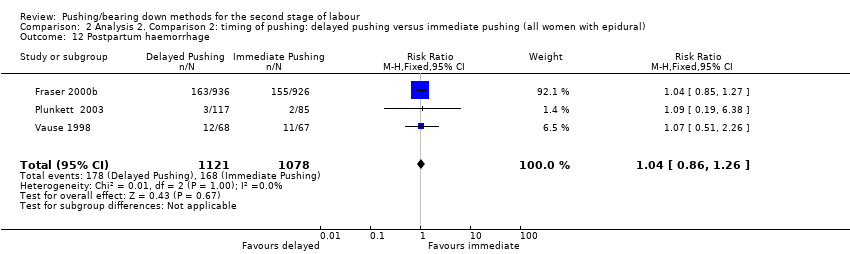
Comparison 2 Analysis 2. Comparison 2: timing of pushing: delayed pushing versus immediate pushing (all women with epidural), Outcome 12 Postpartum haemorrhage.

Comparison 2 Analysis 2. Comparison 2: timing of pushing: delayed pushing versus immediate pushing (all women with epidural), Outcome 13 Fatigue after delivery.

Comparison 2 Analysis 2. Comparison 2: timing of pushing: delayed pushing versus immediate pushing (all women with epidural), Outcome 14 Maternal satisfaction.

Comparison 2 Analysis 2. Comparison 2: timing of pushing: delayed pushing versus immediate pushing (all women with epidural), Outcome 15 Dyspareunia.
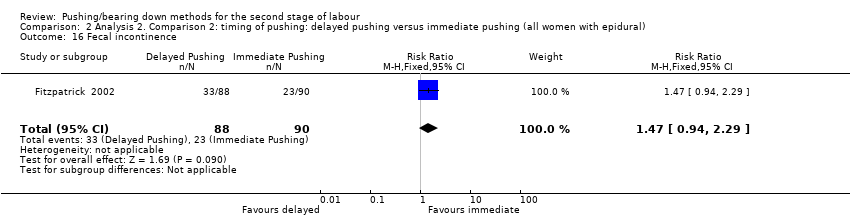
Comparison 2 Analysis 2. Comparison 2: timing of pushing: delayed pushing versus immediate pushing (all women with epidural), Outcome 16 Fecal incontinence.

Comparison 2 Analysis 2. Comparison 2: timing of pushing: delayed pushing versus immediate pushing (all women with epidural), Outcome 17 Low umbilical cord pH.
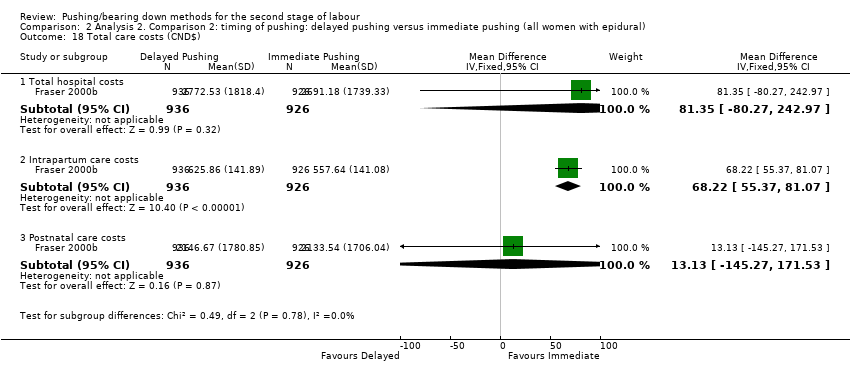
Comparison 2 Analysis 2. Comparison 2: timing of pushing: delayed pushing versus immediate pushing (all women with epidural), Outcome 18 Total care costs (CND$).

Comparison 2 Analysis 2. Comparison 2: timing of pushing: delayed pushing versus immediate pushing (all women with epidural), Outcome 19 Sensitivity analysis (trial quality): Duration of second stage (minutes).

Comparison 2 Analysis 2. Comparison 2: timing of pushing: delayed pushing versus immediate pushing (all women with epidural), Outcome 20 Sensitivity analysis (trial quality): Duration of pushing (minutes).

Comparison 2 Analysis 2. Comparison 2: timing of pushing: delayed pushing versus immediate pushing (all women with epidural), Outcome 21 Sensitivity analysis (median and IQR): Duration of second stage (minutes).

Comparison 2 Analysis 2. Comparison 2: timing of pushing: delayed pushing versus immediate pushing (all women with epidural), Outcome 22 Sensitivity analysis (median and IQR): Duration of pushing (minutes).
| Spontaneous pushing compared to directed pushing for the second stage of labour (types of pushing) | ||||||
| Patient or population: women in the second stage of labour | ||||||
| Outcomes | Anticipated absolute effects* (95% CI) | Relative effect | № of participants | Quality of the evidence | Comments | |
| Risk with directed pushing | Risk with spontaneous pushing | |||||
| Duration of second stage (minutes) | The mean duration of second stage (minutes) was 0 | MD 10.26 higher | ‐ | 667 | ⊕⊝⊝⊝ | |
| Perineal laceration (3rd or 4th degree) | Study population | RR 0.87 | 320 | ⊕⊕⊝⊝ | ||
| 110 per 1000 | 96 per 1000 | |||||
| Admission to neonatal intensive care | Study population | RR 1.08 | 393 | ⊕⊝⊝⊝ | ||
| 20 per 1000 | 21 per 1000 | |||||
| Hypoxic ischaemic encephalopathy | Study population | ‐ | (0 study) | ‐ | Outcome not reported in the included studies under this comparison. | |
| see comment | see comment | |||||
| 5‐minute Apgar score < 7 | Study population | RR 0.35 | 320 | ⊕⊝⊝⊝ | ||
| 6 per 1000 | 2 per 1000 | |||||
| Duration of pushing (minutes) | The mean duration of pushing (minutes) was 0 | MD 9.76 lower | ‐ | 169 | ⊕⊝⊝⊝ | |
| Spontaneous vaginal delivery | Study population | RR 1.01 | 688 | ⊕⊕⊕⊝ | ||
| 922 per 1000 | 932 per 1000 | |||||
| *The risk in the intervention group (and its 95% confidence interval) is based on the assumed risk in the comparison group and the relative effect of the intervention (and its 95% CI). | ||||||
| GRADE Working Group grades of evidence | ||||||
| 1 Most studies contributing data had design limitations, with more than 40% of weight from studies with serious design limitations. (‐2) 2 Statistical Heterogeneity (I2>60%). Variation in size of effect. (‐1) 3 Wide confidence intervals crossing the line of no effect. (‐1) 4 One study with design limitations. (‐1) 5 Wide confidence intervals crossing the line of no effect and few events. (‐2) 6 One study contributing >40% of data had serious design limitations. One other study had design limitations. (‐2) 7 Wide confidence intervals just crossing the line of no effect and small sample size. (‐2) 8 Study contributing most data (46.9%) has design limitations, other studies have design limitations or serious design limitations. (‐1) 9 Although confidence intervals cross the line of no effect, the effect estimate is precise. (not downgraded) | ||||||
| Delayed pushing compared to immediate pushing (all women with epidural) for the second stage of labour (timing of pushing) | ||||||
| Patient or population: women in the second stage of labour with epidural in situ | ||||||
| Outcomes | Anticipated absolute effects* (95% CI) | Relative effect | № of participants | Quality of the evidence | Comments | |
| Risk with immediate pushing (all women with epidural) | Risk with delayed pushing | |||||
| Duration of second stage (minutes) | The mean duration of second stage (minutes) was 0 | MD 56.40 higher | ‐ | 3049 | ⊕⊝⊝⊝ | 1 trial contributing data for multiparous women, 1 trial included both nulliparous and multiparous women. |
| Perineal laceration (3rd or 4th degree) | Study population | RR 0.94 | 2775 | ⊕⊕⊕⊝ | 1 of the studies contributing data reported all lacerations (i.e. did not specify 3rd or 4th degree) | |
| 122 per 1000 | 115 per 1000 | |||||
| Admission to neonatal intensive care | Study population | RR 0.98 | 2197 | ⊕⊕⊝⊝ | ||
| 49 per 1000 | 48 per 1000 | |||||
| Hypoxic ischaemic encephalopathy | Study population | ‐ | (0 study) | ‐ | Outcome not reported in the included studies under this comparison. | |
| see comment | see comment | |||||
| 5‐minute Apgar score < 7 | Study population | RR 0.15 | 413 | ⊕⊝⊝⊝ | Only 1 trial contributing data. | |
| 10 per 1000 | 2 per 1000 | |||||
| Duration of pushing (minutes) | The mean duration of pushing (minutes) was 0 | MD 19.05 lower | ‐ | 2932 | ⊕⊝⊝⊝ | 1 trial contributing data for multiparous women, 1 trial included both nulliparous and multiparous women. |
| Spontaneous vaginal delivery | Study population | RR 1.07 | 3114 | ⊕⊕⊕⊝ | ||
| 713 per 1000 | 762 per 1000 | |||||
| *The risk in the intervention group (and its 95% confidence interval) is based on the assumed risk in the comparison group and the relative effect of the intervention (and its 95% CI). | ||||||
| GRADE Working Group grades of evidence | ||||||
| 1 All studies have design limitations, two studies contributing <40% have serious design limitations. (‐1) 2 Heterogeneity (I2>60%). Considerable variation in size of effect. (‐2) 3 Although confidence intervals cross the line of no effect, the effect estimate is precise. (not downgraded) 4 All studies have design limitations. (‐1) 5 Wide confidence intervals crossing the line of no effect. (‐1) 6 One study contributing data has design limitations. (‐1) 7 Wide confidence intervals crossing the line of no effect and very few events. (‐2) | ||||||
| Outcome or subgroup title | No. of studies | No. of participants | Statistical method | Effect size |
| 1 Duration of second stage (minutes) Show forest plot | 6 | Mean Difference (IV, Random, 95% CI) | Subtotals only | |
| 1.1 Nulliparous | 6 | 667 | Mean Difference (IV, Random, 95% CI) | 10.26 [‐1.12, 21.64] |
| 2 Perineal laceration (3rd or 4th degree) Show forest plot | 1 | 320 | Risk Ratio (M‐H, Fixed, 95% CI) | 0.87 [0.45, 1.66] |
| 3 Episiotomy Show forest plot | 2 | 420 | Risk Ratio (M‐H, Random, 95% CI) | 1.05 [0.60, 1.85] |
| 4 Admission to neonatal intensive care Show forest plot | 2 | 393 | Risk Ratio (M‐H, Fixed, 95% CI) | 1.08 [0.30, 3.79] |
| 5 Five‐minute Apgar score < seven Show forest plot | 1 | 320 | Risk Ratio (M‐H, Fixed, 95% CI) | 0.35 [0.01, 8.43] |
| 6 Duration of pushing (minutes) Show forest plot | 2 | 169 | Mean Difference (IV, Random, 95% CI) | ‐9.76 [‐19.54, 0.02] |
| 6.1 Mixed parity | 2 | 169 | Mean Difference (IV, Random, 95% CI) | ‐9.76 [‐19.54, 0.02] |
| 7 Oxytocin use in second stage after randomisation Show forest plot | 1 | 128 | Risk Ratio (M‐H, Fixed, 95% CI) | 2.20 [0.80, 6.07] |
| 8 Spontaneous vaginal delivery Show forest plot | 5 | 688 | Risk Ratio (M‐H, Fixed, 95% CI) | 1.01 [0.97, 1.05] |
| 9 Instrumental delivery Show forest plot | 2 | 393 | Risk Ratio (M‐H, Random, 95% CI) | 0.56 [0.06, 5.10] |
| 10 Caesarean delivery Show forest plot | 3 | 583 | Risk Ratio (M‐H, Random, 95% CI) | 0.79 [0.14, 4.39] |
| 11 Fatigue after delivery Show forest plot | 2 | 142 | Std. Mean Difference (IV, Random, 95% CI) | ‐1.14 [‐3.29, 1.02] |
| 12 Maternal satisfaction Show forest plot | 1 | 31 | Mean Difference (IV, Fixed, 95% CI) | 0.91 [‐1.30, 3.12] |
| 13 Detrusor overactivity Show forest plot | 1 | 128 | Risk Ratio (M‐H, Fixed, 95% CI) | 0.50 [0.18, 1.36] |
| 14 Urinary stress incontinence Show forest plot | 1 | 128 | Risk Ratio (M‐H, Fixed, 95% CI) | 0.70 [0.29, 1.69] |
| 15 Low umbilical cord blood Show forest plot | 1 | 320 | Risk Ratio (M‐H, Fixed, 95% CI) | 0.74 [0.24, 2.29] |
| 15.1 Arterial umbilical cord pH < 7.2 | 1 | 320 | Risk Ratio (M‐H, Fixed, 95% CI) | 0.74 [0.24, 2.29] |
| 15.2 Venous umbilical cord < 7.3 | 0 | 0 | Risk Ratio (M‐H, Fixed, 95% CI) | 0.0 [0.0, 0.0] |
| 16 Delivery room resuscitation Show forest plot | 2 | 352 | Risk Ratio (M‐H, Fixed, 95% CI) | 0.83 [0.40, 1.75] |
| 17 Sensitivity analysis (trial quality): Duration of second stage (minutes) Show forest plot | 4 | Mean Difference (IV, Random, 95% CI) | Subtotals only | |
| 17.1 All studies | 4 | 494 | Mean Difference (IV, Random, 95% CI) | 17.62 [5.28, 29.95] |
| 18 Sensitivity analysis (trial quality): Duration of pushing (minutes) Show forest plot | 1 | 69 | Mean Difference (IV, Random, 95% CI) | ‐15.22 [‐21.64, ‐8.80] |
| 18.1 Mixed parity | 1 | 69 | Mean Difference (IV, Random, 95% CI) | ‐15.22 [‐21.64, ‐8.80] |
| Outcome or subgroup title | No. of studies | No. of participants | Statistical method | Effect size |
| 1 Duration of second stage (minutes) Show forest plot | 11 | 3049 | Mean Difference (IV, Random, 95% CI) | 56.40 [42.05, 70.76] |
| 1.1 Nulliparous | 10 | 2885 | Mean Difference (IV, Random, 95% CI) | 56.12 [39.29, 72.96] |
| 1.2 Multiparous | 1 | 123 | Mean Difference (IV, Random, 95% CI) | 38.80 [29.16, 48.44] |
| 1.3 Mixed parity | 1 | 41 | Mean Difference (IV, Random, 95% CI) | 91.0 [50.37, 131.63] |
| 2 Perineal Laceration (3rd or 4th degree) Show forest plot | 7 | 2775 | Risk Ratio (M‐H, Fixed, 95% CI) | 0.94 [0.78, 1.14] |
| 3 Episiotomy Show forest plot | 5 | 2320 | Risk Ratio (M‐H, Fixed, 95% CI) | 0.95 [0.87, 1.04] |
| 4 Admission to neonatal intensive care Show forest plot | 3 | 2197 | Risk Ratio (M‐H, Fixed, 95% CI) | 0.98 [0.67, 1.41] |
| 5 Five‐minute Apgar score < seven Show forest plot | 3 | 413 | Risk Ratio (M‐H, Fixed, 95% CI) | 0.15 [0.01, 3.00] |
| 6 Duration of pushing (minutes) Show forest plot | 11 | 2932 | Mean Difference (IV, Random, 95% CI) | ‐19.05 [‐32.27, ‐5.83] |
| 6.1 Nulliparous | 10 | 2768 | Mean Difference (IV, Random, 95% CI) | ‐21.30 [‐36.87, ‐5.73] |
| 6.2 Multiparous | 1 | 123 | Mean Difference (IV, Random, 95% CI) | ‐11.35 [‐18.19, ‐4.51] |
| 6.3 Mixed parity | 1 | 41 | Mean Difference (IV, Random, 95% CI) | ‐2.0 [‐30.35, 26.35] |
| 7 Oxytocin use in second stage after randomisation Show forest plot | 2 | 177 | Risk Ratio (M‐H, Fixed, 95% CI) | 1.00 [0.79, 1.27] |
| 8 Spontaneous vaginal delivery Show forest plot | 12 | 3114 | Risk Ratio (M‐H, Fixed, 95% CI) | 1.07 [1.02, 1.11] |
| 8.1 Nulliparous | 11 | 2953 | Risk Ratio (M‐H, Fixed, 95% CI) | 1.07 [1.03, 1.12] |
| 8.2 Multiparous | 1 | 120 | Risk Ratio (M‐H, Fixed, 95% CI) | 1.11 [1.00, 1.24] |
| 8.3 Mixed parity | 1 | 41 | Risk Ratio (M‐H, Fixed, 95% CI) | 0.47 [0.22, 1.03] |
| 9 Instrumental delivery Show forest plot | 10 | 3007 | Risk Ratio (M‐H, Random, 95% CI) | 0.89 [0.74, 1.07] |
| 10 Rotational or midpelvic or posterior forceps Show forest plot | 5 | 2151 | Risk Ratio (M‐H, Fixed, 95% CI) | 0.82 [0.61, 1.10] |
| 11 Caesarean delivery Show forest plot | 9 | 2783 | Risk Ratio (M‐H, Fixed, 95% CI) | 0.83 [0.65, 1.05] |
| 12 Postpartum haemorrhage Show forest plot | 3 | 2199 | Risk Ratio (M‐H, Fixed, 95% CI) | 1.04 [0.86, 1.26] |
| 13 Fatigue after delivery Show forest plot | 1 | 73 | Mean Difference (IV, Fixed, 95% CI) | ‐6.40 [‐21.00, 8.20] |
| 14 Maternal satisfaction Show forest plot | 1 | 73 | Mean Difference (IV, Fixed, 95% CI) | 0.40 [‐7.34, 8.14] |
| 15 Dyspareunia Show forest plot | 1 | 162 | Risk Ratio (M‐H, Fixed, 95% CI) | 1.15 [0.63, 2.10] |
| 16 Fecal incontinence Show forest plot | 1 | 178 | Risk Ratio (M‐H, Fixed, 95% CI) | 1.47 [0.94, 2.29] |
| 17 Low umbilical cord pH Show forest plot | 4 | 2145 | Risk Ratio (M‐H, Fixed, 95% CI) | 2.24 [1.37, 3.68] |
| 17.1 Arterial umbilical cord pH < 7.2 | 2 | 244 | Risk Ratio (M‐H, Fixed, 95% CI) | 1.84 [0.55, 6.16] |
| 17.2 Venous umbilical cord pH < 7.3 | 1 | 41 | Risk Ratio (M‐H, Fixed, 95% CI) | 1.70 [0.44, 6.66] |
| 17.3 Arterial < 7.2 and/or venous < 7.3 umbilical cord pH | 1 | 1860 | Risk Ratio (M‐H, Fixed, 95% CI) | 2.45 [1.35, 4.43] |
| 18 Total care costs (CND$) Show forest plot | 1 | Mean Difference (IV, Fixed, 95% CI) | Subtotals only | |
| 18.1 Total hospital costs | 1 | 1862 | Mean Difference (IV, Fixed, 95% CI) | 81.35 [‐80.27, 242.97] |
| 18.2 Intrapartum care costs | 1 | 1862 | Mean Difference (IV, Fixed, 95% CI) | 68.22 [55.37, 81.07] |
| 18.3 Postnatal care costs | 1 | 1862 | Mean Difference (IV, Fixed, 95% CI) | 13.13 [‐145.27, 171.53] |
| 19 Sensitivity analysis (trial quality): Duration of second stage (minutes) Show forest plot | 10 | 2973 | Mean Difference (IV, Random, 95% CI) | 53.46 [38.82, 68.10] |
| 19.1 Nulliparous | 9 | 2809 | Mean Difference (IV, Random, 95% CI) | 52.54 [35.14, 69.93] |
| 19.2 Multiparous | 1 | 123 | Mean Difference (IV, Random, 95% CI) | 38.80 [29.16, 48.44] |
| 19.3 Mixed parity | 1 | 41 | Mean Difference (IV, Random, 95% CI) | 91.0 [50.37, 131.63] |
| 20 Sensitivity analysis (trial quality): Duration of pushing (minutes) Show forest plot | 10 | 2856 | Mean Difference (IV, Random, 95% CI) | ‐21.30 [‐34.97, ‐7.63] |
| 20.1 Nulliparous | 9 | 2692 | Mean Difference (IV, Random, 95% CI) | ‐24.25 [‐40.43, ‐8.07] |
| 20.2 Multiparous | 1 | 123 | Mean Difference (IV, Random, 95% CI) | ‐11.35 [‐18.19, ‐4.51] |
| 20.3 Mixed parity | 1 | 41 | Mean Difference (IV, Random, 95% CI) | ‐2.0 [‐30.35, 26.35] |
| 21 Sensitivity analysis (median and IQR): Duration of second stage (minutes) Show forest plot | 7 | 684 | Mean Difference (IV, Random, 95% CI) | 56.48 [34.24, 78.72] |
| 21.1 Nulliparous | 6 | 520 | Mean Difference (IV, Random, 95% CI) | 55.17 [25.33, 85.01] |
| 21.2 Multiparous | 1 | 123 | Mean Difference (IV, Random, 95% CI) | 38.80 [29.16, 48.44] |
| 21.3 Mixed parity | 1 | 41 | Mean Difference (IV, Random, 95% CI) | 91.0 [50.37, 131.63] |
| 22 Sensitivity analysis (median and IQR): Duration of pushing (minutes) Show forest plot | 6 | 531 | Mean Difference (IV, Random, 95% CI) | ‐17.22 [‐28.92, ‐5.52] |
| 22.1 Nulliparous | 5 | 367 | Mean Difference (IV, Random, 95% CI) | ‐22.51 [‐41.53, ‐3.50] |
| 22.2 Multiparous | 1 | 123 | Mean Difference (IV, Random, 95% CI) | ‐11.35 [‐18.19, ‐4.51] |
| 22.3 Mixed parity | 1 | 41 | Mean Difference (IV, Random, 95% CI) | ‐2.0 [‐30.35, 26.35] |