| Study | Location | Age | Gender | IQ | Ethnicity | SES | Inclusion criteria | Exclusion Criteria | Population |
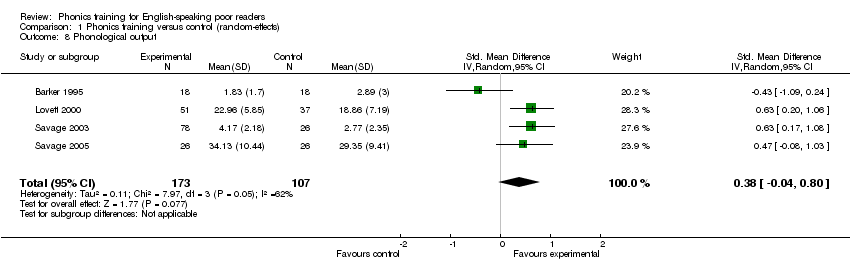
| Barker 1995 | USA | Range 6.2 to 7.8 years | Not reported | Verbal Mean = 16.5 SD = 2.36 | Not reported | Not reported | Students nominated by teachers from 2 elementary schools who were given a short series of pre‐tests assessing phonological awareness skills and basic word recognition skills. These children were then given further 2 tests and those scoring below the 40th percentile and the 50th percentile on the subsequent test were selected | None stated | First‐grade students |
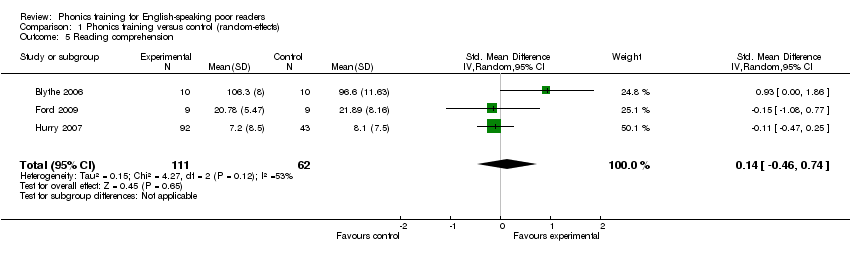
| Blythe 2006 | Australia | Mean 101.5 months | Male 75% Female 25% | FSIQ‐2 Mean 100.15 SD 9.38 | Not reported | Not reported | Children who received group‐based remedial reading instruction at school and were referred by a support teacher | After referral children completed the WISC‐III FSIQ. Those who scored below the 20th percentile were excluded | Dyslexic primary school students |
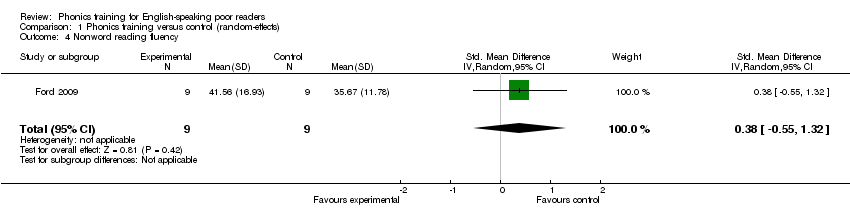
| Ford 2009 | USA | Mean 16.18 years | Male 55% Female 45% | Not reported | African‐American 22%, Hispanic 67%, white 11% | Lower | Students who were enrolled in the remedial reading programme were invited to participate. Below average reading skills were based on the ISAT | None stated | Teenagers enrolled at an alternative high school, that is, a high school for non‐special education students or students at risk of dropping out |
| Hurford 1994 | USA | Mean 80.35 months | Male 48% Female 52% | Mean 90.37 | White 92.8, African‐American 6%, Hispanic 5%, Asian‐American 0.7% | Middle | Classification data from Hurford, Darrow, Edwards, Howerton, Mote, Schauf and Coffey (1993) was used with more relaxed criteria for eligibility, that is standard scores in reading of less than 91 were included rather than less than 86 | None stated | Children at risk of reading disability |
| Hurry 2007 | UK | Range 6 to 6.6 years | Male 61% Female 39% | Range 92 to 96 | 16% spoke English as a second language | 42% of the sample were eligible for free school meals | In 63 schools the 6 poorest Year 2 readers were selected on the basis of their Diagnostic Survey (Clay, 1985) performance. Of the 22 schools using Reading Recovery, the poorest scorers were offered intervention | The remaining children, that is, those less poor at reading then those that were selected for the experimental condition, were assigned to a within school condition | Children with reading difficulties |
| Levy 1997 | Canada | Range 5.9 to 7.2 years | Male 48% Female 52% | Not reported | Not reported | Not reported | Children were given word reading tests, children that read fewer than 7 words on any of the screening tests were selected | None stated | All children from Grade 1 and senior kindergarten from 2 schools, whose parents consented to their participation |
| Levy 1999 | Canada | Mean age 7.7 years | Male 56% Female 44% | Non‐verbal (picture assembly) Experimental group mean 10.88 Control group mean 10.65 | Mixed racial distribution | Covers all SES | Children were given a word identification test (WRAT‐3), if they scored below 90 they were given another word identification test (WRMT) and if they read below half a grade below their grade level and read no more than 15 of the training words then they were included in the sample | None stated | 17 schools participated in the screening process with permission for participation obtained from the board, schools and a parent or guardian |
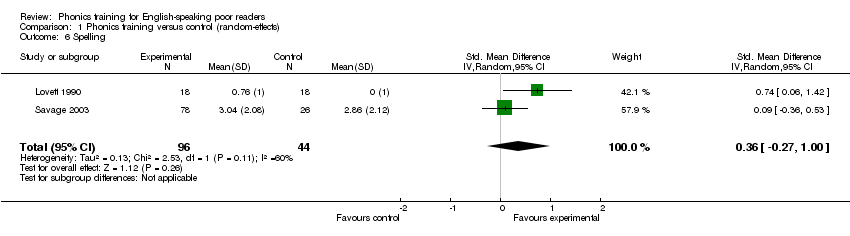
| Lovett 1990 | Canada | Mean age 8.4 years SD 1.6 Range 7 to 13 years | Male 70.4% Female 29.6% | Verbal Mean 98.4 SD 10.6 Performance Mean 106.2 SD 12.6 | Not reported | Middle | Children had to score below the 25th percentile on at least 4 of 5 reading measures used in the screening test and have at least low average intelligence | Children with English as a second language, history of extreme hyperactivity, hearing impairment, brain damage, a chronic medical condition, serious emotional disturbance, or attention deficits | Children referred to the Learning Disabilities Reading Program |
| Lovett 2000 | Canada | Mean age 9.9 years SD 1.6 Range 7 to 13 years | Male 68.1% Female 31.9% | Verbal Mean 92 SD 13.7 Range 58 to 133 Performance Mean 98.7 SD 14.3 Range = 63 ‐ 136 | Not reported | Not reported | Children needed to demonstrate a 'substantial underachievement' on 4 of the 5 reading based screening assessments | None stated | Children with severe reading disabilities that were referred to the Clinical Research Unit for remediation |
| Savage 2003 | UK | Mean age 5.9 years Range 5 to 6.3 years | Male 60% Female 40% | Not reported | Not reported | Not reported | Over 2 sessions a series of reading‐ and spelling‐based assessments were used to find the poorest readers in Year 1 of the school. The lowest performers were recruited | A teacher identifying a child as being too immature to deal with working in small groups | Children with the lowest reading performance for their age within a Local Education Authority or School District |
| Savage 2005 | UK | Not reported | Male 50% Female 50% | Not reported | Not reported | Lower | Over 2 sessions a series of reading‐ and spelling‐based assessments were used to find the poorest readers in Year 1 of the school. The lowest performers were recruited | None stated | Children with the lowest reading performance for their age within a Local Education Authority or School District |