Scolaris Content Display Scolaris Content Display

Study flow diagram.
Figuras y tablas -
Figure 1

Study flow diagram.

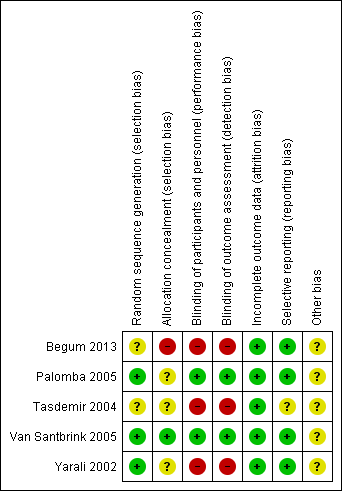
Risk of bias summary: review authors' judgements about each risk of bias item for each included study.
Figuras y tablas -
Figure 2

Risk of bias summary: review authors' judgements about each risk of bias item for each included study.

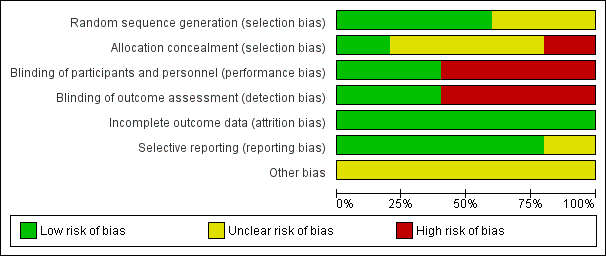
Risk of bias graph: review authors' judgements about each risk of bias item presented as percentages across all included studies.
Figuras y tablas -
Figure 3

Risk of bias graph: review authors' judgements about each risk of bias item presented as percentages across all included studies.

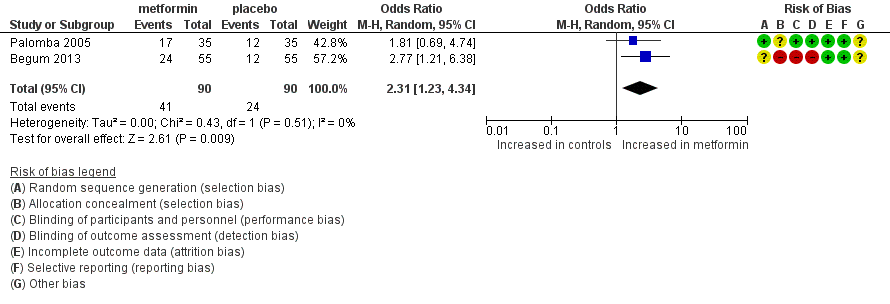
Forest plot of comparison: 1 dichotomous outcome, outcome: 1.1 live birth rate (per woman).
Figuras y tablas -
Figure 4

Forest plot of comparison: 1 dichotomous outcome, outcome: 1.1 live birth rate (per woman).

Forest plot of comparison: 1 Metformin versus placebo co‐treatment for assisted reproduction, outcome: 1.2 Multiple pregnancy rate (per woman).
Figuras y tablas -
Figure 5

Forest plot of comparison: 1 Metformin versus placebo co‐treatment for assisted reproduction, outcome: 1.2 Multiple pregnancy rate (per woman).

Forest plot of comparison: 1 Metformin versus placebo co‐treatment for assisted reproduction, outcome: 1.3 Ongoing pregnancy rate (per woman).
Figuras y tablas -
Figure 6

Forest plot of comparison: 1 Metformin versus placebo co‐treatment for assisted reproduction, outcome: 1.3 Ongoing pregnancy rate (per woman).

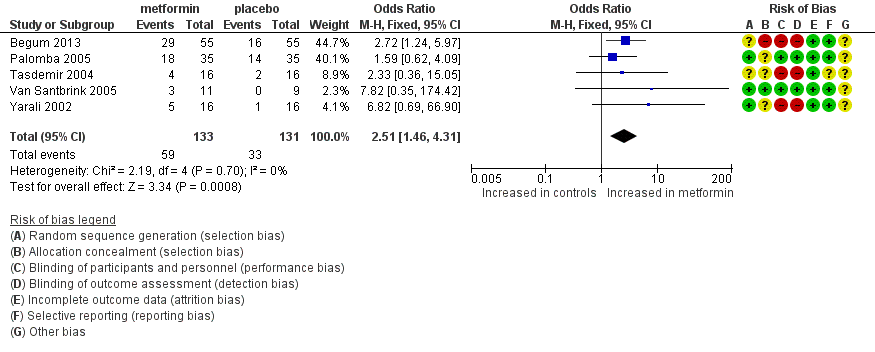
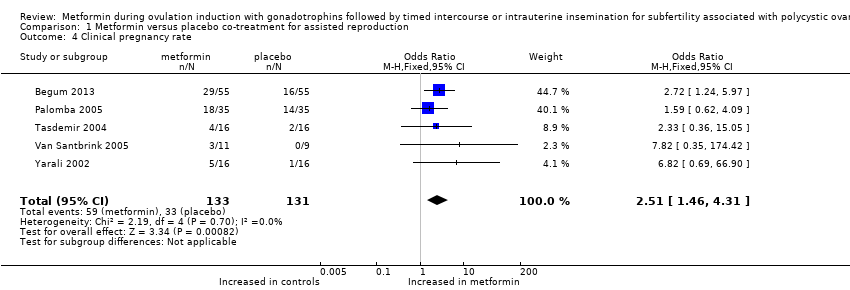
Forest plot of comparison: 1 Metformin versus placebo co‐treatment for assisted reproduction, outcome: 1.4 Clinical pregnancy rate.
Figuras y tablas -
Figure 7

Forest plot of comparison: 1 Metformin versus placebo co‐treatment for assisted reproduction, outcome: 1.4 Clinical pregnancy rate.

Comparison 1 Metformin versus placebo co‐treatment for assisted reproduction, Outcome 1 Live birth rate (per woman).
Figuras y tablas -
Analysis 1.1

Comparison 1 Metformin versus placebo co‐treatment for assisted reproduction, Outcome 1 Live birth rate (per woman).

Comparison 1 Metformin versus placebo co‐treatment for assisted reproduction, Outcome 2 Multiple pregnancy rate (per woman).
Figuras y tablas -
Analysis 1.2

Comparison 1 Metformin versus placebo co‐treatment for assisted reproduction, Outcome 2 Multiple pregnancy rate (per woman).

Comparison 1 Metformin versus placebo co‐treatment for assisted reproduction, Outcome 3 Ongoing pregnancy rate (per woman).
Figuras y tablas -
Analysis 1.3

Comparison 1 Metformin versus placebo co‐treatment for assisted reproduction, Outcome 3 Ongoing pregnancy rate (per woman).

Comparison 1 Metformin versus placebo co‐treatment for assisted reproduction, Outcome 4 Clinical pregnancy rate.
Figuras y tablas -
Analysis 1.4

Comparison 1 Metformin versus placebo co‐treatment for assisted reproduction, Outcome 4 Clinical pregnancy rate.

Comparison 1 Metformin versus placebo co‐treatment for assisted reproduction, Outcome 5 Miscarriage rate (per clinical pregnancy).
Figuras y tablas -
Analysis 1.5

Comparison 1 Metformin versus placebo co‐treatment for assisted reproduction, Outcome 5 Miscarriage rate (per clinical pregnancy).

Comparison 1 Metformin versus placebo co‐treatment for assisted reproduction, Outcome 6 Ovulation rate (per started cycle).
Figuras y tablas -
Analysis 1.6

Comparison 1 Metformin versus placebo co‐treatment for assisted reproduction, Outcome 6 Ovulation rate (per started cycle).

Comparison 1 Metformin versus placebo co‐treatment for assisted reproduction, Outcome 7 OHSS rate (per woman).
Figuras y tablas -
Analysis 1.7

Comparison 1 Metformin versus placebo co‐treatment for assisted reproduction, Outcome 7 OHSS rate (per woman).

Comparison 1 Metformin versus placebo co‐treatment for assisted reproduction, Outcome 8 Cycle cancellation rate (per started cycle).
Figuras y tablas -
Analysis 1.8

Comparison 1 Metformin versus placebo co‐treatment for assisted reproduction, Outcome 8 Cycle cancellation rate (per started cycle).

Comparison 1 Metformin versus placebo co‐treatment for assisted reproduction, Outcome 9 Adverse effects.
Figuras y tablas -
Analysis 1.9

Comparison 1 Metformin versus placebo co‐treatment for assisted reproduction, Outcome 9 Adverse effects.

Comparison 1 Metformin versus placebo co‐treatment for assisted reproduction, Outcome 10 FSH dose per cycle.
Figuras y tablas -
Analysis 1.10

Comparison 1 Metformin versus placebo co‐treatment for assisted reproduction, Outcome 10 FSH dose per cycle.

Comparison 1 Metformin versus placebo co‐treatment for assisted reproduction, Outcome 11 Duration of stimulation days per cycle.
Figuras y tablas -
Analysis 1.11

Comparison 1 Metformin versus placebo co‐treatment for assisted reproduction, Outcome 11 Duration of stimulation days per cycle.

Summary of findings for the main comparison. Metformin versus placebo co‐treatment for assisted reproduction for subfertility associated with polycystic ovary syndrome

Metformin versus placebo co‐treatment for assisted reproduction for subfertility associated with polycystic ovary syndrome

Patient or population: patients with subfertility associated with polycystic ovary syndrome
Settings: outpatient
Intervention: metformin vs placebo co‐treatment for assisted reproduction

Outcomes

Illustrative comparative risks* (95% CI)

Relative effect
(95% CI)

Number of participants
(studies)

Quality of the evidence
(GRADE)

Comments

Assumed risk

Corresponding risk

Placebo co‐treatment

Metformin co‐treatment

Live birth rate (per woman)
Follow‐up: 3‐6 months

267 per 1000

457 per 1000

190 more per 1000 (42 to 345)

OR 2.31
(1.24 to 4.33)

180
(2 studies)

⊕⊕⊝⊝
Lowa

Multiple pregnancy rate (per woman)

52 per 1000

26 per 1000

23 fewer per 1000 (44 fewer to 25 more)

OR 0.55

(0.15 to 1.95)

232
(4 studies)

⊕⊕⊝⊝
Lowa,b

Ongoing pregnancy rate (per woman)

217 per 1000

393 per 1000

189 more per 1000 (57 to 336)

OR 2.46
(1.36 to 4.46)

232
(4 studies)

⊕⊕⊝⊝
Lowa

Clinical pregnancy rate (per woman)

252 per 1000

444 per 1000

206 more per 1000 (78 to 340)

OR 2.51
(1.46 to 4.31)

264
(5 studies)

⊕⊕⊝⊝
Lowa

*The basis for the assumed risk (e.g. median control group risk across studies) is provided in footnotes. The corresponding risk (and its 95% confidence interval) is based on assumed risk in the comparison group and the relative effect of the intervention (and its 95% CI).
CI: confidence interval; OR: odds ratio.

GRADE Working Group grades of evidence.
High quality: Further research is very unlikely to change our confidence in the estimate of effect.
Moderate quality: Further research is likely to have an important impact on our confidence in the estimate of effect and may change the estimate.
Low quality: Further research is very likely to have an important impact on our confidence in the estimate of effect and is likely to change the estimate.
Very low quality: We are very uncertain about the estimate.

aLimited sample size, limited precision, lack of blinding of participants and of outcome assessors.
bMultiple pregnancy had a very low incidence.

Figuras y tablas -
Summary of findings for the main comparison. Metformin versus placebo co‐treatment for assisted reproduction for subfertility associated with polycystic ovary syndrome
Comparison 1. Metformin versus placebo co‐treatment for assisted reproduction

Outcome or subgroup title

No. of studies

No. of participants

Statistical method

Effect size

1 Live birth rate (per woman) Show forest plot

2

180

Odds Ratio (M‐H, Random, 95% CI)

2.31 [1.23, 4.34]

2 Multiple pregnancy rate (per woman) Show forest plot

4

232

Odds Ratio (M‐H, Fixed, 95% CI)

0.55 [0.15, 1.95]

3 Ongoing pregnancy rate (per woman) Show forest plot

4

232

Odds Ratio (M‐H, Fixed, 95% CI)

2.46 [1.36, 4.46]

4 Clinical pregnancy rate Show forest plot

5

264

Odds Ratio (M‐H, Fixed, 95% CI)

2.51 [1.46, 4.31]

5 Miscarriage rate (per clinical pregnancy) Show forest plot

3

84

Odds Ratio (M‐H, Fixed, 95% CI)

0.62 [0.19, 2.01]

6 Ovulation rate (per started cycle) Show forest plot

3

Odds Ratio (M‐H, Fixed, 95% CI)

Totals not selected

7 OHSS rate (per woman) Show forest plot

2

180

Odds Ratio (M‐H, Fixed, 95% CI)

0.32 [0.01, 8.23]

8 Cycle cancellation rate (per started cycle) Show forest plot

4

Odds Ratio (M‐H, Fixed, 95% CI)

Totals not selected

9 Adverse effects Show forest plot

2

90

Odds Ratio (M‐H, Fixed, 95% CI)

1.78 [0.39, 8.09]

10 FSH dose per cycle Show forest plot

4

Mean Difference (IV, Random, 95% CI)

Totals not selected

11 Duration of stimulation days per cycle Show forest plot

5

Mean Difference (IV, Random, 95% CI)

Totals not selected

Figuras y tablas -
Comparison 1. Metformin versus placebo co‐treatment for assisted reproduction