多嚢胞性卵巣症候群に伴う不妊症に対する、タイミング療法や人工授精を行うためにゴナドトロピンで排卵誘発中のメトホルミン投与
Abstract
Background
Clomiphene citrate (CC) is generally considered first‐line treatment in women with anovulation due to polycystic ovary syndrome (PCOS). Ovulation induction with follicle‐stimulating hormone (FSH; gonadotrophins) is second‐line treatment for women who do not ovulate or conceive while taking CC. Metformin may increase the effectiveness of ovulation induction with gonadotrophins and may promote safety by preventing multiple pregnancy.
Objectives
To determine the effectiveness and safety of metformin co‐treatment during ovulation induction with gonadotrophins with respect to rates of live birth and multiple pregnancy in women with PCOS.
Search methods
We searched the Cochrane Gynaecology and Fertility (CGF) Group specialised register, the Cochrane Central Register of Controlled Trials (CENTRAL), MEDLINE, Embase, PsycINFO and the Cumulative Index to Nursing and Allied Health Literature (CINAH) on 8 June 2016, and the reference lists of included and other relevant studies. We searched ongoing trials registries in the World Health Organization (WHO) portal and on clinicaltrials.gov on 4 September 2016.
Selection criteria
We included randomised controlled trials (RCTs) reporting data on comparison of clinical outcomes in women with PCOS undergoing ovulation induction with gonadotrophins plus metformin versus gonadotrophins alone or gonadotrophins plus placebo.
Data collection and analysis
We used standard methodological procedures recommended by Cochrane. Primary review outcomes were live birth rate and multiple pregnancy rate. Secondary outcomes were ovulation rate, clinical pregnancy rate, ovarian hyperstimulation syndrome (OHSS) rate, miscarriage rate, cycle cancellation rate and adverse effects.
Main results
We included five RCTs (with 264 women) comparing gonadotrophins plus metformin versus gonadotrophins. The gonadotrophin used was recombinant FSH in four studies and highly purified FSH in one study. Evidence was of low quality: The main limitations were serious risk of bias due to poor reporting of study methods and blinding of participants and outcome assessors.
Live birth
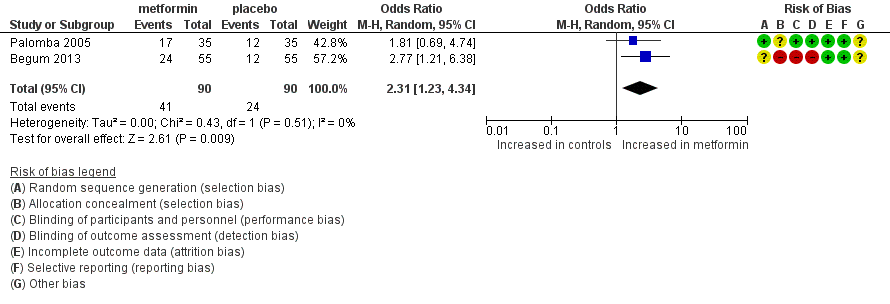
Metformin plus FSH was associated with a higher cumulative live birth rate when compared with FSH (odds ratio (OR) 2.31, 95% confidence interval (CI) 1.23 to 4.34; two RCTs, n = 180; I2 = 0%; low‐quality evidence). This suggests that if the chance of live birth after FSH is assumed to be 27%, then the chance after addition of metformin would be between 32% and 60%.
Other pregnancy outcomes
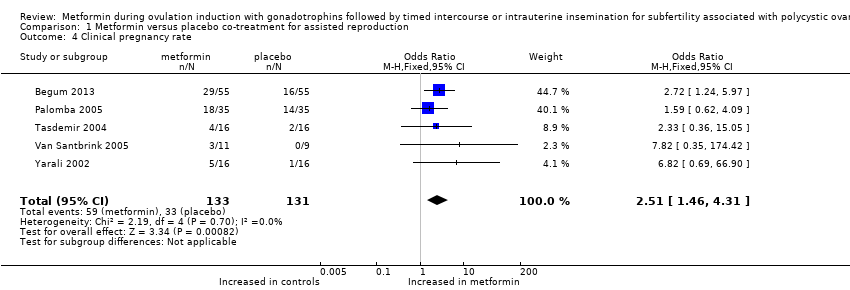
Metformin use was associated with a higher ongoing pregnancy rate (OR 2.46, 95% CI 1.36 to 4.46; four RCTs, n = 232; I2 = 0%; low‐quality evidence) and a higher clinical pregnancy rate (OR 2.51, 95% CI 1.46 to 4.31; five RCTs, n = 264; I2 = 0%; low‐quality evidence).
Multiple pregnancy
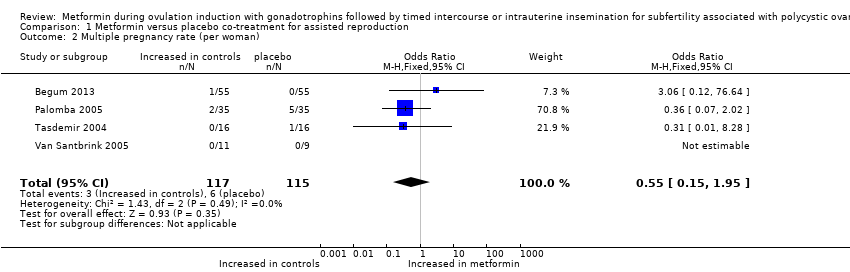
Results showed no evidence of a difference in multiple pregnancy rates between metformin plus FSH and FSH (OR 0.55, 95% CI 0.15 to 1.95; four RCTs, n = 232; I2 = 0%; low‐quality evidence) and no evidence of a difference in rates of miscarriage or OHSS.
Other adverse effects
Evidence was inadequate as the result of limited available data on adverse events after metformin compared with after no metformin (OR 1.78, 95% CI 0.39 to 8.09; two RCTs, n = 91; I2 = 0%; very low‐quality evidence).
Authors' conclusions
Preliminary evidence suggests that metformin may increase the live birth rate among women undergoing ovulation induction with gonadotrophins. At this moment, evidence is insufficient to show an effect of metformin on multiple pregnancy rates and adverse events. Additional trials are necessary before we can provide further conclusions that may affect clinical practice.
PICO
一般語訳
多嚢胞性卵巣症候群の女性における、ゴナドトロピンによる排卵誘発中のメトホルミン
レビューの論点:コクラン・レビューの著者は、メトホルミンを追加することで、ゴナドトロピンによる排卵誘発の効果が高まるかどうかを明らかにしたいと考えた。
背景:多嚢胞性卵巣症候群(PCOS)の女性は、排卵がない、または排卵回数が減少することにより、妊娠の可能性が低くなり、医学的な治療が必要となる。クロミフェンクエン酸塩により約80%の女性が排卵でき、50%の女性が妊娠すると言われている。残りの女性は、卵巣に作用して排卵を促すホルモンであるゴナドトロピンを服用することがある。インスリン抵抗性と無排卵の関連性から、メトホルミンの添加により排卵誘発効果が高まるのではないかという仮説が立てられた。
研究の特性:PCOSの女性が排卵誘発のためにゴナドトロピン治療を受けた場合の5件のランダム化比較試験を対象とした。このレビューは、排卵誘発のために、ゴナドトロピンにメトホルミンを加えた場合と、ゴナドトロピンにプラセボを加えた場合を比較した。エビデンスは2016年7月までのものである。
主な結果:264人を対象とした5件の研究を対象とした。エビデンスの質は非常に低度と評価した。メトホルミンとプラセボの間で多胎妊娠のリスクに差があるというエビデンスは得られなかったが、メトホルミンの方が出生、継続的な妊娠、臨床的な妊娠の割合が高いことがわかった。
エビデンスの質:出生、継続的なの妊娠、臨床的な妊娠、多胎妊娠については、エビデンスの質は低度だった。エビデンスの限界としては、試験方法の報告が不十分であること、研究参加者およびアウトカム評価者の盲検化が不十分であることなどが挙げられる。
Authors' conclusions
Summary of findings
| Metformin versus placebo co‐treatment for assisted reproduction for subfertility associated with polycystic ovary syndrome | ||||||
| Patient or population: patients with subfertility associated with polycystic ovary syndrome | ||||||
| Outcomes | Illustrative comparative risks* (95% CI) | Relative effect | Number of participants | Quality of the evidence | Comments | |
| Assumed risk | Corresponding risk | |||||
| Placebo co‐treatment | Metformin co‐treatment | |||||
| Live birth rate (per woman) | 267 per 1000 | 457 per 1000 190 more per 1000 (42 to 345) | OR 2.31 | 180 | ⊕⊕⊝⊝ | |
| Multiple pregnancy rate (per woman) | 52 per 1000 | 26 per 1000 23 fewer per 1000 (44 fewer to 25 more) | OR 0.55 (0.15 to 1.95) | 232 | ⊕⊕⊝⊝ | |
| Ongoing pregnancy rate (per woman) | 217 per 1000 | 393 per 1000 189 more per 1000 (57 to 336) | OR 2.46 | 232 | ⊕⊕⊝⊝ | |
| Clinical pregnancy rate (per woman) | 252 per 1000 | 444 per 1000 206 more per 1000 (78 to 340) | OR 2.51 | 264 | ⊕⊕⊝⊝ | |
| *The basis for the assumed risk (e.g. median control group risk across studies) is provided in footnotes. The corresponding risk (and its 95% confidence interval) is based on assumed risk in the comparison group and the relative effect of the intervention (and its 95% CI). | ||||||
| GRADE Working Group grades of evidence. | ||||||
| aLimited sample size, limited precision, lack of blinding of participants and of outcome assessors. | ||||||
Background
Description of the condition
Polycystic ovary syndrome (PCOS) is frequently the cause of the subfertility affecting 6% to 10% of women of reproductive age (Asuncion 2000). Polycystic ovary syndrome is characterised by oligo‐ovulation, or anovulation, clinical or biochemical hyperandrogenism and the presence of polycystic ovaries ‐ or two of these three features (ESHRE/ASRM 2004). Anovulation is the absence of ovulation. Oligo‐ovulation refers to infrequent or irregular ovulation usually defined as a cycle duration longer than 36 days, or fewer than eight cycles per year. Insulin resistance is a common feature of PCOS. The exact mechanism for insulin resistance and impaired glucose metabolism in PCOS remains unclear, but women may have inherited defects in insulin‐stimulated glycogen synthesis and impaired beta cell function (Hojlund 2008). In combination with hypertension and dyslipidaemia, insulin resistance may increase the risk of cardiovascular and cerebrovascular events. These risk factors are compounded by central obesity, which is present in many women with PCOS.
Description of the intervention
In women with PCOS, ovulation induction with clomiphene citrate (CC) is the first line of treatment according to most treatment guidelines. Whether ovulation induction with CC should subsequently be administered with or without metformin is an area of debate (Moll 2007; Moll 2008; NICE 2014; Tang 2012). About 30% to 40% of women do not ovulate on CC or on CC + metformin and are considered to be clomiphene citrate‐resistant. Letrozole is an alternative medication for ovulation induction in treatment‐naive women with PCOS.
Ovulation induction with gonadotropins followed by timed intercourse (TI) or intrauterine insemination (IUI) is the next therapeutic step (Moll 2007; Weiss 2015). Gonadotrophins are available as recombinant follicle‐stimulating hormone (rFSH), as highly purified urinary‐derived follicle‐stimulating hormone (FSH) and as highly purified human menopausal gonadotrophin.
Metformin may improve pregnancy chances in women undergoing ovulation induction with gonadotrophins. Potential disadvantages of administration of gonadotrophins include increased risk of multiple pregnancy and of OHSS. In ovulation induction, we target monofollicular development, but risk of multiple pregnancy is always present. This has resulted in chronic low‐dose stimulation regimens and close monitoring on ultrasonography. The goal is to not exceed the concentration of gonadotrophins above which more than one follicle will respond.
How the intervention might work
The association between insulin resistance and anovulation has led to the novel and promising therapy of insulin‐sensitising drugs for women with PCOS, in an effort to restore ovulation and enhance pregnancy rates. Among the insulin‐sensitising drugs, metformin has been studied most widely and provides the most reassuring safety profile (Nestler 2002). Metformin is an orally active, water‐soluble biguanide that is used in type 2 diabetes mellitus, is antihyperglycaemic and does not cause hypoglycaemia. It enhances insulin sensitivity in the liver, where it inhibits hepatic glucose production, and in peripheral tissue, where it increases glucose uptake and utilisation within muscle tissue (Barbieri 1986; Dunn 1995; Nardo 2001).
Why it is important to do this review
Metformin may increase the effectiveness of ovulation induction with gonadotrophins and lead to a lower required amount of gonadotrophin. On the other hand, metformin itself is not free of side effects. Therefore, we need to consider all available evidence in terms of efficacy, dosing and adverse events.
Objectives
To determine the effectiveness and safety of metformin co‐treatment during ovulation induction with gonadotrophins with respect to rates of live birth and multiple pregnancy in women with PCOS.
Methods
Criteria for considering studies for this review
Types of studies
We will include truly randomised controlled trials (RCTs) in women with PCOS undergoing gonadotrophin treatment for ovulation induction. We will not include quasi‐randomised trials. We will include cross‐over trials but will include in meta‐analyses only data from the first phase, as the cross‐over is not a valid design in this context.
Types of participants
Anovulatory women with PCOS. We defined polycystic ovary syndrome using criteria of the European Society for Human Reproduction and Embryology and the American Society for Reproductive Medicine (ESHRE/ASRM) (ESHRE/ASRM 2004). In consideration of the wide variation in diagnostic criteria used for PCOS, we included studies utilising different criteria if the definition matched ESHRE/ASRM criteria, as agreed by consensus. This consensus group recommends that diagnosis of PCOS requires that at least two of the following three criteria are met.
-
Oligo‐ovulation or anovulation (infrequent or no ovulation).
-
Clinical or biochemical (or both) signs of hyperandrogenism.
-
Polycystic ovaries observed on ultrasonography.
We excluded other causes of hyperandrogenism that mimic PCOS (such as congenital adrenal hyperplasia, Cushing’s syndrome or androgen‐secreting tumours).
Types of interventions
Metformin versus no treatment or placebo before or during ovulation induction, or both, with FSH‐containing gonadotrophins followed by timed intercourse or intrauterine insemination.
Types of outcome measures
Primary outcomes
1. Live birth, defined as delivery of a live foetus after 20 completed weeks' gestation
2. Multiple pregnancy (per woman)
Secondary outcomes
3. Ongoing pregnancy (per woman), defined as pregnancy of at least 12 weeks' gestation
4. Clinical pregnancy (per woman), defined as evidence of a gestational sac, confirmed on ultrasonography
5. Miscarriage (per clinical pregnancy), defined as involuntary loss of pregnancy before 20 weeks' gestation
6. Ovulation rate per started cycle
7. Ovarian hyperstimulation syndrome per woman, defined by reporting study authors
8. Cycle cancellation rate
9. Adverse effects, including gastrointestinal disturbance, lactic acidosis and discontinuation of therapy, as well as other adverse effects reported by study authors
10. Amount of FSH used per woman (total dose in international units (IU))
11. Duration (days) of ovarian stimulation per woman
12. Fasting insulin and glucose levels
Search methods for identification of studies
Electronic searches
We sought all relevant RCTs of metformin co‐treatment (before and during ovarian stimulation) in women with PCOS who received FSH for ovulation induction followed by timed intercourse or intrauterine insemination.
Marian Showell, Information Specialist for the Gynaecology and Fertility Group, prepared explicit search strings. We have described these search strategies in the appendices of this review.
We searched the following databases.
-
Cochrane Gynaecology and Fertility Specialised Register (Procite platform) (Appendix 1).
-
Cochrane Central Register of Controlled Trials Online (CENTRAL CRSO, Web platform) (Appendix 2).
-
MEDLINE (Ovid) (Appendix 3).
-
Embase (Ovid) (Appendix 4).
-
PsycINFO (Ovid) (Appendix 5).
-
Cumulative Index to Nursing and Allied Health Literature (CINAHL; Ebsco) (Appendix 6).
-
Ongoing trial registries on the World Health Organization (WHO) portal and on clinicaltrials.gov (searched 4 September 2016).
-
Other electronic databases, including Up‐to‐Date, Web of Science and Latin American Caribbean Health Sciences Literature (LILACS), according to a general search strategy (Appendix 7).
We applied no language restrictions, We searched databases from inception to 8 June 2016.
Searching other resources
-
We searched references of reviews and handsearched selected articles for additional relevant citations.
-
We contacted pharmaceutical companies to request additional relevant citations.
-
We searched the Open System for Information on Grey Literature in Europe (openSIGLE) database (http://opensigle.inist.fr/).
Data collection and analysis
Selection of studies
Three review authors (MvW, MN and EB) independently selected the trials included in this review. We discussed disagreements with other review authors and resolved differences by consensus. We paid particular attention to whether women in the comparison groups showed differences in terms of:
-
age;
-
body mass index (BMI);
-
duration and causes of infertility;
-
dose, timing and duration of metformin co‐treatment;
-
androgen levels (total testosterone (T), sex hormone‐binding globulin (SHBG), free androgen index (FAI));
-
fasting glucose and insulin levels; or
-
previous ovarian surgery.
For details of the screening and selection process, see Figure 1.
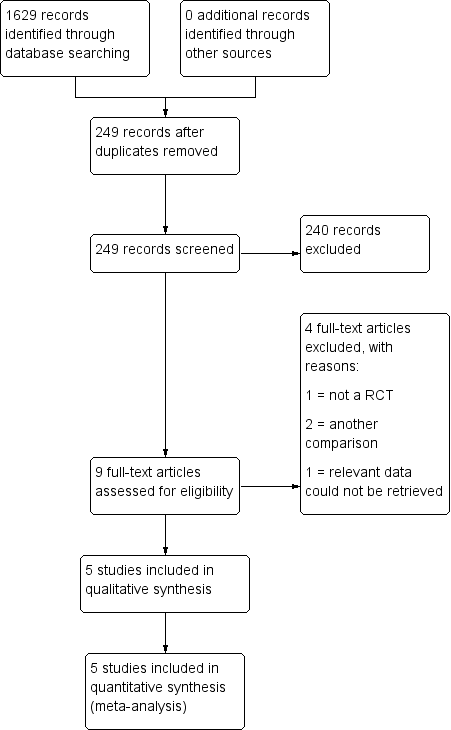
Study flow diagram.
Data extraction and management
Three review authors (MvW, MN and EB) extracted from the included studies information on trial characteristics, baseline characteristics of included women, interventions and outcomes, and we have presented this information in the Characteristics of included studies table.
Three review authors (MvW, MN and EB) independently extracted data using forms designed according to Cochrane guidelines. We sought additional information regarding trial methods by contacting the authors of trials that appeared to meet eligibility criteria but for which methodological aspects were unclear. We registered differences of opinion, discussed them with the other review authors and resolved differences by consensus.
Assessment of risk of bias in included studies
Two of three review authors (MvW, MN and EB) extracted information regarding risk of bias (threats to internal validity) under the following domains.
-
Sequence generation: evidence that an unpredictable random process was used.
-
Allocation concealment: evidence that the allocation list was not available to anyone involved in the recruitment process.
-
Blinding of participants, clinicians and outcome assessors: evidence that knowledge of allocation was not available to those involved in subsequent treatment decisions or follow‐up efforts.
-
Completeness of outcome data: evidence that losses to follow‐up were few and were comparable between groups.
-
Selective outcome reporting: evidence that major outcomes had been reported in sufficient detail to allow analysis, independent of their apparent statistical significance. When data were obtained but were not reported in the paper, we considered this to be internal reporting bias.
-
Other potential sources: evidence of miscellaneous errors or circumstances that might influence the internal validity of trial results.
We sought missing details from study authors and presented all available information in the 'Risk of bias' table that follows each included study. We resolved differences by discussion with the other review authors.
Measures of treatment effect
We summarised all binary outcomes using the Mantel‐Haenszel (MH) odds ratio (OR) and applied 95% confidence intervals (CIs). We used the fixed‐effect model to pool data.
We treated amount of gonadotrophin used, duration of ovarian stimulation, fasting insulin and glucose levels as continuous outcomes. We abstracted, calculated or requested means and standard deviations. We presented data provided per cycle per individual study (i.e. we did not pool data).
Unit of analysis issues
We expressed all outcomes per randomised woman. When only data 'per cycle' were available and the number of women was not included, analysis was not possible, and we did not include the data. We expressed the secondary outcome of miscarriage rate per clinical pregnancy.
Dealing with missing data
When information in the published report was insufficient, we attempted to contact study authors for clarification. We anticipated that trials conducted more than 10 years ago may not provide data on live birth rates for study participants. We analysed data extracted from trials on an intention‐to‐treat basis. When randomised cases were missing from outcome assessment, we contacted study authors to ask for additional data. If additional data were not available, we assumed that missing participants failed to achieve pregnancy and did not exhibit a metformin‐related side effect.
Assessment of heterogeneity
We presented clinical details of included and excluded studies in the 'Characteristics of studies' tables. Two of three review authors (MvW, MN and EB) used the Characteristics of included studies table to evaluate the presence of clinical heterogeneity. We discussed clinical heterogeneity in this review.
We used the I2 statistic to determine the presence of statistical heterogeneity of treatment effect among trials. We adopted the following broad interpretation: 0% to 40%, might not be important; 30% to 60%, may represent moderate heterogeneity; 50% to 90%, may represent substantial heterogeneity; 75% to 100%, shows considerable heterogeneity (Higgins 2011).
Clinical or statistical heterogeneity was not a reason for exclusion of a trial.
Assessment of reporting biases
We searched the Methods section to identify relevant determined outcomes. To show external reporting bias, we presented funnel plots for primary outcomes and for clinical pregnancy rates. When we found evidence of small study effects, we considered publication bias as only one of several possible explanations.
Data synthesis
We used Review Manager software to perform meta‐analyses using a fixed‐effect model in the absence of statistical heterogeneity, or a random‐effects model in the presence of statistical heterogeneity. For binary outcomes, we used odds ratios. For very sparse event rates, we planned to use Peto odds ratios. For reporting purposes, we translated primary outcomes to absolute risks. We combined results for continuous outcomes by using the mean difference.
Subgroup analysis and investigation of heterogeneity
We planned subgroup analyses to assess the effect of duration of metformin treatment before gonadotrophins were started for ovulation induction, and to assess effects of metformin dosage. We planned to stratify women treated with metformin for less than one week or longer than three months before the start of ovulation induction with gonadotrophins. We also planned stratification for women taking less than 500 mg metformin a day or more than 2000 mg a day. However, as primary outcome data were available for only three trials, we did not perform these subanalyses.
In all cases of heterogeneity shown by I2 greater than 30%, we used the random‐effects model to perform a sensitivity analysis.
Sensitivity analysis
We assessed the effect of excluding data from reports that included multiple cycles per woman.
We repeated analyses using a random‐effects model to explore whether we reached different conclusions.
We performed sensitivity analyses for primary outcomes only.
Overall quality of the body of evidence: 'Summary of findings' table
We generated a 'Summary of findings' table using GRADEPro software. This table shows the overall quality of the body of evidence for main review outcomes according to GRADE criteria (study limitations (i.e. risk of bias), consistency of effect, imprecision, indirectness and publication bias). We justified judgements about evidence quality (high, moderate or low), and we documented and incorporated these judgements into reporting of results for each outcome.
Results
Description of studies
Results of the search
Figure 1 shows the flow chart for the literature search. Please see tables of included and excluded studies for details of study methods and participants of trials included in the analysis (Characteristics of included studies; Characteristics of excluded studies).
We identified nine reports that compared a strategy with or without the addition of metformin in ovulation induction with gonadotrophins; all but one were prospective in design.
Included studies
See Characteristics of included studies.
Study design and setting
We included five RCTs that compared metformin versus placebo or no treatment during ovulation induction cycles with gonadotrophins (Begum 2013; Palomba 2005; Tasdemir 2004; Van Santbrink 2005; Yarali 2002).
The studies included in this review varied in duration of metformin pretreatment, initial gonadotrophin dose given, primary outcome measurements and methodological quality. Furthermore, investigators used different inclusion criteria, such that individual studies differed in age of participants and in numbers of previous CC cycles. We obtained details from published articles and provided this information in the Characteristics of included studies tables.
Participants
Studies included 264 CC‐resistant women. All but one study were two‐group multi‐centre randomised trials that included women with CC‐resistant PCOS. One study was a three‐group single‐centre study that compared not only gonadotrophins with or without metformin but also CC plus metformin. The definition of clomiphene resistance varied between studies. Van Santbrink 2005 and Yarali 2002 defined clomiphene resistance as failure to ovulate with incremental doses of CC up to 150 and 250 mg/d for five days, respectively. Palomba 2005 and Tasdemir 2004 defined clomiphene resistance as failure to ovulate or conceive after ovulating during six previous cycles with incremental doses of CC up to 150 mg/d for five days alone or in combination with metformin (1700 mg daily). Begum 2013 described clomiphene resistance as failure to produce any mature follicle with 150 mg CC daily for five days for two consecutive cycles. All women in this study were insulin resistant.
Interventions
All women took metformin 850 mg twice or three times per day for a known minimum duration of four weeks and maximum of three months. Researchers used low‐dose step‐up protocols for ovulation induction with gonadotrophins and reported at least clinical pregnancy rates in every study. Only Palomba 2005 included three treatment cycles, Begum 2013 included up to six ovulatory cycles and all other studies included one. One study (Palomba 2005) used highly purified FSH, and the other four studies used rFSH.
All studies presented data according to intention to treat. Of 32 women included in Yarali 2002, one woman in the placebo group and six in the metformin group ovulated spontaneously and did not undergo ovulation induction with gonadotrophins. The remaining 25 women underwent ovulation induction with FSH. Tasdemir 2004 started ovulation induction in all 32 women who were randomised. Van Santbrink 2005 randomised 20 women to metformin (n = 11) or placebo (n = 9), and 17 of these women received FSH for ovulation induction. Two women presented with an ovarian cyst on the day on which FSH treatment was due to be started (placebo group), and one woman was ovulatory with metformin only and did not start ovulation induction with FSH. Palomba 2005 randomised 70 women. No women conceived during the first 12 weeks of treatment with metformin or placebo, and all 70 women started ovulation induction with FSH for up to three cycles, for a total of 172 cycles. Begum 2013 did not describe the ovulation rate with metformin only, and everybody started with randomised treatment.
Tasdemir 2004, Van Santbrink 2005 and Palomba 2005 performed a power calculation. Van Santbrink 2005 based this calculation on primary study endpoints ‐ duration of stimulation phase and total amount of FSH used. The other trials did not state the endpoint on which power calculations were based. Yarali 2002 and Begum 2013 performed no sample size power calculations.
Outcomes
Two trials (Begum 2013; Palomba 2005) reported live birth rates, and two trials (Van Santbrink 2005; Yarali 2002) reported ongoing pregnancy rates past 12 weeks' gestation. Two trials (Begum 2013; Palomba 2005) reported live birth but no late birth loss, thus we assumed that all ongoing pregnancies became live births. Five trials (Begum 2013; Palomba 2005; Tasdemir 2004; Van Santbrink 2005; Yarali 2002) reported clinical pregnancy rates, and four studies (Begum 2013; Palomba 2005; Tasdemir 2004; Van Santbrink 2005) multiple pregnancy rates.
Excluded studies
We excluded four of the nine trials that we identified in our literature search (Cheng 2010; de Leo 1999; Raffone 2010; Shihibara 2007).
One randomised trial (de Leo 1999) compared two treatment protocols. Group A underwent two cycles of FSH stimulation, then received metformin for one month before undergoing a third treatment cycle. Group B underwent treatment with 1500 mg of metformin a day for at least one month before a single cycle of FSH stimulation. Investigators compared all cycles with FSH versus all cycles with FSH and metformin. We tried to obtain additional information from study authors but found that it was impossible to compare the first treatment cycle.
Another trial (Raffone 2010) randomly treated women with metformin 1500 mg/d orally or 4 grams myo‐inositol, a molecule that is known to have a role in activating enzymes that control glucose metabolism. Researchers performed no comparison with placebo .
One trial (Shihibara 2007) described a retrospective, non‐randomised comparison between ovulation induction with FSH, with and without metformin.
Another randomised pilot study (Cheng 2010) assessed whether the effect of coadministration of metformin, CC and human menopausal gonadotrophin (hMG) was superior to the effect of CC plus HMG in women with CC‐resistant PCOS.
Risk of bias in included studies
We judged risk of bias per included trial in the Characteristics of included studies table and showed results graphically in Figure 2 and Figure 3.

Risk of bias summary: review authors' judgements about each risk of bias item for each included study.
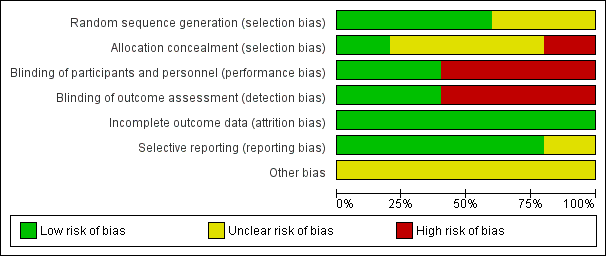
Risk of bias graph: review authors' judgements about each risk of bias item presented as percentages across all included studies.
Two of five trials (Palomba 2005; Yarali 2002) did not mention duration and timing of the trial.
Unfortunately, all trials were small, with numbers of women randomised in individual trials reported at 20 (Van Santbrink 2005), 32 (Yarali 2002), 32 (Tasdemir 2004), 70 (Palomba 2005) and 110 (Begum 2013). Although this is not a direct bias, small underpowered studies do affect strength of the evidence.
Allocation
Sequence generation
All five included studies were RCTs, but for three studies the method of randomisation was unclear (Begum 2013; Tasdemir 2004; Van Santbrink 2005). Two trials (Palomba 2005; Yarali 2002) performed randomisation by using a computer‐generated randomisation list.
Allocation concealment
Two of the five trials (Palomba 2005; Yarali 2002) adequately concealed allocation to the intervention or control group. Allocation concealment was unclear in three trials (Begum 2013; Tasdemir 2004; Van Santbrink 2005). One of these (Van Santbrink 2005) reported that investigators used sealed envelopes but did not state whether these were numbered and opaque.
Blinding
Three of five trials (Palomba 2005; Van Santbrink 2005; Yarali 2002) performed double blinding. Palomba 2005 blinded women and operators for the whole treatment period by packaging both drug and placebo in an identical form in the pharmacy and labelling them according to participant number. Van Santbrink 2005 and Yarali 2002 did not describe methods of blinding. Begum 2013 and Tasdemir 2004 did not perform blinding.
Incomplete outcome data
No trials indicated loss of follow‐up or drop‐out of included participants for pregnancy outcomes. We cannot be sure whether data were complete for all women for FSH dose and duration. We did not pool these outcomes.
Selective reporting
Selective reporting can never be completely excluded, but we received no indication from proceedings or protocols that investigators had reported other outcomes or planned to do so.
Other potential sources of bias
Within all trials, baseline characteristics appeared balanced over the two treatment groups. One trial excluded obese women (Palomba 2005).
Effects of interventions
1. Metformin versus placebo ‐ Primary outcomes
We have presented data in the Data and analyses section.
1.1 Live birth rate per woman
Two RCTs (Begum 2013; Palomba 2005) reported a live birth rate of 46% in the metformin group and 27% in the placebo group after three and six treatment cycles, respectively. Metformin use was associated with a higher live birth rate (Analysis 1.1; OR 2.31, 95% CI 1.24 to 4.33; two RCTs, n = 180; I2 = 0%; low‐quality evidence) (Figure 4). This means that for a control live birth rate of 27% after FSH, the addition of metformin would result in a live birth rate ranging between 32% and 60%.

Forest plot of comparison: 1 dichotomous outcome, outcome: 1.1 live birth rate (per woman).
Sensitivity analysis
Excluding studies with multiple cycles was not feasible because both studies that reported on live birth used multiple cycles. Pooling based on a random‐effects model resulted in a similar odds ratio of 2.31 (95% CI 1.23 to 4.34).
1.2 Multiple pregnancy rate per woman
Four randomised trials reported multiple pregnancy rates per woman ranging between zero and 14%. We found no evidence of a difference for metformin versus placebo (Analysis 1.2; OR 0.55, 95% CI 0.15 to 1.95; four RCTs, n = 232; I2 = 0%; low‐quality evidence) (Figure 5). Use of a random‐effects model resulted in a comparable odds ratio of 0.52 (95% CI 0.13 to 2.06).

Forest plot of comparison: 1 Metformin versus placebo co‐treatment for assisted reproduction, outcome: 1.2 Multiple pregnancy rate (per woman).
Metformin versus placebo ‐ Secondary outcomes
1.3 Ongoing pregnancy rate per woman
We included four RCTs for which we could pool results. Two trials (Van Santbrink 2005; Yarali 2002) reported ongoing pregnancy rates. Two trials (Palomba 2005; Begum 2013) reported live birth but no late birth loss; thus we assumed that all ongoing pregnancies became live births. Metformin use was associated with a higher ongoing pregnancy rate (Analysis 1.3; OR 2.46, 95% CI 1.36 to 4.46; four RCTs, n = 232; I2 = 0%; low‐quality evidence) (Figure 6) for metformin versus placebo.

Forest plot of comparison: 1 Metformin versus placebo co‐treatment for assisted reproduction, outcome: 1.3 Ongoing pregnancy rate (per woman).
1.4 Clinical pregnancy rate per woman
We included all five trials and pooled results. In total, the clinical pregnancy rate was 45% for women treated with metformin versus 25% for women treated with placebo. The clinical pregnancy rate ranged from 25% to 31% for women randomised to metformin, and from 0% to 13% for women randomised to placebo in three trials reporting the clinical pregnancy rate after one treatment cycle. One study (Palomba 2005) after up to three cycles reported a clinical pregnancy rate of 51% for women randomised to metformin and 40% for women randomised to placebo. One trial (Begum 2013) reported a clinical pregnancy rate after six cycles of 53% for women randomised to metformin and 29% for women randomised to FSH only. Treatment effect favoured metformin in all five trials. Pooling of data resulted in a significantly higher clinical pregnancy rate for women treated with metformin (Analysis 1.4; OR 2.51, 95% CI 1.46 to 4.31; five RCTs, n = 264; I2 = 0%; low‐quality evidence) (Figure 7).
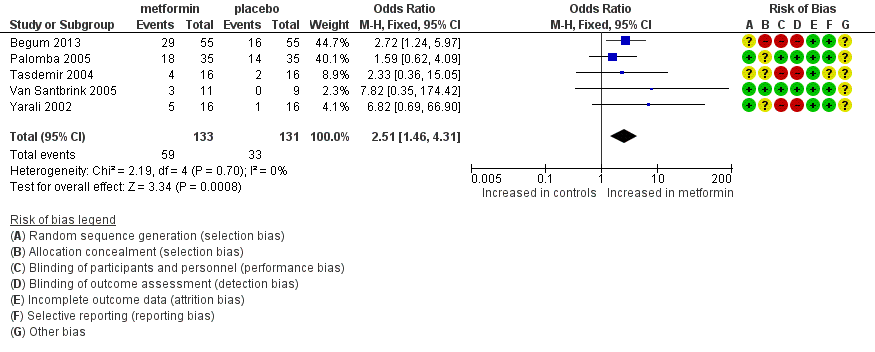
Forest plot of comparison: 1 Metformin versus placebo co‐treatment for assisted reproduction, outcome: 1.4 Clinical pregnancy rate.
1.5 Miscarriage rate per clinical pregnancy
Four trials (Begum 2013; Palomba 2005; Van Santbrink 2005; Yarali 2002) reported data on miscarriage rate for up to three to six treatment cycles. However, as no clinical pregnancies occurred in one trial in the FSH only arm, researchers could not express miscarriage per clinical pregnancy (Van Santbrink 2005). Miscarriage rates per woman ranged from zero to 40%. Although the direction of effect varied among studies, this fact did not cause significant heterogeneity. We found no evidence of a difference in miscarriage rates between metformin and placebo (Analysis 1.5; OR 0.62, 95% CI 0.19 to 2.01; three RCTs, n = 84; I2 = 0%).
1.6 Ovulation rate per started cycle
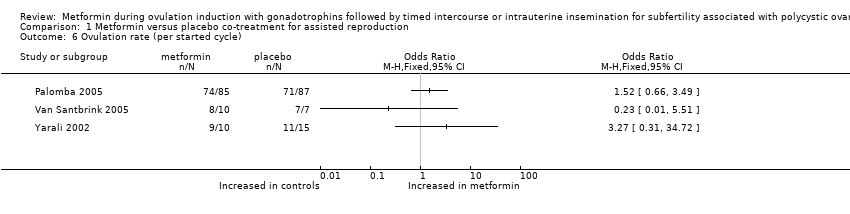
We included three randomised trials and could not pool results, as data per cycle were reported (Analysis 1.6). In total, the ovulation rate was 87% for women treated with metformin and 82% for women treated with placebo (Palomba 2005: OR 1.5, 95% CI 0.66 to 3.5; Van Santbrink 2005: OR 0.23, 95% CI 0.01 to 5.5; Yarali 2002: OR 3.3, 95% CI 0.31 to 34.7). The direction of effect varied among studies, and we found no significant differences within trials.
1.7 OHSS rate per woman
Two studies reported ovarian hyperstimulation rate. Palomba 2005 observed no cases of OHSS in the group treated with metformin and reported that one woman treated with placebo developed mild OHSS during the third treatment cycle. Begum 2013 reported that no participants in any of the groups developed OHSS (Analysis 1.7; OR 0.32, 95% CI 0.01 to 8.23; two RCTs, n = 180).
1.8 Cycle cancellation rate
Four included randomised trials reported data on cycle cancellation rate per cycle, and we could not pool data as they were reported per cycle (Analysis 1.8). One trial reported rates after up to three cycles (Palomba 2005) and cancelled 8% of cycles for women treated with metformin and 16% of cycles for women treated with placebo (OR 0.47, 95% CI 0.18 to 1.2). Another trial (Begum 2013) reported rates after up to six cycles and cancelled 3% (6/213) of cycles for women treated with metformin and 5% of cycles (14/276) for women treated with placebo. The cancellation rate ranged from zero to 25% in treatment groups after one treatment cycle (Tasdemir 2004: OR 0.20, 95% CI 0.02 to 2.3; Van Santbrink 2005: OR 4.41, 95% CI 0.18 to 107.3). We observed no significant differences within trials.
1.9 Adverse effects related to metformin use
Van Santbrink 2005 did not observe serious gastrointestinal problems during use of study medication. Palomba 2005 reported that serious adverse events did not occur, and that drug‐related adverse events were not significantly different between the two groups, at 14% (5/35) versus 9% (3/35) for women treated with metformin and placebo, respectively (two trials; OR 1.78, 95% CI 0.39 to 8.09). Tasdemir 2004 reported that dyspeptic complaints occurred but did not lead to discontinuation of therapy. Researchers did not report the number of women who presented with these complaints.
1.10 FSH dose
All five randomised studies reported the dose necessary per cycle for ovulation induction with FSH. We excluded one study (Begum 2013), as the total FSH dose did not correspond with the starting dose and stimulation protocol. We could not pool data as investigators reported data per cycle. One study reported the median dose (Palomba 2005). The mean total dose of FSH per woman ranged from 945 to 2062.5 IU per cycle in the other trials. The direction of effect favoured metformin, and the total FSH dose was lower in two trials (Van Santbrink 2005: weighted mean difference ‐2288 IU, 95% CI ‐2737 to ‐1839; Tasdemir 2004: mean difference ‐425 IU, 95% CI ‐507 to ‐342). The direction of effect favoured placebo, and the total FSH dose was lower in one trial (Palomba 2005: mean difference 173 IU, 95% CI 95 to 250). Another trial (Yarali 2002) reported that no statistically significant difference was observed (mean difference ‐455 IU, 95% CI ‐1350 to 441).
1.11 Mean duration of stimulation days
All five randomised studies reported the duration of stimulation days necessary for ovulation induction with FSH. We could not pool data as investigators reported data per cycle. One study reported the median duration of stimulation (Van Santbrink 2005) at 15 days for women treated with metformin and at 33 days for women treated with placebo. The remaining four trials reported mean values and standard deviation (Begum 2013; Tasdemir 2004; Palomba 2005; Yarali 2002). The mean duration of stimulation ranged from 11.2 to 16.0 days. The direction of effect favoured metformin in three trials that reported a shorter stimulation period (Begum 2013: mean difference ‐1.99 days, 95% CI ‐2.75 to ‐1.23; Van Santbrink 2005: mean difference ‐18 days, 95% CI ‐23 to ‐12; Tasdemir 2004: weighted mean difference ‐4.3 days, 95% CI ‐6.6 to ‐2.0). Begum 2013 reported a mean duration of stimulation of 14 days for women treated with metformin and 16 days for women treated with placebo. The direction of effect favoured placebo, and one trial had a shorter stimulation period (Palomba 2005: mean difference 3.0 days, 95% CI 1.9 to 4.1). One trial reported that results did not show a statistically significant difference (Yarali 2002: mean difference ‐2.6 days, 95% CI ‐9.9 to 4.7).
1.12 Fasting insulin and glucose levels
Three studies (Begum 2013; Palomba 2005; Tasdemir 2004) provided data on fasting insulin and glucose levels at baseline ‐ not after treatment ‐ and therefore data were not useful. None of the five studies provided data on fasting glucose levels before and after treatment. Only one study provided data on fasting insulin levels before and after treatment (Yarali 2002). Fasting insulin levels before and after treatment in the metformin group were 93 mcU/mL (standard deviation (SD) 128) and 98 mcU/mL (SD196), respectively, and in the control group 66 mcU/mL (SD 33) and 73 mcU/mL (SD 42), respectively. In view of the large standard deviation suggesting a non‐parametric distribution of data, it was decided that a mean difference would not be calculated.
Two studies described the glucose/insulin ratio before and after trials and found no differences after treatment (Van Santbrink 2005: ratio of 0.2 (SD 0.1) before and after in both groups; Yarali 2002: average ratio of 0.1 before and after in both groups).
Discussion
Summary of main results
For this systematic review, we selected studies that compared metformin versus placebo during ovulation induction with gonadotrophins in women with polycystic ovary syndrome (PCOS). All included women received a diagnosis of PCOS on the basis of Rotterdam consensus criteria. Five randomised controlled trials provided gonadotrophins plus metformin versus gonadotrophins alone in 264 subfertile women with PCOS. Metformin was associated with higher rates of live birth, ongoing pregnancy and clinical pregnancy, but we rated this evidence as low quality. We found no evidence of a difference in multiple pregnancy rates, but again we rated this evidence as low quality.
Overall completeness and applicability of evidence
All five trials that compared metformin versus placebo during ovulation induction with gonadotrophins provided data on clinical pregnancy; two trials provided data on the primary outcome live birth rate, and four trials provided data on the primary outcome multiple pregnancy.
The included patient population seems to represent the general clomiphene citrate (CC)‐resistant PCOS population. Therefore, although the quality of results is limited, they are applicable to a general CC‐resistant PCOS population undergoing ovulation induction with gonadotrophins. No studies involved a treatment‐naive PCOS population, and none examined patients after letrozole use.
Quality of the evidence
The quality of the evidence was limited. Evidence was of low quality for live birth, ongoing pregnancy, clinical pregnancy and multiple pregnancy. Only two trials provided data on the primary outcome live birth. One of these studies was not blinded and did not describe mode of randomisation. One of five included studies used a proper method of allocation concealment. Sample size in these studies was small. Three of five studies reported a sample size smaller than 32. To have power of 80% to detect a 10% difference in a control live birth rate of 30% to 40%, a study would have to include 700 to 800 women. Even when combined, the five trials identified in this review included less than a quarter of this number.
Multiple pregnancy rates ranged between 0 and 10%. Nowadays, multiple pregnancies are rare when cycles are monitored and ovulation stimulation is directed at developing a single follicle.
Heterogeneity between trials could be explained in part by differences between definitions of clomiphene resistance. Van Santbrink 2005 and Yarali 2002 defined clomiphene resistance as failure to ovulate with incremental doses of CC up to 150 and 250 mg/d for 5 days, respectively. Palomba 2005 and Tasdemir 2004 defined clomiphene resistance as failure to ovulate or conceive after ovulating during six previous cycles with incremental doses of CC up to 150 mg/d for five days alone or in combination with metformin (1700 mg daily). Begum 2013 described clomiphene resistance as failure to produce any mature follicle with 150 mg CC daily for five days for two consecutive cycles.
Potential biases in the review process
We did not explore differences between trials by performing subanalyses because of the limited number of included studies. The duration of pretreatment with metformin varied between studies. In four trials, women took 850 mg two times daily, and in another trial (Begum 2013), women took three times 500 mg daily. In Palomba 2005, investigators continued pretreatment with metformin before the start of gonadotrophin ovulation induction for three months, in Tasdemir 2004 for eight weeks, in Yarali 2002 for six weeks, in Begum 2013 for four weeks and in Van Santbrink 2005 for a maximum of 25 days. All groups continued metformin during ovulation induction with gonadotrophins, and most studies stopped treatment until the day of human chorionic gonadotropin (hCG) administration or ovulation (Tasdemir 2004; Van Santbrink 2005; Yarali 2002). Palomba 2005 stopped metformin when women conceived. Begum 2013 continued metformin until a pregnancy test was given.
Agreements and disagreements with other studies or reviews
Two other reviews evaluated the evidence for metformin plus gonadotrophins versus gonadotrophins alone in CC‐resistant women with PCOS (Moll 2007; Palomba 2014). The first review gathered live birth data from one trial only and concluded that review authors found no evidence of a difference between metformin plus gonadotrophins versus gonadotrophins (Moll 2007). The second review reached a conclusion similar to the one presented in our review, but review authors combined cycles instead of women, thus introducing a unit of analysis error (Palomba 2014).

Study flow diagram.
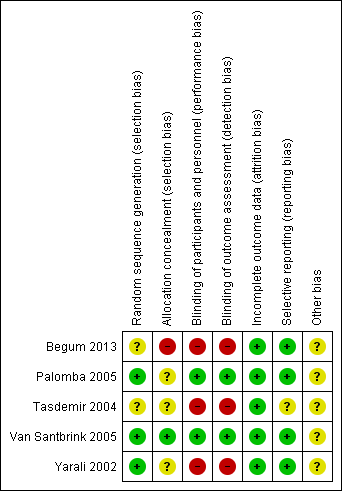
Risk of bias summary: review authors' judgements about each risk of bias item for each included study.

Risk of bias graph: review authors' judgements about each risk of bias item presented as percentages across all included studies.
Forest plot of comparison: 1 dichotomous outcome, outcome: 1.1 live birth rate (per woman).

Forest plot of comparison: 1 Metformin versus placebo co‐treatment for assisted reproduction, outcome: 1.2 Multiple pregnancy rate (per woman).

Forest plot of comparison: 1 Metformin versus placebo co‐treatment for assisted reproduction, outcome: 1.3 Ongoing pregnancy rate (per woman).

Forest plot of comparison: 1 Metformin versus placebo co‐treatment for assisted reproduction, outcome: 1.4 Clinical pregnancy rate.

Comparison 1 Metformin versus placebo co‐treatment for assisted reproduction, Outcome 1 Live birth rate (per woman).
Comparison 1 Metformin versus placebo co‐treatment for assisted reproduction, Outcome 2 Multiple pregnancy rate (per woman).

Comparison 1 Metformin versus placebo co‐treatment for assisted reproduction, Outcome 3 Ongoing pregnancy rate (per woman).
Comparison 1 Metformin versus placebo co‐treatment for assisted reproduction, Outcome 4 Clinical pregnancy rate.

Comparison 1 Metformin versus placebo co‐treatment for assisted reproduction, Outcome 5 Miscarriage rate (per clinical pregnancy).
Comparison 1 Metformin versus placebo co‐treatment for assisted reproduction, Outcome 6 Ovulation rate (per started cycle).
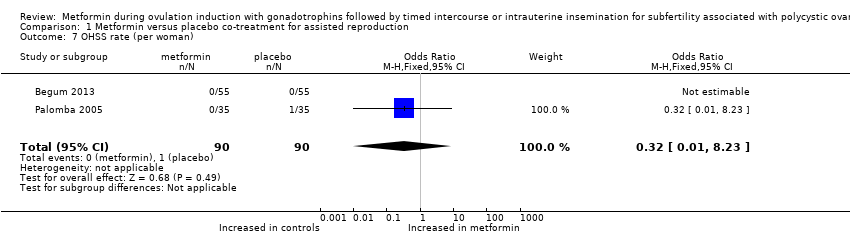
Comparison 1 Metformin versus placebo co‐treatment for assisted reproduction, Outcome 7 OHSS rate (per woman).

Comparison 1 Metformin versus placebo co‐treatment for assisted reproduction, Outcome 8 Cycle cancellation rate (per started cycle).

Comparison 1 Metformin versus placebo co‐treatment for assisted reproduction, Outcome 9 Adverse effects.
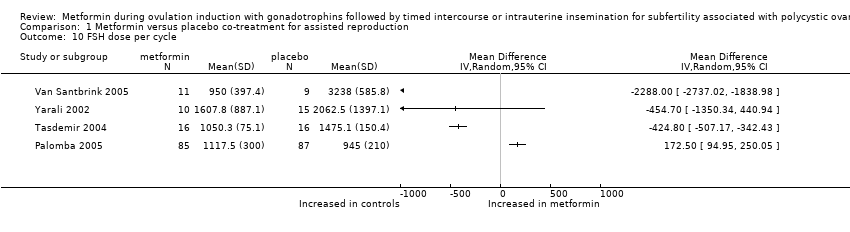
Comparison 1 Metformin versus placebo co‐treatment for assisted reproduction, Outcome 10 FSH dose per cycle.

Comparison 1 Metformin versus placebo co‐treatment for assisted reproduction, Outcome 11 Duration of stimulation days per cycle.
| Metformin versus placebo co‐treatment for assisted reproduction for subfertility associated with polycystic ovary syndrome | ||||||
| Patient or population: patients with subfertility associated with polycystic ovary syndrome | ||||||
| Outcomes | Illustrative comparative risks* (95% CI) | Relative effect | Number of participants | Quality of the evidence | Comments | |
| Assumed risk | Corresponding risk | |||||
| Placebo co‐treatment | Metformin co‐treatment | |||||
| Live birth rate (per woman) | 267 per 1000 | 457 per 1000 190 more per 1000 (42 to 345) | OR 2.31 | 180 | ⊕⊕⊝⊝ | |
| Multiple pregnancy rate (per woman) | 52 per 1000 | 26 per 1000 23 fewer per 1000 (44 fewer to 25 more) | OR 0.55 (0.15 to 1.95) | 232 | ⊕⊕⊝⊝ | |
| Ongoing pregnancy rate (per woman) | 217 per 1000 | 393 per 1000 189 more per 1000 (57 to 336) | OR 2.46 | 232 | ⊕⊕⊝⊝ | |
| Clinical pregnancy rate (per woman) | 252 per 1000 | 444 per 1000 206 more per 1000 (78 to 340) | OR 2.51 | 264 | ⊕⊕⊝⊝ | |
| *The basis for the assumed risk (e.g. median control group risk across studies) is provided in footnotes. The corresponding risk (and its 95% confidence interval) is based on assumed risk in the comparison group and the relative effect of the intervention (and its 95% CI). | ||||||
| GRADE Working Group grades of evidence. | ||||||
| aLimited sample size, limited precision, lack of blinding of participants and of outcome assessors. | ||||||
| Outcome or subgroup title | No. of studies | No. of participants | Statistical method | Effect size |
| 1 Live birth rate (per woman) Show forest plot | 2 | 180 | Odds Ratio (M‐H, Random, 95% CI) | 2.31 [1.23, 4.34] |
| 2 Multiple pregnancy rate (per woman) Show forest plot | 4 | 232 | Odds Ratio (M‐H, Fixed, 95% CI) | 0.55 [0.15, 1.95] |
| 3 Ongoing pregnancy rate (per woman) Show forest plot | 4 | 232 | Odds Ratio (M‐H, Fixed, 95% CI) | 2.46 [1.36, 4.46] |
| 4 Clinical pregnancy rate Show forest plot | 5 | 264 | Odds Ratio (M‐H, Fixed, 95% CI) | 2.51 [1.46, 4.31] |
| 5 Miscarriage rate (per clinical pregnancy) Show forest plot | 3 | 84 | Odds Ratio (M‐H, Fixed, 95% CI) | 0.62 [0.19, 2.01] |
| 6 Ovulation rate (per started cycle) Show forest plot | 3 | Odds Ratio (M‐H, Fixed, 95% CI) | Totals not selected | |
| 7 OHSS rate (per woman) Show forest plot | 2 | 180 | Odds Ratio (M‐H, Fixed, 95% CI) | 0.32 [0.01, 8.23] |
| 8 Cycle cancellation rate (per started cycle) Show forest plot | 4 | Odds Ratio (M‐H, Fixed, 95% CI) | Totals not selected | |
| 9 Adverse effects Show forest plot | 2 | 90 | Odds Ratio (M‐H, Fixed, 95% CI) | 1.78 [0.39, 8.09] |
| 10 FSH dose per cycle Show forest plot | 4 | Mean Difference (IV, Random, 95% CI) | Totals not selected | |
| 11 Duration of stimulation days per cycle Show forest plot | 5 | Mean Difference (IV, Random, 95% CI) | Totals not selected | |