Scolaris Content Display Scolaris Content Display

Flow diagram.
Figuras y tablas -
Figure 1

Flow diagram.

Risk of bias graph: review authors' judgements about each risk of bias item presented as percentages across all included studies.
Figuras y tablas -
Figure 2

Risk of bias graph: review authors' judgements about each risk of bias item presented as percentages across all included studies.

Risk of bias summary: review authors' judgements about each risk of bias item for each included study.
Figuras y tablas -
Figure 3

Risk of bias summary: review authors' judgements about each risk of bias item for each included study.

Forest plot of comparison: 1 Physical exercise versus no physical exercise, outcome: 1.1 Mortality.
Figuras y tablas -
Figure 4

Forest plot of comparison: 1 Physical exercise versus no physical exercise, outcome: 1.1 Mortality.

Forest plot of comparison: 1 Physical exercise versus no physical exercise, outcome: 1.3 QoL sensitivity analysis.
Figuras y tablas -
Figure 5

Forest plot of comparison: 1 Physical exercise versus no physical exercise, outcome: 1.3 QoL sensitivity analysis.

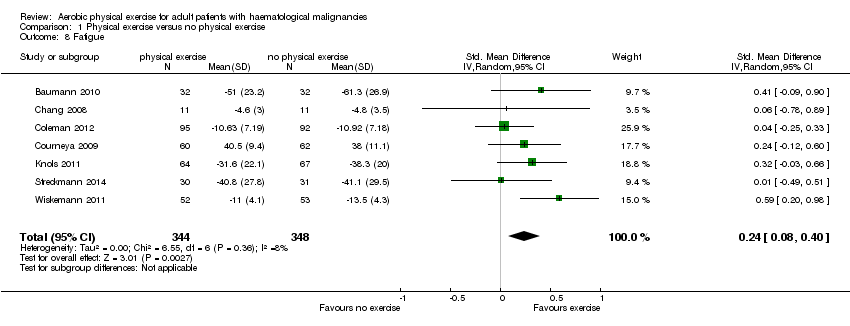
Forest plot of comparison: 1 Physical exercise versus no physical exercise, outcome: 1.8 Fatigue.
Figuras y tablas -
Figure 6

Forest plot of comparison: 1 Physical exercise versus no physical exercise, outcome: 1.8 Fatigue.

Comparison 1 Physical exercise versus no physical exercise, Outcome 1 Mortality.
Figuras y tablas -
Analysis 1.1

Comparison 1 Physical exercise versus no physical exercise, Outcome 1 Mortality.

Comparison 1 Physical exercise versus no physical exercise, Outcome 2 Quality of life (QoL).
Figuras y tablas -
Analysis 1.2

Comparison 1 Physical exercise versus no physical exercise, Outcome 2 Quality of life (QoL).

Comparison 1 Physical exercise versus no physical exercise, Outcome 3 QoL sensitivity analysis.
Figuras y tablas -
Analysis 1.3

Comparison 1 Physical exercise versus no physical exercise, Outcome 3 QoL sensitivity analysis.

Comparison 1 Physical exercise versus no physical exercise, Outcome 4 QoL SCT versus no SCT.
Figuras y tablas -
Analysis 1.4

Comparison 1 Physical exercise versus no physical exercise, Outcome 4 QoL SCT versus no SCT.

Comparison 1 Physical exercise versus no physical exercise, Outcome 5 Physical functioning/QoL.
Figuras y tablas -
Analysis 1.5

Comparison 1 Physical exercise versus no physical exercise, Outcome 5 Physical functioning/QoL.

Comparison 1 Physical exercise versus no physical exercise, Outcome 6 Depression/QoL.
Figuras y tablas -
Analysis 1.6

Comparison 1 Physical exercise versus no physical exercise, Outcome 6 Depression/QoL.

Comparison 1 Physical exercise versus no physical exercise, Outcome 7 Anxiety/QoL.
Figuras y tablas -
Analysis 1.7

Comparison 1 Physical exercise versus no physical exercise, Outcome 7 Anxiety/QoL.

Comparison 1 Physical exercise versus no physical exercise, Outcome 8 Fatigue.
Figuras y tablas -
Analysis 1.8

Comparison 1 Physical exercise versus no physical exercise, Outcome 8 Fatigue.

Comparison 1 Physical exercise versus no physical exercise, Outcome 9 Fatigue SCT versus no SCT.
Figuras y tablas -
Analysis 1.9

Comparison 1 Physical exercise versus no physical exercise, Outcome 9 Fatigue SCT versus no SCT.

Comparison 1 Physical exercise versus no physical exercise, Outcome 10 Weight.
Figuras y tablas -
Analysis 1.10

Comparison 1 Physical exercise versus no physical exercise, Outcome 10 Weight.

Comparison 1 Physical exercise versus no physical exercise, Outcome 11 Lean body mass.
Figuras y tablas -
Analysis 1.11

Comparison 1 Physical exercise versus no physical exercise, Outcome 11 Lean body mass.

Comparison 1 Physical exercise versus no physical exercise, Outcome 12 Serious adverse events (SAEs).
Figuras y tablas -
Analysis 1.12

Comparison 1 Physical exercise versus no physical exercise, Outcome 12 Serious adverse events (SAEs).

Summary of findings for the main comparison. Physical exercise versus no physical exercise for adults with haematological malignancies

Physical exercise versus no physical exercise for adults with haematological malignancies

Patient or population: Adults with haematological malignancies
Settings:
Intervention: Physical exercise versus no physical exercise

Outcomes

Illustrative comparative risks* (95% CI)

Relative effect
(95% CI)

No of Participants
(studies)

Quality of the evidence
(GRADE)

Comments

Assumed risk

Corresponding risk

Control group without exercise

Physical exercise

Overall survival
not reported

Mortality

224 per 1000

208 per 1000
(132 to 329)

RR 0.93
(0.59 to 1.47)

269
(3 studies)

⊕⊕⊕⊝
moderate1

Overall survival not reported, number of participants deceased during study or first 100 days

Quality of Life
Scale from: 0 to 1
with 1 indicating best outcome

The mean QoL in the intervention group was
0.26 standard deviations higher (better)
(0.03 to 0.49 higher)

SMD 0.26
(0.03 to 0.49)

291
(3 studies)

⊕⊕⊝⊝
low1,2

Physical functioning/QoL
Scale from: 0 to 1

with 1 indicating best outcome

The mean physical functioning/Qol in the intervention groups was
0.33 standard deviations higher (better)
(0.13 to 0.52 higher)

SMD 0.33
(0.13 to 0.52)

422
(4 studies)

⊕⊕⊕⊝
moderate2

Depression/QoL
Scale from: 0 to 1

with 1 indicating best outcome

The mean depression/qol in the intervention groups was
0.25 standard deviations higher (better)
(0 to 0.5 higher)

SMD 0.25
(0 to 0.5)

249
(3 studies)

⊕⊕⊝⊝
low1,2

Anxiety/QoL
Scale from: 0 to 1

with 1 indicating best outcome

The mean anxiety/qol in the intervention groups was
0.18 standard deviations lower (worse)
(0.64 lower to 0.28 higher)

SMD ‐0.18
(‐0.64 to 0.28)

249
(3 studies)

⊕⊕⊝⊝
low1,2

Fatigue
Scale from: 0 to 1

with 1 indicating best outcome

The mean fatigue in the intervention groups was
0.24 standard deviations higher (better)
(0.08 to 0.40 higher)

SMD 0.24
(0.08 to 0.40)

692
(7 studies)

⊕⊕⊕⊝
moderate2

Physical performance

see comment

see comment

see comment

see comment

see comment

Due to various outcome definitions and measuring instruments no meta‐analysis possible

Serious adverse events

169 per 1000

244 per 1000
(162 to 369)

RR 1.44
(0.96 to 2.18)

266 (3 studies)

⊕⊕⊝⊝
low1,3

Adverse events

10 per 1000

72 per 1000
(4 to 1000)

RR 7.23
(0.38 to 137.5)

122 (1 study)

⊕⊕⊝⊝
low4

*The basis for the assumed risk (e.g. the median control group risk across studies) is provided in footnotes. The corresponding risk (and its 95% confidence interval) is based on the assumed risk in the comparison group and the relative effect of the intervention (and its 95% CI).
CI: Confidence interval;

GRADE Working Group grades of evidence
High quality: Further research is very unlikely to change our confidence in the estimate of effect.
Moderate quality: Further research is likely to have an important impact on our confidence in the estimate of effect and may change the estimate.
Low quality: Further research is very likely to have an important impact on our confidence in the estimate of effect and is likely to change the estimate.
Very low quality: We are very uncertain about the estimate.

1Small number of participants and events, wide confidence interval

2Outcome assessor (participant) not blinded in participant‐reported outcome (QoL questionnaires)

3Baseline imbalances, especially usage of erythropoietin and thalidomide unknown in both intervention arms

4Very small number of participants and events, very wide confidence interval

Figuras y tablas -
Summary of findings for the main comparison. Physical exercise versus no physical exercise for adults with haematological malignancies
Comparison 1. Physical exercise versus no physical exercise

Outcome or subgroup title

No. of studies

No. of participants

Statistical method

Effect size

1 Mortality Show forest plot

3

269

Risk Ratio (M‐H, Random, 95% CI)

0.93 [0.59, 1.47]

2 Quality of life (QoL) Show forest plot

4

352

Std. Mean Difference (IV, Random, 95% CI)

0.15 [‐0.15, 0.45]

3 QoL sensitivity analysis Show forest plot

3

291

Std. Mean Difference (IV, Random, 95% CI)

0.26 [0.03, 0.49]

4 QoL SCT versus no SCT Show forest plot

4

352

Std. Mean Difference (IV, Random, 95% CI)

0.15 [‐0.15, 0.45]

4.1 SCT

2

169

Std. Mean Difference (IV, Random, 95% CI)

0.35 [0.04, 0.65]

4.2 no SCT

2

183

Std. Mean Difference (IV, Random, 95% CI)

‐0.06 [‐0.50, 0.39]

5 Physical functioning/QoL Show forest plot

4

422

Std. Mean Difference (IV, Random, 95% CI)

0.33 [0.13, 0.52]

6 Depression/QoL Show forest plot

3

249

Std. Mean Difference (IV, Random, 95% CI)

0.25 [‐0.00, 0.50]

7 Anxiety/QoL Show forest plot

3

249

Std. Mean Difference (IV, Random, 95% CI)

‐0.18 [‐0.64, 0.28]

8 Fatigue Show forest plot

7

692

Std. Mean Difference (IV, Random, 95% CI)

0.24 [0.08, 0.40]

9 Fatigue SCT versus no SCT Show forest plot

7

692

Std. Mean Difference (IV, Random, 95% CI)

0.24 [0.08, 0.40]

9.1 SCT

4

487

Std. Mean Difference (IV, Random, 95% CI)

0.31 [0.06, 0.55]

9.2 no SCT

3

205

Std. Mean Difference (IV, Random, 95% CI)

0.15 [‐0.12, 0.43]

10 Weight Show forest plot

2

253

Mean Difference (IV, Random, 95% CI)

0.30 [‐4.08, 4.68]

11 Lean body mass Show forest plot

2

253

Mean Difference (IV, Random, 95% CI)

1.34 [‐1.34, 4.02]

12 Serious adverse events (SAEs) Show forest plot

3

266

Risk Ratio (M‐H, Random, 95% CI)

1.44 [0.96, 2.18]

Figuras y tablas -
Comparison 1. Physical exercise versus no physical exercise