| 1 Total mortality Show forest plot | 9 | | Risk Ratio (Random, 95% CI) | 0.99 [0.95, 1.03] |
|
| 2 Total mortality ‐ sensitivity analyses Show forest plot | 6 | | Risk Ratio (Random, 95% CI) | 0.98 [0.94, 1.03] |
|
| 2.1 Excluding cluster trials | 6 | | Risk Ratio (Random, 95% CI) | 0.98 [0.94, 1.03] |
| 3 Total mortality ‐ no. of health checks Show forest plot | 9 | | Risk Ratio (Random, 95% CI) | 0.99 [0.96, 1.03] |
|
| 3.1 One health check | 3 | | Risk Ratio (Random, 95% CI) | 1.00 [0.94, 1.06] |
| 3.2 More than one health check | 6 | | Risk Ratio (Random, 95% CI) | 0.99 [0.93, 1.05] |
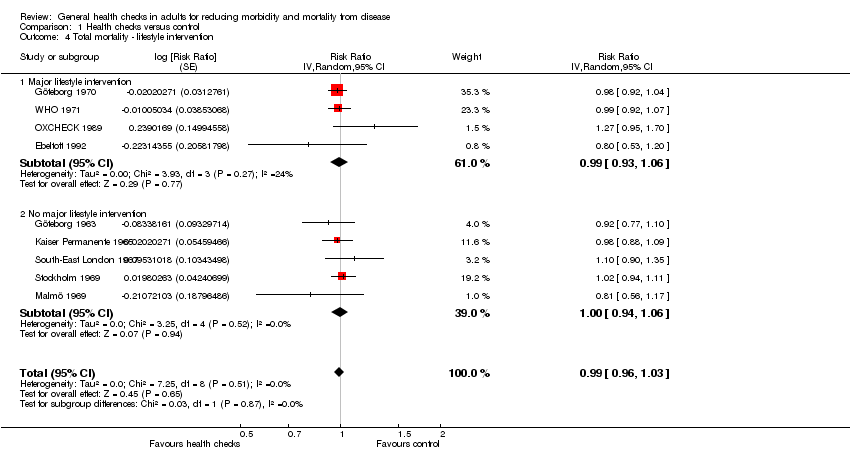
| 4 Total mortality ‐ lifestyle intervention Show forest plot | 9 | | Risk Ratio (Random, 95% CI) | 0.99 [0.96, 1.03] |
|
| 4.1 Major lifestyle intervention | 4 | | Risk Ratio (Random, 95% CI) | 0.99 [0.93, 1.06] |
| 4.2 No major lifestyle intervention | 5 | | Risk Ratio (Random, 95% CI) | 1.00 [0.94, 1.06] |
| 5 Total mortality ‐ length of follow‐up Show forest plot | 9 | | Risk Ratio (Random, 95% CI) | 0.99 [0.96, 1.03] |
|
| 5.1 Up to five years | 2 | | Risk Ratio (Random, 95% CI) | 1.03 [0.66, 1.60] |
| 5.2 More than 5 years | 7 | | Risk Ratio (Random, 95% CI) | 0.99 [0.95, 1.03] |
| 6 Total mortality ‐ age of trial Show forest plot | 9 | | Risk Ratio (Random, 95% CI) | 0.99 [0.96, 1.03] |
|
| 6.1 Trial started before 1980 | 7 | | Risk Ratio (Random, 95% CI) | 0.99 [0.95, 1.03] |
| 6.2 Trial started after 1980 | 2 | | Risk Ratio (Random, 95% CI) | 1.03 [0.66, 1.62] |
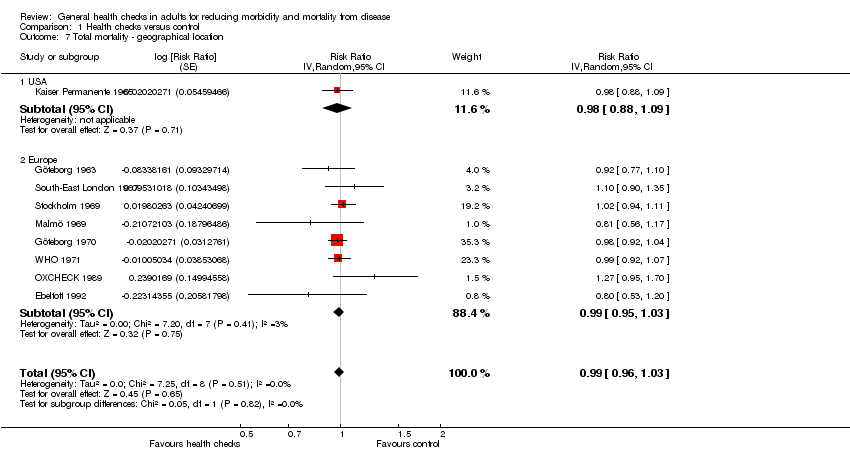
| 7 Total mortality ‐ geographical location Show forest plot | 9 | | Risk Ratio (Random, 95% CI) | 0.99 [0.96, 1.03] |
|
| 7.1 USA | 1 | | Risk Ratio (Random, 95% CI) | 0.98 [0.88, 1.09] |
| 7.2 Europe | 8 | | Risk Ratio (Random, 95% CI) | 0.99 [0.95, 1.03] |
| 8 Total mortality ‐ examination by physician Show forest plot | 9 | | Risk Ratio (Random, 95% CI) | 0.99 [0.96, 1.03] |
|
| 8.1 Examination by physician | 5 | | Risk Ratio (Random, 95% CI) | 1.00 [0.94, 1.06] |
| 8.2 No examination by physician | 4 | | Risk Ratio (Random, 95% CI) | 0.99 [0.93, 1.06] |
| 9 Total mortality ‐ selection bias Show forest plot | 9 | | Risk Ratio (Random, 95% CI) | 0.99 [0.96, 1.03] |
|
| 9.1 low risk of selection bias | 7 | | Risk Ratio (Random, 95% CI) | 0.99 [0.94, 1.03] |
| 9.2 Unclear risk of selection bias | 2 | | Risk Ratio (Random, 95% CI) | 1.00 [0.93, 1.08] |
| 9.3 High risk of selection bias | 0 | | Risk Ratio (Random, 95% CI) | 0.0 [0.0, 0.0] |
| 10 Total mortality ‐ performance bias Show forest plot | 9 | | Risk Ratio (Random, 95% CI) | 0.99 [0.96, 1.03] |
|
| 10.1 low risk | 5 | | Risk Ratio (Random, 95% CI) | 0.98 [0.94, 1.02] |
| 10.2 Unclear risk | 1 | | Risk Ratio (Random, 95% CI) | 1.02 [0.94, 1.11] |
| 10.3 High risk | 3 | | Risk Ratio (Random, 95% CI) | 1.08 [0.87, 1.33] |
| 11 Total mortality ‐ detection bias Show forest plot | 9 | | Risk Ratio (Random, 95% CI) | 0.99 [0.96, 1.03] |
|
| 11.1 Low risk | 6 | | Risk Ratio (Random, 95% CI) | 0.99 [0.94, 1.04] |
| 11.2 Unclear risk | 2 | | Risk Ratio (Random, 95% CI) | 1.00 [0.93, 1.08] |
| 11.3 High risk | 1 | | Risk Ratio (Random, 95% CI) | 0.92 [0.77, 1.10] |
| 12 Total mortality ‐ incomplete outcome data Show forest plot | 9 | | Risk Ratio (Random, 95% CI) | 0.99 [0.96, 1.03] |
|
| 12.1 Low risk | 8 | | Risk Ratio (Random, 95% CI) | 0.99 [0.95, 1.03] |
| 12.2 Unclear risk | 1 | | Risk Ratio (Random, 95% CI) | 0.98 [0.88, 1.09] |
| 12.3 High risk | 0 | | Risk Ratio (Random, 95% CI) | 0.0 [0.0, 0.0] |
| 13 Total mortality ‐ contamination Show forest plot | 9 | | Risk Ratio (Random, 95% CI) | 0.99 [0.96, 1.03] |
|
| 13.1 Low risk | 5 | | Risk Ratio (Random, 95% CI) | 0.99 [0.95, 1.03] |
| 13.2 Unclear risk | 1 | | Risk Ratio (Random, 95% CI) | 1.27 [0.95, 1.70] |
| 13.3 High risk | 3 | | Risk Ratio (Random, 95% CI) | 0.99 [0.90, 1.10] |
| 14 Cardiovascular mortality Show forest plot | 8 | | Risk Ratio (Random, 95% CI) | 1.03 [0.91, 1.17] |
|
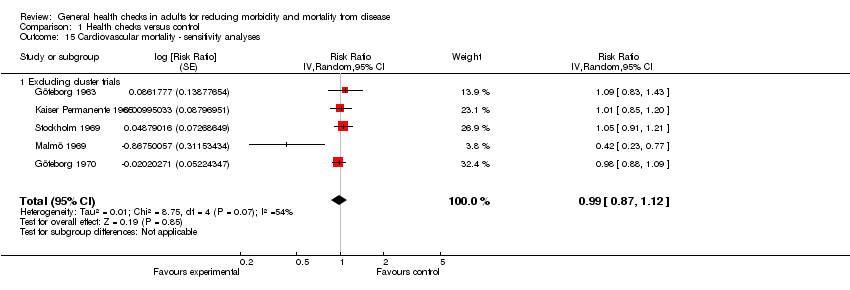
| 15 Cardiovascular mortality ‐ sensitivity analyses Show forest plot | 5 | | Risk Ratio (Random, 95% CI) | 0.99 [0.87, 1.12] |
|
| 15.1 Excluding cluster trials | 5 | | Risk Ratio (Random, 95% CI) | 0.99 [0.87, 1.12] |
| 16 Cardiovascular mortality ‐ no. of health checks Show forest plot | 8 | | Risk Ratio (Random, 95% CI) | 1.03 [0.91, 1.17] |
|
| 16.1 Only one health check | 3 | | Risk Ratio (Random, 95% CI) | 0.89 [0.69, 1.14] |
| 16.2 More than one health check | 5 | | Risk Ratio (Random, 95% CI) | 1.11 [0.95, 1.30] |
| 17 Cardiovascular mortality lifestyle intervention Show forest plot | 8 | | Risk Ratio (Random, 95% CI) | 1.03 [0.91, 1.17] |
|
| 17.1 Major lifestyle intervention | 3 | | Risk Ratio (Random, 95% CI) | 0.99 [0.86, 1.15] |
| 17.2 No major lifestyle intervention | 5 | | Risk Ratio (Random, 95% CI) | 1.03 [0.84, 1.27] |
| 18 Cardiovascular mortality ‐ length of follow‐up Show forest plot | 8 | | Risk Ratio (Random, 95% CI) | 1.03 [0.91, 1.17] |
|
| 18.1 Up to five years | 2 | | Risk Ratio (Random, 95% CI) | 0.84 [0.22, 3.18] |
| 18.2 More than five years | 6 | | Risk Ratio (Random, 95% CI) | 1.02 [0.94, 1.12] |
| 19 Cardiovascular mortality ‐ age of trial Show forest plot | 8 | | Risk Ratio (Random, 95% CI) | 1.03 [0.91, 1.17] |
|
| 19.1 Trial started before 1980 | 7 | | Risk Ratio (Random, 95% CI) | 1.01 [0.90, 1.13] |
| 19.2 Trial started after 1980 | 1 | | Risk Ratio (Random, 95% CI) | 1.64 [0.97, 2.76] |
| 20 Cardiovascular mortality ‐ geographical location Show forest plot | 8 | | Risk Ratio (Random, 95% CI) | 1.03 [0.91, 1.17] |
|
| 20.1 Europe | 7 | | Risk Ratio (Random, 95% CI) | 1.04 [0.90, 1.20] |
| 20.2 USA | 1 | | Risk Ratio (Random, 95% CI) | 1.01 [0.85, 1.20] |
| 21 Cardiovascular mortality ‐ examination by physician Show forest plot | 8 | | Risk Ratio (Random, 95% CI) | 1.03 [0.91, 1.17] |
|
| 21.1 Examination by physician | 5 | | Risk Ratio (Random, 95% CI) | 1.03 [0.84, 1.27] |
| 21.2 No examination by physician | 3 | | Risk Ratio (Random, 95% CI) | 0.99 [0.86, 1.15] |
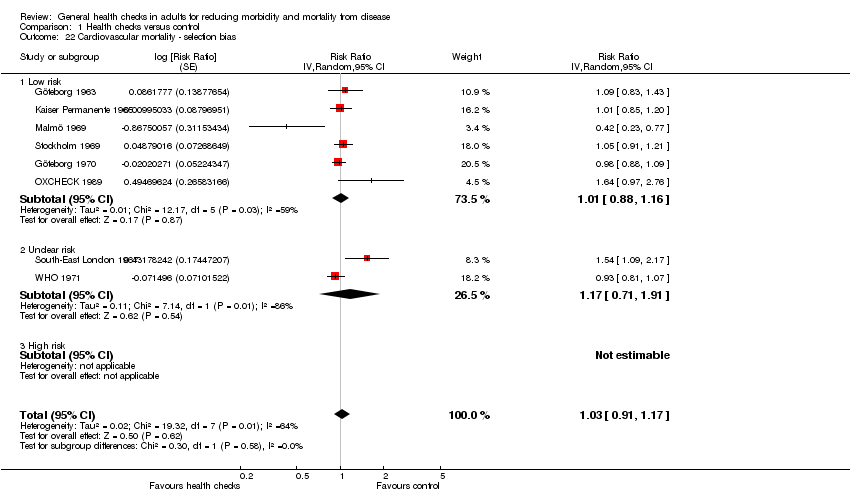
| 22 Cardiovascular mortality ‐ selection bias Show forest plot | 8 | | Risk Ratio (Random, 95% CI) | 1.03 [0.91, 1.17] |
|
| 22.1 Low risk | 6 | | Risk Ratio (Random, 95% CI) | 1.01 [0.88, 1.16] |
| 22.2 Unclear risk | 2 | | Risk Ratio (Random, 95% CI) | 1.17 [0.71, 1.91] |
| 22.3 High risk | 0 | | Risk Ratio (Random, 95% CI) | 0.0 [0.0, 0.0] |
| 23 Cardiovascular mortality ‐ performance bias Show forest plot | 8 | | Risk Ratio (Random, 95% CI) | 1.03 [0.91, 1.17] |
|
| 23.1 Low risk | 5 | | Risk Ratio (Random, 95% CI) | 0.96 [0.85, 1.08] |
| 23.2 Unclear risk | 1 | | Risk Ratio (Random, 95% CI) | 1.05 [0.91, 1.21] |
| 23.3 High risk | 2 | | Risk Ratio (Random, 95% CI) | 1.57 [1.18, 2.09] |
| 24 Cardiovascular mortality ‐ detection bias Show forest plot | 8 | | Risk Ratio (Random, 95% CI) | 1.03 [0.91, 1.17] |
|
| 24.1 Low risk | 5 | | Risk Ratio (Random, 95% CI) | 1.00 [0.85, 1.17] |
| 24.2 Unclear risk | 2 | | Risk Ratio (Random, 95% CI) | 1.17 [0.71, 1.91] |
| 24.3 High risk | 1 | | Risk Ratio (Random, 95% CI) | 1.09 [0.83, 1.43] |
| 25 Cardiovascular mortality ‐ incomplete outcome data Show forest plot | 8 | | Risk Ratio (Random, 95% CI) | 1.03 [0.91, 1.17] |
|
| 25.1 Low risk | 7 | | Risk Ratio (Random, 95% CI) | 1.04 [0.90, 1.20] |
| 25.2 Unclear risk | 1 | | Risk Ratio (Random, 95% CI) | 1.01 [0.85, 1.20] |
| 25.3 High risk | 0 | | Risk Ratio (Random, 95% CI) | 0.0 [0.0, 0.0] |
| 26 Cardiovascular mortality ‐ contamination Show forest plot | 8 | | Risk Ratio (Random, 95% CI) | 1.03 [0.91, 1.17] |
|
| 26.1 Low risk | 5 | | Risk Ratio (Random, 95% CI) | 0.97 [0.86, 1.09] |
| 26.2 Unclear risk | 1 | | Risk Ratio (Random, 95% CI) | 1.64 [0.97, 2.76] |
| 26.3 High risk | 2 | | Risk Ratio (Random, 95% CI) | 1.21 [0.81, 1.83] |
| 27 Cancer mortality Show forest plot | 8 | | Risk Ratio (Random, 95% CI) | 1.01 [0.92, 1.12] |
|
| 28 Cancer mortality ‐ sensitivity analyses Show forest plot | 5 | | Risk Ratio (Random, 95% CI) | 0.97 [0.85, 1.09] |
|
| 28.1 Excluding cluster trials | 5 | | Risk Ratio (Random, 95% CI) | 0.97 [0.85, 1.09] |
| 29 Cancer mortality ‐ no. of health checks Show forest plot | 8 | | Risk Ratio (Random, 95% CI) | 1.01 [0.92, 1.12] |
|
| 29.1 Only one health check | 3 | | Risk Ratio (Random, 95% CI) | 1.10 [1.00, 1.21] |
| 29.2 More than one health check | 5 | | Risk Ratio (Random, 95% CI) | 0.92 [0.83, 1.02] |
| 30 Cancer mortality lifestyle intervention Show forest plot | 8 | | Risk Ratio (Random, 95% CI) | 1.01 [0.92, 1.12] |
|
| 30.1 Major lifestyle intervention | 3 | | Risk Ratio (Random, 95% CI) | 1.01 [0.82, 1.24] |
| 30.2 No major lifestyle intervention | 5 | | Risk Ratio (Random, 95% CI) | 1.02 [0.91, 1.15] |
| 31 Cancer mortality ‐ length of follow‐up Show forest plot | 8 | | Risk Ratio (Random, 95% CI) | 1.01 [0.92, 1.12] |
|
| 31.1 Up to five years | 2 | | Risk Ratio (Random, 95% CI) | 1.33 [0.89, 1.99] |
| 31.2 More than five years | 6 | | Risk Ratio (Random, 95% CI) | 1.00 [0.90, 1.10] |
| 32 Cancer mortality ‐ age of trial Show forest plot | 8 | | Risk Ratio (Random, 95% CI) | 1.01 [0.92, 1.12] |
|
| 32.1 Trial started before 1980 | 7 | | Risk Ratio (Random, 95% CI) | 1.01 [0.91, 1.12] |
| 32.2 Trial started after 1980 | 1 | | Risk Ratio (Random, 95% CI) | 1.19 [0.75, 1.89] |
| 33 Cancer mortality ‐ geographical location Show forest plot | 8 | | Risk Ratio (Random, 95% CI) | 1.01 [0.92, 1.12] |
|
| 33.1 Europe | 7 | | Risk Ratio (Random, 95% CI) | 1.02 [0.91, 1.15] |
| 33.2 USA | 1 | | Risk Ratio (Random, 95% CI) | 0.98 [0.80, 1.20] |
| 34 Cancer mortality ‐ examination by physician Show forest plot | 8 | | Risk Ratio (Random, 95% CI) | 1.01 [0.92, 1.12] |
|
| 34.1 Examination by physician | 5 | | Risk Ratio (Random, 95% CI) | 1.02 [0.91, 1.15] |
| 34.2 No examination by physician | 3 | | Risk Ratio (Random, 95% CI) | 1.01 [0.82, 1.24] |
| 35 Cancer mortality ‐ selection bias Show forest plot | 8 | | Risk Ratio (Random, 95% CI) | 1.01 [0.92, 1.12] |
|
| 35.1 Low risk | 6 | | Risk Ratio (Random, 95% CI) | 0.98 [0.87, 1.10] |
| 35.2 Unclear risk | 2 | | Risk Ratio (Random, 95% CI) | 1.10 [0.98, 1.24] |
| 35.3 High risk | 0 | | Risk Ratio (Random, 95% CI) | 0.0 [0.0, 0.0] |
| 36 Cancer mortality ‐ performance bias Show forest plot | 8 | | Risk Ratio (Random, 95% CI) | 1.01 [0.92, 1.12] |
|
| 36.1 Low risk | 5 | | Risk Ratio (Random, 95% CI) | 1.00 [0.86, 1.16] |
| 36.2 Unclear risk | 1 | | Risk Ratio (Random, 95% CI) | 1.05 [0.88, 1.25] |
| 36.3 High risk | 2 | | Risk Ratio (Random, 95% CI) | 1.08 [0.80, 1.46] |
| 37 Cancer mortality ‐ detection bias Show forest plot | 8 | | Risk Ratio (Random, 95% CI) | 1.01 [0.92, 1.12] |
|
| 37.1 Low risk | 5 | | Risk Ratio (Random, 95% CI) | 0.99 [0.86, 1.13] |
| 37.2 Unclear risk | 2 | | Risk Ratio (Random, 95% CI) | 1.10 [0.98, 1.24] |
| 37.3 High risk | 1 | | Risk Ratio (Random, 95% CI) | 0.93 [0.63, 1.38] |
| 38 Cancer mortality ‐ incomplete outcome data Show forest plot | 8 | | Risk Ratio (Random, 95% CI) | 1.01 [0.92, 1.12] |
|
| 38.1 Low risk | 6 | | Risk Ratio (Random, 95% CI) | 0.98 [0.86, 1.12] |
| 38.2 Unclear risk | 2 | | Risk Ratio (Random, 95% CI) | 1.07 [0.96, 1.20] |
| 38.3 High risk | 0 | | Risk Ratio (Random, 95% CI) | 0.0 [0.0, 0.0] |
| 39 Cancer mortality ‐ contamination Show forest plot | 8 | | Risk Ratio (Random, 95% CI) | 1.01 [0.92, 1.12] |
|
| 39.1 Low risk | 5 | | Risk Ratio (Random, 95% CI) | 1.01 [0.88, 1.17] |
| 39.2 Unclear risk | 1 | | Risk Ratio (Random, 95% CI) | 1.19 [0.75, 1.89] |
| 39.3 High risk | 2 | | Risk Ratio (Random, 95% CI) | 0.99 [0.82, 1.18] |