Inspección externa del cumplimiento de las normas para mejorar los resultados de la atención sanitaria
Resumen
Antecedentes
Los sistemas de inspección se usan en la asistencia sanitaria para promover mejorías en la calidad, es decir, para lograr cambios en las estructuras o los procesos institucionales, el comportamiento de los profesionales sanitarios y los resultados de los pacientes. Estos sistemas se basan en la suposición de que el cumplimiento de las normas basadas en evidencia promovido externamente (mediante la inspección/evaluación) dará lugar a una calidad más alta de la asistencia sanitaria. Sin embargo, no se conocen los beneficios de la inspección externa en cuanto a los resultados a nivel institucional, del profesional y del paciente. Esta es la primera actualización de la revisión Cochrane original publicada en 2011.
Objetivos
Evaluar la efectividad de la inspección externa del cumplimiento de las normas en cuanto a la mejoría del comportamiento de la organización de asistencia sanitaria, el comportamiento de los profesionales sanitarios y los resultados de los pacientes.
Métodos de búsqueda
Se realizaron búsquedas de estudios en las siguientes bases de datos electrónicas hasta el 1 de junio de 2015: el Registro Cochrane Central de Ensayos Controlados (Cochrane Central Register of Controlled Trials, CENTRAL), MEDLINE, Embase, Database of Abstracts of Reviews of Effectiveness, HMIC, ClinicalTrials.gov y la World Health Organization International Clinical Trials Registry Platform. No hubo restricciones de idioma y se incluyeron estudios independientemente del estado de la publicación. También se realizaron búsquedas en las listas de referencias de los estudios incluidos y se estableció contacto con los autores de los artículos relevantes, los cuerpos de acreditación y la International Organization for Standardisation (ISO), considerando cualquier trabajo adicional publicado o no publicado. También se buscó en una base de datos en línea de revisiones sistemáticas (PDQ‐evidence.org).
Criterios de selección
Se incluyeron ensayos controlados aleatorizados (ECA), ensayos no aleatorizados (ENA), series de tiempo interrumpido (STI) y estudios controlados del tipo antes y después (ECAD) que evaluaron el efecto de la inspección externa contra los estándares externos sobre el cambio en la organización de la asistencia sanitaria, la conducta de los profesionales sanitarios o los resultados de los pacientes en los hospitales, las organizaciones de asistencia sanitaria primaria y otras organizaciones de asistencia sanitaria basadas en la comunidad.
Obtención y análisis de los datos
Dos autores de la revisión aplicaron de forma independiente los criterios de elegibilidad, extrajeron los datos y evaluaron el riesgo de sesgo de cada estudio incluido. Debido a que no fue posible realizar el metanálisis, se elaboró un resumen narrativo de los resultados. Se utilizó la herramienta GRADE para evaluar la certeza de la evidencia.
Resultados principales
No se identificó ningún estudio nuevo elegible en esta actualización. Un ECA por grupos en el que participaron 20 hospitales públicos sudafricanos y un STI en el que participaron todos las fundaciones de hospitales de agudos de Inglaterra, cumplieron los criterios de inclusión. Una fundación hospitalaria es un hospital del Servicio Nacional de Salud que ha optado por retirarse del control de la autoridad local y ser administrado por una fundación en su lugar.
El ECA por grupos informó de los efectos mixtos de la inspección externa en el cumplimiento de las normas de acreditación del Consejo de Acreditación de Servicios de Salud de Sudáfrica (Council for Health Services Accreditation for South Africa, COHSASA) y de ocho indicadores de calidad de los hospitales. Se informó de una mejora en la puntuación de cumplimiento total de las normas de acreditación de COHSASA para 21/28 elementos de servicio: el efecto medio de la intervención fue del 30% (intervalo de confianza (IC) del 95%: 23% a 37%) (P < 0,001). La puntuación aumentó de un 48% a un 78% en los hospitales de intervención, mientras que siguió siendo igual en los hospitales de control (43%). El efecto mediano de la intervención para los indicadores de la calidad de la atención hospitalaria fue del 2,4% (rango ‐1,9% a +11,8%).
El estudio STI evaluó el cumplimiento de las políticas para abordar las infecciones adquiridas en la atención sanitaria e informó de una reducción media de las tasas de infección por SARM (Staphylococcus aureus resistente a la meticilina) de 100 casos por trimestre (IC del 95%: ‐221,0 a 21,5; P = 0,096) a los tres meses de seguimiento y un aumento de 70 casos por trimestre (IC del 95%: ‐250,5 a 391,0; P = 0,632) a los 24 meses de seguimiento. El análisis de regresión mostró tasas similares de SARM antes y después de la inspección externa (diferencia en la curva 24,27; IC del 95%: ‐10,4 a 58,9; P = 0,147).
Ninguno de los estudios incluidos comunicó datos sobre consecuencias imprevistas/adversas o resultados económicos. El ECA por grupos informó principalmente de resultados relacionados con el cambio en la organización de la asistencia sanitaria, y ningún paciente informó de resultados distintos de la satisfacción del paciente.
La certeza de la evidencia incluida en ambos estudios era muy baja. No se sabe con certeza si los programas de acreditación de las inspecciones externas permiten mejorar el cumplimiento de las normas de acreditación. Tampoco se sabe con certeza si los programas de inspección de infección externos conducen a un mejor cumplimiento de las normas y si esto a su vez influye en las tasas de infección por SARM adquiridas en la atención sanitaria.
Conclusiones de los autores
La revisión pone de relieve la escasez de evaluaciones controladas de alta calidad de la efectividad y el coste‐efectividad de los sistemas de inspección externa. Si los encargados de la formulación de políticas desean comprender mejor la efectividad de este tipo de intervención, es necesario que se realicen más estudios en diversos entornos y contextos, y que los estudios informen sobre los resultados importantes para los pacientes.
PICO
Resumen en términos sencillos
¿Pueden las inspecciones de terceros para comprobar si las organizaciones sanitarias cumplen las normas obligatorias mejorar los resultados de la atención sanitaria?
¿Cuál fue el objetivo de esta revisión?
El objetivo de esta revisión Cochrane fue averiguar si la inspección externa del cumplimiento de las normas puede mejorar la conducta de la organización de la asistencia sanitaria, la conducta de los profesionales sanitarios y los resultados de los pacientes. Los investigadores Cochrane recopilaron y analizan todos los estudios relevantes para responder a esta pregunta y se encontraron dos estudios.
Mensajes clave
No está claro si los programas de inspección de terceros diseñados para medir el cumplimiento de las normas de atención de una organización sanitaria pueden mejorar la práctica profesional y los resultados de la atención sanitaria. Había poca información sobre los resultados de los pacientes. Esta revisión pone de relieve la falta de evaluaciones de alta calidad.
¿Qué se estudió en la revisión?
Los programas de inspección de terceros (externos) se utilizan en los centros de atención de la salud (por ejemplo, clínicas y hospitales) para aumentar el cumplimiento de las normas de atención basadas en evidencia, pero se sabe muy poco de sus beneficios en términos de rendimiento organizativo (por ejemplo, tiempos de lista de espera, duración de la estancia hospitalaria), el rendimiento de los profesionales de la salud (por ejemplo, tasa de remisión, tasa de prescripción) y los resultados de los pacientes (por ejemplo, mortalidad y resultados específicos de una enfermedad como la glucosa en la sangre en el caso de los pacientes diabéticos o la pérdida de peso en el caso de los pacientes con sobrepeso u obesos), o su coste‐efectividad. Los programas de acreditación son un ejemplo de un sistema de revisión externo. La acreditación es un proceso de revisión en el que participan las organizaciones de salud para demostrar la capacidad de cumplir con los criterios y estándares de acreditación predeterminados establecidos por una agencia de acreditación profesional. Los programas de inspección de control de infecciones son también ejemplos. Diseñados para reducir la infección, se utilizan normas basadas en la evidencia y las mejores prácticas para mejorar la calidad y la seguridad de la atención para disminuir las tasas de infección adquiridas en la atención sanitaria (también llamada infección adquirida en el hospital o infección nosocomial, es una infección que se adquiere en un hospital u otro centro de atención sanitaria). Si no se cumplen las normas, el organismo de inspección externo puede tomar medidas para reforzarlas.
¿Cuáles son los principales resultados de la revisión?
Los autores de la revisión buscaron en la bibliografía estudios que evaluaran los efectos de la inspección externa del cumplimiento de las normas y encontraron dos estudios pertinentes: un estudio que abarcaba 20 hospitales de la República de Sudáfrica y un estudio que proporcionaba datos de series cronológicas (una secuencia de mediciones de resultados tomadas en puntos sucesivos igualmente espaciados en el tiempo) que abarcaba todas las fundaciones hospitalarias de agudos de Inglaterra (una fundación hospitalaria es un hospital del Servicio Nacional de Salud que ha optado por retirarse del control de la autoridad local y ser administrado por una fundación en su lugar). La comparación no fue una inspección.
En un estudio, se informó una mejora de las puntuaciones de cumplimiento de las normas de acreditación de los hospitales. Sin embargo, no es seguro que la inspección externa conduzca a un mejor cumplimiento de las normas porque la certeza de la evidencia era muy baja. Sólo uno de los nueve hospitales de intervención logró la acreditación durante el período de estudio.
Otro estudio informó sobre los efectos de un programa de inspección de control de infecciones. Este programa se encargó en el Reino Unido para reducir las tasas de infección del SARM (Staphylococcus aureus resistente a la meticilina, que es una forma de infección bacteriana resistente a muchos antibióticos). Sin embargo, el programa de inspección era sólo un elemento de una gama más amplia de métodos que se aplicaban al control de las infecciones en el Servicio Nacional de Salud del Reino Unido en ese momento. Incluso antes de la introducción del programa de inspección, las tasas de infección parecían estar disminuyendo, pero la introducción del programa de inspección no aceleró esta disminución. También es incierto si el Programa de Inspección de Infecciones Asociadas a la Atención Médica de la Comisión de Atención Médica (Healthcare Commission's Healthcare Associated Infections Inspection Programme) puede dar lugar a menores tasas de infección por SARM o no, porque la certeza de la evidencia era muy baja.
¿Cuál es el grado de actualización de esta revisión?
Los autores de la revisión buscaron estudios que se habían publicado hasta junio 2015.
Authors' conclusions
Summary of findings
| External inspection of compliance with COHSASA hospital accreditation standards versus no external inspection | ||||
| Recipient: public hospitals Settings: KwaZulu province, the Republic of South Africa Intervention: external inspection of compliance with accreditation standards Comparison: no inspection | ||||
| Outcomes | Intervention effect (range) | No of studies (hospitals) | Certainty of the evidence | Comments |
| Compliance with COHSASA accreditation standards at 2 years' follow‐up (change in total compliance score for 21/28 service elements ‐ for 7/28 service elements, data were not available) | I: pre: 48% (not reported), post: 78% (not reported) C: pre: 43% (not reported), post: 43% (not reported) Mean intervention effect: 30% (23% to 37%), P < 0.001 | 1 (18) | ⊕⊖⊖⊖ Very low 1,2 | Uncertain whether external inspection leads to improved compliance with standards. |
| Compliance with COHSASA accreditation standards ‐ subgroup of critical criteria analysed at 2 years' follow‐up (compliance score for 19 generic service elements, involving 426 predefined critical criteria) | I: pre: 38% (21% to 46%), post: 76% (55% to 96%) C: pre: 37% (28% to 47%), post: 38% (25% to 49%) Mean intervention effect: 37% (not reported), P < 0.001 | 1 (18) | ⊕⊖⊖⊖ Very low 1,2 | Uncertain whether external inspection leads to improved compliance with standards. |
| Indicators for hospital quality of care at 2 years' follow‐up | Median intervention effect: 2.4% (‐1.9% to 11.8%) | 1 (18) | ⊕⊖⊖⊖ Very low 1,2 | Uncertain whether external inspection improves median quality indicator scores. Only 1 of the indicators was indicative of higher quality in accreditation hospitals. |
| Mortality and condition‐specific measures of outcome related to patients' health | ‐ | ‐ | ‐ | Not measured or reported. |
| Unanticipated/adverse consequences | ‐ | ‐ | ‐ | Not measured or reported. |
| Costs and cost effectiveness | ‐ | ‐ | ‐ | Not measured or reported. |
| High = This research provides a very good indication of the likely effect. The likelihood that the effect will be substantially different‡ is low. Moderate = This research provides a good indication of the likely effect. The likelihood that the effect will be substantially different‡ is moderate. Low = This research provides some indication of the likely effect. However, the likelihood that it will be substantially different‡ is high. Very low = This research does not provide a reliable indication of the likely effect. The likelihood that the effect will be substantially different‡ is very high. ‡ Substantially different = a large enough difference that it might affect a decision. | ||||
| 1 Downgraded two levels for very serious risk of bias due to unclear blinding, baseline compliance and time differences in outcome measurements. 2 Downgraded one level for serious imprecision due to the small sample size and wide confidence intervals. C: control; COHSASA: Council for Health Services Accreditation for South Africa; I: intervention. | ||||
| External inspection of compliance with the Code of Practice and the law related to healthcare‐acquired infections | ||||
| Recipient: all acute trusts Settings: England Intervention: external inspection of compliance with the Code of Practice and the Health Act 2006 related to healthcare‐acquired infections Comparison: no control group (time series) | ||||
| Outcomes | Mean intervention effect (95% CI) | No of studies (trusts) | Certainty of the evidence | Comments |
| MRSA infection rate | At 3 months: ‐100 (‐221.0 to 21.5) cases per quarter (P = 0.096) | 1 (168) | ⊕⊖⊖⊖ Very low1,2 | Uncertain whether external inspection lowers MRSA infection rates. Regression analysis showed similar MRSA rate before and after the external inspection (difference in slope 24.27, 95% CI ‐10.4 to 58.9; P = 0.147). |
| Unanticipated/adverse consequences | ‐ | ‐ | ‐ | Not measured or reported. |
| Costs and cost effectiveness | ‐ | ‐ | ‐ | Not measured or reported. |
| High = This research provides a very good indication of the likely effect. The likelihood that the effect will be substantially different‡ is low. Moderate = This research provides a good indication of the likely effect. The likelihood that the effect will be substantially different‡ is moderate. Low = This research provides some indication of the likely effect. However, the likelihood that it will be substantially different‡ is high. Very low = This research does not provide a reliable indication of the likely effect. The likelihood that the effect will be substantially different‡ is very high. ‡ Substantially different = a large enough difference that it might affect a decision. | ||||
| 1 Downgraded one level for serious risk of bias due to the probability that the intervention was not independent of other changes. 2 Downgraded one level for serious imprecision due to wide confidence intervals. CI: confidence interval; MRSA: methicillin‐resistant Staphylococcus aureus. | ||||
Background
Inspection or review systems are used in healthcare to promote improvements in the quality of care, promoting changes in organisational structures or processes, in healthcare provider behaviour and thereby in patient outcomes. These review systems are based on the assumption that externally promoted adherence to evidence‐based standards (through inspection/assessment) will result in higher quality of healthcare (Shaw 2001; Pomey 2005). Review systems are popular among healthcare funders, who are more likely to make funding available (or less likely to withdraw funding) if standards are met and healthcare professionals and the public can have confidence in the standards of care provided (Hart 2013). There are numerous review systems described in the literature (e.g. peer review, accreditation, audit, regulation and statutory inspection, International Organization for Standardization (ISO) certification, evaluation against a business excellence (Shaw 2001; Shaw 2004)). Even if there is a trend towards mandatory government‐driven accreditation systems (Accreditation Canada 2015), many review systems still assume that the organisation being reviewed will volunteer itself for the review process and by so doing will have already made some commitment to improvement. Such volunteer systems will systematically miss including those organisations that are not inclined to submit themselves for review; only an externally authorised and driven process can promote change in any organisation, irrespective of its inclination to be inspected. An example of such a system is the inspection processes run by the Care Quality Commission (formerly the Healthcare Commission) in the UK National Health Service (NHS) (www.cqc.org.uk/). The commission has a regular cycle of inspection and the ability to respond to concerns about the quality of healthcare in any NHS organisation, inspect and largely decide the consequences of inspection (Care Quality Commission 2013).
Description of the intervention
For the purposes of this review, an external inspection is defined as "a system, process or arrangement in which some dimensions or characteristics of a healthcare provider organisation and its activities are assessed or analysed against a framework of ideas, knowledge, or measures derived or developed outside that organisation" (Walsche 2000). The process of inspection is initiated and controlled by an organisation external to the one being inspected.
ISO defines a standard as "a document, established by consensus and approved by a recognised body, that provides, for common and repeated use, rules, guidelines or characteristics for activities or their results, aimed at the achievement of the optimum degree of order in a given context" (ISO 2004). Included in this definition is that "standards should be based on the consolidated results of science, technology and experience, and aimed at the promotion of optimum community benefits."
The external standard is a standard that has been developed by a body external to the organisation being inspected, which distinguishes it from the standards that are used in, for example, audit and feedback, that are often set by the group to whom they are applied.
How the intervention might work
Inspection of performance assumes that the process of comparison of performance against an explicit standard of care will lead to the closing of any identified important gaps; in this sense the underlying process is akin to that which underpins clinical audit (Accreditation Canada 2015). However, when conducted at an organisational level, it is usually used to encompass a far wider range of organisational attributes than clinical audit would normally address. Inspections for assessing the quality of care within healthcare organisations are undertaken by a variety of agencies, non‐governmental as well as governmental, that use different approaches and methods (Hart 2013). Thus, the inspection process can take different forms, both in terms of measurements and data used as well as the purpose and focus of the review. Various systems may also differ in when and how they are initiated, if they are voluntary or mandatory, if they are applied to all an organisation or only a subsection of it (e.g. to a particular clinical area or a professional group), and whether they are linked to incentives or sanctions. Also, the way external bodies use the results to bring about desired quality improvements in an organisation differs. There may also be adverse effects, undesired change or changes that do not last long term (Walsche 2000).
Why it is important to do this review
Voluntary inspection processes are extensively used in North America, Europe and elsewhere around the world, but have rarely been evaluated in terms of impacts on the organisations reviewed (i.e. healthcare delivery, patient outcomes or cost‐effectiveness) (Greenfield 2008). External inspection processes similarly lack evaluations and it is therefore not clear what the benefits of such inspections are, or what inspection process is most successful in improving healthcare. Reviewing the available evidence on the effectiveness of external inspection is an important first step towards identifying the optimal design of such process in terms of their ability to improve healthcare processes and outcomes. This is the first update of the original review (Flodgren 2011).
Objectives
To evaluate the effectiveness of external inspection of compliance with standards in improving healthcare organisation behaviour, healthcare professional behaviour and patient outcomes.
Methods
Criteria for considering studies for this review
Types of studies
We included studies evaluating the effect of external inspection against external standards on healthcare organisation change, healthcare professional behaviour or patient outcomes in hospitals, primary healthcare organisations and other community‐based healthcare organisations. We considered the following study designs: randomised controlled trials (RCTs), non‐randomised trial (NRCT), interrupted time series (ITSs) and controlled before‐after studies (CBAs) that included at least two sites in both control and intervention groups. As we did not expect to find many eligible randomised studies in this area of research, we considered including robust non‐randomised studies complying with the Effective Practice and Organisation of Care (EPOC) study design criteria (EPOC 2015).
Types of participants
We included hospitals, primary healthcare organisations or other community‐based healthcare organisations containing health professionals.
Types of interventions
We included all processes of external inspection against external standards in a healthcare setting compared with no inspection or with another form of inspection (e.g. against internally derived standards).
Types of outcome measures
We included studies that reported one or more of the following objective outcome measures.
Main outcomes
-
Measures of healthcare organisational change (e.g. organisational performance, waiting list times, inpatient hospital stay time).
-
Measures of healthcare professional behaviour (e.g. referral rate, prescribing rate).
-
Measures of patient outcome (e.g. mortality and condition‐specific measures of outcome related to patients' health).
Other outcomes
-
Patient satisfaction and patient involvement.
-
Unanticipated or adverse consequences.
-
Economic outcomes.
Search methods for identification of studies
We searched for studies evaluating the effect of external inspection against external standards on healthcare organisation change, healthcare professional behaviour or patient outcomes.
Electronic searches
We searched the following electronic databases for primary studies:
-
Cochrane Central Register of Controlled Trials (CENTRAL) 2015, Issue 5;
-
Database of Abstracts of Reviews of Effectiveness (DARE), the Cochrane Library, 2015, Issue 2;
-
MEDLINE Ovid (1946 to 1 June 2015);
-
Embase Ovid (1996 to 2015 week 22);
-
HMIC Ovid (1983 to 1 June 2015);
-
Clinicaltrials.gov (clinicaltrials.gov/ searched 1 June 2015);
-
World Health Organization International Clinical Trials Registry Platform (apps.who.int/trialsearch/ searched 1 June 2015).
We translated the search strategy for each database using the appropriate controlled vocabulary as applicable. There was no language restriction. We included studies regardless of publication status.
Appendix 1 shows the full search strategies.
Searching other resources
We searched the reference lists of all included studies. We contacted authors of relevant papers as well as accreditation bodies and ISO regarding any further published or unpublished work. We searched web sites of organisations concerned with accreditation, such as Joint Commission on Accreditation of Healthcare Organizations (JCAHO) (www.jointcommission.org/); Accreditation Canada (www.accrediation.ca); ACHSI‐Australian Council for Healthcare Standards International (www.achs.org.au/ACHSI); and ISQua International Society for Quality in healthcare (www.isquaresearch.com). We also searched an online database of systematic reviews (www.pdq‐evidence.org/). We accessed these resources on 10 June 2015.
Data collection and analysis
Selection of studies
We downloaded all titles and abstracts retrieved by electronic searching to the reference management database EndNote and removed duplicates. For this update, one review author (DGB) screened the titles and abstracts found by the electronic searches to remove irrelevant citations. This was done after independently piloting the inclusion criteria with another review author (GF) against a random sample of studies. One review author (DGB) produced a list of possible eligible citations which a second review author (GF) assessed for eligibility. We excluded those studies that clearly did not meet the inclusion criteria and obtained copies of the full text of potentially relevant references. Two review authors (GF and DGB) independently assessed the eligibility of the papers retrieved in full text. A third review author (MPP) resolved any disagreements.
Data extraction and management
Two review authors (from GF, MPE, MPP and ST) independently extracted the data from each included study into a modified EPOC data extraction form (Appendix 2). We resolved disagreements by discussion, or arbitration by a third review author.
Assessment of risk of bias in included studies
Two review authors (from GF, MPE, MPP and ST) independently assessed the risk of bias of each included study. We resolved disagreements by discussion, or arbitration by a third review author. For RCTs, we used Cochrane's tool for assessing risk of bias (Higgins 2011) on six standard criteria:
-
adequate sequence generation;
-
concealment of allocation;
-
blinded or objective assessment of primary outcome(s);
-
adequately addressed incomplete outcome data;
-
free from selective reporting;
-
free of other risk of bias.
We also used three additional criteria specified by EPOC (EPOC 2009):
-
similar baseline characteristics;
-
similar baseline outcome measures;
-
adequate protection against contamination.
For the included ITS study, we used the following criteria.
-
Was the intervention independent of other changes?
-
Was the shape of the intervention effect prespecified?
-
Was the intervention unlikely to affect data‐collection?
-
Was knowledge of the allocated interventions adequately prevented during the study?
-
Were incomplete outcome data adequately addressed?
-
Was the study free from selective outcome reporting?
-
Was the study free from other risks of bias?
We resolved disagreements by discussion between review authors or if needed, arbitration by a review author. We scored risk of bias for these criteria as 'yes' (= adequate), 'no' (= inadequate) or 'unclear'. Studies achieved a 'low' risk of bias score if all risk of bias criteria were judged as 'adequate'. We assigned a score of moderate risk of bias to studies that scored inadequate on 'one to two' criteria and a score of high risk of bias to studies that scored inadequate on 'more than two' criteria (Jamtvedt 2006). The risk of bias of included studies is summarised in the text and presented in the risk of bias section within the Characteristics of included studies table.
Measures of treatment effect
For each study, we reported data in natural units. Where baseline results were available from RCTs, NRCTs and CBAs, we reported preintervention and postintervention means or proportions for both study and control groups and calculated the unadjusted and adjusted (for any baseline imbalance) absolute change from baseline with 95% confidence intervals (CI).
For ITS studies, we reported the main outcomes in natural units and two effect sizes: the change in the level of outcome immediately after the introduction of the intervention and the change in the slopes of the regression lines. Both estimates are necessary for interpreting the results of each comparison. For example, there could have been no change in the level immediately after the intervention, but there could have been a change in slope. We also reported level effects for six months and yearly postintervention points within the postintervention phase.
We used a standard method of presentation where possible for the results. For comparisons of RCTs, NRCTs and CBAs, we reported (separately for each study design): median effect size across included studies, interquartile ranges of effect sizes across included studies and range of effect sizes across included studies.
Unit of analysis issues
We found two studies and neither had unit of analysis errors. In the cluster RCT, analysis was performed at the level of randomisation (hospital), not at the individual or record level within hospitals, thus allowing for clustering in the analysis (Salmon 2003).
Assessment of heterogeneity
We could not explore heterogeneity, due to finding too few studies.
Assessment of reporting biases
We could not assess publication bias because we found too few studies.
Data synthesis
We did not carry out meta‐analysis. Instead, we produced a narrative results summary. In one of the included studies, we re‐analysed data on MRSA (methicillin‐resistant Staphylococcus aureus) rate as a time series (OPM 2009). We used Review Manager 5 to present and synthesise the data (RevMan 2014).
Two review authors (GF and DGB) used the GRADE tool to judge the overall certainty of the evidence for each outcome using the following domains: risk of bias, inconsistency, imprecision, indirectness and publication bias (www.gradeworkinggroup.org/). We downgraded the evidence for serious concerns about each of these domains. We resolved disagreements through discussions among review authors. We presented the grading of the evidence in 'Summary of findings' tables.
Subgroup analysis and investigation of heterogeneity
We did not perform any subgroup analysis or investigate heterogeneity.
Sensitivity analysis
We had planned to perform a sensitivity analysis excluding high risk of bias studies, but since we found so few studies, we did not perform an analysis.
Results
Description of studies
We searched for studies (RCTs, NRCTs, ITSs and CBAs) evaluating the effect of external inspection of compliance with standards on healthcare organisation change, healthcare professional behaviour or patient outcomes.
Results of the search
Figure 1 shows the study PRISMA flow chart (Moher 2009). We identified a total of 3405 non‐duplicate citations from electronic database searches and 536 from other sources, totaling 3941 unique records. After screening of all titles and abstracts, we identified two citations (one full‐text paper and one abstract) that met the initial selection criteria and we obtained these in full text for review. We excluded one of the studies and listed the abstract in the Characteristics of studies awaiting classification table (Browne 2015). The two studies previously included, which met the inclusion criteria, are reported in detail in the Characteristics of included studies table.
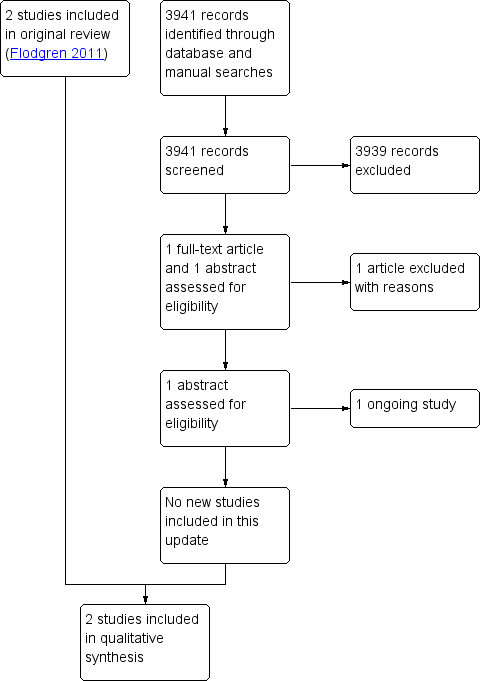
Study flow diagram.
Included studies
Two studies met the inclusion criteria: one cluster RCT (Salmon 2003) performed in an upper‐middle‐income country, and one before‐after study (OPM 2009) (that could be re‐analysed as an ITS) performed in a high‐income country. Both external inspections were mandatory (i.e. decided upon by somebody other than the recipient), and universal (i.e. applied at the organisational level). This review update did not identify any new eligible studies for inclusion.
Targeted behaviour
The aims of the accreditation programme were to improve the compliance with COHSASA (Council for Health Services Accreditation for South Africa) accreditation standards and to improve performance related to eight hospital quality‐of‐care indicators (Salmon 2003). The purpose of the Healthcare Commission's inspection programme was to improve trusts' compliance with the Health Act 2006 and the Code of Practice for the Prevention and Control of Healthcare Associated Infections (Department of Health 2006) related to healthcare‐acquired infections, thereby reducing the number of healthcare‐acquired infections (including MRSA infections), and increasing patients' and the public's confidence in the healthcare system (OPM 2009).
Participants and settings
The setting in the cluster RCT was 20 public hospitals in the Kwa‐Zulu province in South Africa (five urban, three peri‐urban and two rural hospitals in the intervention group; two urban, two peri‐urban and six rural hospitals in the control group) (Salmon 2003). The mean (standard deviation (SD) number of beds was 435 (± 440) in the intervention hospitals and 467 (± 526) in the control hospitals. One intervention hospital dropped out of the accreditation midway through the study, and so to retain comparability of the intervention and control groups, a similar sized hospital was removed from the control group, leaving nine hospitals in the intervention group and nine in the control group for this part of the study. Therefore, of the 20 randomised hospitals, 18 remained for the final analyses.
For the Healthcare Commission's inspection programme, all acute hospital trusts in England were included (OPM 2009).
Standards
In Salmon and colleagues, the hospital quality‐of‐care indicators were developed by consensus of an advisory board during a workshop held in South Africa in May 1999 (Salmon 2003). Present at the workshop were South African healthcare professional leaders, the managing director of COHSASA, a representative from Joint Commission International (JCI) and the principal investigators for the research study. This process resulted in 12 indicators for the first round of data collection. However, based on preliminary analysis of data collected from the first round, the research team recommended to the study steering committee that some indicators be dropped. The steering committee (composed of representatives from the research team, the sponsors of the research, COHSASA and several South African medical experts) decided to drop four of the 12 indicators (surgical wound infections, time to surgery, neonatal mortality and financial solvency). These decisions resulted in eight quality indicators (see Table 1). The reasons for abandoning the four indicators are described in Appendix 3.
| Indicator | Intervention n = 10 | Control n = 10 | Intervention effect | P value | ||||
| Time 1 | Time 2 | Change | Time 1 | Time 2 | Change | |||
| 1. Nurse perceptions | 59.3 | 60.8 | 1.5 | 60.8 | 56.5 | ‐4.2 | 15.7 | 0.031 |
| 2. Patient satisfaction | 86.9 | 91.5 | 4.6 | 87.0 | 90.1 | 3.1 | 1.5 | 0.484 |
| 3. Medical education | 42.9 | 43.1 | 0.2 | 41.5 | 40.0 | ‐1.5 | 1.7 | 0.395 |
| 4. Medical records: accessibility | 85.4 | 77.5 | ‐7.9 | 79.4 | 68.4 | ‐11.0 | 3.1 | 0.492 |
| 5. Medical records: completeness | 47.1 | 49.1 | 2.0 | 48.6 | 44.9 | ‐3.7 | 5.7 | 0.114 |
| 6. Completeness of perioperative notes | 70.2 | 72.7 | 2.5 | 65.2 | 69.6 | 4.4 | ‐1.9 | 0.489 |
| 7. Ward stock labelling | 66.0 | 81.8 | 15.8 | 45.6 | 49.6 | 4.0 | 11.8 | 0.112 |
| 8. Hospital sanitation | 59.7 | 62.8 | 3.1 | 50.2 | 55.7 | 5.5 | ‐2.4 | 0.641 |
All scores were standardised to a 100‐point scale, with 100 as high. Positive intervention effects represent improvements in intervention hospitals that exceeded the improvements in control hospitals. P values are based on an analysis of variance (ANOVA) model with intervention group and hospital size as main effects.
The Code of Practice and the Health Act 2006 used as standards in the Healthcare Commission's inspection programme (OPM 2009) were developed and launched by the Department of Health, who in 2006 enacted the new legislation with the aim to decrease the number of healthcare‐acquired infections.
Outcomes
In the study by Salmon and colleagues, there were two sets of outcome measures: the eight study‐derived quality indicators and the larger raft of COHSASA accreditation criteria (Salmon 2003). The eight indicators of hospital quality (i.e. those that remained after four indicators had been dropped) were: nurses' perceptions of clinical quality, participation and teamwork; patient satisfaction with care; patient medication education; medical records: accessibility and accuracy; medical records: completeness; completeness of perioperative notes; completeness of ward stock medicine labelling and hospital sanitation. All eight indicators were measured twice (see Table 1 for a description of the indicators). The COHSASA accreditation criteria were 6000 criteria (measurable elements) in 28 service elements (see additional Table 2) measuring aspects of hospital quality of care, of which 424 standards (in 19 generic service elements) were a priori judged by COHSASA to be critical criteria for the function of the service elements. These critical criteria were mainly drawn from the following service elements: obstetric and maternity inpatient services; operating theatre and anaesthetic services; resuscitation services; paediatric services and medical inpatient services. The accreditation standards required that systems and processes be established in clinical and non‐clinical activities of all services.
| Service elements | Intervention hospitals | Control hospitals | Mean intervention effect (95% CI) | P value | ||||||
| No of hospitals | Mean baseline | Mean external | Mean change | No of hospitals | Mean baseline | Mean external | Mean change | |||
| Management service | 9 | 50 | 79 | 29 | 10 | 42 | 44 | 2 | 27 (17 to 37) | < 0.001 |
| Administrative support | 9 | 57 | 73 | 16 | 10 | 56 | 52 | ‐4 | 20 (4 to 36) | 0.038 |
| Nursing management | 9 | 55 | 87 | 32 | 10 | 51 | 50 | ‐1 | 33 (24 to 43) | < 0.001 |
| Health and safety | 9 | 35 | 75 | 40 | 10 | 28 | 32 | 4 | 36 (23 to 51) | < 0.001 |
| Infection control | 9 | 45 | 88 | 43 | 10 | 39 | 42 | 3 | 40 (27 to 52) | < 0.001 |
| Operating theatre | 9 | 57 | 86 | 29 | 10 | 50 | 53 | 3 | 26 (16 to 35) | < 0.001 |
| Sterilising and disinfectant | 9 | 47 | 81 | 34 | 10 | 33 | 35 | 2 | 32 (22 to 41) | < 0.001 |
| Medical inpatient | 8 | 49 | 78 | 29 | 10 | 44 | 46 | 2 | 27 (17 to 35) | < 0.001 |
| Pharmaceutical | 9 | 41 | 75 | 34 | 10 | 42 | 38 | ‐4 | 38 (25 to 52) | < 0.001 |
| Paediatric inpatient | 8 | 51 | 78 | 27 | 10 | 44 | 46 | 2 | 25 (17 to 33) | < 0.001 |
| Maternity inpatient | 9 | 53 | 82 | 29 | 10 | 52 | 51 | ‐1 | 30 (23 to 36) | < 0.001 |
| Surgical inpatient | 9 | 48 | 81 | 33 | 10 | 46 | 46 | 0 | 33 (25 to 42) | < 0.001 |
| Laundry | 9 | 30 | 68 | 38 | 10 | 23 | 24 | 1 | 37 (26 to 47) | < 0.001 |
| Housekeeping | 9 | 37 | 73 | 36 | 10 | 33 | 32 | ‐1 | 37 (24 to 51) | < 0.001 |
| Maintenance | 9 | 51 | 74 | 23 | 10 | 43 | 44 | 1 | 22 (11 to 34) | 0.004 |
| Resuscitation | 9 | 31 | 83 | 52 | 10 | 25 | 25 | 0 | 52 (43 to 61) | < 0.001 |
| Food | 9 | 41 | 73 | 32 | 10 | 38 | 38 | 0 | 32 (24 to 41) | < 0.001 |
| Diagnostic | 9 | 44 | 79 | 35 | 10 | 38 | 39 | 1 | 34 (22 to 46) | < 0.001 |
| Critical care category 2 | 2 | 46 | 92 | 46 | 4 | 58 | 61 | 3 | 43 (15 to 70) | NA |
| Casual | 7 | 48 | 81 | 33 | 5 | 40 | 43 | 3 | 30 (17 to 44) | NA |
| Outpatient | 8 | 46 | 83 | 37 | 9 | 40 | 43 | 3 | 34 (20 to 47) | NA |
| Occupational | 3 | 42 | 85 | 43 | 4 | 43 | 47 | 4 | 39 (16 to 62) | NA |
| Physiotherapy | 7 | 46 | 84 | 38 | 4 | 38 | 42 | 4 | 34 (24 to 45) | NA |
| Laboratory | 9 | 46 | 85 | 39 | 8 | 43 | 40 | ‐3 | 42 (31 to 53) | < 0.001 |
| Medical life support | 9 | 37 | 74 | 37 | 10 | 21 | 23 | 2 | 35 (22 to 49) | 0.001 |
| Community health | 4 | 50 | 88 | 38 | 8 | 54 | 50 | ‐4 | 42 (28 to 56) | NA |
| Social work | 4 | 53 | 82 | 29 | 5 | 40 | 44 | 4 | 25 (6 to 41) | NA |
| Medical practitioner | 9 | 51 | 75 | 24 | 10 | 44 | 42 | ‐2 | 26 (13 to 40) | 0.004 |
| Overall services score | 9 | 48 | 78 | 30 | 10 | 43 | 43 | 0 | 30 (23 to 37) | < 0.001 |
CI: confidence interval; COHSASA: Council for Health Services Accreditation for South Africa; NA: not available
In the OPM report (OPM 2009), only one of the reported outcomes was suitable for inclusion in this review (by virtue of presenting pre‐ and postintervention quantitative data): data on rates of hospital‐acquired MRSA infections for one year before the initiation of the inspection process and for two years after. The MRSA rate is mandatory for trusts to report each quarter, and is monitored by The Health Protection Agency, and had a sufficient number of measurements before and after the intervention to allow re‐analysis as a short time series. The other outcomes reported in OPM 2009 involved aggregated uncontrolled before and after data that could not be re‐analysed as time series (e.g. data on trusts' compliance with the Code of Practice, and patient and public confidence in healthcare). Thus, we considered that we could analyse this outcome rather than being specified as an appropriate main outcome by the authors of the report.
Data collection
In the study by Salmon and colleagues, the before and after measures of compliance with the accreditation standards were collected by COHSASA surveyors (or teams hired by COHSASA), and indicators of hospital quality were collected by research assistants hired by the independent research team composed of South African and US investigators (Salmon 2003). The time between measurements of the accreditation standards differed between intervention (19 months) and control hospitals (16 months). Due to the time it took to develop and test the indicators for hospital quality, the first round of measurements was not performed until a mean of 7.4 months after COHSASA collected the baseline survey data (but was performed at the same time point in intervention and control hospitals), which resulted in a difference in the interval between baseline survey and the first indicator survey. For both the intervention hospitals and the control hospitals only about nine months separated the first and second round of indicator data collection.
In the other study, the MRSA rate was reported quarterly by the trusts, and monitored and summarised by The Health Protection Agency (OPM 2009).
Description of the intervention
Salmon 2003: COHSASA facilitators initially assisted each participating facility to understand the accreditation standards and to perform a self‐assessment (baseline survey) against the standards, which was validated by a COHSASA team. Detailed written reports on the level of compliance with the standards and reasons for non‐conformance were generated and sent to the hospitals for use in their continuous quality improvement (CQI) programme. Next, the facilitators assisted the hospitals in implementing a CQI process to enable the facilities to improve on standards identified as suboptimal in the baseline survey. Lastly, the hospital entered the accreditation (external) survey phase when a team of COHSASA surveyors who were not involved in the preparatory phase conducted an audit. The accreditation team usually consisted of a medical doctor, a nurse and an administrator who spend a mean of three days evaluating the degree to which the hospital complied with the standards and recording the areas of non‐compliance. Hospitals found by COHSASA's accreditation committee to comply substantially with the standards were awarded either preaccreditation or full accreditation status. Preaccreditation encouraged institutions to continue with the CQI process, in the expectation that this would help progress to eventual full accreditation status. In the control hospitals, the accreditation variables were measured as unobtrusively as possible, but none of the other components of the accreditation programme were performed, meaning no feedback of results and no technical assistance until after the research was completed. Meanwhile, a separate research team measured the eight study quality indicators in both the intervention and control hospitals.
OPM 2009: The Healthcare Commission Healthcare Acquired Infections Inspection Programme: the selected trusts were notified that they would be inspected at any time point within the next three months. A pre‐inspection report was produced by the assessors, using relevant data sent to the assessors by the trusts. The assessors used the pre‐inspection report to select a subset of duties described in the Code of Practice to be assessed at the next inspection. During the inspection, the inspection team looked for any breeches of the Code of Practice, and this fed into the formal inspection output, either an inspection report with recommendations or an improvement notice. The inspection report highlighted areas requiring improvements and made recommendations as to how the trust needed to improve. The trusts acted on the comments and took steps to improve practices. In contrast, an improvement notice required the trusts to draw up an action plan and specify how it would remedy the material breeches of the code that had been identified. Only once the steps to remedy the breeches to the Code of Practice had been followed was a notice lifted.
Excluded studies
In this review update, we excluded one study after obtaining and scrutinising the full text. For the previous version of the review (as for this update), the main reason for exclusion was ineligible intervention (11 studies). We excluded two papers because they were overviews, one paper due to ineligible study design and one paper could not be found. See Characteristics of excluded studies table.
Risk of bias in included studies
The risk of bias of included studies is described in the 'Risk of bias' table within the Characteristics of included studies table. Both studies had an overall high risk of bias.
Cluster randomised controlled trial
In the study by Salmon and colleagues, the allocation sequence was adequately generated: to ensure a balanced design with respect to service and care characteristics, researchers stratified the hospitals by size (number of beds) into four categories and within each stratum a simple random sample without replacement was drawn (Salmon 2003). The allocation was made by the research team, but it was unclear if it was done by an independent statistician. The hospitals were notified about the process of inspection, and could not be blinded to whether they were part of an accreditation programme. It was unclear whether the assessors were blinded. Incomplete outcome data were adequately addressed: when one of the intervention hospitals, and also one of the biggest hospitals, dropped out half way through the accreditation process, a similar‐sized hospital from the control group was excluded to yield the same number of hospitals in each group. Thus, out of 20 hospitals initially included in the trial, 18 remained for the final analysis.
It was unclear if the four indicators of hospital quality of care that were dropped (see Appendix 3) should be deemed as selective reporting of results. After the first round of measurements, the research team suggested to the independent advisory board that the four indicators should be dropped due to problems with comparability between hospitals, and, therefore, only results for eight indicators were reported in the paper.
It was also unclear if the baseline characteristics of the participating hospitals were the same in the intervention as in the control group. Seemingly more rural hospitals were included in the control group, and more urban hospitals in the intervention group.
Analysis was performed at the level of randomisation (hospital), not at the individual or record level within hospitals, thus allowing for clustering in the analysis. The baseline survey of the compliance with the accreditation standards was not performed simultaneously in intervention and control hospitals, but on average three months later in control hospitals; therefore, it is unclear whether the baseline outcome measurements were similar and the control measurements represent a true baseline.
Interrupted time series study
In the OPM report, the intervention was not necessarily independent of other changes (OPM 2009). Within the UK there had been an increasing awareness of and publicity about the problem of hospital‐acquired infections. Rates of reported cases of MRSA were already showing a downward trend one year before the inspections began.
The intervention effect was not prespecified, since nothing was mentioned about what effect (a step change or change in slope) was expected for the outcome measure (MRSA infection rate); however, since the MRSA data were re‐analysed by the review authors, we considered the risk of bias for this item low.
The intervention was unlikely to affect data collection, since sources and methods of data collection were the same before and after the intervention (The Health Protection Agency monitor quarterly mandatory reported cases by trusts).
The only re‐analysable outcome measure (MRSA rate) was objective, and thus we scored low risk for 'knowledge of the allocated interventions'.
Since quarterly reporting of cases of MRSA is mandatory for acute trusts, there were no incomplete outcome data, missing data or selective reporting of data. The study was also free from other risks of bias.
Effects of interventions
See: Summary of findings for the main comparison External inspection of compliance with COHSASA hospital accreditation standards versus no external inspection; Summary of findings 2 External inspection of compliance with the Code of Practice and the law related to healthcare‐acquired infections
The cluster RCT reported results for compliance scores with COHSASA accreditation standards, involving 28 service elements and performance related to eight study quality‐of‐care indicators (Salmon 2003). The results are summarised in summary of findings Table for the main comparison and Table 3.
| Author Year | Compliance with COHSASA accreditation standards (28 service elements) | Hospital quality indicators (n = 8) |
| At 2 years' follow‐up: Total compliance score for 21/28 service elements, for which comparisons were possible, rose from 48% to 78% in intervention hospitals, while control hospitals maintained the same compliance score throughout (43%). Mean intervention effect was 30% (23% to 37%). Looking at the individual scores of compliance with the accreditation standards for each service element, the results were mixed, with 21/28 service elements showing a beneficial effect of the inspections. Mean intervention effect ranged from 20% to 52%, while data for the remaining 7 service elements were not available, i.e. some of the service elements were only evaluated in the higher‐level hospitals, so comparisons between the intervention and control hospitals was not appropriate due to small sample size. Subanalysis of the standards that a priori were deemed by the COHSASA as being 'critical' for a specific function was performed. As some of the 28 service elements evaluated in the accreditation process were not applicable for all hospitals, this left 19 generic service elements, yielding 424 critical criteria for the subanalysis. These critical criteria were mainly drawn from the following service elements: obstetric and maternity inpatient services; operating theatre and anaesthetic services; resuscitation services; paediatric services and medical inpatient services. Subanalysis showed improved mean compliance with the critical standards in intervention hospitals: total score rose from 38% (range 21% to 46%) to 76% (range 55% to 96%). Control hospitals maintained the same compliance score throughout: 37% (range 28% to 47%) before the intervention and 38% (range 25% to 49%) after the intervention. There was a difference in means between groups (P < 0.001). | Effects on the hospital quality indicators were mixed, with mean intervention effects ranging from ‐1.9 to +11.8, and only 1/8 indicators: 'nurses' perception of clinical care', showed a beneficial effect of the intervention (see below). Nurses' perception of clinical care Intervention hospitals: pre: 59.3%, post: 60.8% (change 1.5%); control hospitals: pre: 60.8%, post: 56.5% (change ‐4.2%); intervention effect: 5.7 percentage points (P = 0.031). Patient satisfaction with care: Intervention hospitals: pre: 86.9%, post: 91.5% (change 4.6%); control hospitals: pre: 87.0%, post: 90.1% (change 3.1%); intervention effect: 1.5 percentage points (P = 0.484). Patient medication education: Intervention hospitals: pre: 42.9%, post: 43.1% (change 0.2%); control hospitals: pre: 41.5%, post: 40.0% (change ‐1.5%); intervention effect: 1.7 percentage points (P = 0.395). Medical records: accessibility: Intervention hospitals: pre: 85.4%, post: 77.5% (change ‐7.9%); control hospitals: pre: 79.4%, post: 68.4% (change ‐11.0%); intervention effect: 3.1 percentage points (P = 0.492). Medical records: completeness (consisting of 2 components: admissions and discharge): Intervention hospitals: pre: 47.1%, post: 49.1% (change 2.0%); control hospitals: pre: 48.6%, post: 44.9% (change ‐3.7%); intervention effect: 5.7 percentage points (P = 0.114). Completeness of peri‐operative notes: Intervention hospitals: pre: 70.2%, post: 72.7% (change 2.5%); control hospitals: pre: 65.2%, post: 69.6% (change 4.4); intervention effect: ‐1.9 percentage points (P = 0.489). Ward stock labelling: Intervention hospitals: pre: 66.0%, post: 81.8% (change 15.8%); control hospitals: pre: 45.6%, post: 49.6% (change 4.0%); intervention effect: 11.8 percentage points (P = 0.112). Hospital sanitation*: Intervention hospitals: pre: 59.7%, post: 62.8% (change 3.1%); control hospitals: pre: 50.2%, post: 55.7% (change 5.5); intervention effect: ‐2.4 percentage points (P = 0.641). * Consisted of the assessment of 6 items (availability of soap, water, paper towels and toilet paper and whether toilets were clean and in working order) of which a composite score was developed. |
COHSASA: Council for Health Services Accreditation for South Africa.
Salmon and colleagues reported higher total mean compliance score with COHSASA accreditation standards in intervention hospitals (Salmon 2003). The total score for 21/28 service elements, for which comparisons were possible, rose from 48% (range 30% to 57%) to 78% (range 68% to 92%) in intervention hospitals, while control hospitals maintained the same score throughout: 43% (range 21% to 58%) before the intervention and 43% (range 23% to 61%) after the intervention. The mean intervention effect was 30% (95% CI 23% to 37%) (P < 0.001).
In terms of individual scores of compliance with accreditation standards, 21/28 service elements showed a beneficial effect of the inspections (mean intervention effects ranging from 20% to 52%). For the remaining seven service elements, data were not available (i.e. some of the service elements were only evaluated in some hospitals, so comparisons between the intervention and control groups were not appropriate due to small sample size).
A subanalysis of 424 a priori identified critical criteria (in 19 generic service elements) showed greater mean compliance with the critical standards in intervention hospitals: the total overall compliance score rose from 38% (range 21% to 46%) to 76% (range 55% to 96%). Control hospitals maintained the same compliance score throughout: 37% (range 28% to 47%) before the intervention and 38% (range 25% to 49%) after the intervention. There was a difference in means between groups (P < 0.001).
Only one of the nine intervention hospitals gained full accreditation status during the study period.
The same authors reported little or no effect of the accreditation system on the performance related to eight study indicators of hospital quality of care: median intervention effect of 2.4 percentage points (range ‐1.9% to +11.8%) (Salmon 2003). Only for one of the quality indicator 'nurses' perception of clinical quality, participation and teamwork' the intervention effect was different between groups (5.7 percentage points higher in the accreditation group, P = 0.03). The increase in intervention hospitals was 1.5 percentage points (from 59.3% to 60.8%), while there was a decrease with ‐4.2 percentage points (from 60.8% to 56.5%) in control hospitals. All other indicators, patient satisfaction included (intervention effect 1.5%, P = 0.484), were similar between groups (see Characteristics of included studies table).
The OPM study reported results for MRSA rates (OPM 2009). The results are detailed in Table 4 and summarised in summary of findings Table 2.
| Author Year | Infection rate |
| Date; No of cases Re‐analysis of the MRSA data, as an ITS: Difference (24.27, 95% CI ‐10.4 to 58.9) between the preslope (‐107.6) and the postslope (‐83.32) suggested similar infection rates before and after the inspection (P = 0.147). When the downward trend in MRSA rate before the intervention was considered, the results showed a mean (95% CI) decrease with 100 (‐221.0 to 21.5) cases at 3 months' follow‐up (P = 0.096), 75 (‐217.2 to 66.3) cases at 6 months' follow‐up (P = ‐0.259), 27 (‐222.1 to 168.2) cases at 12 months' follow‐up (P = 0.62), and an increase with 70 (‐250.5 to 391) cases per quarter at 24 months' follow‐up (P = 0.632). |
CI: confidence interval; ITS: interrupted time series; MRSA: methicillin‐resistant Staphylococcus aureus.
Re‐analysis of the quarterly reported MRSA data, as an ITS, showed no difference in MRSA rate before and after the Healthcare Commission's inspection programme. The difference (24.27, 95% CI ‐10.4 to 58.9) between the pre slope (‐107.6) and the post slope (‐83.32) suggest no difference between groups (P = 0.147). When the downward trend in MRSA rate before the intervention had been considered, the results showed a mean decrease with 100 (95% CI ‐221.0 to 21.5) cases at three months' follow‐up (P = 0.096), 75 (95% CI ‐217.2 to 66.3) cases at six months' follow‐up (P = 0.259), 27 (95% CI ‐222.1 to 168.2) cases at 12 months' follow‐up (P = 0.762), and an increase with 70 (95% CI ‐250.5 to 391) cases per quarter at 24 months' follow‐up (P = 0.632). Data relating to patient satisfaction were not reported.
Neither included study reported data on unanticipated/adverse consequences or economic outcomes.
Discussion
Summary of main results
We did not identify any new studies for inclusion in this review update (Flodgren 2011). This review includes two studies (one study that provided time series data and one cluster RCT) (Salmon 2003; OPM 2009). The RCT study reported improved mean total compliance score with COHSASA standards in intervention hospitals, as well as improved compliance with predetermined critical criteria assessed in a subanalysis (Salmon 2003). A beneficial effect of the intervention was reported only for one out of eight indicators of hospital quality. However, it is uncertain whether external inspection leads to improved compliance with standards because the certainty of the evidence was very low. Only one of the intervention hospitals achieved accreditation status at the end of the study period.
It is also uncertain whether the Healthcare Commissions Healthcare Associated Infections Inspection Programme may lead to lower MRSA infection rates or not because the certainty of the evidence is very low. However, the inspection programme was only one element of a wider range of interventions being applied to infection control in the UK NHS at that time (OPM 2009). Even before the introduction of the inspection programme, there was a negative tie trend (infection rates were decreasing) ‐ but the introduction of the inspection programme did not accelerate that trend.
It is reasonable to assume that many of the low‐income countries' issues apply to middle‐income countries too. The hospital accreditation programme was performed in a upper‐middle‐income country (Salmon 2003), while the Healthcare Commissions Healthcare Associated Infections Inspection Programme was not (OPM 2009). It is not possible, or even desirable, to compare or synthesise results from studies in which the conditions during which healthcare is provided are so different (e.g. in Salmon 2003, basic necessities such as soap and papers towels were not available in more than half of the included hospitals).
The way the assessors used data from the inspection to accomplish change (i.e. improved compliance with standards in the healthcare organisation being inspected) differed between studies. When the inspection was performed by a non‐governmental body, the assessors could recommend change, but had no power to enforce it. In contrast, the Healthcare Commission, as a governmental body, had the means to enforce change and make organisations improve their compliance with standards through 'inspection notices'. There is a trend today towards mandatory accreditation systems, for example in Canada, but still little is known about the effects of accreditation on healthcare outcomes (Pomey 2010).
Overall completeness and applicability of evidence
The evidence is limited in scale, content and generalisability. With only two studies, and low certainty of the included evidence, it is difficult to draw any clear conclusions about the effectiveness of external inspection of compliance with external standards beyond their effects within the two included studies.
Of the outcomes reported by Salmon and colleagues, the majority were outcomes of healthcare organisation change, and only one healthcare professional outcome (nurse perception of quality of care) and one patient outcome was reported (patient satisfaction with care) (Salmon 2003). Unfortunately, important outcomes (e.g. morbidity and mortality), had to be dropped during the research process due to problems with comparability between hospitals. Furthermore, the lack of information about the tool used to measure patient satisfaction, namely its validity and reliability, limits the interpretation of the data. In the evaluation of the Healthcare Commissions inspection programme (OPM 2009), most reported data were uncontrolled before‐after data, and only data on MRSA rate could be re‐analysed and included in this review. Neither study reported any unintended effects of the inspection.
Even if external inspection is associated with non‐negligible costs, and little evidence of its cost‐effectiveness exist to date (Shaw 2003), neither of the studies included in the review reported any cost data. There are furthermore indirect costs of external inspection that were not considered, namely the costs of putting measures in place to demonstrate compliance with the standards of care and displacement costs, where outcomes that are known to be inspected will be prioritised over others that will not (Davis 2001). Both included studies evaluated the effects of external inspection in secondary care, and the results cannot therefore be generalised to primary care.
This review raises the interesting question of the reasonable anticipated effect of an intervention such as external inspection. If a process of inspection identifies any deficiencies, then the anticipated response would be a number of changes at an organisational level with potential changes in care processes and thus patient outcomes. Although external inspection might be the trigger to such a series of events, the further along the causal chain one goes, the less its direct influence as a direct cause of changes is likely to be. Likewise, the impact of inspection might only be observable several years after it has been conducted (Davis 2001). Therefore, the most direct outcomes should be regarded as the subsequent organisational (and probably professional behaviour) changes with patient outcomes being regarded as a more distant (and less directly connected) outcome. The included studies illustrated this in different ways. In the study by Salmon and colleagues, the external inspection identified a cascade of consequent events (Salmon 2003); in the OPM report, the data analysed were clearly collected and reported in a milieu of a range of other interventions (OPM 2009). However, it is not quite that simple, as in the OPM report an outcome measure that is apparently a patient outcome (infection rate) is clearly regarded as an important organisational‐level indicator of organisational performance. Therefore, the choice of outcomes for an intervention such as external inspection has to be made in a way that allows for an appropriate diversity of measures that reflect the underlying issues that may have triggered the inspection.
Quality of the evidence
The evidence that we identified has to be regarded as sparse and susceptible to bias. The ITS study generally scored 'low' on the risk of bias assessment except for the criterion on independence from other changes, for which it scored 'high' (OPM 2009). The cluster RCT scored as 'unclear' on three of the 'Risk of bias' criteria (blinding of participants, blinding of outcome assessors and time differences in outcome measurements) and was therefore judged at high risk of bias (Salmon 2003). The certainty of the evidence in both the cluster RCT and the re‐analysed ITS study was downgraded due to high risk of bias and imprecision, and judged to be very low.
Potential biases in the review process
One review author first screened all references found by the electronic searches (update search only) to remove clearly irrelevant studies, and two review authors assessed the remaining references. Two review authors independently extracted data and assessed the risk of bias of included studies.
The search was difficult to conduct as there were few specific terms that we could use. Although an experienced information technologist carefully developed the search strategy, an information technologist at the editorial base review it, and we searched the home pages of many accreditation bodies, we cannot exclude the possibility that important references may have been missed.
There is also the risk of publication bias (i.e. that only studies showing a beneficial effect of intervention were published and not studies pointing towards little or no effect of intervention) (Hopewell 2009). Unfortunately, because we identified too few studies for inclusion in this review, we could not assess publication bias.
Agreements and disagreements with other studies or reviews
We are not aware of any other systematic reviews evaluating the effects of external inspection of compliance with standards on healthcare outcomes. We found one Norwegian retrospective exploratory review related to the topic, but which looked at how external inspecting organisations express and state their grounds for non‐compliant behaviour and how they follow‐up to enforce improvements (Hovlid 2015). Something which was not a part of this review. The two studies included in this review reported very few patient outcomes. One Australian report confirmed the lack of causal inferences in studies evaluating the effectiveness of external inspection on patient outcomes (Hart 2013).

Study flow diagram.
| External inspection of compliance with COHSASA hospital accreditation standards versus no external inspection | ||||
| Recipient: public hospitals Settings: KwaZulu province, the Republic of South Africa Intervention: external inspection of compliance with accreditation standards Comparison: no inspection | ||||
| Outcomes | Intervention effect (range) | No of studies (hospitals) | Certainty of the evidence | Comments |
| Compliance with COHSASA accreditation standards at 2 years' follow‐up (change in total compliance score for 21/28 service elements ‐ for 7/28 service elements, data were not available) | I: pre: 48% (not reported), post: 78% (not reported) C: pre: 43% (not reported), post: 43% (not reported) Mean intervention effect: 30% (23% to 37%), P < 0.001 | 1 (18) | ⊕⊖⊖⊖ Very low 1,2 | Uncertain whether external inspection leads to improved compliance with standards. |
| Compliance with COHSASA accreditation standards ‐ subgroup of critical criteria analysed at 2 years' follow‐up (compliance score for 19 generic service elements, involving 426 predefined critical criteria) | I: pre: 38% (21% to 46%), post: 76% (55% to 96%) C: pre: 37% (28% to 47%), post: 38% (25% to 49%) Mean intervention effect: 37% (not reported), P < 0.001 | 1 (18) | ⊕⊖⊖⊖ Very low 1,2 | Uncertain whether external inspection leads to improved compliance with standards. |
| Indicators for hospital quality of care at 2 years' follow‐up | Median intervention effect: 2.4% (‐1.9% to 11.8%) | 1 (18) | ⊕⊖⊖⊖ Very low 1,2 | Uncertain whether external inspection improves median quality indicator scores. Only 1 of the indicators was indicative of higher quality in accreditation hospitals. |
| Mortality and condition‐specific measures of outcome related to patients' health | ‐ | ‐ | ‐ | Not measured or reported. |
| Unanticipated/adverse consequences | ‐ | ‐ | ‐ | Not measured or reported. |
| Costs and cost effectiveness | ‐ | ‐ | ‐ | Not measured or reported. |
| High = This research provides a very good indication of the likely effect. The likelihood that the effect will be substantially different‡ is low. Moderate = This research provides a good indication of the likely effect. The likelihood that the effect will be substantially different‡ is moderate. Low = This research provides some indication of the likely effect. However, the likelihood that it will be substantially different‡ is high. Very low = This research does not provide a reliable indication of the likely effect. The likelihood that the effect will be substantially different‡ is very high. ‡ Substantially different = a large enough difference that it might affect a decision. | ||||
| 1 Downgraded two levels for very serious risk of bias due to unclear blinding, baseline compliance and time differences in outcome measurements. 2 Downgraded one level for serious imprecision due to the small sample size and wide confidence intervals. C: control; COHSASA: Council for Health Services Accreditation for South Africa; I: intervention. | ||||
| External inspection of compliance with the Code of Practice and the law related to healthcare‐acquired infections | ||||
| Recipient: all acute trusts Settings: England Intervention: external inspection of compliance with the Code of Practice and the Health Act 2006 related to healthcare‐acquired infections Comparison: no control group (time series) | ||||
| Outcomes | Mean intervention effect (95% CI) | No of studies (trusts) | Certainty of the evidence | Comments |
| MRSA infection rate | At 3 months: ‐100 (‐221.0 to 21.5) cases per quarter (P = 0.096) | 1 (168) | ⊕⊖⊖⊖ Very low1,2 | Uncertain whether external inspection lowers MRSA infection rates. Regression analysis showed similar MRSA rate before and after the external inspection (difference in slope 24.27, 95% CI ‐10.4 to 58.9; P = 0.147). |
| Unanticipated/adverse consequences | ‐ | ‐ | ‐ | Not measured or reported. |
| Costs and cost effectiveness | ‐ | ‐ | ‐ | Not measured or reported. |
| High = This research provides a very good indication of the likely effect. The likelihood that the effect will be substantially different‡ is low. Moderate = This research provides a good indication of the likely effect. The likelihood that the effect will be substantially different‡ is moderate. Low = This research provides some indication of the likely effect. However, the likelihood that it will be substantially different‡ is high. Very low = This research does not provide a reliable indication of the likely effect. The likelihood that the effect will be substantially different‡ is very high. ‡ Substantially different = a large enough difference that it might affect a decision. | ||||
| 1 Downgraded one level for serious risk of bias due to the probability that the intervention was not independent of other changes. 2 Downgraded one level for serious imprecision due to wide confidence intervals. CI: confidence interval; MRSA: methicillin‐resistant Staphylococcus aureus. | ||||
| Indicator | Intervention n = 10 | Control n = 10 | Intervention effect | P value | ||||
| Time 1 | Time 2 | Change | Time 1 | Time 2 | Change | |||
| 1. Nurse perceptions | 59.3 | 60.8 | 1.5 | 60.8 | 56.5 | ‐4.2 | 15.7 | 0.031 |
| 2. Patient satisfaction | 86.9 | 91.5 | 4.6 | 87.0 | 90.1 | 3.1 | 1.5 | 0.484 |
| 3. Medical education | 42.9 | 43.1 | 0.2 | 41.5 | 40.0 | ‐1.5 | 1.7 | 0.395 |
| 4. Medical records: accessibility | 85.4 | 77.5 | ‐7.9 | 79.4 | 68.4 | ‐11.0 | 3.1 | 0.492 |
| 5. Medical records: completeness | 47.1 | 49.1 | 2.0 | 48.6 | 44.9 | ‐3.7 | 5.7 | 0.114 |
| 6. Completeness of perioperative notes | 70.2 | 72.7 | 2.5 | 65.2 | 69.6 | 4.4 | ‐1.9 | 0.489 |
| 7. Ward stock labelling | 66.0 | 81.8 | 15.8 | 45.6 | 49.6 | 4.0 | 11.8 | 0.112 |
| 8. Hospital sanitation | 59.7 | 62.8 | 3.1 | 50.2 | 55.7 | 5.5 | ‐2.4 | 0.641 |
| All scores were standardised to a 100‐point scale, with 100 as high. Positive intervention effects represent improvements in intervention hospitals that exceeded the improvements in control hospitals. P values are based on an analysis of variance (ANOVA) model with intervention group and hospital size as main effects. | ||||||||
| Service elements | Intervention hospitals | Control hospitals | Mean intervention effect (95% CI) | P value | ||||||
| No of hospitals | Mean baseline | Mean external | Mean change | No of hospitals | Mean baseline | Mean external | Mean change | |||
| Management service | 9 | 50 | 79 | 29 | 10 | 42 | 44 | 2 | 27 (17 to 37) | < 0.001 |
| Administrative support | 9 | 57 | 73 | 16 | 10 | 56 | 52 | ‐4 | 20 (4 to 36) | 0.038 |
| Nursing management | 9 | 55 | 87 | 32 | 10 | 51 | 50 | ‐1 | 33 (24 to 43) | < 0.001 |
| Health and safety | 9 | 35 | 75 | 40 | 10 | 28 | 32 | 4 | 36 (23 to 51) | < 0.001 |
| Infection control | 9 | 45 | 88 | 43 | 10 | 39 | 42 | 3 | 40 (27 to 52) | < 0.001 |
| Operating theatre | 9 | 57 | 86 | 29 | 10 | 50 | 53 | 3 | 26 (16 to 35) | < 0.001 |
| Sterilising and disinfectant | 9 | 47 | 81 | 34 | 10 | 33 | 35 | 2 | 32 (22 to 41) | < 0.001 |
| Medical inpatient | 8 | 49 | 78 | 29 | 10 | 44 | 46 | 2 | 27 (17 to 35) | < 0.001 |
| Pharmaceutical | 9 | 41 | 75 | 34 | 10 | 42 | 38 | ‐4 | 38 (25 to 52) | < 0.001 |
| Paediatric inpatient | 8 | 51 | 78 | 27 | 10 | 44 | 46 | 2 | 25 (17 to 33) | < 0.001 |
| Maternity inpatient | 9 | 53 | 82 | 29 | 10 | 52 | 51 | ‐1 | 30 (23 to 36) | < 0.001 |
| Surgical inpatient | 9 | 48 | 81 | 33 | 10 | 46 | 46 | 0 | 33 (25 to 42) | < 0.001 |
| Laundry | 9 | 30 | 68 | 38 | 10 | 23 | 24 | 1 | 37 (26 to 47) | < 0.001 |
| Housekeeping | 9 | 37 | 73 | 36 | 10 | 33 | 32 | ‐1 | 37 (24 to 51) | < 0.001 |
| Maintenance | 9 | 51 | 74 | 23 | 10 | 43 | 44 | 1 | 22 (11 to 34) | 0.004 |
| Resuscitation | 9 | 31 | 83 | 52 | 10 | 25 | 25 | 0 | 52 (43 to 61) | < 0.001 |
| Food | 9 | 41 | 73 | 32 | 10 | 38 | 38 | 0 | 32 (24 to 41) | < 0.001 |
| Diagnostic | 9 | 44 | 79 | 35 | 10 | 38 | 39 | 1 | 34 (22 to 46) | < 0.001 |
| Critical care category 2 | 2 | 46 | 92 | 46 | 4 | 58 | 61 | 3 | 43 (15 to 70) | NA |
| Casual | 7 | 48 | 81 | 33 | 5 | 40 | 43 | 3 | 30 (17 to 44) | NA |
| Outpatient | 8 | 46 | 83 | 37 | 9 | 40 | 43 | 3 | 34 (20 to 47) | NA |
| Occupational | 3 | 42 | 85 | 43 | 4 | 43 | 47 | 4 | 39 (16 to 62) | NA |
| Physiotherapy | 7 | 46 | 84 | 38 | 4 | 38 | 42 | 4 | 34 (24 to 45) | NA |
| Laboratory | 9 | 46 | 85 | 39 | 8 | 43 | 40 | ‐3 | 42 (31 to 53) | < 0.001 |
| Medical life support | 9 | 37 | 74 | 37 | 10 | 21 | 23 | 2 | 35 (22 to 49) | 0.001 |
| Community health | 4 | 50 | 88 | 38 | 8 | 54 | 50 | ‐4 | 42 (28 to 56) | NA |
| Social work | 4 | 53 | 82 | 29 | 5 | 40 | 44 | 4 | 25 (6 to 41) | NA |
| Medical practitioner | 9 | 51 | 75 | 24 | 10 | 44 | 42 | ‐2 | 26 (13 to 40) | 0.004 |
| Overall services score | 9 | 48 | 78 | 30 | 10 | 43 | 43 | 0 | 30 (23 to 37) | < 0.001 |
| CI: confidence interval; COHSASA: Council for Health Services Accreditation for South Africa; NA: not available | ||||||||||
| Author Year | Compliance with COHSASA accreditation standards (28 service elements) | Hospital quality indicators (n = 8) |
| At 2 years' follow‐up: Total compliance score for 21/28 service elements, for which comparisons were possible, rose from 48% to 78% in intervention hospitals, while control hospitals maintained the same compliance score throughout (43%). Mean intervention effect was 30% (23% to 37%). Looking at the individual scores of compliance with the accreditation standards for each service element, the results were mixed, with 21/28 service elements showing a beneficial effect of the inspections. Mean intervention effect ranged from 20% to 52%, while data for the remaining 7 service elements were not available, i.e. some of the service elements were only evaluated in the higher‐level hospitals, so comparisons between the intervention and control hospitals was not appropriate due to small sample size. Subanalysis of the standards that a priori were deemed by the COHSASA as being 'critical' for a specific function was performed. As some of the 28 service elements evaluated in the accreditation process were not applicable for all hospitals, this left 19 generic service elements, yielding 424 critical criteria for the subanalysis. These critical criteria were mainly drawn from the following service elements: obstetric and maternity inpatient services; operating theatre and anaesthetic services; resuscitation services; paediatric services and medical inpatient services. Subanalysis showed improved mean compliance with the critical standards in intervention hospitals: total score rose from 38% (range 21% to 46%) to 76% (range 55% to 96%). Control hospitals maintained the same compliance score throughout: 37% (range 28% to 47%) before the intervention and 38% (range 25% to 49%) after the intervention. There was a difference in means between groups (P < 0.001). | Effects on the hospital quality indicators were mixed, with mean intervention effects ranging from ‐1.9 to +11.8, and only 1/8 indicators: 'nurses' perception of clinical care', showed a beneficial effect of the intervention (see below). Nurses' perception of clinical care Intervention hospitals: pre: 59.3%, post: 60.8% (change 1.5%); control hospitals: pre: 60.8%, post: 56.5% (change ‐4.2%); intervention effect: 5.7 percentage points (P = 0.031). Patient satisfaction with care: Intervention hospitals: pre: 86.9%, post: 91.5% (change 4.6%); control hospitals: pre: 87.0%, post: 90.1% (change 3.1%); intervention effect: 1.5 percentage points (P = 0.484). Patient medication education: Intervention hospitals: pre: 42.9%, post: 43.1% (change 0.2%); control hospitals: pre: 41.5%, post: 40.0% (change ‐1.5%); intervention effect: 1.7 percentage points (P = 0.395). Medical records: accessibility: Intervention hospitals: pre: 85.4%, post: 77.5% (change ‐7.9%); control hospitals: pre: 79.4%, post: 68.4% (change ‐11.0%); intervention effect: 3.1 percentage points (P = 0.492). Medical records: completeness (consisting of 2 components: admissions and discharge): Intervention hospitals: pre: 47.1%, post: 49.1% (change 2.0%); control hospitals: pre: 48.6%, post: 44.9% (change ‐3.7%); intervention effect: 5.7 percentage points (P = 0.114). Completeness of peri‐operative notes: Intervention hospitals: pre: 70.2%, post: 72.7% (change 2.5%); control hospitals: pre: 65.2%, post: 69.6% (change 4.4); intervention effect: ‐1.9 percentage points (P = 0.489). Ward stock labelling: Intervention hospitals: pre: 66.0%, post: 81.8% (change 15.8%); control hospitals: pre: 45.6%, post: 49.6% (change 4.0%); intervention effect: 11.8 percentage points (P = 0.112). Hospital sanitation*: Intervention hospitals: pre: 59.7%, post: 62.8% (change 3.1%); control hospitals: pre: 50.2%, post: 55.7% (change 5.5); intervention effect: ‐2.4 percentage points (P = 0.641). * Consisted of the assessment of 6 items (availability of soap, water, paper towels and toilet paper and whether toilets were clean and in working order) of which a composite score was developed. | |
| COHSASA: Council for Health Services Accreditation for South Africa. | ||
| Author Year | Infection rate |
| Date; No of cases Re‐analysis of the MRSA data, as an ITS: Difference (24.27, 95% CI ‐10.4 to 58.9) between the preslope (‐107.6) and the postslope (‐83.32) suggested similar infection rates before and after the inspection (P = 0.147). When the downward trend in MRSA rate before the intervention was considered, the results showed a mean (95% CI) decrease with 100 (‐221.0 to 21.5) cases at 3 months' follow‐up (P = 0.096), 75 (‐217.2 to 66.3) cases at 6 months' follow‐up (P = ‐0.259), 27 (‐222.1 to 168.2) cases at 12 months' follow‐up (P = 0.62), and an increase with 70 (‐250.5 to 391) cases per quarter at 24 months' follow‐up (P = 0.632). | |
| CI: confidence interval; ITS: interrupted time series; MRSA: methicillin‐resistant Staphylococcus aureus. | |