Agonista beta2 de acción prolongada además del tiotropio versus tiotropio o agonista beta2 de acción prolongada solo para la enfermedad pulmonar obstructiva crónica
Información
- DOI:
- https://doi.org/10.1002/14651858.CD008989.pub3Copiar DOI

- Base de datos:
-
- Cochrane Database of Systematic Reviews
- Versión publicada:
-
- 22 octubre 2015see what's new
- Tipo:
-
- Intervention
- Etapa:
-
- Review
- Grupo Editorial Cochrane:
-
Grupo Cochrane de Vías respiratorias
- Copyright:
-
- Copyright © 2015 The Cochrane Collaboration. Published by John Wiley & Sons, Ltd.
Cifras del artículo
Altmetric:
Citado por:
Autores
Contributions of authors
Hugo Farne assessed the updated database search for studies for inclusion, extracted data (duplicated by Chris Cates), conducted the analysis and wrote the updated review with input from Chris Cates. Chris Cates performed the updated search of ClinicalTrials.gov, which both authors reviewed separately for studies for inclusion.
Sources of support
Internal sources
-
Christopher Cates, UK.
St Georges, University of London
External sources
-
The authors declare that no such funding was received for this systematic review, Other.
Declarations of interest
None known.
Acknowledgements
We are grateful to Elizabeth Stovold for help in designing the search strategy, and to Charlotta Karner for performing the original review that formed the basis of this update.
The original review team are grateful to Elizabeth Stovold for help in designing the search strategy, Elora Baishnab for going through the search and extracting data for relevant studies, and Steven Edwards for his feedback on incorporation of an economic perspective in the review.
John White was the editor for this review and commented critically on the review.
The original review was funded by National Institute for Health Research (NIHR) programme grant 10/4001/01. This review update is supported by the NIHR, via Cochrane Infrastructure funding to the Cochrane Airways Group. The views and opinions expressed therein are those of the authors and do not necessarily reflect those of the Systematic Reviews Programme, NIHR, the National Health Service (NHS), or the Department of Health.
The 'Background' and 'Methods' section of this review is based on a standard template used by Cochrane Airways Group.
Version history
| Published | Title | Stage | Authors | Version |
| 2015 Oct 22 | Long‐acting beta<sub>2</sub>‐agonist in addition to tiotropium versus either tiotropium or long‐acting beta<sub>2</sub>‐agonist alone for chronic obstructive pulmonary disease | Review | Hugo A Farne, Christopher J Cates | |
| 2012 Apr 18 | Long‐acting beta<sub>2</sub>‐agonist in addition to tiotropium versus either tiotropium or long‐acting beta<sub>2</sub>‐agonist alone for chronic obstructive pulmonary disease | Review | Charlotta Karner, Christopher J Cates | |
| 2011 Feb 16 | Long‐acting beta<sub>2</sub>‐agonist in addition to tiotropium versus either tiotropium or long‐acting beta<sub>2</sub>‐agonist alone for chronic obstructive pulmonary disease | Protocol | Charlotta Karner, Christopher J Cates | |
Differences between protocol and review
Outcomes used in the summary of findings table changed for the 2015 update.
Keywords
MeSH
Medical Subject Headings (MeSH) Keywords
- Adrenergic beta‐2 Receptor Agonists [*therapeutic use];
- Albuterol [analogs & derivatives, therapeutic use];
- Bronchodilator Agents [*therapeutic use];
- Ethanolamines [therapeutic use];
- Formoterol Fumarate [therapeutic use];
- Indans [therapeutic use];
- Pulmonary Disease, Chronic Obstructive [*drug therapy];
- Quality of Life;
- Quinolones [therapeutic use];
- Randomized Controlled Trials as Topic;
- Salmeterol Xinafoate [therapeutic use];
- Scopolamine Derivatives [therapeutic use];
- Tiotropium Bromide [*therapeutic use];
Medical Subject Headings Check Words
Aged; Humans; Middle Aged;
PICO

On tiotropium/olodaterol combination, at six months there were 55 SGRQ (St George's Respiratory Questionnaire) responders out of 100 (95% confidence interval 52 to 57) compared to 48 out of 100 on tiotropium alone.

With tiotropium/olodaterol combination there were 55 SGRQ (St George's Respiratory Questionnaire) responders out of 100 (95% confidence interval 51 to 59) compared to 45 out of 100 with olodaterol alone.

Study flow diagram.

Risk of bias summary: review authors' judgements about each risk of bias item for each included study (note: not all studies compared long‐acting beta2‐agonists (LABA) plus tiotropium (TIO) versus LABA and this means that these have empty squares in the fourth column).
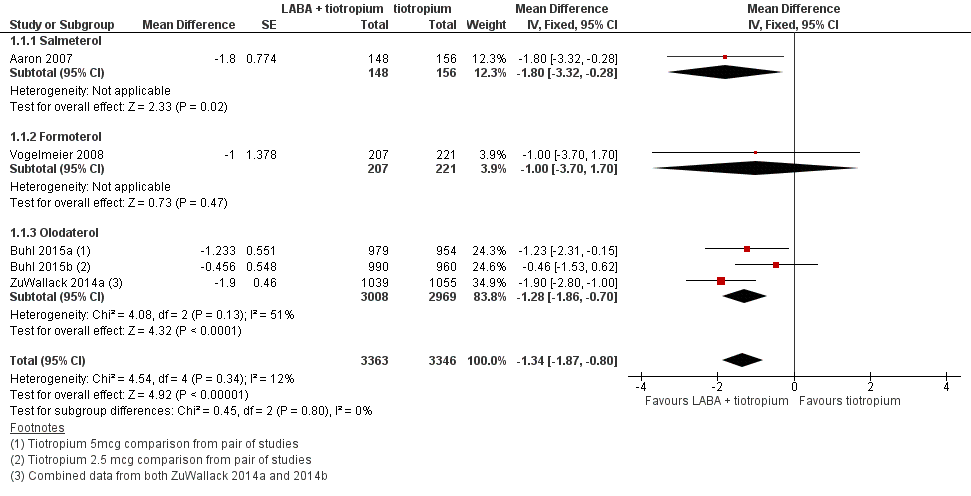
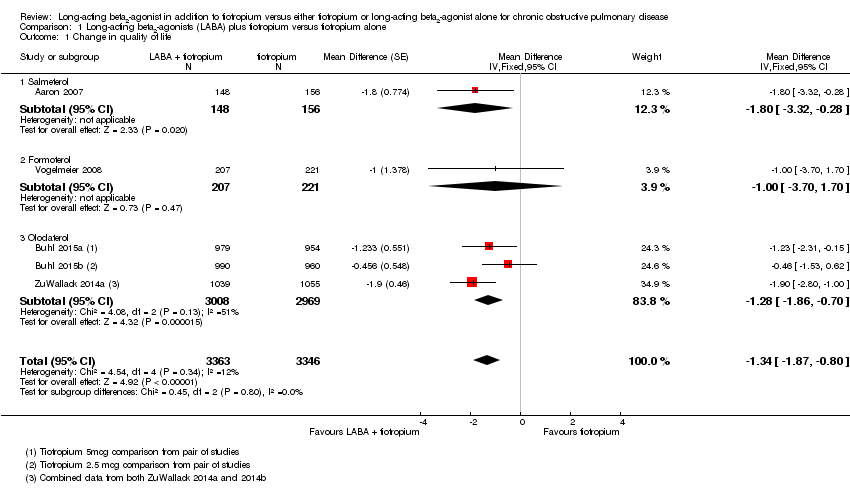
Forest plot of comparison: 1 Long‐acting beta2‐agonists (LABA) plus tiotropium versus tiotropium alone, outcome: 1.1 Change in quality of life.

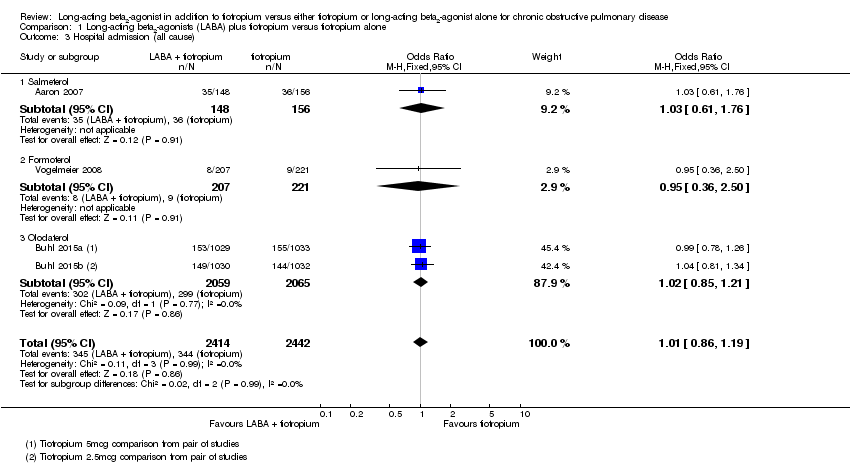
Forest plot of comparison: 1 Long‐acting beta2‐agonists (LABA) plus tiotropium versus tiotropium alone, outcome: 1.3 Hospital admission (all cause).

Forest plot of comparison: 1 Long‐acting beta2‐agonists (LABA) plus tiotropium versus tiotropium alone, outcome: 1.4 Hospital admission (exacerbation).

Forest plot of comparison: 1 Long‐acting beta2‐agonists (LABA) plus tiotropium versus tiotropium alone, outcome: 1.5 Mortality (all cause).
Comparison 1 Long‐acting beta2‐agonists (LABA) plus tiotropium versus tiotropium alone, Outcome 1 Change in quality of life.
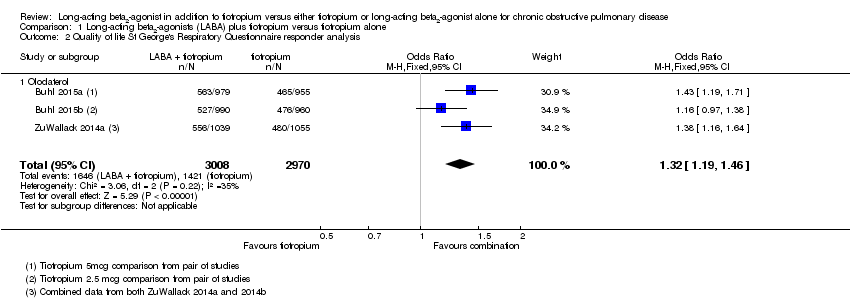
Comparison 1 Long‐acting beta2‐agonists (LABA) plus tiotropium versus tiotropium alone, Outcome 2 Quality of life St George's Respiratory Questionnaire responder analysis.
Comparison 1 Long‐acting beta2‐agonists (LABA) plus tiotropium versus tiotropium alone, Outcome 3 Hospital admission (all cause).

Comparison 1 Long‐acting beta2‐agonists (LABA) plus tiotropium versus tiotropium alone, Outcome 4 Hospital admission (exacerbation).

Comparison 1 Long‐acting beta2‐agonists (LABA) plus tiotropium versus tiotropium alone, Outcome 5 Mortality (all cause).

Comparison 1 Long‐acting beta2‐agonists (LABA) plus tiotropium versus tiotropium alone, Outcome 6 Exacerbation.
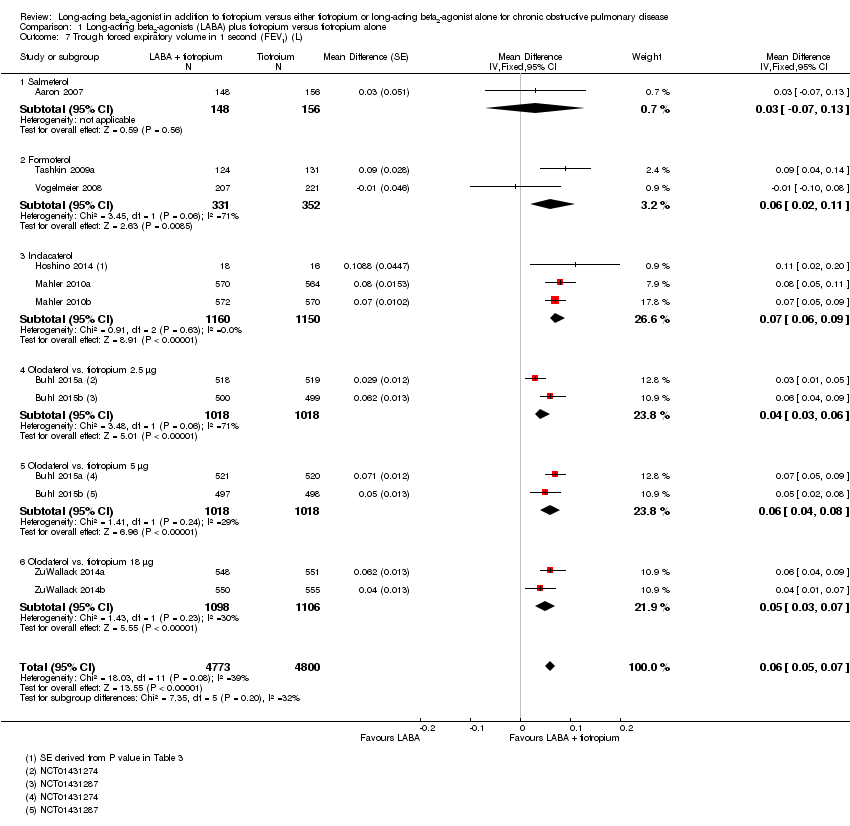
Comparison 1 Long‐acting beta2‐agonists (LABA) plus tiotropium versus tiotropium alone, Outcome 7 Trough forced expiratory volume in 1 second (FEV1) (L).

Comparison 1 Long‐acting beta2‐agonists (LABA) plus tiotropium versus tiotropium alone, Outcome 8 Symptom score.
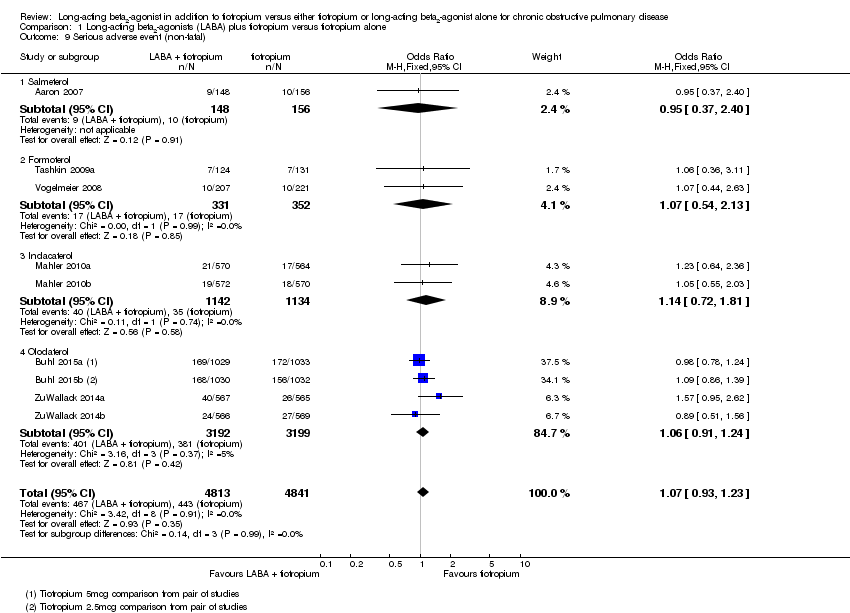
Comparison 1 Long‐acting beta2‐agonists (LABA) plus tiotropium versus tiotropium alone, Outcome 9 Serious adverse event (non‐fatal).

Comparison 1 Long‐acting beta2‐agonists (LABA) plus tiotropium versus tiotropium alone, Outcome 10 Withdrawal.

Comparison 2 Long‐acting beta2‐agonists (LABA) plus tiotropium versus LABA alone, Outcome 1 Change in quality of life.
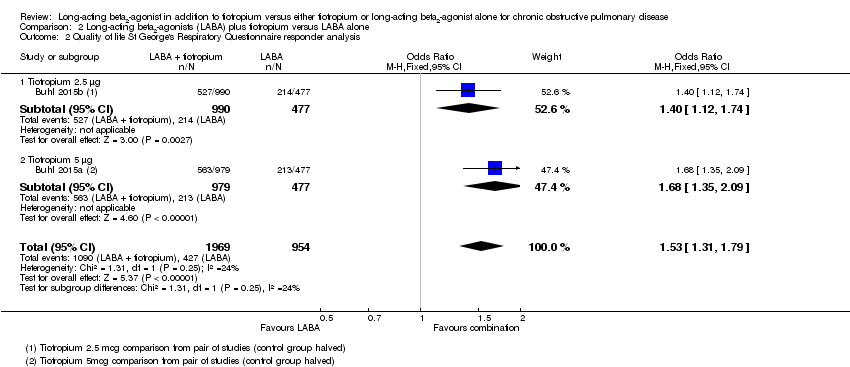
Comparison 2 Long‐acting beta2‐agonists (LABA) plus tiotropium versus LABA alone, Outcome 2 Quality of life St George's Respiratory Questionnaire responder analysis.

Comparison 2 Long‐acting beta2‐agonists (LABA) plus tiotropium versus LABA alone, Outcome 3 Hospital admission (all cause).

Comparison 2 Long‐acting beta2‐agonists (LABA) plus tiotropium versus LABA alone, Outcome 4 Hospital admission (exacerbation).

Comparison 2 Long‐acting beta2‐agonists (LABA) plus tiotropium versus LABA alone, Outcome 5 Mortality (all cause).

Comparison 2 Long‐acting beta2‐agonists (LABA) plus tiotropium versus LABA alone, Outcome 6 Exacerbation.

Comparison 2 Long‐acting beta2‐agonists (LABA) plus tiotropium versus LABA alone, Outcome 7 Trough forced expiratory volume in one second (FEV1) (L).

Comparison 2 Long‐acting beta2‐agonists (LABA) plus tiotropium versus LABA alone, Outcome 8 Serious adverse event (non‐fatal).
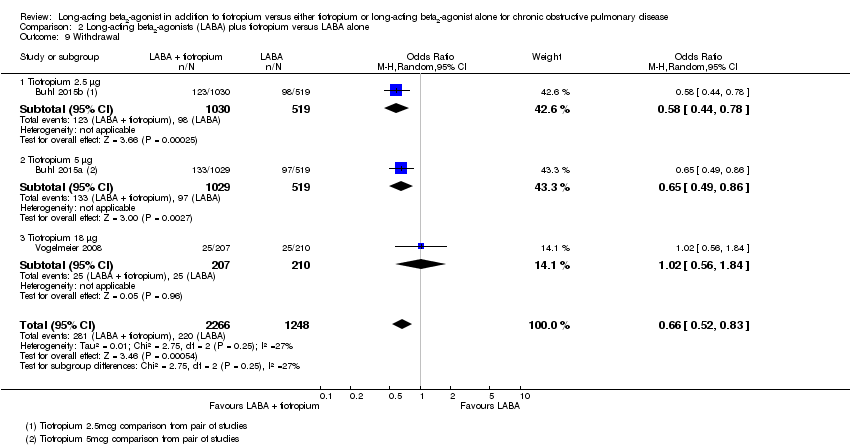
Comparison 2 Long‐acting beta2‐agonists (LABA) plus tiotropium versus LABA alone, Outcome 9 Withdrawal.
| Long‐acting beta2‐agonist plus tiotropium versus tiotropium alone for chronic obstructive pulmonary disease | ||||||
| Patient or population: addition to tiotropium versus either tiotropium or LABA alone for chronic obstructive pulmonary disease | ||||||
| Outcomes | Anticipated absolute effects* (95% CI) | Relative effect | No of participants | Quality of the evidence | Comments | |
| Risk with tiotropium | Risk with LABA + tiotropium | |||||
| Change in quality of life Follow‐up: range 3‐12 months | The mean change in quality of life at 6 months was ‐5.7 units | The mean change in quality of life in the intervention group was 1.34 units lower (1.87 lower to 0.8 lower) | ‐ | 6709 | ⊕⊕⊕⊝ | Better quality of life on combination treatment |
| Quality of life SGRQ responder analysis at 6 months | 48 per 100 | 55 per 100 | OR 1.32 | 5978 | ⊕⊕⊕⊝ | See Figure 1 |
| Hospital admission (all cause) Follow‐up: range 3‐12 months | 14 per 100 | 14 per 100 | OR 1.01 | 4856 | ⊕⊕⊕⊝ | ‐ |
| Hospital admission (exacerbation) Follow‐up: range 3‐12 months | 6 per 100 | 6 per 100 | OR 1.02 | 4856 | ⊕⊕⊝⊝ | ‐ |
| Mortality (all cause) Follow‐up: range 3‐12 months | 8 per 1000 | 10 per 1000 | OR 1.24 | 9633 | ⊕⊕⊝⊝ | ‐ |
| Change in trough FEV1 (L) Follow‐up: range 3‐12 months | The mean change in trough FEV1 at 6 months was 0.06 L | The mean change in trough FEV1 in the intervention group was 0.06 L more (0.05 more to 0.07 more) | ‐ | 9573 | ⊕⊕⊕⊕ | ‐ |
| *The risk in the intervention group (and its 95% confidence interval) is based on the assumed risk in the comparison group and the relative effect of the intervention (and its 95% CI). | ||||||
| GRADE Working Group grades of evidence | ||||||
| 1 More drop‐outs with tiotropium alone 2 Width of 95% CI limits our confidence in this outcome | ||||||
| Long‐acting beta2‐agonist plus tiotropium versus long‐acting beta2‐agonist alone for chronic obstructive pulmonary disease | ||||||
| Patient or population: addition to tiotropium versus either tiotropium or long‐acting beta2‐agonist alone for chronic obstructive pulmonary disease | ||||||
| Outcomes | Anticipated absolute effects* (95% CI) | Relative effect | No of participants | Quality of the evidence | Comments | |
| Risk with LABA | Risk with LABA plus tiotropium | |||||
| Change in quality of life Follow‐up: range 312 months | The mean change in quality of life at 6 months was ‐5.7 units | The mean change in quality of life in the intervention group was 1.25 units lower (2.14 lower to 0.37 lower) | ‐ | 3378 | ⊕⊕⊕⊝ | Better quality of life on combination treatment |
| Quality of life SGRQ responder analysis at 6 months | 45 per 100 | 55 per 100 | OR 1.53 | 2923 | ⊕⊕⊕⊝ | See Figure 2 |
| Hospital admission (all cause) Follow‐up: range 3‐12 months | 14 per 100 | 13 per 100 | OR 0.93 | 3514 | ⊕⊕⊕⊝ | ‐ |
| Hospital admission (exacerbation) Follow‐up: range 3‐12 months | 6 per 100 | 5 per 100 | OR 0.90 | 3514 | ⊕⊕⊝⊝ | ‐ |
| Mortality (all cause) Follow‐up: range 3‐12 months | 11 per 1000 | 13 per 1000 | OR 1.15 | 3514 | ⊕⊕⊝⊝ | ‐ |
| Change in trough FEV1 (L) Follow‐up: range 3‐12 months | The mean change in trough FEV1 at 6 months was 0.05 L | The mean trough FEV1 in the intervention group was 0.07 L more (0.06 more to 0.09 more) | ‐ | 3513 | ⊕⊕⊕⊕ | ‐ |
| *The risk in the intervention group (and its 95% confidence interval) is based on the assumed risk in the comparison group and the relative effect of the intervention (and its 95% CI). | ||||||
| GRADE Working Group grades of evidence | ||||||
| 1 More drop‐outs on LABA alone 2 Width of 95% CI limits our confidence in this outcome | ||||||
| Outcome or subgroup title | No. of studies | No. of participants | Statistical method | Effect size |
| 1 Change in quality of life Show forest plot | 5 | 6709 | Mean Difference (Fixed, 95% CI) | ‐1.34 [‐1.87, ‐0.80] |
| 1.1 Salmeterol | 1 | 304 | Mean Difference (Fixed, 95% CI) | ‐1.8 [‐3.32, ‐0.28] |
| 1.2 Formoterol | 1 | 428 | Mean Difference (Fixed, 95% CI) | ‐1.0 [‐3.70, 1.70] |
| 1.3 Olodaterol | 3 | 5977 | Mean Difference (Fixed, 95% CI) | ‐1.28 [‐1.86, ‐0.70] |
| 2 Quality of life St George's Respiratory Questionnaire responder analysis Show forest plot | 3 | 5978 | Odds Ratio (M‐H, Fixed, 95% CI) | 1.32 [1.19, 1.46] |
| 2.1 Olodaterol | 3 | 5978 | Odds Ratio (M‐H, Fixed, 95% CI) | 1.32 [1.19, 1.46] |
| 3 Hospital admission (all cause) Show forest plot | 4 | 4856 | Odds Ratio (M‐H, Fixed, 95% CI) | 1.01 [0.86, 1.19] |
| 3.1 Salmeterol | 1 | 304 | Odds Ratio (M‐H, Fixed, 95% CI) | 1.03 [0.61, 1.76] |
| 3.2 Formoterol | 1 | 428 | Odds Ratio (M‐H, Fixed, 95% CI) | 0.95 [0.36, 2.50] |
| 3.3 Olodaterol | 2 | 4124 | Odds Ratio (M‐H, Fixed, 95% CI) | 1.02 [0.85, 1.21] |
| 4 Hospital admission (exacerbation) Show forest plot | 4 | 4856 | Odds Ratio (M‐H, Fixed, 95% CI) | 1.02 [0.80, 1.28] |
| 4.1 Salmeterol | 1 | 304 | Odds Ratio (M‐H, Fixed, 95% CI) | 1.16 [0.66, 2.06] |
| 4.2 Formoterol | 1 | 428 | Odds Ratio (M‐H, Fixed, 95% CI) | 0.64 [0.15, 2.69] |
| 4.3 Olodaterol | 2 | 4124 | Odds Ratio (M‐H, Fixed, 95% CI) | 1.00 [0.77, 1.30] |
| 5 Mortality (all cause) Show forest plot | 8 | 9633 | Peto Odds Ratio (Peto, Fixed, 95% CI) | 1.24 [0.81, 1.90] |
| 5.1 Salmeterol | 1 | 304 | Peto Odds Ratio (Peto, Fixed, 95% CI) | 1.59 [0.45, 5.62] |
| 5.2 Formoterol | 2 | 683 | Peto Odds Ratio (Peto, Fixed, 95% CI) | 0.0 [0.0, 0.0] |
| 5.3 Indacaterol | 2 | 2276 | Peto Odds Ratio (Peto, Fixed, 95% CI) | 1.48 [0.26, 8.57] |
| 5.4 Olodaterol | 3 | 6370 | Peto Odds Ratio (Peto, Fixed, 95% CI) | 1.19 [0.75, 1.89] |
| 6 Exacerbation Show forest plot | 7 | Odds Ratio (M‐H, Random, 95% CI) | Subtotals only | |
| 6.1 Salmeterol | 1 | 304 | Odds Ratio (M‐H, Random, 95% CI) | 1.09 [0.68, 1.75] |
| 6.2 Formoterol | 2 | 683 | Odds Ratio (M‐H, Random, 95% CI) | 0.99 [0.34, 2.86] |
| 6.3 Olodaterol | 4 | 6391 | Odds Ratio (M‐H, Random, 95% CI) | 0.94 [0.79, 1.11] |
| 7 Trough forced expiratory volume in 1 second (FEV1) (L) Show forest plot | 10 | 9573 | Mean Difference (Fixed, 95% CI) | 0.06 [0.05, 0.07] |
| 7.1 Salmeterol | 1 | 304 | Mean Difference (Fixed, 95% CI) | 0.03 [‐0.07, 0.13] |
| 7.2 Formoterol | 2 | 683 | Mean Difference (Fixed, 95% CI) | 0.06 [0.02, 0.11] |
| 7.3 Indacaterol | 3 | 2310 | Mean Difference (Fixed, 95% CI) | 0.07 [0.06, 0.09] |
| 7.4 Olodaterol vs. tiotropium 2.5 μg | 2 | 2036 | Mean Difference (Fixed, 95% CI) | 0.04 [0.03, 0.06] |
| 7.5 Olodaterol vs. tiotropium 5 μg | 2 | 2036 | Mean Difference (Fixed, 95% CI) | 0.06 [0.04, 0.08] |
| 7.6 Olodaterol vs. tiotropium 18 μg | 2 | 2204 | Mean Difference (Fixed, 95% CI) | 0.05 [0.03, 0.07] |
| 8 Symptom score Show forest plot | 1 | Mean Difference (IV, Fixed, 95% CI) | Totals not selected | |
| 8.1 Formoterol | 1 | Mean Difference (IV, Fixed, 95% CI) | 0.0 [0.0, 0.0] | |
| 9 Serious adverse event (non‐fatal) Show forest plot | 9 | 9654 | Odds Ratio (M‐H, Fixed, 95% CI) | 1.07 [0.93, 1.23] |
| 9.1 Salmeterol | 1 | 304 | Odds Ratio (M‐H, Fixed, 95% CI) | 0.95 [0.37, 2.40] |
| 9.2 Formoterol | 2 | 683 | Odds Ratio (M‐H, Fixed, 95% CI) | 1.07 [0.54, 2.13] |
| 9.3 Indacaterol | 2 | 2276 | Odds Ratio (M‐H, Fixed, 95% CI) | 1.14 [0.72, 1.81] |
| 9.4 Olodaterol | 4 | 6391 | Odds Ratio (M‐H, Fixed, 95% CI) | 1.06 [0.91, 1.24] |
| 10 Withdrawal Show forest plot | 9 | 9654 | Odds Ratio (M‐H, Random, 95% CI) | 0.92 [0.75, 1.14] |
| 10.1 Salmeterol | 1 | 304 | Odds Ratio (M‐H, Random, 95% CI) | 0.84 [0.54, 1.33] |
| 10.2 Formoterol | 2 | 683 | Odds Ratio (M‐H, Random, 95% CI) | 1.46 [0.52, 4.09] |
| 10.3 Indacaterol | 2 | 2276 | Odds Ratio (M‐H, Random, 95% CI) | 0.93 [0.65, 1.34] |
| 10.4 Olodaterol | 4 | 6391 | Odds Ratio (M‐H, Random, 95% CI) | 0.87 [0.65, 1.16] |
| Outcome or subgroup title | No. of studies | No. of participants | Statistical method | Effect size |
| 1 Change in quality of life Show forest plot | 4 | 3378 | Mean Difference (Fixed, 95% CI) | ‐1.25 [‐2.14, ‐0.37] |
| 1.1 Tiotropium 2.5 μg | 1 | 1467 | Mean Difference (Fixed, 95% CI) | ‐1.03 [‐2.36, 0.30] |
| 1.2 Tiotropium 5 μg | 1 | 1456 | Mean Difference (Fixed, 95% CI) | ‐1.69 [‐3.02, ‐0.36] |
| 1.3 Tiotropium 18 μg | 2 | 455 | Mean Difference (Fixed, 95% CI) | ‐0.49 [‐3.00, 2.01] |
| 2 Quality of life St George's Respiratory Questionnaire responder analysis Show forest plot | 2 | 2923 | Odds Ratio (M‐H, Fixed, 95% CI) | 1.53 [1.31, 1.79] |
| 2.1 Tiotropium 2.5 μg | 1 | 1467 | Odds Ratio (M‐H, Fixed, 95% CI) | 1.40 [1.12, 1.74] |
| 2.2 Tiotropium 5 μg | 1 | 1456 | Odds Ratio (M‐H, Fixed, 95% CI) | 1.68 [1.35, 2.09] |
| 3 Hospital admission (all cause) Show forest plot | 3 | 3514 | Odds Ratio (M‐H, Fixed, 95% CI) | 0.93 [0.76, 1.14] |
| 3.1 Tiotropium 2.5 μg | 1 | 1549 | Odds Ratio (M‐H, Fixed, 95% CI) | 0.91 [0.68, 1.23] |
| 3.2 Tiotropium 5 μg | 1 | 1548 | Odds Ratio (M‐H, Fixed, 95% CI) | 0.94 [0.70, 1.27] |
| 3.3 Tiotropium 18 μg | 1 | 417 | Odds Ratio (M‐H, Fixed, 95% CI) | 1.02 [0.37, 2.76] |
| 4 Hospital admission (exacerbation) Show forest plot | 3 | 3514 | Odds Ratio (M‐H, Fixed, 95% CI) | 0.90 [0.66, 1.22] |
| 4.1 Tiotropium 2.5 μg | 1 | 1549 | Odds Ratio (M‐H, Fixed, 95% CI) | 0.73 [0.46, 1.14] |
| 4.2 Tiotropium 5 μg | 1 | 1548 | Odds Ratio (M‐H, Fixed, 95% CI) | 1.03 [0.67, 1.57] |
| 4.3 Tiotropium 18 μg | 1 | 417 | Odds Ratio (M‐H, Fixed, 95% CI) | 3.07 [0.32, 29.79] |
| 5 Mortality (all cause) Show forest plot | 3 | 3514 | Peto Odds Ratio (Peto, Fixed, 95% CI) | 1.15 [0.62, 2.13] |
| 5.1 Tiotropium 2.5 μg | 1 | 1549 | Peto Odds Ratio (Peto, Fixed, 95% CI) | 1.01 [0.40, 2.51] |
| 5.2 Tiotropium 5 μg | 1 | 1548 | Peto Odds Ratio (Peto, Fixed, 95% CI) | 1.29 [0.56, 2.97] |
| 5.3 Tiotropium 18 μg | 1 | 417 | Peto Odds Ratio (Peto, Fixed, 95% CI) | 0.0 [0.0, 0.0] |
| 6 Exacerbation Show forest plot | 3 | 3514 | Odds Ratio (M‐H, Random, 95% CI) | 0.80 [0.69, 0.93] |
| 6.1 Tiotropium 2.5 μg | 1 | 1549 | Odds Ratio (M‐H, Random, 95% CI) | 0.75 [0.60, 0.93] |
| 6.2 Tiotropium 5 μg | 1 | 1548 | Odds Ratio (M‐H, Random, 95% CI) | 0.86 [0.69, 1.07] |
| 6.3 Tiotropium 18 μg | 1 | 417 | Odds Ratio (M‐H, Random, 95% CI) | 0.76 [0.36, 1.61] |
| 7 Trough forced expiratory volume in one second (FEV1) (L) Show forest plot | 4 | 3513 | Mean Difference (Fixed, 95% CI) | 0.07 [0.06, 0.09] |
| 7.1 Tiotropium 2.5 μg | 2 | 1528 | Mean Difference (Fixed, 95% CI) | 0.06 [0.04, 0.08] |
| 7.2 Tiotropium 5 μg | 2 | 1530 | Mean Difference (Fixed, 95% CI) | 0.08 [0.06, 0.11] |
| 7.3 Tiotropium 18 μg | 2 | 455 | Mean Difference (Fixed, 95% CI) | 0.01 [‐0.05, 0.08] |
| 8 Serious adverse event (non‐fatal) Show forest plot | 4 | 3552 | Odds Ratio (M‐H, Fixed, 95% CI) | 0.94 [0.77, 1.14] |
| 8.1 Tiotropium 2.5 μg | 1 | 1549 | Odds Ratio (M‐H, Fixed, 95% CI) | 0.93 [0.70, 1.23] |
| 8.2 Tiotropium 5 μg | 1 | 1548 | Odds Ratio (M‐H, Fixed, 95% CI) | 0.92 [0.70, 1.22] |
| 8.3 Tiotropium 18 μg | 2 | 455 | Odds Ratio (M‐H, Fixed, 95% CI) | 1.28 [0.50, 3.31] |
| 9 Withdrawal Show forest plot | 3 | 3514 | Odds Ratio (M‐H, Random, 95% CI) | 0.66 [0.52, 0.83] |
| 9.1 Tiotropium 2.5 μg | 1 | 1549 | Odds Ratio (M‐H, Random, 95% CI) | 0.58 [0.44, 0.78] |
| 9.2 Tiotropium 5 μg | 1 | 1548 | Odds Ratio (M‐H, Random, 95% CI) | 0.65 [0.49, 0.86] |
| 9.3 Tiotropium 18 μg | 1 | 417 | Odds Ratio (M‐H, Random, 95% CI) | 1.02 [0.56, 1.84] |