نقش مداخلات کوتاه مدت مدرسهمحور و پیامدهای رفتاری بر نوجوانان مصرف کننده مواد مخدر
Appendices
Appendix 1. Cochrane Drugs and Alcohol Review Group Specialised Register
(adolescen* OR teenage* OR young OR student* OR juvenile OR school* OR class* OR kid OR kids OR youth OR underage)
AND
((brief AND intervention*) OR (brief AND therap*) OR (brief AND interview*) OR (minimal AND intervention*) OR (minimal AND therap*) OR (minimal AND interview*) OR (early AND intervention*) OR (early AND therap*) OR (early AND interview*) OR (motivat* AND intervention*) OR (motivat* AND therap*) OR (motivat* AND interview*) OR counselling OR counseling OR advice)
Appendix 2. CENTRAL search strategy
-
MeSH descriptor: [Substance‐Related Disorders] explode all trees
-
MeSH descriptor: [Drinking Behavior] explode all trees
-
binge
-
drink*
-
(abus* or consumption or misuse or use*):ti,ab
-
#1 or #2 or #3 or #4 or #5
-
(drug* or substance* or alcohol* or cannabis or amphetamine or cocaine or heroin or Methaqualone or prescription):ti,ab
-
#6 and #7
-
brief near/2 intervention
-
early near/2 intervention
-
minimal near/2 intervention
-
(BI or BMI):ti,ab
-
MeSH descriptor: [Counseling] explode all trees
-
((brief near/2 motivation*) near/2 interview*):ti,ab
-
#9 or #10 or #11 or #12 or #13 or #14
-
MeSH descriptor: [Adolescent] explode all trees
-
(adolescen* or teenage* or young or student* or juvenile):ti,ab
-
school* or class*
-
#16 or #17 or #18
-
#8 and #15 and #19
Appendix 3. PubMed search strategy
-
Substance‐related disorders [mesh]
-
Drinking behavior [mesh]
-
binge [tiab]
-
drink*[tiab]
-
abus*[tiab] OR consumption[tiab] OR misuse[tiab] OR use*[tiab]
-
#1 or #2 or #3 or #4 or #5
-
drug [tiab] OR substance [tiab] OR alcohol [tiab] OR cannabis[tiab] OR *amphetamine[tiab] OR cocaine[tiab] OR heroin [tiab] OR Methaqualone [tiab] OR prescription [tiab]
-
#6 AND #7
-
"Brief intervention" [tiab]
-
"early intervention"[tiab]
-
"minimal intervention"[tiab]
-
BI[tiab] OR BMI[tiab]
-
Counseling [mesh]
-
((brief[Title/Abstract]) AND motivation*[Title/Abstract]) AND interview*[Title/Abstract]
-
Motivation* [mesh:no exp]
-
#9 OR #10 OR #11 OR #12 OR #13 OR #14 OR #15
-
Adolescent [mesh]
-
((((adolescen*[Title/Abstract]) OR teenage*[Title/Abstract]) OR young[Title/Abstract]) OR student* [Title/Abstract] OR juvenile [Title/Abstract] kid[Title/Abstract] OR kids[Title/Abstract] OR youth[Title/Abstract] OR underage[Title/Abstract]
-
School* [tw] OR class* [tw]
-
#17 OR #18 OR #19
-
Randomized controlled trial [pt]
-
controlled clinical trial [pt]
-
random*[tiab]
-
placebo [tiab]
-
trial [tiab]
-
groups [tiab]
-
animals [mh] NOT humans [mh]
-
(#26) NOT #27
-
(((#7) AND #16) AND #17) AND #28
Appendix 4. EMBASE search strategy
-
'substance abuse'/syn OR abus*:ab,ti OR consumption:ab,ti OR misuse:ab,ti OR use*:ab,ti
-
'drinking behaviour' OR binge:ab,ti OR drink*:ab,ti
-
#1 OR #2
-
drug:ab,ti OR substance:ab,ti OR 'cannabis'/syn OR 'cocaine'/syn OR 'heroin'/syn OR 'methaqualone'/syn OR prescription:ab,ti OR alcohol:ab,ti OR 'amphetamine'/syn
-
#3 AND #4
-
'brief intervention':ab,ti OR 'brief interventions':ab,ti OR 'early intervention':ab,ti OR 'early interventions':ab,ti OR 'minimal intervention':ab,ti OR 'minimal interventions':ab,ti OR bi:ab,ti OR bmi:ab,ti
-
'counseling'/syn OR counselling:ab,ti
-
'motivation'/syn
-
brief:ab,ti AND motivation:ab,ti
-
interview*:ab,ti
-
#10 AND #11
-
#6 OR #7 OR #8 OR #9 OR #11
-
'adolescence'/syn OR adolescen*:ab,ti OR teenage*:ab,ti OR young*:ab,ti OR student*:ab,ti OR school*:ab,ti OR kid:ab,ti OR youth:ab,ti OR underage:ab,ti
-
random*:ti OR random*:ab OR factorial*:ti OR factorial*:ab OR cross?over*:ti OR cross?over:ab OR crossover*:ti OR crossover*:ab OR placebo*:ti OR placebo*:ab OR (doubl*:ti AND blind*:ti) OR (doubl*:ab AND blind*:ab) OR (singl*:ti AND blind*:ti) OR (singl*:ab AND blind*:ab) OR assign*:ti OR assign*:ab OR volunteer*:ti OR volunteer*:ab OR 'crossover procedure'/de OR 'crossover procedure'OR 'double‐blind procedure'/de OR 'double‐blind procedure' OR 'single‐blind procedure'/de OR 'single‐blind procedure' OR 'Randomized controlled trial'/de OR 'Randomized controlled trial' OR allocat*:ti OR allocat*:ab
-
#5 AND #13 AND #14 AND #15 AND [embase]/lim
Appendix 5. Web of Science search strategy
Timespan=2012‐06‐01 ‐ 2013‐03‐13. Databases=SCI‐EXPANDED, SSCI.
Topic=(((((drug or substance* or alcohol or *amphetamine* or cocaine or marijuana or cannabis or heroin or Methaqualone) same (misuse or abuse* or addict* or consumption or use*))))) AND Topic=(((brief NEAR/3 intervention*) OR (brief NEAR/3 therap*) OR (brief NEAR/3 interview*) OR (minimal NEAR/3 intervention*) OR (minimal NEAR/3 therap*) OR (minimal NEAR/3 interview*) OR (early NEAR/3 intervention*) OR (early NEAR/3 therap*) OR (early NEAR/3 interview*) OR (motivat* NEAR/3 intervention*) OR (motivat* NEAR/3 therap*) OR (motivat* NEAR/3 interview*) OR (counselling or counseling or advice))) AND Topic=((adolescen* or teenage* or young or student* or juvenile or school* or class* or kid or kids or youth or underage)) AND Topic=((randomi* OR randomly OR placebo* OR trial*))
Appendix 6. LILACS search strategy
((((([MH] ("substance‐related disorders")) or ([MH] ("drinking behavior")) or ((binge)) or ((drink$)) or (("abus$" or "consumption" or "misuse" or "use$")) or (("drug" or "substance" or "alcohol" or "cannabis" or "amphetamine" or "cocaine" or "heroin" or "methaqualone" or "prescription")))) and ((((("brief " or "early" or "minimal") and "intervention")) or (("bi" or "bmi")) or ([MH] ("counseling")) or ([MH]"COUNSELING") or ([MH] ("motivation")))))) and ((([MH] ("adolescent")) or ([MH] ("adolescen$" or "teenage$" or "young" or "student$" or "juvenile" or "school" or "class$" or " kid " or " youth " or " underage "))))
Appendix 7. ETOH search strategy
("TI" ct (counseling/counseling/brief&intervention/brief intervention*/early intervention/minimal intervention*/ interview*/BI/BMI) & (adolescen*/teenage*/young*/student*/school*))
OR ("AB" ct (counseling/counseling/brief&intervention/brief intervention*/early intervention/minimal intervention*/ interview*/BI/BMI) & (adolescen*/teenage*/young*/student*/school*))
AND ("TI" / "AU" / "AB" / "CG" / "FS" / "MJ" / "MN" / "ID" ct clinical trial/random*/assign*/allocat*/crossover/factorial*/control*W2 study/ control* W2 trial*/single W2 blind*/ double W2 blind*/triple W2 blind*) "
Appendix 8. Criteria for judging risk of bias
| Item | Judgement | Description |
| 1. Random sequence generation (selection bias)
| Low risk | The investigators describe a random component in the sequence generation process such as: random‐number table; computer random‐number generator; coin tossing; shuffling cards or envelopes; throwing dice; drawing of lots; minimisation |
| High risk | The investigators describe a non‐random component in the sequence generation process such as: odd or even date of birth; date (or day) of admission; hospital or clinic record number; alternation; judgement of the clinician; results of a laboratory test or a series of tests; availability of the intervention | |
| Unclear risk | Insufficient information about the sequence generation process to permit judgement of low or high risk | |
| 2. Allocation concealment (selection bias)
| Low risk | Investigators enrolling participants could not foresee assignment because one of the following, or an equivalent method, was used to conceal allocation: central allocation (including telephone, web‐based, and pharmacy‐controlled randomisation); sequentially numbered drug containers of identical appearance; sequentially numbered, opaque, sealed envelopes |
| High risk | Investigators enrolling participants could possibly foresee assignments because one of the following methods was used: open random allocation schedule (e.g. a list of random numbers); assignment envelopes without appropriate safeguards (e.g. if envelopes were unsealed or nonopaque or not sequentially numbered); alternation or rotation; date of birth; case record number; any other explicitly unconcealed procedure | |
| Unclear risk | Insufficient information to permit judgement of low or high risk. This is usually the case if the method of concealment is not described or not described in sufficient detail to allow a definite judgement | |
| 3. Blinding of participants and providers (performance bias) | Low risk | No blinding or incomplete blinding, but the review authors judge that the outcome is not likely to be influenced by lack of blinding Blinding of participants and key study personnel ensured, and unlikely that the blinding could have been broken |
| High risk | No blinding or incomplete blinding, and the outcome is likely to be influenced by lack of blinding Blinding of key study participants and personnel attempted, but likely that the blinding could have been broken, and the outcome is likely to be influenced by lack of blinding | |
| Unclear risk | Insufficient information to permit judgement of low or high risk | |
| 4. Blinding of outcome assessor (detection bias)
| Low risk
| No blinding of outcome assessment, but the review authors judge that the outcome measurement is not likely to be influenced by lack of blinding Blinding of outcome assessment ensured, and unlikely that the blinding could have been broken |
| High risk | No blinding of outcome assessment, and the outcome measurement is likely to be influenced by lack of blinding Blinding of outcome assessment, but likely that the blinding could have been broken, and the outcome measurement is likely to be influenced by lack of blinding | |
| Unclear risk | Insufficient information to permit judgement of low or high risk | |
| 5. Incomplete outcome data (attrition bias) for all outcomes except retention in treatment or drop‐out
| Low risk
| No missing outcome data Reasons for missing outcome data unlikely to be related to true outcome (for survival data, censoring unlikely to be introducing bias) Missing outcome data balanced in numbers across intervention groups, with similar reasons for missing data across groups For dichotomous outcome data, the proportion of missing outcomes compared with observed event risk not enough to have a clinically relevant impact on the intervention effect estimate For continuous outcome data, plausible effect size (difference in means or standardised difference in means) among missing outcomes not enough to have a clinically relevant impact on observed effect size Missing data have been imputed using appropriate methods All randomised participants are reported/analysed in the group they were allocated to by randomisation irrespective of non‐compliance and co‐interventions (intention to treat) |
| High risk | Reasons for missing outcome data likely to be related to true outcome, with either imbalance in numbers or reasons for missing data across intervention groups For dichotomous outcome data, the proportion of missing outcomes compared with observed event risk is enough to induce clinically relevant bias in intervention effect estimate For continuous outcome data, plausible effect size (difference in means or standardised difference in means) among missing outcomes is enough to induce clinically relevant bias in observed effect size ‘As‐treated’ analysis done with substantial departure of the intervention received from that assigned at randomisation | |
| Unclear risk | Insufficient information to permit judgement of low or high risk (e.g. number randomised not stated, no reasons for missing data provided; number of dropouts not reported for each group) | |
| 6. Selective reporting (reporting bias)
| Low risk | The study protocol is available and all of the study’s prespecified (primary and secondary) outcomes that are of interest in the review have been reported in the prespecified way The study protocol is not available but it is clear that the published reports include all expected outcomes, including those that were prespecified (convincing text of this nature may be uncommon) |
| High risk | Not all of the study’s prespecified primary outcomes have been reported One or more primary outcomes is reported using measurements, analysis methods, or subsets of the data (e.g. subscales) that were not prespecified One or more reported primary outcomes were not prespecified (unless clear justification for their reporting is provided, such as an unexpected adverse effect) One or more outcomes of interest in the review are reported incompletely so that they cannot be entered in a meta‐analysis The study report fails to include results for a key outcome that would be expected to have been reported for such a study | |
| Unclear risk | Insufficient information to permit judgement of low or high risk | |
| 7. Other bias
| Low risk | The study appears to be free of other sources of bias |
| High risk | There is at least one important risk of bias. For example, the study:
| |
| Unclear risk | Insufficient information to assess whether an important risk of bias exists; or insufficient rationale or evidence that an identified problem will introduce bias |

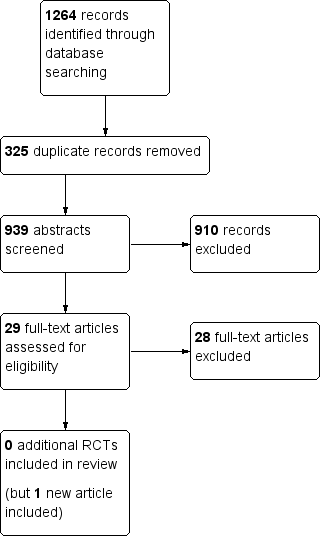
Study flow diagram for updated review.

Risk of bias graph: review authors' judgements about each risk of bias item presented as percentages across all included studies.
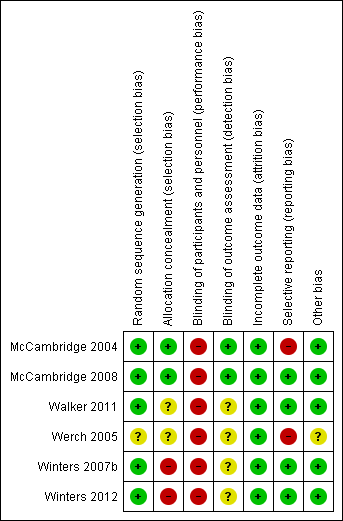
Risk of bias summary: review authors' judgements about each risk of bias item for each included study.
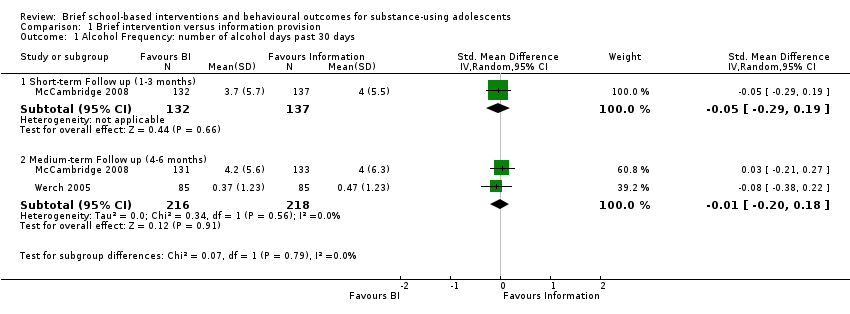
Comparison 1 Brief intervention versus information provision, Outcome 1 Alcohol Frequency: number of alcohol days past 30 days.
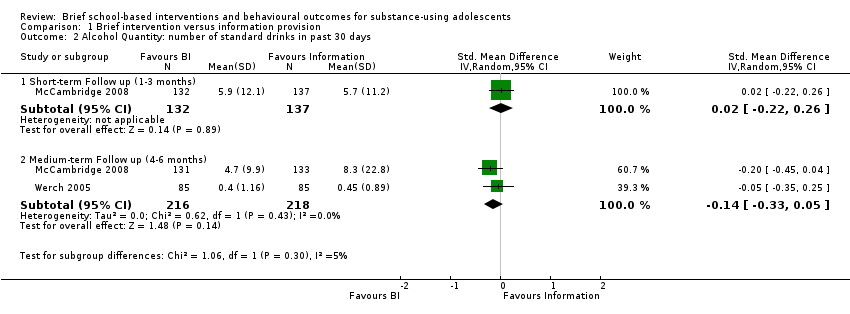
Comparison 1 Brief intervention versus information provision, Outcome 2 Alcohol Quantity: number of standard drinks in past 30 days.

Comparison 1 Brief intervention versus information provision, Outcome 3 Cannabis Quantity: number of joints smoked in past 30 days.
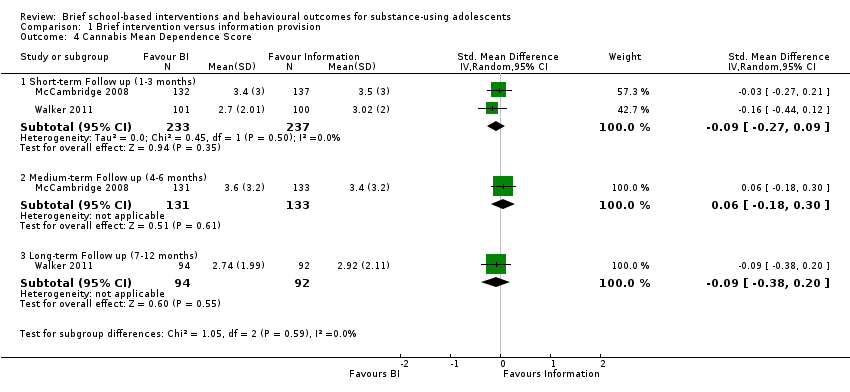
Comparison 1 Brief intervention versus information provision, Outcome 4 Cannabis Mean Dependence Score.

Comparison 1 Brief intervention versus information provision, Outcome 5 Cannabis frequency: number of days smoked cannabis in past 30 days.

Comparison 1 Brief intervention versus information provision, Outcome 6 Secondary outcomes related to substance use: Mean Problem Score.
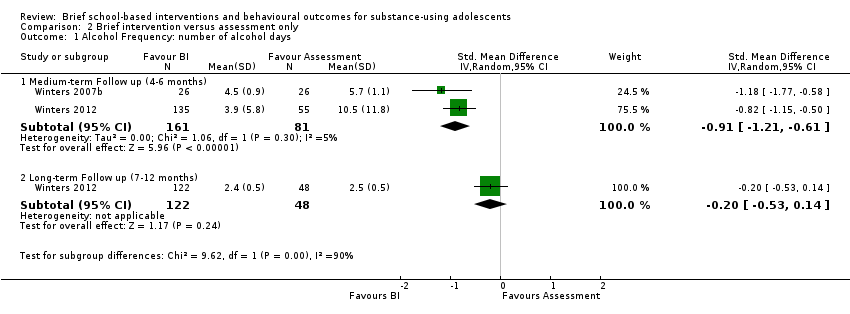
Comparison 2 Brief intervention versus assessment only, Outcome 1 Alcohol Frequency: number of alcohol days.

Comparison 2 Brief intervention versus assessment only, Outcome 2 Alcohol Quantity: number of standard drinks.
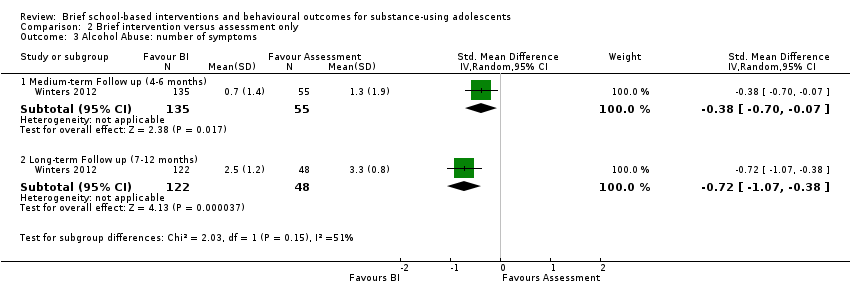
Comparison 2 Brief intervention versus assessment only, Outcome 3 Alcohol Abuse: number of symptoms.
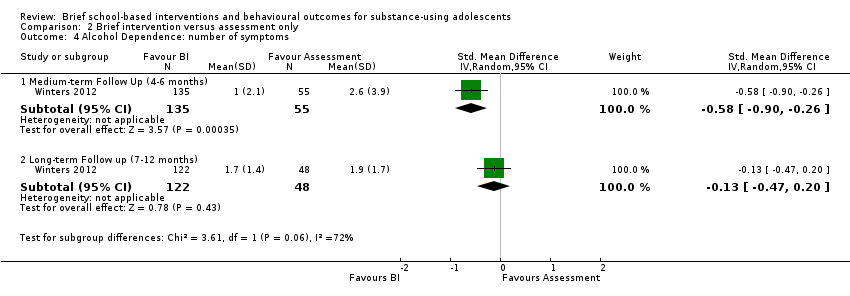
Comparison 2 Brief intervention versus assessment only, Outcome 4 Alcohol Dependence: number of symptoms.
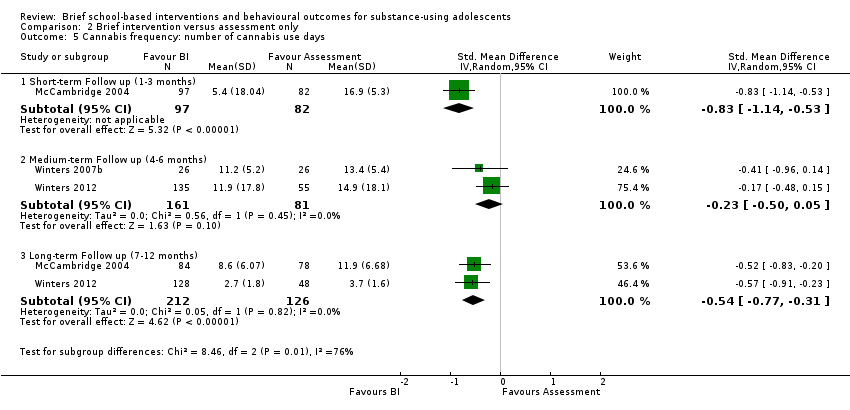
Comparison 2 Brief intervention versus assessment only, Outcome 5 Cannabis frequency: number of cannabis use days.
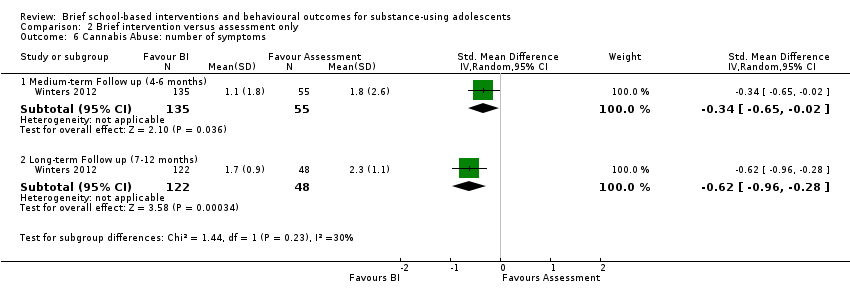
Comparison 2 Brief intervention versus assessment only, Outcome 6 Cannabis Abuse: number of symptoms.

Comparison 2 Brief intervention versus assessment only, Outcome 7 Cannabis Dependence: number of symptoms.

Comparison 2 Brief intervention versus assessment only, Outcome 8 Secondary outcomes related to substance use: Mean score on personal consequences scale.
| Brief intervention compared to information provision for substance‐using adolescents | ||||||
| Patient or population: Substance‐using adolescents | ||||||
| Outcomes | Illustrative comparative risks* (95% CI) | Estimate effect | No of participants | Quality of the evidence | Comments | |
| Assumed risk | Corresponding risk | |||||
| Information provision | Brief intervention | |||||
| Alcohol frequency | See comment | The standardised mean alcohol frequency in the intervention groups was 0.01 standard deviations lower | SMD ‐0.01 (‐0.20 to 0.18) | 434 | ⊕⊕⊕⊝ | Number of days of alcohol use |
| Alcohol quantity Medium‐term follow‐up: 4 to 6 months | See comment | The standardised mean alcohol quantity in the intervention groups was 0.14 standard deviations lower | SMD ‐0.14 (‐0.33 to 0.05) | 434 | ⊕⊕⊕⊝ | Number of standard alcohol units |
| Cannabis dependence | See comment | The standardised mean cannabis dependence score in the intervention groups was 0.09 standard deviations lower (0.27 lower to 0.09 higher) | SMD ‐0.09 (‐0.27 to 0.09) | 470 | ⊕⊕⊕⊝ | Mean dependence score |
| Cannabis frequency | See comment | The mean cannabis frequency in the intervention groups was | SMD ‐0.07 (‐0.25 to 0.11) | 470 | ⊕⊕⊕⊝ | Number of days cannabis use |
| Secondary outcomes related to substance use Short‐term follow‐up: 1 to 3 months | See comment | The mean behavioural outcomes related to substance use in the intervention groups was | SMD ‐0.01 (‐0.19 to 0.17) | 470 | ⊕⊕⊕⊝ | Interactional Problems Score |
| *The basis for the assumed risk (e.g. the mean control group risk across studies) is provided in footnotes. The corresponding risk (and its 95% CI) is based on the assumed risk in the comparison group and the estimate effect of the intervention (and its 95% CI). The estimate effects for certain outcomes were not estimable due to only one study assessing the specific outcome, or extremely high levels of heterogeneity making effects across studies difficult to compare. | ||||||
| GRADE Working Group grades of evidence | ||||||
| 1Risk of bias (‐1): It was not possible to blind the participants in all of the included studies. There was also uncertainty in two of the studies about allocation concealment and blinding of outcome assessor (Walker 2011; Werch 2005). | ||||||
| Brief intervention compared to assessment only for substance‐using adolescents | ||||||
| Patient or population: Substance‐using adolescents | ||||||
| Outcomes | Illustrative comparative risks* (95% CI) | Estimate effect | No of participants | Quality of the evidence | Comments | |
| Assumed risk | Corresponding risk | |||||
| Assessment only | Brief intervention | |||||
| Alcohol frequency Self report questionnaires | See comment | The standardised mean alcohol frequency in the intervention groups was 0.91 standard deviations lower | SMD ‐0.91 (‐1.21 to ‐0.61) | 242 | ⊕⊕⊝⊝ | Number of days of alcohol use |
| Alcohol quantity Medium‐term follow‐up: 4 to 6 months | See comment | The standardised mean alcohol quantity in the intervention groups was 0.16 standard deviations lower | SMD ‐0.16 (‐0.45 to 0.14) | 179 (1 study) | ⊕⊕⊝⊝ | Number of standard alcohol units |
| Cannabis dependence | See comment | The mean cannabis dependence in the intervention groups was | SMD ‐0.26 (‐0.57 to 0.36) | 190 | ⊕⊕⊝⊝ | Mean dependence score |
| Cannabis frequency | See comment | The mean cannabis frequency in the intervention groups was | SMD ‐0.54 (‐0.77 to ‐0.31) | 338 | ⊕⊕⊝⊝ | Number of days of cannabis use |
| Secondary outcomes related to substance use Self report questionnaires Medium‐term follow‐up: 4 to 6 months | See comment | The mean mean behavioural outcomes related to substance use in the intervention groups was | SMD ‐0.65 (‐1.58 to 0.28) | 242 | ⊕⊕⊝⊝ | Interactional Problems Score |
| *The basis for the assumed risk (e.g. the mean control group risk across studies) is provided in footnotes. The corresponding risk (and its 95% CI) is based on the assumed risk in the comparison group and the estimate effect of the intervention (and its 95% CI). The estimate effects for certain outcomes were not estimable due to only one study assessing the specific outcome, or extremely high levels of heterogeneity making effects across studies difficult to compare. | ||||||
| GRADE Working Group grades of evidence | ||||||
| 1Risk of bias (‐1): It was not possible to blind the participants in all of the included studies. There was no allocation concealment in two of the included studies, and it was unclear whether the outcome assessor was blinded (Winters 2007b; Winters 2012). The other study was also not free of selective reporting bias (McCambridge 2004). | ||||||
| Outcome or subgroup title | No. of studies | No. of participants | Statistical method | Effect size |
| 1 Alcohol Frequency: number of alcohol days past 30 days Show forest plot | 2 | Std. Mean Difference (IV, Random, 95% CI) | Subtotals only | |
| 1.1 Short‐term Follow up (1‐3 months) | 1 | 269 | Std. Mean Difference (IV, Random, 95% CI) | ‐0.05 [‐0.29, 0.19] |
| 1.2 Medium‐term Follow up (4‐6 months) | 2 | 434 | Std. Mean Difference (IV, Random, 95% CI) | ‐0.01 [‐0.20, 0.18] |
| 2 Alcohol Quantity: number of standard drinks in past 30 days Show forest plot | 2 | Std. Mean Difference (IV, Random, 95% CI) | Subtotals only | |
| 2.1 Short‐term Follow up (1‐3 months) | 1 | 269 | Std. Mean Difference (IV, Random, 95% CI) | 0.02 [‐0.22, 0.26] |
| 2.2 Medium‐term Follow up (4‐6 months) | 2 | 434 | Std. Mean Difference (IV, Random, 95% CI) | ‐0.14 [‐0.33, 0.05] |
| 3 Cannabis Quantity: number of joints smoked in past 30 days Show forest plot | 1 | Std. Mean Difference (IV, Random, 95% CI) | Subtotals only | |
| 3.1 Short‐term Follow up (1‐3 months) | 1 | 269 | Std. Mean Difference (IV, Random, 95% CI) | 0.0 [‐0.24, 0.24] |
| 3.2 Medium‐term Follow up (4‐6 months) | 1 | 264 | Std. Mean Difference (IV, Random, 95% CI) | ‐0.15 [‐0.39, 0.09] |
| 4 Cannabis Mean Dependence Score Show forest plot | 2 | Std. Mean Difference (IV, Random, 95% CI) | Subtotals only | |
| 4.1 Short‐term Follow up (1‐3 months) | 2 | 470 | Std. Mean Difference (IV, Random, 95% CI) | ‐0.09 [‐0.27, 0.09] |
| 4.2 Medium‐term Follow up (4‐6 months) | 1 | 264 | Std. Mean Difference (IV, Random, 95% CI) | 0.06 [‐0.18, 0.30] |
| 4.3 Long‐term Follow up (7‐12 months) | 1 | 186 | Std. Mean Difference (IV, Random, 95% CI) | ‐0.09 [‐0.38, 0.20] |
| 5 Cannabis frequency: number of days smoked cannabis in past 30 days Show forest plot | 2 | Std. Mean Difference (IV, Random, 95% CI) | Subtotals only | |
| 5.1 Short‐term Follow up (1‐3 months) | 2 | 470 | Std. Mean Difference (IV, Random, 95% CI) | ‐0.07 [‐0.25, 0.11] |
| 5.2 Medium‐term Follow up (4‐6 months) | 1 | 264 | Std. Mean Difference (IV, Random, 95% CI) | ‐0.06 [‐0.30, 0.18] |
| 5.3 Long‐term Follow up (7‐12 months) | 1 | 186 | Std. Mean Difference (IV, Random, 95% CI) | ‐0.02 [‐0.31, 0.26] |
| 6 Secondary outcomes related to substance use: Mean Problem Score Show forest plot | 2 | Std. Mean Difference (IV, Random, 95% CI) | Subtotals only | |
| 6.1 Short‐term Follow up (1‐3 months) | 2 | 470 | Std. Mean Difference (IV, Random, 95% CI) | ‐0.01 [‐0.19, 0.17] |
| 6.2 Medium‐term Follow up (4‐6 months) | 1 | 264 | Std. Mean Difference (IV, Random, 95% CI) | ‐0.13 [‐0.37, 0.11] |
| 6.3 Long‐term Follow up (7‐12 months) | 1 | 186 | Std. Mean Difference (IV, Random, 95% CI) | ‐0.10 [‐0.39, 0.19] |
| Outcome or subgroup title | No. of studies | No. of participants | Statistical method | Effect size |
| 1 Alcohol Frequency: number of alcohol days Show forest plot | 2 | Std. Mean Difference (IV, Random, 95% CI) | Subtotals only | |
| 1.1 Medium‐term Follow up (4‐6 months) | 2 | 242 | Std. Mean Difference (IV, Random, 95% CI) | ‐0.91 [‐1.21, ‐0.61] |
| 1.2 Long‐term Follow up (7‐12 months) | 1 | 170 | Std. Mean Difference (IV, Random, 95% CI) | ‐0.20 [‐0.53, 0.14] |
| 2 Alcohol Quantity: number of standard drinks Show forest plot | 1 | Std. Mean Difference (IV, Random, 95% CI) | Subtotals only | |
| 2.1 Medium‐term Follow up (4‐6 months) | 1 | 179 | Std. Mean Difference (IV, Random, 95% CI) | ‐0.16 [‐0.45, 0.14] |
| 2.2 Long‐term Follow up (7‐12 months) | 1 | 162 | Std. Mean Difference (IV, Random, 95% CI) | ‐0.16 [‐0.47, 0.15] |
| 3 Alcohol Abuse: number of symptoms Show forest plot | 1 | Std. Mean Difference (IV, Random, 95% CI) | Subtotals only | |
| 3.1 Medium‐term Follow up (4‐6 months) | 1 | 190 | Std. Mean Difference (IV, Random, 95% CI) | ‐0.38 [‐0.70, ‐0.07] |
| 3.2 Long‐term Follow up (7‐12 months) | 1 | 170 | Std. Mean Difference (IV, Random, 95% CI) | ‐0.72 [‐1.07, ‐0.38] |
| 4 Alcohol Dependence: number of symptoms Show forest plot | 1 | Std. Mean Difference (IV, Random, 95% CI) | Subtotals only | |
| 4.1 Medium‐term Follow Up (4‐6 months) | 1 | 190 | Std. Mean Difference (IV, Random, 95% CI) | ‐0.58 [‐0.90, ‐0.26] |
| 4.2 Long‐term Follow up (7‐12 months) | 1 | 170 | Std. Mean Difference (IV, Random, 95% CI) | ‐0.13 [‐0.47, 0.20] |
| 5 Cannabis frequency: number of cannabis use days Show forest plot | 3 | Std. Mean Difference (IV, Random, 95% CI) | Subtotals only | |
| 5.1 Short‐term Follow up (1‐3 months) | 1 | 179 | Std. Mean Difference (IV, Random, 95% CI) | ‐0.83 [‐1.14, ‐0.53] |
| 5.2 Medium‐term Follow up (4‐6 months) | 2 | 242 | Std. Mean Difference (IV, Random, 95% CI) | ‐0.23 [‐0.50, 0.05] |
| 5.3 Long‐term Follow up (7‐12 months) | 2 | 338 | Std. Mean Difference (IV, Random, 95% CI) | ‐0.54 [‐0.77, ‐0.31] |
| 6 Cannabis Abuse: number of symptoms Show forest plot | 1 | Std. Mean Difference (IV, Random, 95% CI) | Subtotals only | |
| 6.1 Medium‐term Follow up (4‐6 months) | 1 | 190 | Std. Mean Difference (IV, Random, 95% CI) | ‐0.34 [‐0.65, ‐0.02] |
| 6.2 Long‐term Follow up (7‐12 months) | 1 | 170 | Std. Mean Difference (IV, Random, 95% CI) | ‐0.62 [‐0.96, ‐0.28] |
| 7 Cannabis Dependence: number of symptoms Show forest plot | 1 | Std. Mean Difference (IV, Random, 95% CI) | Subtotals only | |
| 7.1 Medium‐term Follow up (4‐6 months) | 1 | 190 | Std. Mean Difference (IV, Random, 95% CI) | ‐0.26 [‐0.57, 0.06] |
| 7.2 Long‐term Follow up (7‐12 months) | 1 | 170 | Std. Mean Difference (IV, Random, 95% CI) | ‐0.97 [‐1.32, ‐0.62] |
| 8 Secondary outcomes related to substance use: Mean score on personal consequences scale Show forest plot | 2 | Std. Mean Difference (IV, Random, 95% CI) | Subtotals only | |
| 8.1 Medium‐term Follow up (4‐6 months) | 2 | 242 | Std. Mean Difference (IV, Random, 95% CI) | ‐0.65 [‐1.58, 0.28] |
| 8.2 Long‐term Follow up (7‐12 months) | 1 | 170 | Std. Mean Difference (IV, Random, 95% CI) | ‐0.78 [‐1.13, ‐0.44] |