Parto inmediato versus diferido del feto prematuro con presunto compromiso fetal para mejorar los resultados
Información
- DOI:
- https://doi.org/10.1002/14651858.CD008968.pub3Copiar DOI

- Base de datos:
-
- Cochrane Database of Systematic Reviews
- Versión publicada:
-
- 12 julio 2016see what's new
- Tipo:
-
- Intervention
- Etapa:
-
- Review
- Grupo Editorial Cochrane:
-
Grupo Cochrane de Embarazo y parto
- Copyright:
-
- Copyright © 2016 The Cochrane Collaboration. Published by John Wiley & Sons, Ltd.
Cifras del artículo
Altmetric:
Citado por:
Autores
Contributions of authors
Sarah Stock is guarantor for the review. All authors contributed to design of the protocol. Sarah Stock contributed to writing the review update, and all authors provided comments on this update.
Helen West restructured the background and plain language summary, updated the methods, carried out GRADE assessments and created the Summary of findings table for this update.
Sources of support
Internal sources
-
(HW) Cochrane Pregnancy and Childbirth Group, Department of Women's and Children's Health, The University of Liverpool, Liverpool, UK.
External sources
-
(HW) National Institute for Health Research (NIHR), UKNIHR Cochrane Programme Grant Project: 13/89/05 – Pregnancy and childbirth systematic reviews to support clinical guidelines, UK.
Declarations of interest
Sarah Stock has received grants (paid to her institution) from NIHR HTA, SPARKS, the British Maternal and Fetal Medicine Society, and Tommy's in order to research into preterm labour and stillbirth. She has received payment (to her institution) in respect of travel expenses, accommodation and meeting costs as invited speaker about research at conferences and meetings.
Leanne Bricker ‐ none known.
Jane Norman has received a grant of £11,000 (paid to her institution) from the Chief Scientist’s Office, Scottish Executive, for an epidemiological study entitled: "Ferguson EF, Norman JE, Chalmers J, Shanks E, Finlayson A. Investigation of the beneficial and adverse effects of induction of labour." Jane Norman's has received a number of research grants (paid to her institution) to support research into improving perinatal outcome ‐ none specifically related to immediate vs deferred delivery. Jane has also received small amounts of money for speaking at meetings about prematurity but not immediate vs deferred delivery.
Helen West is paid to work on Cochrane reviews by a grant to Cochrane Pregnancy and Childbirth. The views and opinions expressed therein are those of the authors and do not necessarily reflect those of the Systematic Reviews Programme, NIHR, NHS or the Department of Health.
Acknowledgements
Sarah Stock and Jane Norman work in the Tommy's Centre for Maternal and Fetal Health, Edinburgh. Tommy's provided infrastructure costs, funding for Sarah Stock to attend Cochrane training courses, and expenses for meetings.
Denise Atherton for administrative assistance; Lynn Hampson for the literature search.
Helen West's work is supported by the NIHR Cochrane Programme Grant Project: 13/89/05 – Pregnancy and childbirth systematic reviews to support clinical guidelines.
This project was supported by the National Institute for Health Research, via Cochrane Infrastructure and Cochrane Programme Grant funding to Cochrane Pregnancy and Childbirth. The views and opinions expressed therein are those of the authors and do not necessarily reflect those of the Systematic Reviews Programme, NIHR, NHS or the Department of Health.
Version history
| Published | Title | Stage | Authors | Version |
| 2016 Jul 12 | Immediate versus deferred delivery of the preterm baby with suspected fetal compromise for improving outcomes | Review | Sarah J Stock, Leanne Bricker, Jane E Norman, Helen M West | |
| 2012 Jul 11 | Immediate versus deferred delivery of the preterm baby with suspected fetal compromise for improving outcomes | Review | Sarah J Stock, Leanne Bricker, Jane E Norman | |
| 2011 Feb 16 | Immediate versus deferred delivery of the preterm baby with suspected fetal compromise for improving outcomes | Protocol | Sarah J Stock, Leanne Bricker, Jane E Norman | |
Differences between protocol and review
Helen West has been added as an author.
The Methods section has been updated.
The definition of the primary outcome perinatal mortality (intrauterine death or death in the first seven days of life) was amended to represent extended perinatal mortality (intrauterine death or death in the first 28 days of life), as deaths in the neonatal period are frequently secondary to obstetric causes, and these were felt to be relevant.
We also reported the following nonpre‐specified outcomes that we considered to be important: death at or after two years of age; Kaufman‐Assessment Battery for Children Mental Processing Component Score in childhood; death or severe disability in childhood; ventilation for more than 24 hours.
Subgroup analyses
We changed the subgroup analyses that we planned to undertake from:
-
Gestation less than 28 weeks, 28 to 31+6 weeks, 32 to 36 weeks.
-
Singleton and multiple pregnancies.
-
Male and female babies.
-
Underlying cause of fetal compromise: placental insufficiency, congenital abnormality, isoimmunisation, intrauterine infection.
-
Severity of fetal compromise: positive end diastolic flow in umbilical artery Doppler, absent or reversed end‐diastolic flow in umbilical artery Doppler, abnormal arterial or venous Doppler.
to
-
Gestational age.
-
Multiple and singleton pregnancies.
-
Method of diagnosis of suspected compromise.
We were unable to carry out planned subgroup analyses for multiple and singleton pregnancies and method of diagnosis of suspected compromise as the data were not reported by the subgroups of multiple and singleton pregnancies or method of diagnosis of suspected compromise.
We had intended to perform subgroup analyses for gestations less than 28 weeks, 28 to 31 + 6 weeks and 32 to 36 weeks. Data were not available for the groups specified but were available for gestations 24 to 30 weeks and gestations 31 to 36 weeks. As the effect of gestation could be important, we performed post hoc subgroup analysis for these groups.
We were unable to carry out planned subgroup analyses for the following two outcomes extended perinatal mortality (intrauterine death or death in the first 28 days of life) and serious neonatal morbidity (composite outcome including BPD, NEC, IVH, ROP, HIE) as data were not reported.
Sensitivity analyses
We were unable to undertake our planned sensitivity analyses as only one trial was included.
Data synthesis
We were unable to combine data in meta‐analysis as only one study was included
For this update, we have used the GRADE approach to assess the quality of the body of evidence and this is summarised in summary of findings Table for the main comparison.
Keywords
MeSH
Medical Subject Headings (MeSH) Keywords
- *Infant, Premature;
- Cerebral Palsy [etiology];
- Cesarean Section [statistics & numerical data];
- Delivery, Obstetric [adverse effects, *methods];
- Fetal Distress [*complications];
- Infant Mortality;
- Randomized Controlled Trials as Topic;
- Respiration, Artificial [statistics & numerical data];
- Watchful Waiting;
Medical Subject Headings Check Words
Female; Humans; Infant; Infant, Newborn; Pregnancy;
PICO

Study flow diagram.

'Risk of bias' summary: review authors' judgements about each risk of bias item for each included study.

Comparison 1 Immediate delivery versus deferred delivery, Outcome 1 Extended perinatal mortality.

Comparison 1 Immediate delivery versus deferred delivery, Outcome 2 Death or disability at or after 2 years.

Comparison 1 Immediate delivery versus deferred delivery, Outcome 3 Stillbirth.
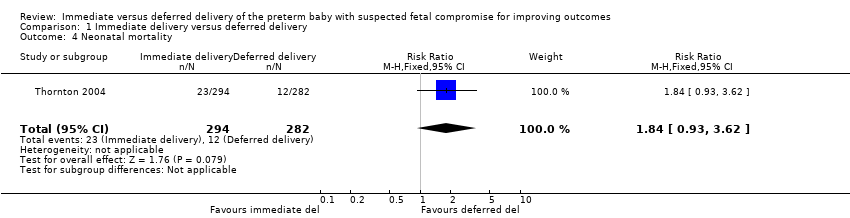
Comparison 1 Immediate delivery versus deferred delivery, Outcome 4 Neonatal mortality.

Comparison 1 Immediate delivery versus deferred delivery, Outcome 5 Postneonatal mortality (> 28 days to discharge).
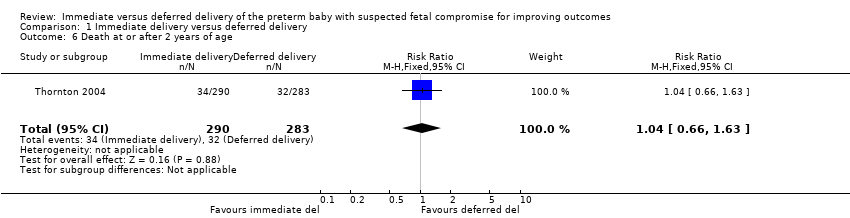
Comparison 1 Immediate delivery versus deferred delivery, Outcome 6 Death at or after 2 years of age.

Comparison 1 Immediate delivery versus deferred delivery, Outcome 7 Cord pH less than 7.0.
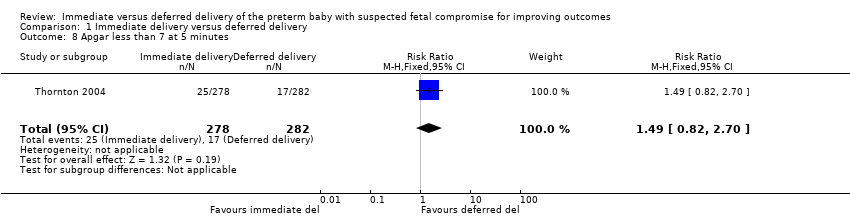
Comparison 1 Immediate delivery versus deferred delivery, Outcome 8 Apgar less than 7 at 5 minutes.
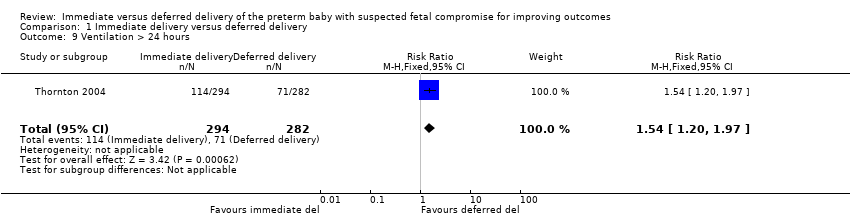
Comparison 1 Immediate delivery versus deferred delivery, Outcome 9 Ventilation > 24 hours.
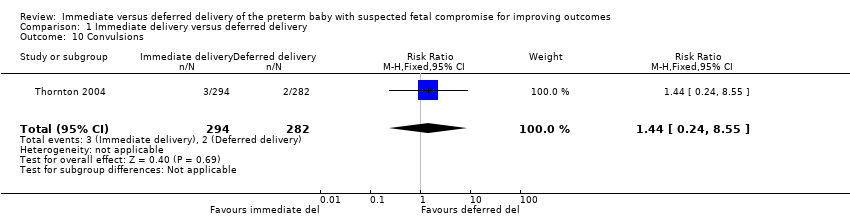
Comparison 1 Immediate delivery versus deferred delivery, Outcome 10 Convulsions.
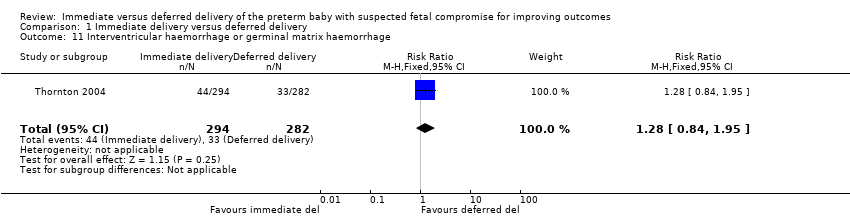
Comparison 1 Immediate delivery versus deferred delivery, Outcome 11 Interventricular haemorrhage or germinal matrix haemorrhage.

Comparison 1 Immediate delivery versus deferred delivery, Outcome 12 Necrotising enterocolitis.
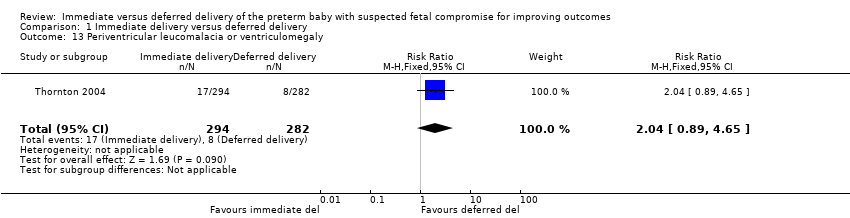
Comparison 1 Immediate delivery versus deferred delivery, Outcome 13 Periventricular leucomalacia or ventriculomegaly.

Comparison 1 Immediate delivery versus deferred delivery, Outcome 14 Neurodevelopmental impairment at or after 2 years.

Comparison 1 Immediate delivery versus deferred delivery, Outcome 15 Cerebral palsy at or after 2 years of age.
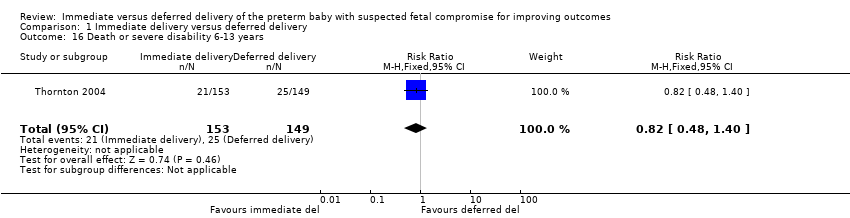
Comparison 1 Immediate delivery versus deferred delivery, Outcome 16 Death or severe disability 6‐13 years.
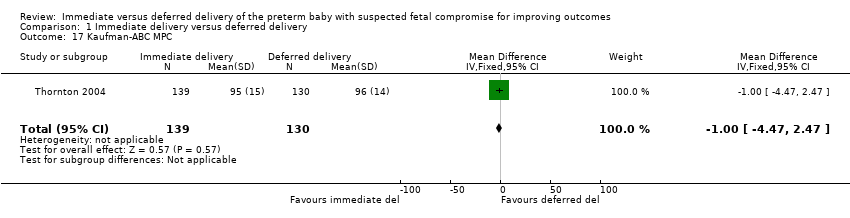
Comparison 1 Immediate delivery versus deferred delivery, Outcome 17 Kaufman‐ABC MPC.

Comparison 1 Immediate delivery versus deferred delivery, Outcome 18 Caesarean delivery.

Comparison 1 Immediate delivery versus deferred delivery, Outcome 19 Subgroup analysis: death or disability at or after 2 years of age.
| Immediate versus deferred delivery of the preterm baby with suspected fetal compromise for improving outcomes | ||||||
| Patient or population: pregnant women at less than 36 weeks' gestation in whom there is clinical suspicion of fetal compromise | ||||||
| Outcomes | Anticipated absolute effects* (95% CI) | Relative effect | № of participants | Quality of the evidence | Comments | |
| Risk with deferred delivery | Risk with immediate delivery | |||||
| Extended perinatal mortality | Study population | RR 1.17 | 587 | ⨁⨁⨁◯ | ||
| 72 per 1000 | 84 per 1000 | |||||
| Serious neonatal morbidity (composite outcome including bronchopulmonary dysplasia (BPD), necrotising enterocolitis (NEC), intraventricular haemorrhage (IVH), retinopathy of prematurity (ROP), hypoxic ischaemic encephalopathy (HIE) | (0 studies)2 | |||||
| Death or disability at or after 2 years | Study population | RR 1.22 | 573 | ⨁⨁⨁◯ | ||
| 155 per 1000 | 190 per 1000 | |||||
| Caesarean section | Study population | RR 1.15 | 547 | ⨁⨁⨁⨁ | ||
| 792 per 1000 | 911 per 1000 | |||||
| Infant admission to neonatal intensive care or special care facility | (0 studies) | Outcome not reported in the one included study. | ||||
| Respiratory distress syndrome (as defined by trialists) | (0 studies) | Outcome not reported in the one included study. | ||||
| *The risk in the intervention group (and its 95% CI) is based on the assumed risk in the comparison group and the relative effect of the intervention (and its 95% CI). | ||||||
| GRADE Working Group grades of evidence | ||||||
| 1 Wide CI crossing the line of no effect 2 We were not able to calculate composite rates of serious neonatal morbidity, even though individual morbidities were reported in 1 RCT, due to the risk of double counting infants with more than one morbidity. | ||||||
| Outcome or subgroup title | No. of studies | No. of participants | Statistical method | Effect size |
| 1 Extended perinatal mortality Show forest plot | 1 | 587 | Risk Ratio (M‐H, Fixed, 95% CI) | 1.17 [0.67, 2.04] |
| 2 Death or disability at or after 2 years Show forest plot | 1 | 573 | Risk Ratio (M‐H, Fixed, 95% CI) | 1.22 [0.85, 1.75] |
| 3 Stillbirth Show forest plot | 1 | 587 | Risk Ratio (M‐H, Fixed, 95% CI) | 0.22 [0.05, 1.00] |
| 4 Neonatal mortality Show forest plot | 1 | 576 | Risk Ratio (M‐H, Fixed, 95% CI) | 1.84 [0.93, 3.62] |
| 5 Postneonatal mortality (> 28 days to discharge) Show forest plot | 1 | 541 | Risk Ratio (M‐H, Fixed, 95% CI) | 0.66 [0.19, 2.33] |
| 6 Death at or after 2 years of age Show forest plot | 1 | 573 | Risk Ratio (M‐H, Fixed, 95% CI) | 1.04 [0.66, 1.63] |
| 7 Cord pH less than 7.0 Show forest plot | 1 | 400 | Risk Ratio (M‐H, Fixed, 95% CI) | 0.5 [0.09, 2.70] |
| 8 Apgar less than 7 at 5 minutes Show forest plot | 1 | 560 | Risk Ratio (M‐H, Fixed, 95% CI) | 1.49 [0.82, 2.70] |
| 9 Ventilation > 24 hours Show forest plot | 1 | 576 | Risk Ratio (M‐H, Fixed, 95% CI) | 1.54 [1.20, 1.97] |
| 10 Convulsions Show forest plot | 1 | 576 | Risk Ratio (M‐H, Fixed, 95% CI) | 1.44 [0.24, 8.55] |
| 11 Interventricular haemorrhage or germinal matrix haemorrhage Show forest plot | 1 | 576 | Risk Ratio (M‐H, Fixed, 95% CI) | 1.28 [0.84, 1.95] |
| 12 Necrotising enterocolitis Show forest plot | 1 | 576 | Risk Ratio (M‐H, Fixed, 95% CI) | 1.44 [0.71, 2.93] |
| 13 Periventricular leucomalacia or ventriculomegaly Show forest plot | 1 | 576 | Risk Ratio (M‐H, Fixed, 95% CI) | 2.04 [0.89, 4.65] |
| 14 Neurodevelopmental impairment at or after 2 years Show forest plot | 1 | 507 | Risk Ratio (M‐H, Fixed, 95% CI) | 1.72 [0.86, 3.41] |
| 15 Cerebral palsy at or after 2 years of age Show forest plot | 1 | 507 | Risk Ratio (M‐H, Fixed, 95% CI) | 5.88 [1.33, 26.02] |
| 16 Death or severe disability 6‐13 years Show forest plot | 1 | 302 | Risk Ratio (M‐H, Fixed, 95% CI) | 0.82 [0.48, 1.40] |
| 17 Kaufman‐ABC MPC Show forest plot | 1 | 269 | Mean Difference (IV, Fixed, 95% CI) | ‐1.0 [‐4.47, 2.47] |
| 18 Caesarean delivery Show forest plot | 1 | 547 | Risk Ratio (M‐H, Fixed, 95% CI) | 1.15 [1.07, 1.24] |
| 19 Subgroup analysis: death or disability at or after 2 years of age Show forest plot | 1 | 573 | Risk Ratio (M‐H, Fixed, 95% CI) | 1.15 [0.82, 1.62] |
| 19.1 24‐30 weeks' gestation | 1 | 200 | Risk Ratio (M‐H, Fixed, 95% CI) | 1.21 [0.81, 1.80] |
| 19.2 31‐36 weeks | 1 | 373 | Risk Ratio (M‐H, Fixed, 95% CI) | 1.04 [0.54, 2.01] |