Scolaris Content Display Scolaris Content Display

Study flow diagram.
Figuras y tablas -
Figure 1

Study flow diagram.

Methodological quality summary: review authors' judgements about each methodological quality item for each included study.
Figuras y tablas -
Figure 2

Methodological quality summary: review authors' judgements about each methodological quality item for each included study.

Methodological quality graph: review authors' judgements about each methodological quality item presented as percentages across all included studies.
Figuras y tablas -
Figure 3

Methodological quality graph: review authors' judgements about each methodological quality item presented as percentages across all included studies.

Comparison 1 Active medication versus placebo, Outcome 1 Number abstinent at end of treatment.
Figuras y tablas -
Analysis 1.1

Comparison 1 Active medication versus placebo, Outcome 1 Number abstinent at end of treatment.

Comparison 1 Active medication versus placebo, Outcome 2 Number experiencing adverse effects.
Figuras y tablas -
Analysis 1.2

Comparison 1 Active medication versus placebo, Outcome 2 Number experiencing adverse effects.

Comparison 1 Active medication versus placebo, Outcome 3 Number withdrawn due to adverse effects.
Figuras y tablas -
Analysis 1.3

Comparison 1 Active medication versus placebo, Outcome 3 Number withdrawn due to adverse effects.

Comparison 1 Active medication versus placebo, Outcome 4 Completion of treatment.
Figuras y tablas -
Analysis 1.4

Comparison 1 Active medication versus placebo, Outcome 4 Completion of treatment.

Summary of findings for the main comparison. Abstinence at end of treatment

Active medication compared with placebo

Outcomes

Illustrative comparative risks* (95% CI)

Relative effect
(95% CI)

No of participants
(studies)

Quality of the evidence
(GRADE)

Comments

Assumed risk

Corresponding risk

Control

Active Medication

Number abstinent at end of treatment ‐ mixed action antidepressants

Study population

RR 0.82
(0.12 to 5.41)

179
(2 studies)

⊕⊝⊝⊝
very low1,2

250 per 1000

205 per 1000
(30 to 1000)

Moderate

233 per 1000

191 per 1000
(28 to 1000)

*The basis for the assumed risk (e.g. the median control group risk across studies) is provided in footnotes. The corresponding risk (and its 95% confidence interval) is based on the assumed risk in the comparison group and the relative effect of the intervention (and its 95% CI).
CI: Confidence interval; RR: Risk ratio

GRADE Working Group grades of evidence
High quality: Further research is very unlikely to change our confidence in the estimate of effect.
Moderate quality: Further research is likely to have an important impact on our confidence in the estimate of effect and may change the estimate.
Low quality: Further research is very likely to have an important impact on our confidence in the estimate of effect and is likely to change the estimate.
Very low quality: We are very uncertain about the estimate.

1 Significant heterogeneity between studies
2 Studies small (< 300 participants in total)

Figuras y tablas -
Summary of findings for the main comparison. Abstinence at end of treatment
Summary of findings 2. Withdrawal due to adverse effects

Active medication compared with placebo

Outcomes

Illustrative comparative risks* (95% CI)

Relative effect
(95% CI)

No of participants
(studies)

Quality of the evidence
(GRADE)

Comments

Assumed risk

Corresponding risk

Control

Active Medication

Number withdrawn due to adverse effects ‐ mixed action antidepressants

Study population

RR 1.44
(0.11 to 18.9)

179
(2 studies)

⊕⊝⊝⊝
very low1,2

11 per 1000

16 per 1000
(1 to 205)

Moderate

13 per 1000

19 per 1000
(1 to 246)

*The basis for the assumed risk (e.g. the median control group risk across studies) is provided in footnotes. The corresponding risk (and its 95% confidence interval) is based on the assumed risk in the comparison group and the relative effect of the intervention (and its 95% CI).
CI: Confidence interval; RR: Risk ratio

GRADE Working Group grades of evidence
High quality: Further research is very unlikely to change our confidence in the estimate of effect.
Moderate quality: Further research is likely to have an important impact on our confidence in the estimate of effect and may change the estimate.
Low quality: Further research is very likely to have an important impact on our confidence in the estimate of effect and is likely to change the estimate.
Very low quality: We are very uncertain about the estimate.

1 Studies differ in direction of effect without significant heterogeneity
2 Very few events and small group sizes

Figuras y tablas -
Summary of findings 2. Withdrawal due to adverse effects
Summary of findings 3. Completion of treatment

Active medication compared with placebo

Outcomes

Illustrative comparative risks* (95% CI)

Relative effect
(95% CI)

No of participants
(studies)

Quality of the evidence
(GRADE)

Comments

Assumed risk

Corresponding risk

Control

Active Medication

Completion of treatment ‐ THC preparations

Study population

RR 1.29
(1.08 to 1.55)

207
(2 studies)

⊕⊕⊕⊝
moderate2

614 per 1000

792 per 1000
(663 to 951)

Moderate

618 per 1000

797 per 1000
(667 to 958)

Completion of treatment ‐ mixed action antidepressants

Study population

RR 0.93
(0.71 to 1.21)

169
(2 studies)

⊕⊕⊕⊝
moderate2

573 per 1000

533 per 1000
(407 to 694)

Moderate

551 per 1000

512 per 1000
(391 to 667)

Completion of treatment ‐ SSRI antidepressants

Study population

RR 0.82
(0.44 to 1.53)

122
(2 studies)

⊕⊝⊝⊝
very low1,2,3

790 per 1000

648 per 1000
(348 to 1000)

Moderate

766 per 1000

628 per 1000
(337 to 1000)

Completion of treatment ‐ anticonvulsant and mood stabiliser

Study population

RR 0.78
(0.42 to 1.46)

75
(2 studies)

⊕⊝⊝⊝
very low2,3

405 per 1000

316 per 1000
(170 to 592)

Moderate

387 per 1000

302 per 1000
(163 to 565)

Completion of treatment ‐ atypical antidepressant (bupropion)

Study population

RR 1.06
(0.67 to 1.67)

92
(2 studies)

⊕⊝⊝⊝
very low2,3

429 per 1000

454 per 1000
(287 to 716)

Moderate

400 per 1000

424 per 1000
(268 to 668)

*The basis for the assumed risk (e.g. the median control group risk across studies) is provided in footnotes. The corresponding risk (and its 95% confidence interval) is based on the assumed risk in the comparison group and the relative effect of the intervention (and its 95% CI).
CI: Confidence interval; RR: Risk ratio

GRADE Working Group grades of evidence
High quality: Further research is very unlikely to change our confidence in the estimate of effect.
Moderate quality: Further research is likely to have an important impact on our confidence in the estimate of effect and may change the estimate.
Low quality: Further research is very likely to have an important impact on our confidence in the estimate of effect and is likely to change the estimate.
Very low quality: We are very uncertain about the estimate.

1 Significant heterogeneity between studies
2 Studies small (< 300 participants in total)
3 One study at risk of attrition bias

Figuras y tablas -
Summary of findings 3. Completion of treatment
Comparison 1. Active medication versus placebo

Outcome or subgroup title

No. of studies

No. of participants

Statistical method

Effect size

1 Number abstinent at end of treatment Show forest plot

5

Risk Ratio (M‐H, Random, 95% CI)

Subtotals only

1.1 THC preparations

1

156

Risk Ratio (M‐H, Random, 95% CI)

1.14 [0.56, 2.30]

1.2 Mixed action antidepressants

2

179

Risk Ratio (M‐H, Random, 95% CI)

0.82 [0.12, 5.41]

1.3 SSRI antidepressants

1

52

Risk Ratio (M‐H, Random, 95% CI)

2.33 [0.68, 8.05]

1.4 Anticonvulsant and mood stabiliser

1

19

Risk Ratio (M‐H, Random, 95% CI)

1.08 [0.50, 2.34]

1.5 Buspirone

0

0

Risk Ratio (M‐H, Random, 95% CI)

0.0 [0.0, 0.0]

1.6 Atomoxetine

0

0

Risk Ratio (M‐H, Random, 95% CI)

0.0 [0.0, 0.0]

1.7 N‐acetylcysteine

0

0

Risk Ratio (M‐H, Random, 95% CI)

0.0 [0.0, 0.0]

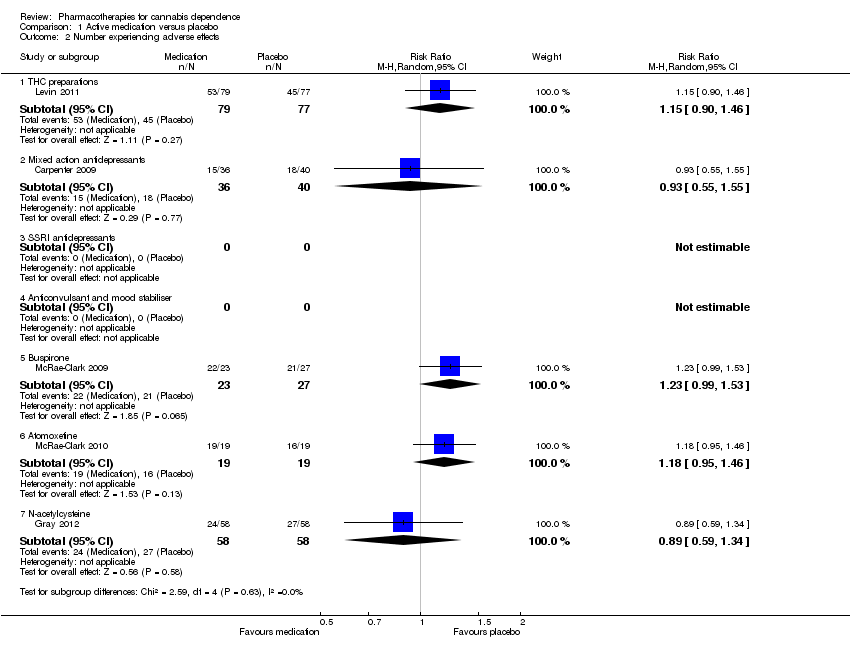
2 Number experiencing adverse effects Show forest plot

5

Risk Ratio (M‐H, Random, 95% CI)

Subtotals only

2.1 THC preparations

1

156

Risk Ratio (M‐H, Random, 95% CI)

1.15 [0.90, 1.46]

2.2 Mixed action antidepressants

1

76

Risk Ratio (M‐H, Random, 95% CI)

0.93 [0.55, 1.55]

2.3 SSRI antidepressants

0

0

Risk Ratio (M‐H, Random, 95% CI)

0.0 [0.0, 0.0]

2.4 Anticonvulsant and mood stabiliser

0

0

Risk Ratio (M‐H, Random, 95% CI)

0.0 [0.0, 0.0]

2.5 Buspirone

1

50

Risk Ratio (M‐H, Random, 95% CI)

1.23 [0.99, 1.53]

2.6 Atomoxetine

1

38

Risk Ratio (M‐H, Random, 95% CI)

1.18 [0.95, 1.46]

2.7 N‐acetylcysteine

1

116

Risk Ratio (M‐H, Random, 95% CI)

0.89 [0.59, 1.34]

3 Number withdrawn due to adverse effects Show forest plot

7

Risk Ratio (M‐H, Random, 95% CI)

Subtotals only

3.1 THC preparations

1

156

Risk Ratio (M‐H, Random, 95% CI)

0.97 [0.06, 15.31]

3.2 Mixed action antidepressants

2

179

Risk Ratio (M‐H, Random, 95% CI)

1.44 [0.11, 18.90]

3.3 SSRI antidepressants

0

0

Risk Ratio (M‐H, Random, 95% CI)

0.0 [0.0, 0.0]

3.4 Anticonvulsant and mood stabiliser

1

50

Risk Ratio (M‐H, Random, 95% CI)

1.0 [0.07, 15.12]

3.5 Buspirone

1

50

Risk Ratio (M‐H, Random, 95% CI)

1.17 [0.08, 17.74]

3.6 Atomoxetine

1

38

Risk Ratio (M‐H, Random, 95% CI)

3.0 [0.13, 69.31]

3.7 N‐acetylcysteine

1

116

Risk Ratio (M‐H, Random, 95% CI)

3.0 [0.12, 72.15]

4 Completion of treatment Show forest plot

12

Risk Ratio (M‐H, Random, 95% CI)

Subtotals only

4.1 THC preparations

2

207

Risk Ratio (M‐H, Random, 95% CI)

1.29 [1.08, 1.55]

4.2 Mixed action antidepressants

2

169

Risk Ratio (M‐H, Random, 95% CI)

0.93 [0.71, 1.21]

4.3 SSRI antidepressants

2

122

Risk Ratio (M‐H, Random, 95% CI)

0.82 [0.44, 1.53]

4.4 Anticonvulsant and mood stabiliser

2

75

Risk Ratio (M‐H, Random, 95% CI)

0.78 [0.42, 1.46]

4.5 Buspirone

1

50

Risk Ratio (M‐H, Random, 95% CI)

0.99 [0.56, 1.77]

4.6 Atomoxetine

1

38

Risk Ratio (M‐H, Random, 95% CI)

1.29 [0.60, 2.74]

4.7 N‐acetylcysteine

1

116

Risk Ratio (M‐H, Random, 95% CI)

1.12 [0.83, 1.51]

4.8 Bupropion

2

92

Risk Ratio (M‐H, Random, 95% CI)

1.06 [0.67, 1.67]

Figuras y tablas -
Comparison 1. Active medication versus placebo