| 1 ataxia Show forest plot | 2 | | Risk Ratio (M‐H, Fixed, 99% CI) | Subtotals only |
|
| 1.1 Eslicarbazepine acetate 400 mg/day versus placebo | 1 | 196 | Risk Ratio (M‐H, Fixed, 99% CI) | 1.04 [0.21, 5.09] |
| 1.2 Eslicarbazepine acetate 800 mg/day versus placebo | 2 | 373 | Risk Ratio (M‐H, Fixed, 99% CI) | 2.49 [0.75, 8.29] |
| 1.3 Eslicarbazepine acetate 1200 mg/day versus placebo | 2 | 365 | Risk Ratio (M‐H, Fixed, 99% CI) | 2.59 [0.77, 8.64] |
| 1.4 Eslicarbazepine acetate any dose versus placebo | 2 | 647 | Risk Ratio (M‐H, Fixed, 99% CI) | 2.14 [0.71, 6.48] |
| 2 dizziness Show forest plot | 4 | | Risk Ratio (M‐H, Fixed, 99% CI) | Subtotals only |
|
| 2.1 Eslicarbazepine acetate 400 mg/day versus placebo | 2 | 398 | Risk Ratio (M‐H, Fixed, 99% CI) | 2.25 [0.97, 5.22] |
| 2.2 Eslicarbazepine acetate 800 mg/day versus placebo | 3 | 573 | Risk Ratio (M‐H, Fixed, 99% CI) | 2.89 [1.57, 5.32] |
| 2.3 Eslicarbazepine acetate 1200 mg/day versus placebo | 3 | 569 | Risk Ratio (M‐H, Fixed, 99% CI) | 4.02 [2.24, 7.22] |
| 2.4 Eslicarbazepine acetate any dose versus placebo | 4 | 1146 | Risk Ratio (M‐H, Fixed, 99% CI) | 3.09 [1.76, 5.43] |
| 3 fatigue Show forest plot | 1 | | Risk Ratio (M‐H, Fixed, 99% CI) | Subtotals only |
|
| 3.1 Eslicarbazepine acetate 400 mg/day versus placebo | 1 | 196 | Risk Ratio (M‐H, Fixed, 99% CI) | 0.83 [0.15, 4.51] |
| 3.2 Eslicarbazepine acetate 800 mg/day versus placebo | 1 | 201 | Risk Ratio (M‐H, Fixed, 99% CI) | 0.99 [0.20, 4.85] |
| 3.3 Eslicarbazepine acetate 1200 mg/day versus placebo | 1 | 198 | Risk Ratio (M‐H, Fixed, 99% CI) | 1.43 [0.33, 6.17] |
| 3.4 Eslicarbazepine acetate any dose versus placebo | 1 | 395 | Risk Ratio (M‐H, Fixed, 99% CI) | 1.08 [0.30, 3.92] |
| 4 nausea Show forest plot | 3 | | Risk Ratio (M‐H, Fixed, 99% CI) | Subtotals only |
|
| 4.1 Eslicarbazepine acetate 400 mg/day versus placebo | 1 | 196 | Risk Ratio (M‐H, Fixed, 99% CI) | 2.08 [0.45, 9.66] |
| 4.2 Eslicarbazepine acetate 800 mg/day versus placebo | 2 | 373 | Risk Ratio (M‐H, Fixed, 99% CI) | 3.39 [0.95, 12.17] |
| 4.3 Eslicarbazepine acetate 1200 mg/day versus placebo | 2 | 365 | Risk Ratio (M‐H, Fixed, 99% CI) | 4.78 [1.39, 16.43] |
| 4.4 Eslicarbazepine acetate any dose versus placebo | 3 | 744 | Risk Ratio (M‐H, Fixed, 99% CI) | 3.06 [1.07, 8.74] |
| 5 somnolence Show forest plot | 4 | | Risk Ratio (M‐H, Fixed, 99% CI) | Subtotals only |
|
| 5.1 Eslicarbazepine acetate 400 mg/day versus placebo | 2 | 398 | Risk Ratio (M‐H, Fixed, 99% CI) | 1.15 [0.54, 2.45] |
| 5.2 Eslicarbazepine acetate 800 mg/day versus placebo | 3 | 573 | Risk Ratio (M‐H, Fixed, 99% CI) | 1.38 [0.75, 2.54] |
| 5.3 Eslicarbazepine acetate 1200 mg/day versus placebo | 3 | 569 | Risk Ratio (M‐H, Fixed, 99% CI) | 1.61 [0.89, 2.90] |
| 5.4 Eslicarbazepine acetate any dose versus placebo | 4 | 1146 | Risk Ratio (M‐H, Fixed, 99% CI) | 1.48 [0.88, 2.47] |
| 6 rash Show forest plot | 3 | | Risk Ratio (M‐H, Fixed, 99% CI) | Subtotals only |
|
| 6.1 Eslicarbazepine acetate any dose versus placebo | 3 | 1049 | Risk Ratio (M‐H, Fixed, 99% CI) | 1.50 [0.25, 8.98] |
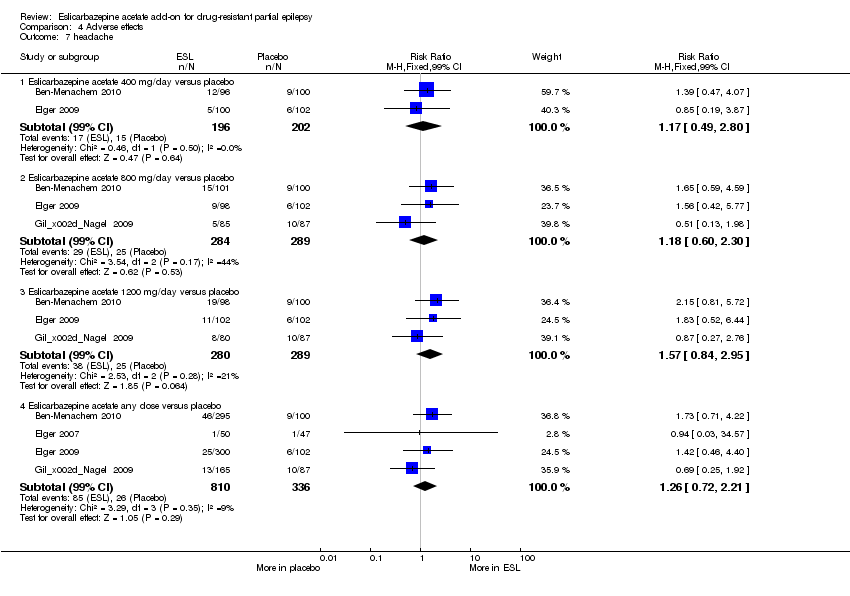
| 7 headache Show forest plot | 4 | | Risk Ratio (M‐H, Fixed, 99% CI) | Subtotals only |
|
| 7.1 Eslicarbazepine acetate 400 mg/day versus placebo | 2 | 398 | Risk Ratio (M‐H, Fixed, 99% CI) | 1.17 [0.49, 2.80] |
| 7.2 Eslicarbazepine acetate 800 mg/day versus placebo | 3 | 573 | Risk Ratio (M‐H, Fixed, 99% CI) | 1.18 [0.60, 2.30] |
| 7.3 Eslicarbazepine acetate 1200 mg/day versus placebo | 3 | 569 | Risk Ratio (M‐H, Fixed, 99% CI) | 1.57 [0.84, 2.95] |
| 7.4 Eslicarbazepine acetate any dose versus placebo | 4 | 1146 | Risk Ratio (M‐H, Fixed, 99% CI) | 1.26 [0.72, 2.21] |
| 8 diplopia Show forest plot | 3 | | Risk Ratio (M‐H, Fixed, 99% CI) | Subtotals only |
|
| 8.1 Eslicarbazepine acetate 400 mg/day versus placebo | 2 | 398 | Risk Ratio (M‐H, Fixed, 99% CI) | 2.42 [0.59, 10.01] |
| 8.2 Eslicarbazepine acetate 800 mg/day versus placebo | 3 | 573 | Risk Ratio (M‐H, Fixed, 99% CI) | 4.29 [1.30, 14.11] |
| 8.3 Eslicarbazepine acetate 1200 mg/day versus placebo | 3 | 569 | Risk Ratio (M‐H, Fixed, 99% CI) | 4.56 [1.38, 15.13] |
| 8.4 Eslicarbazepine acetate any dose versus placebo | 3 | 1049 | Risk Ratio (M‐H, Fixed, 99% CI) | 3.73 [1.19, 11.64] |
| 9 vomiting Show forest plot | 3 | | Risk Ratio (M‐H, Fixed, 99% CI) | Subtotals only |
|
| 9.1 Eslicarbazepine acetate 400 mg/day versus placebo | 1 | 196 | Risk Ratio (M‐H, Fixed, 99% CI) | 1.39 [0.20, 9.59] |
| 9.2 Eslicarbazepine acetate 800 mg/day versus placebo | 2 | 373 | Risk Ratio (M‐H, Fixed, 99% CI) | 2.84 [0.86, 9.40] |
| 9.3 Eslicarbazepine acetate 1200 mg/day versus placebo | 2 | 365 | Risk Ratio (M‐H, Fixed, 99% CI) | 2.80 [0.84, 9.35] |
| 9.4 Eslicarbazepine acetate any dose versus placebo | 3 | 744 | Risk Ratio (M‐H, Fixed, 99% CI) | 2.45 [0.79, 7.55] |