Efecto del cacao sobre la presión arterial
Información
- DOI:
- https://doi.org/10.1002/14651858.CD008893.pub3Copiar DOI

- Base de datos:
-
- Cochrane Database of Systematic Reviews
- Versión publicada:
-
- 25 abril 2017see what's new
- Tipo:
-
- Intervention
- Etapa:
-
- Review
- Grupo Editorial Cochrane:
-
Grupo Cochrane de Hipertensión
- Copyright:
-
- Copyright © 2017 The Cochrane Collaboration. Published by John Wiley & Sons, Ltd.
Cifras del artículo
Altmetric:
Citado por:
Autores
Contributions of authors
Search strategy, obtain copies of studies, study selection, extract data: KR, PF
Data entry into RevMan: KR
Analysis and interpretation: KR, PF
Draft of the review: KR with contributions from PF and NS
Sources of support
Internal sources
-
The University of Adelaide, Australia.
-
National Institute of Integrative Medicine, Australia.
First author is employed as Director of Research at NIIM
External sources
-
No sources of support supplied
Declarations of interest
KR has been an investigator on two randomised controlled trials included in this review (Ried 2009, Massee 2015). KR has no other conflict of interest to declare.
NS has been an investigator on one randomised controlled trial included in this review (Ried 2009). NS has no other conflict of interest to declare.
PF has no conflict of interest to declare.
Acknowledgements
We are thankful for the assistance by N Funabashi (Shiina 2009), D Grassi (Grassi 2008), and B van den Bogaard (Bogaard 2010), who provided unpublished data for inclusion in our meta‐analysis.
We would like to acknowledge the assistance and advice received from the Cochrane Hypertension Group.
Version history
| Published | Title | Stage | Authors | Version |
| 2017 Apr 25 | Effect of cocoa on blood pressure | Review | Karin Ried, Peter Fakler, Nigel P Stocks | |
| 2012 Aug 15 | Effect of cocoa on blood pressure | Review | Karin Ried, Thomas R Sullivan, Peter Fakler, Oliver R Frank, Nigel P Stocks | |
| 2010 Dec 08 | Effect of chocolate on blood pressure | Protocol | Karin Ried, Thomas R Sullivan, Peter Fakler, Oliver R Frank, Nigel P Stocks | |
Differences between protocol and review
We added to the exclusion criteria: Trials of very low quality, specifically high losses to follow up of more than 50%, were excluded from meta‐analysis.
For clarity, we provided more detail of the approach for data analysis.
We modified:
-
Primary outcome measure: 'Difference in systolic and diastolic blood pressure at final follow‐up between cocoa and control group, adjusted for baseline.' Previously, the protocol had read: 'Changes in systolic and diastolic blood pressure from baseline compared with control.'
-
Measurement of treatment effect: 'Mean difference in SBP/DBP in mmHg from baseline to final follow‐up, adjusted for baseline differences.' Previously, the protocol had read: 'Change of mean difference in SBP/DBP from baseline to follow‐up in mmHg.'
-
Dealing with missing data: '....We assumed a correlation of 0.68 between the final follow‐up SBP/DBP results for the two treatment arms in a cross‐over trial.' Previously, the protocol had read: 'We will assume a correlation of 0.68 for the standard deviation of the differences from baseline to follow‐up.'
-
We modified the imputation of standard deviations as follows:
-
standard deviation of blood pressure at end of treatment taken in a different position from that of the blood pressure data used
-
standard deviation of blood pressure at baseline
-
mean standard deviation of blood pressure at end of treatment from other trials using the same intervention.
-
Differences in versions of this review
The Ried 2012 version of this review incorporated a meta‐regression analysis which we have not conducted for this update, for practical reasons.
Keywords
MeSH
Medical Subject Headings (MeSH) Keywords
Medical Subject Headings Check Words
Adult; Humans;
PICO

PRISMA Flow diagram
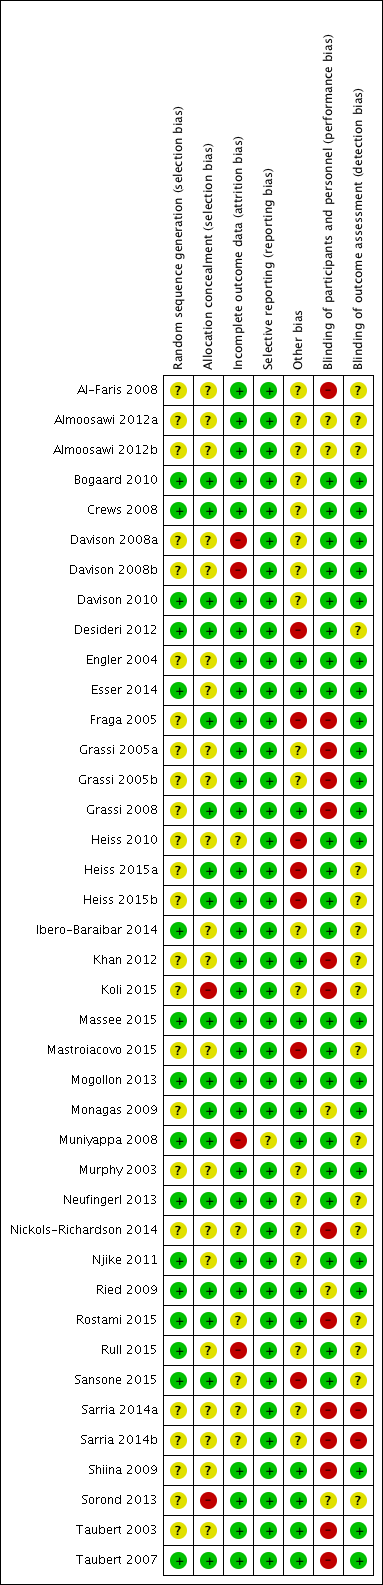
Risk of bias summary: review authors' judgements about each risk of bias item for each included study.

Forest plot of comparison: 1 Effect of cocoa on BP, outcome: 1.1 SBP.
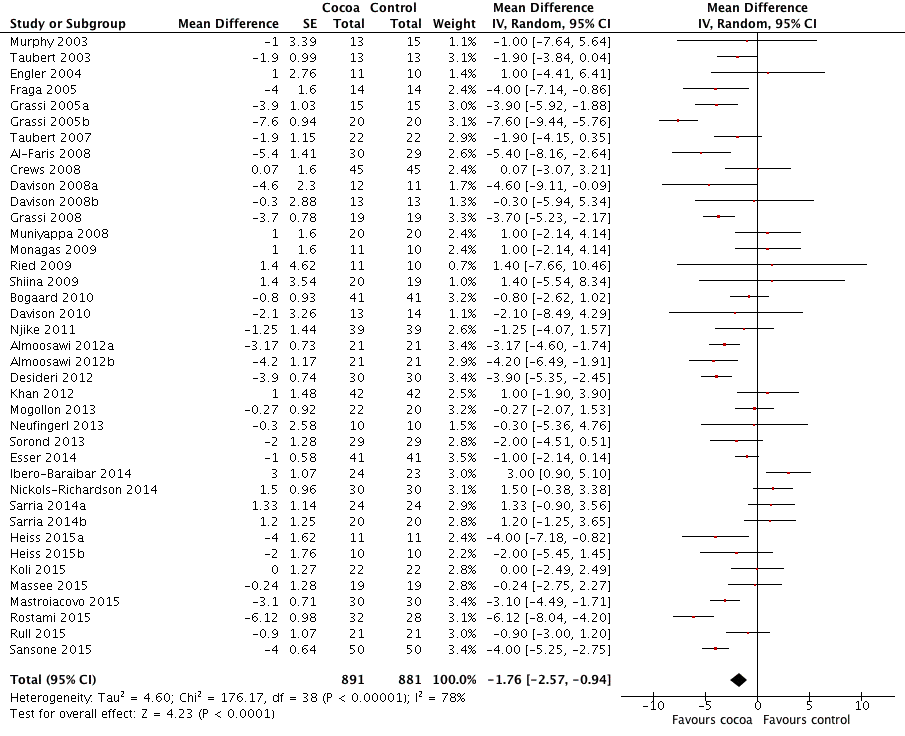
Forest plot of comparison: 1 Effect of cocoa on BP, outcome: 1.2 DBP.

Forest plot of comparison: 2 Hypertensive or normotensive subjects, outcome: 2.1 SBP.

Forest plot of comparison: 2 Hypertensive or normotensive subjects, outcome: 2.2 DBP.

Comparison 1 Effect of cocoa on BP, Outcome 1 SBP.
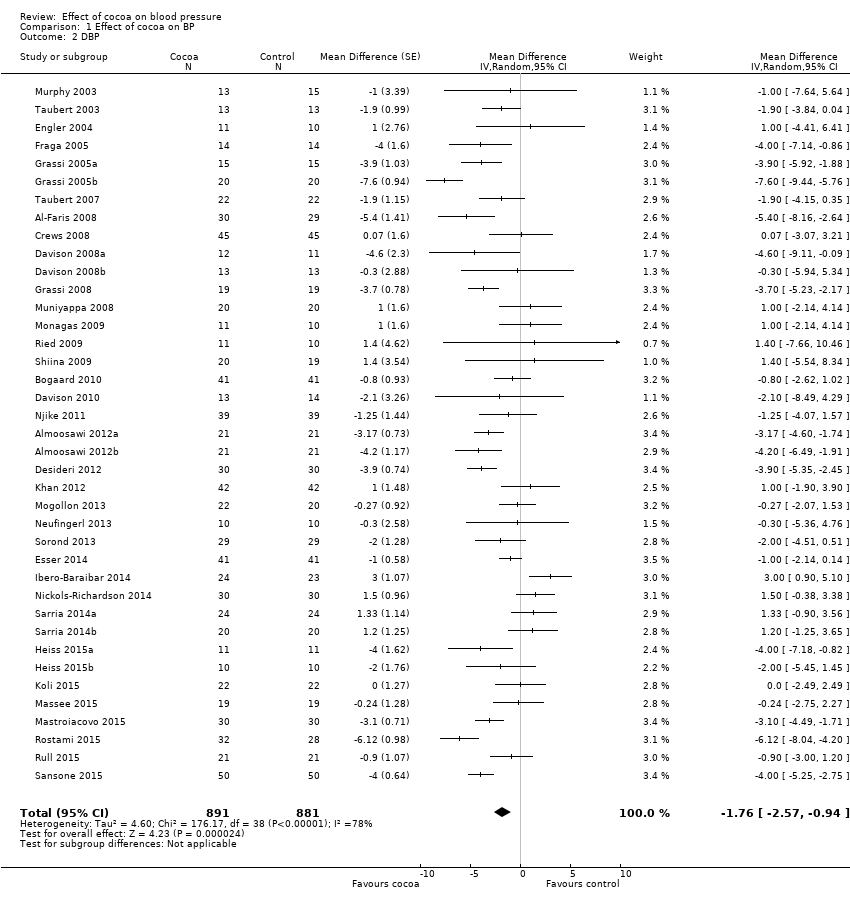
Comparison 1 Effect of cocoa on BP, Outcome 2 DBP.

Comparison 2 Hypertensive or normotensive participants, Outcome 1 SBP.
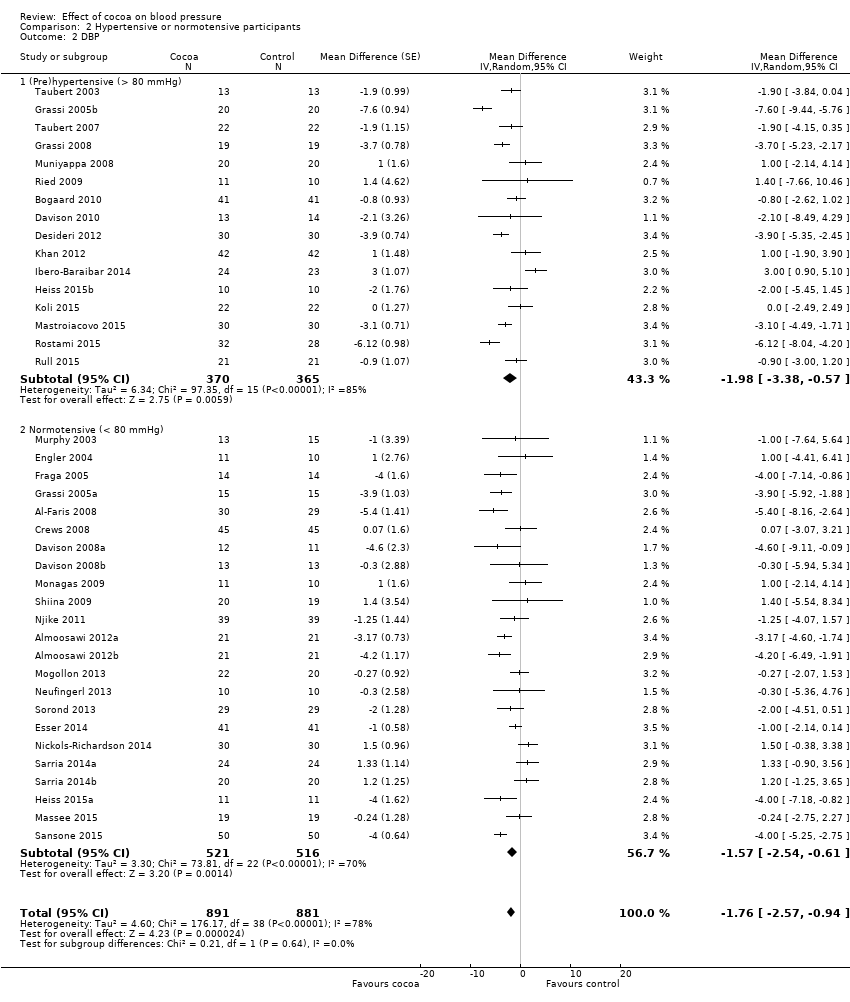
Comparison 2 Hypertensive or normotensive participants, Outcome 2 DBP.

Comparison 3 Flavanol‐free or low flavanol control, Outcome 1 SBP.
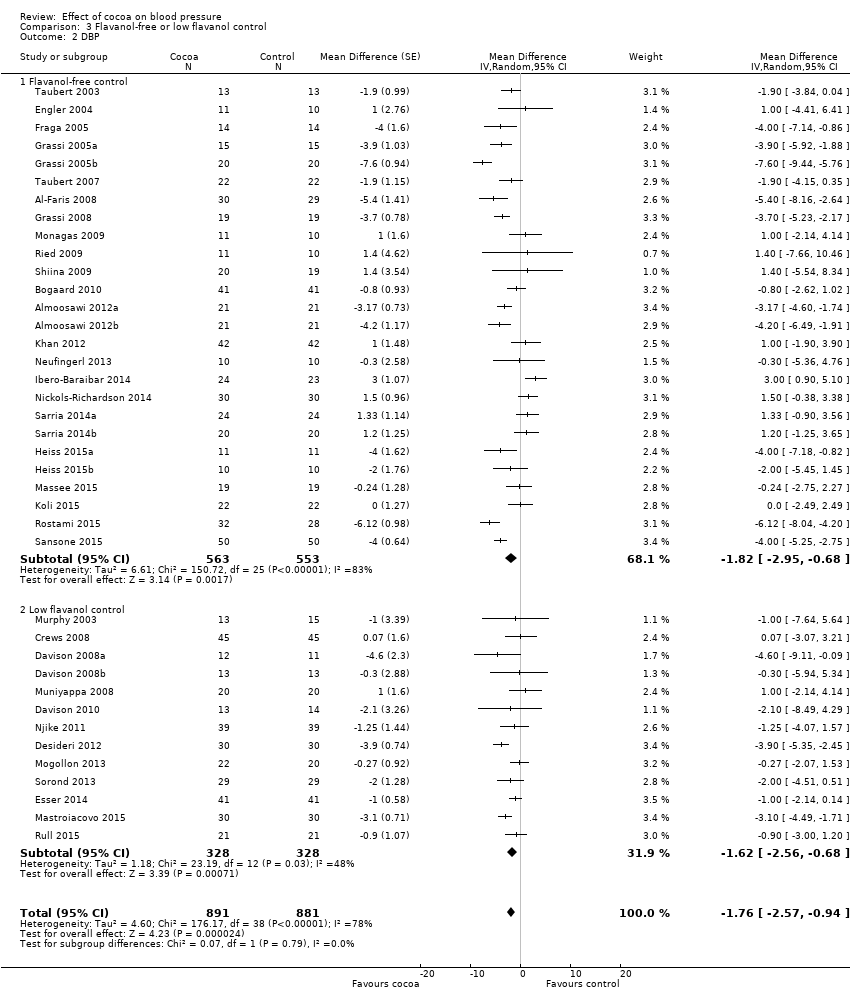
Comparison 3 Flavanol‐free or low flavanol control, Outcome 2 DBP.

Comparison 4 Double‐blinded or unblinded/single‐blinded, Outcome 1 SBP.
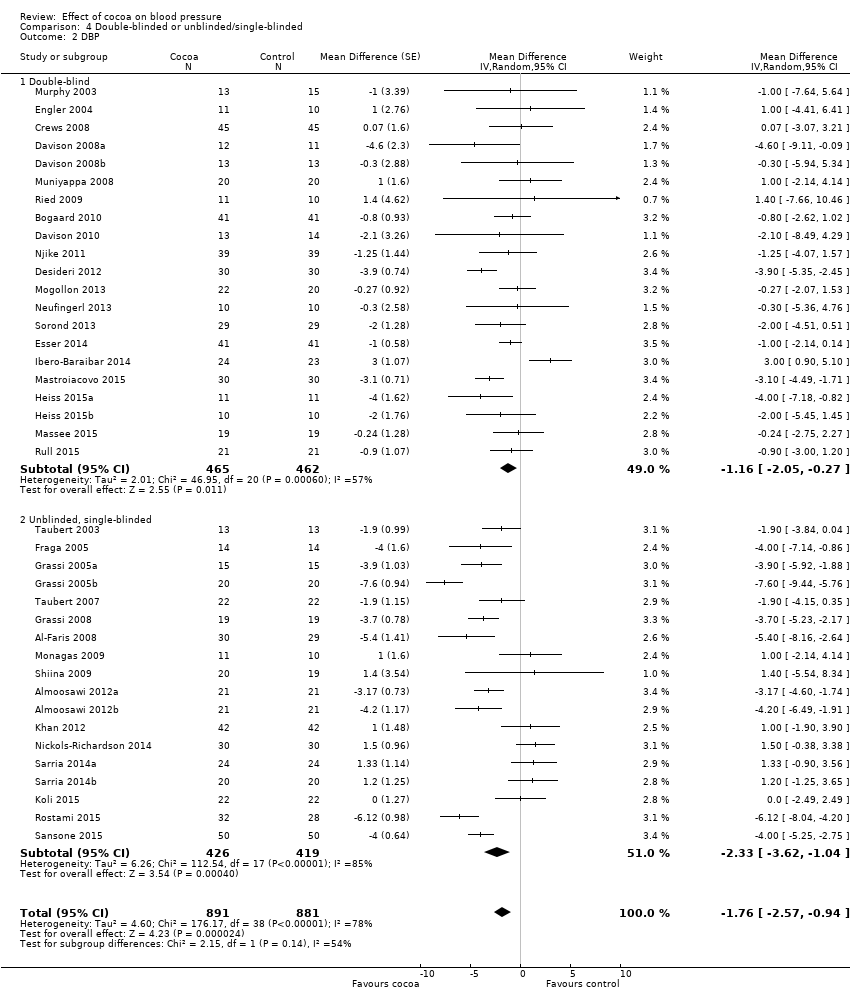
Comparison 4 Double‐blinded or unblinded/single‐blinded, Outcome 2 DBP.

Comparison 5 Participants ≥50 or <50 years old, Outcome 1 SBP.

Comparison 5 Participants ≥50 or <50 years old, Outcome 2 DBP.
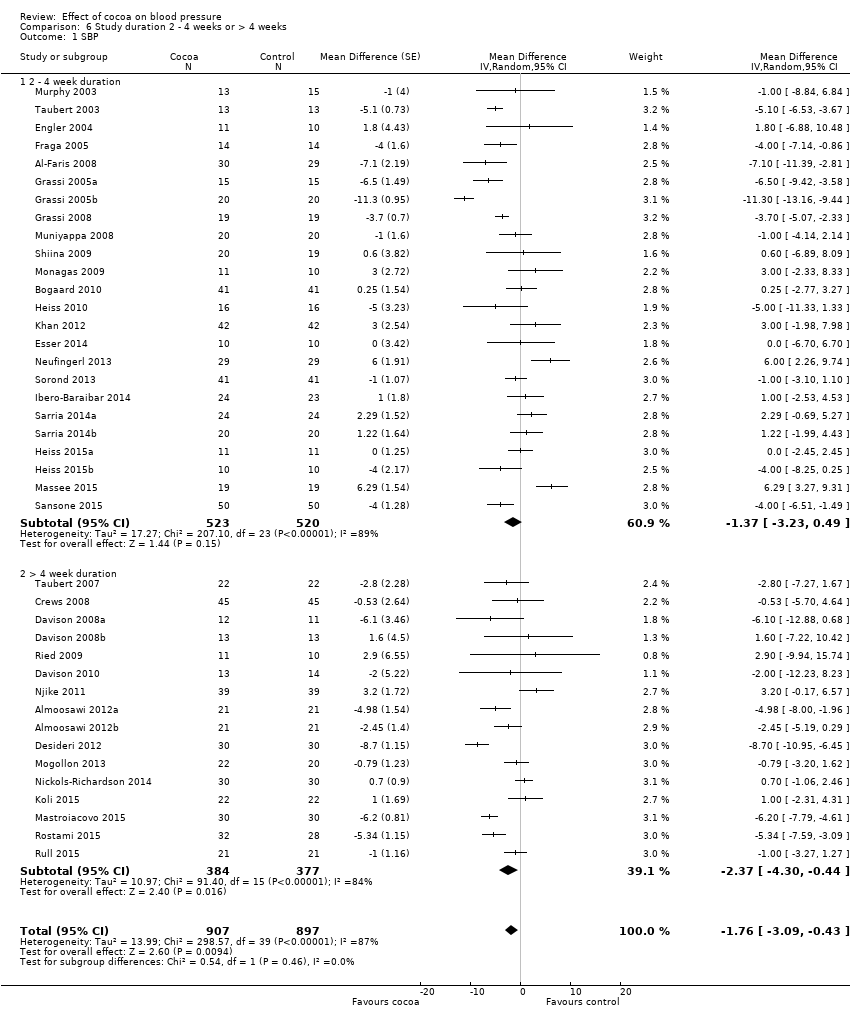
Comparison 6 Study duration 2 ‐ 4 weeks or > 4 weeks, Outcome 1 SBP.
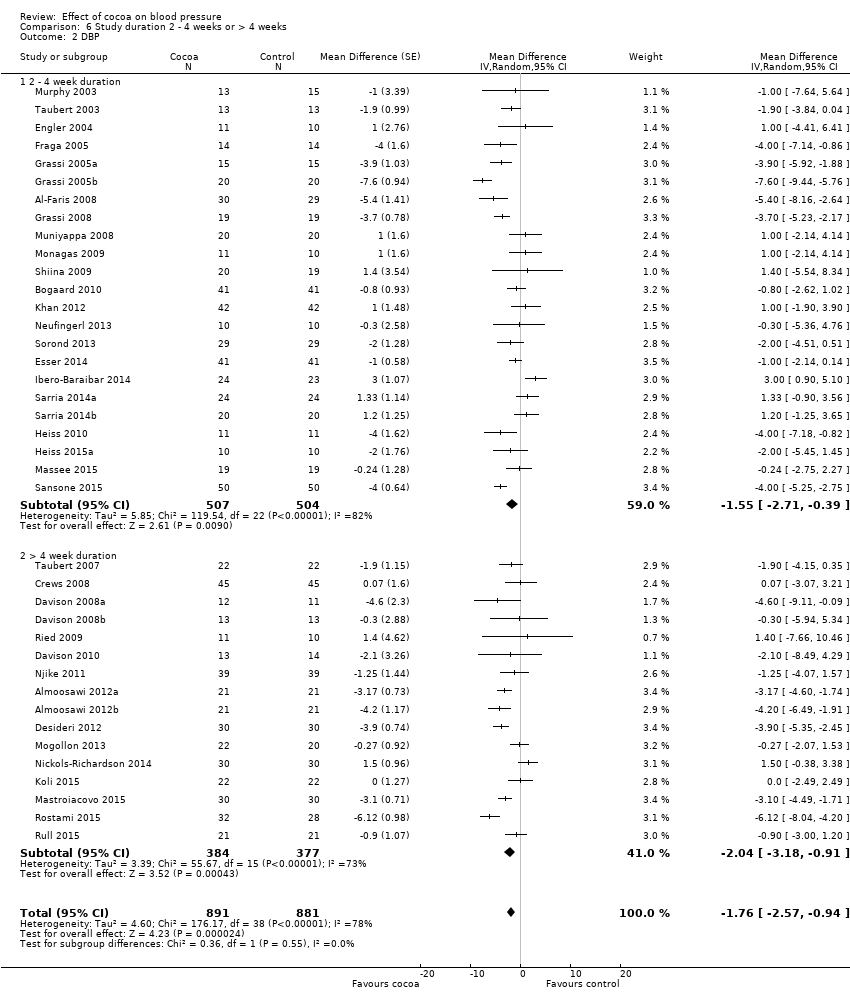
Comparison 6 Study duration 2 ‐ 4 weeks or > 4 weeks, Outcome 2 DBP.
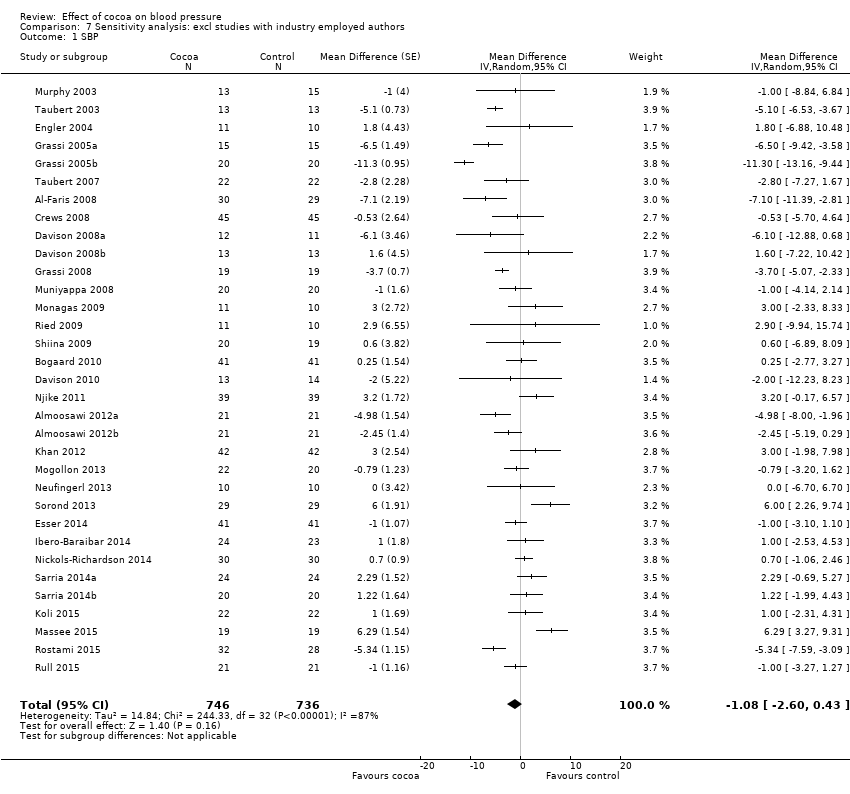
Comparison 7 Sensitivity analysis: excl studies with industry employed authors, Outcome 1 SBP.

Comparison 7 Sensitivity analysis: excl studies with industry employed authors, Outcome 2 DBP.
| Flavanol‐rich cocoa products for blood pressure | ||||||
| Patient or population: adults with or without hypertension | ||||||
| Outcomes | Illustrative comparative risks* (95% CI) | Relative effect | No of Participants | Quality of the evidence | Comments | |
| Assumed risk | Corresponding risk | |||||
| Control | Flavanol‐rich cocoa products | |||||
| Systolic blood pressure | The mean systolic blood pressure ranged across control groups from 107 to 154 mm Hg | The mean systolic blood pressure in the intervention groups was | 1804 | ⊕⊕⊕⊕ | ||
| Diastolic blood pressure | The mean diastolic blood pressure ranged across control groups from 66 to 92 mm Hg | The mean diastolic blood pressure in the intervention groups was | 1772 | ⊕⊕⊕⊕ | ||
| Withdrawals due to adverse effects | 8 trials reported no withdrawals and no adverse effects. 9 trials reported adverse effects, including gastrointestinal complaints (cocoa groups: n = 8/760 (1%), control groups: n = 3/754 (0.4%)); dislike of the trial product (cocoa: n = 4/760; control: n = 1/754), headache (cocoa: n = 2/760; control: n = 1/754), and jitteriness (cocoa: n = 1/760, control: n = 0/754). | 1514 (31 trials) reported on withdrawals and adverse effects | ⊕⊕⊕⊕ | |||
| *The basis for the assumed risk (e.g. the median control group risk across studies) is provided in footnotes. The corresponding risk (and its 95% confidence interval) is based on the assumed risk in the comparison group and the relative effect of the intervention (and its 95% CI). | ||||||
| GRADE Working Group grades of evidence | ||||||
| 1.Downgraded to moderate quality due to high heterogeneity which cannot be explained by subgroup analyses. SBP/DBP: I2 = 87%/78%. 2.Good quality across 40 treatment comparisons. Only 5 trials (12.5%) had 2 items at high risk of bias, 19 trials (47.5%) had 1 item at high risk of bias, and 16 trials (40%) had no items at high risk of bias. 17 trials were unblinded or single‐blinded. 7 industry‐sponsored trials had authors employed by industry. Only 4 trials (10%) had more than 20% attrition. We explored influence of trials with items at high risk of bias by subgroup and sensitivity analysis. | ||||||
| Study | Study design
| Participants Cocoa/ Control | Withdrawn Cocoa/Control | Reasons for withdrawal including adverse effects Cocoa/Control |
| Taubert 2003 | C | 13/13 | 0/0 | ‐ |
| Murphy 2003 | P | 13/15 | 3 in total | Family illness (2) Non‐compliance in final week (1) |
| Engler 2004 | P | 11/10 | 0/0 | ‐ |
| Fraga 2005 | C | 14/14 | 1/0 | No reason given |
| Grassi 2005a | C | 15/15 | 0/0 | ‐ |
| Grassi 2005b | C | 20/20 | 0/0 | ‐ |
| Taubert 2007 | P | 22/22 | 0/0 | ‐ |
| Crews 2008 | P | 45/45 | 6/5 | Gastrointestinal upset/headache/cold sweat (2/1) Bronchitis (1/0) Jitteriness/increased energy (1/0) Atrial arrhythmia/medication change (1/0) Dislike of study product (1/1) Family illness (0/1) Unspecified reason (0/1) No adherence to trial regimen (0/1) |
| Grassi 2008 | C | 19/19 | 0/0 | ‐ |
| Muniyappa 2008 | C | 20/20 | 5/4 | Lost to follow‐up (0/1) Discontinued intervention (4/2) due to Intolerance to treatment, family emergencies, personal problems excluded from analysis (1/1) |
| Davison 2008a | P | 12/11 | 7 in total | Time restrictions, personal circumstances (14) Non‐compliance (exercise or diet) (2)
|
| Davison 2008b | P | 13/13 | 5 in total | |
| Al‐Faris 2008 | P | 30/29 | 0/0 | ‐ |
| Shiina 2009 | P | 20/19 | 0/0 | ‐ |
| Ried 2009 | P | 11/10 | 2/2 | Study product unpalatable (2/0) Gastrointestinal upset (0/1) Illness unrelated to study (0/1) |
| Monagas 2009 | C | 42/42 | 0/0 | Constipation (resolved with fibre intake) |
| Bogaard 2010 | C | 41/41 | 3 in total | Nausea (1) Headache (1) Arrythmia unrelated (1)
|
| Heiss 2010 | C | 16/16 | 3 in total | Did not come to first visit |
| Davison 2010 | P | 13/14 | 7 in total | Mild gastric symptoms (1) Non‐compliance with study protocol (1) Withdrew due to personal circumstances (5) |
| Njike 2011 | C | 38/38 | 7 in total | Non‐compliance with study protocol (1) Withdrew for personal reasons (6)
|
| Almoosawi 2012a | C | 21/21 | 1/1 | Personal reasons unrelated to study |
| Desideri 2012 | P | 30/30 | 0/1 | Gastric discomfort (1) |
| Khan 2012 | C | 42/42 | 1/0 | Constipation |
| Mogollon 2013 | P | 22/20 | 1/1 | Unrelated to study (1)/headache (1) |
| Neufingerl 2013 | P | 10/10 | 1/1 | Nausea (1)/unrelated (1) |
| Sorond 2013 | P | 29/29 | 1/1 | No details provided |
| Esser 2014 | C | 41/41 | 3 in total | Medical reasons (1), disliked chocolate (1), poor compliance (1) |
| Ibero‐Baraibar 2014 | P | 24/23 | 2/1 | Personal reason (2), poor compliance (1) |
| Nickols‐Richardson 2014 | P | 30/30 | 0/0 | None |
| Sarria 2014 (a) | C | 24/24 20/20 | ? | No information given |
| Heiss 2015 (a) | P | 11/11 10/10 | 0/0 | None |
| Massee 2015 | P | 19/19 | 1/1 | Personal reasons (1) |
| Rostami 2015 | P | 32/28 | 2/6 | No information given |
| Koli 2015 | C | 22/22 | 0/0 | No side effects reported |
| Mastroiacovo 2015 | P | 30/30 | 1/0 | Personal reasons (1) No side effects reported |
| Rull 2015 | C | 21/21 | 11 | No details provided |
| Sansone 2015 | P | 50/50 | ? | No information given |
| C:Cross‐over | ||||
| Outcome or subgroup title | No. of studies | No. of participants | Statistical method | Effect size |
| 1 SBP Show forest plot | 40 | 1804 | Mean Difference (Random, 95% CI) | ‐1.76 [‐3.09, ‐0.43] |
| 2 DBP Show forest plot | 39 | 1772 | Mean Difference (Random, 95% CI) | ‐1.76 [‐2.57, ‐0.94] |
| Outcome or subgroup title | No. of studies | No. of participants | Statistical method | Effect size |
| 1 SBP Show forest plot | 40 | 1804 | Mean Difference (Random, 95% CI) | ‐1.76 [‐3.09, ‐0.43] |
| 1.1 Hypertensive (> 140 mmHg) | 9 | 401 | Mean Difference (Random, 95% CI) | ‐4.00 [‐6.71, ‐1.30] |
| 1.2 Prehypertensive (> 130 mmHg) | 8 | 340 | Mean Difference (Random, 95% CI) | ‐2.43 [‐5.02, 0.17] |
| 1.3 Normotensive | 23 | 1063 | Mean Difference (Random, 95% CI) | ‐0.65 [‐2.13, 0.84] |
| 2 DBP Show forest plot | 39 | 1772 | Mean Difference (Random, 95% CI) | ‐1.76 [‐2.57, ‐0.94] |
| 2.1 (Pre)hypertensive (> 80 mmHg) | 16 | 735 | Mean Difference (Random, 95% CI) | ‐1.98 [‐3.38, ‐0.57] |
| 2.2 Normotensive (< 80 mmHg) | 23 | 1037 | Mean Difference (Random, 95% CI) | ‐1.57 [‐2.54, ‐0.61] |
| Outcome or subgroup title | No. of studies | No. of participants | Statistical method | Effect size |
| 1 SBP Show forest plot | 40 | 1804 | Mean Difference (Random, 95% CI) | ‐1.76 [‐3.09, ‐0.43] |
| 1.1 Flavanol‐free control | 26 | 1116 | Mean Difference (Random, 95% CI) | ‐1.80 [‐3.46, ‐0.13] |
| 1.2 Low flavanol control | 14 | 688 | Mean Difference (Random, 95% CI) | ‐1.67 [‐4.03, 0.69] |
| 2 DBP Show forest plot | 39 | 1772 | Mean Difference (Random, 95% CI) | ‐1.76 [‐2.57, ‐0.94] |
| 2.1 Flavanol‐free control | 26 | 1116 | Mean Difference (Random, 95% CI) | ‐1.82 [‐2.95, ‐0.68] |
| 2.2 Low flavanol control | 13 | 656 | Mean Difference (Random, 95% CI) | ‐1.62 [‐2.56, ‐0.68] |
| Outcome or subgroup title | No. of studies | No. of participants | Statistical method | Effect size |
| 1 SBP Show forest plot | 40 | 1804 | Mean Difference (Random, 95% CI) | ‐1.76 [‐3.09, ‐0.43] |
| 1.1 Double‐blind | 23 | 1059 | Mean Difference (Random, 95% CI) | ‐0.95 [‐2.77, 0.86] |
| 1.2 Unblinded, single‐blinded | 17 | 745 | Mean Difference (Random, 95% CI) | ‐2.71 [‐4.66, ‐0.76] |
| 2 DBP Show forest plot | 39 | 1772 | Mean Difference (Random, 95% CI) | ‐1.76 [‐2.57, ‐0.94] |
| 2.1 Double‐blind | 21 | 927 | Mean Difference (Random, 95% CI) | ‐1.16 [‐2.05, ‐0.27] |
| 2.2 Unblinded, single‐blinded | 18 | 845 | Mean Difference (Random, 95% CI) | ‐2.33 [‐3.62, ‐1.04] |
| Outcome or subgroup title | No. of studies | No. of participants | Statistical method | Effect size |
| 1 SBP Show forest plot | 38 | 1762 | Mean Difference (Random, 95% CI) | ‐1.36 [‐2.79, 0.06] |
| 1.1 < 50 years | 18 | 726 | Mean Difference (Random, 95% CI) | ‐1.79 [‐4.05, 0.48] |
| 1.2 ≥ 50 years | 20 | 1036 | Mean Difference (Random, 95% CI) | ‐0.98 [‐2.87, 0.90] |
| 2 DBP Show forest plot | 37 | 1688 | Mean Difference (Random, 95% CI) | ‐1.62 [‐2.49, ‐0.76] |
| 2.1 < 50 years | 18 | 726 | Mean Difference (Random, 95% CI) | ‐2.01 [‐3.45, ‐0.58] |
| 2.2 ≥ 50 years | 19 | 962 | Mean Difference (Random, 95% CI) | ‐1.28 [‐2.32, ‐0.24] |
| Outcome or subgroup title | No. of studies | No. of participants | Statistical method | Effect size |
| 1 SBP Show forest plot | 40 | 1804 | Mean Difference (Random, 95% CI) | ‐1.76 [‐3.09, ‐0.43] |
| 1.1 2 ‐ 4 week duration | 24 | 1043 | Mean Difference (Random, 95% CI) | ‐1.37 [‐3.23, 0.49] |
| 1.2 > 4 week duration | 16 | 761 | Mean Difference (Random, 95% CI) | ‐2.37 [‐4.30, ‐0.44] |
| 2 DBP Show forest plot | 39 | 1772 | Mean Difference (Random, 95% CI) | ‐1.76 [‐2.57, ‐0.94] |
| 2.1 2 ‐ 4 week duration | 23 | 1011 | Mean Difference (Random, 95% CI) | ‐1.55 [‐2.71, ‐0.39] |
| 2.2 > 4 week duration | 16 | 761 | Mean Difference (Random, 95% CI) | ‐2.04 [‐3.18, ‐0.91] |
| Outcome or subgroup title | No. of studies | No. of participants | Statistical method | Effect size |
| 1 SBP Show forest plot | 33 | 1482 | Mean Difference (Random, 95% CI) | ‐1.08 [‐2.60, 0.43] |
| 2 DBP Show forest plot | 33 | 1482 | Mean Difference (Random, 95% CI) | ‐1.37 [‐2.31, ‐0.43] |