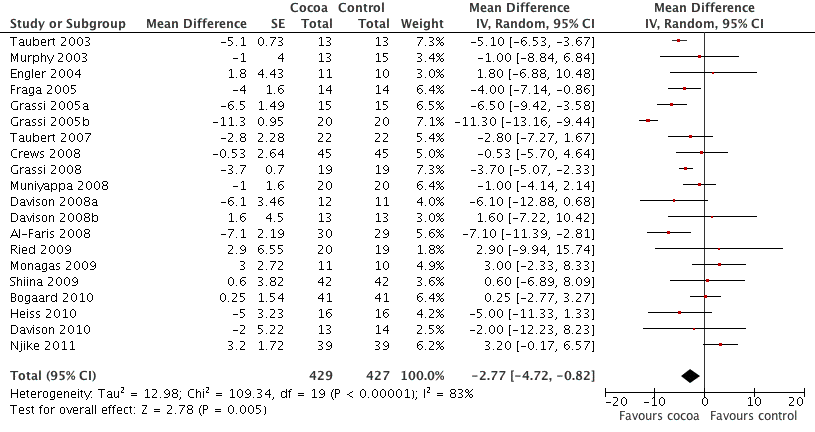
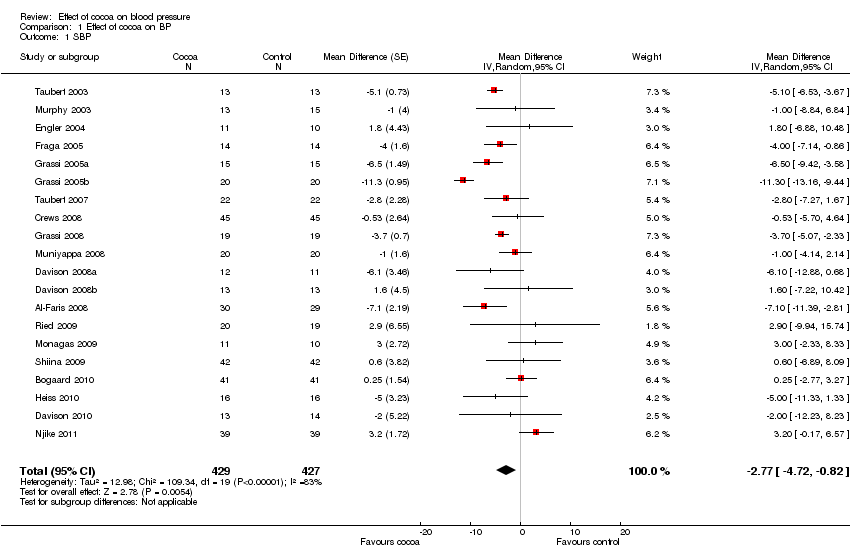
| Sensitivity analyses | Comparison | Mean difference (95% CI) | p‐value | I2 | I2 before sensitivity analysis |
| Excluding Grassi 2005b | SBP all | ‐2.33 (‐3.83,‐0.83) | 0.002 | 63% | 83% |
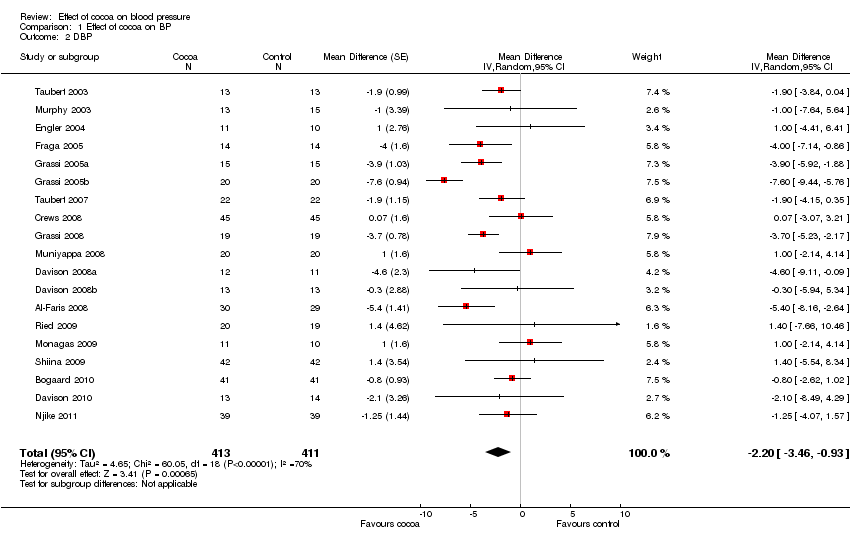
| | DBP all | ‐1.90 (‐2.88, ‐0.92) | 0.0001 | 44% | 70% |
| | SBP flavanol‐free subgroup | ‐3.20 (‐4.84, ‐1.56) | 0.0001 | 62% | 86% |
| | DBP flavanol‐free subgroup | ‐2.29 (‐3.49, ‐1.09) | 0.0002 | 54% | 77% |
| | SBP hypertensive subgroup | ‐2.84 (‐4.61, ‐1.07) | 0.002 | 63% | 91% |
| | DBP hypertensive subgroup | ‐1.76 (‐3.09, ‐0.44) | 0.009 | 50% | 85% |
| | SBP sugar > 10g, BMI > 25 subgroup | 0.95 (‐0.95, 2.85) | 0.33 | 0% | 93% |
| | DBP sugar > 10g, BMI > 25 subgroup | 0.04 (‐1.42, 1.50) | 0.96 | 0% | 86% |
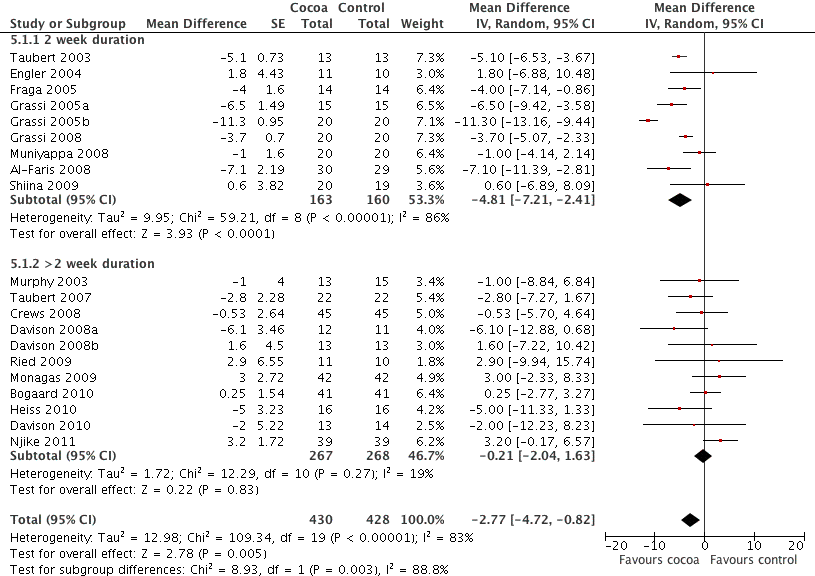
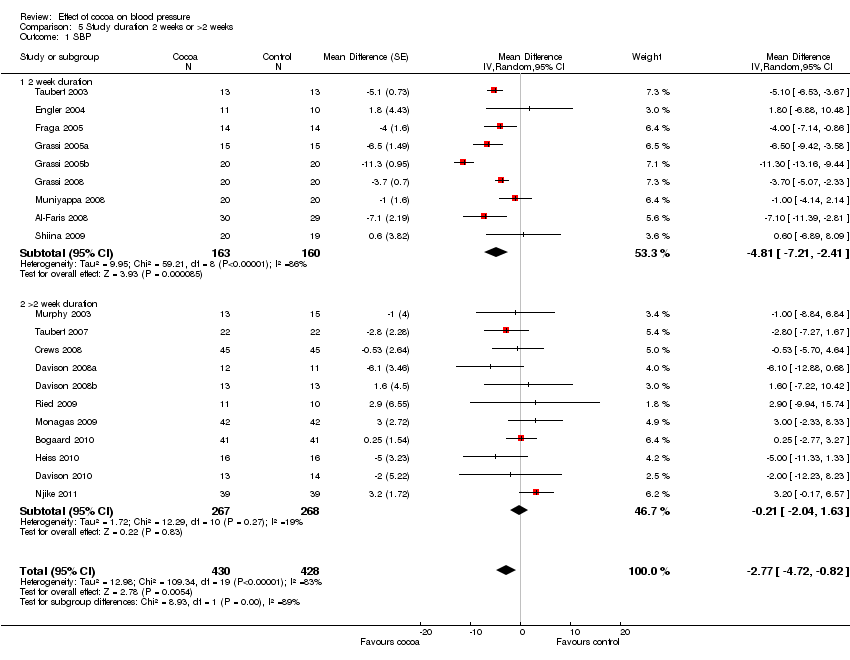
| | SBP 2 weeks subgroup | ‐4.12 (‐5.53, ‐2.70) | <0.0001 | 48% | 86% |
| | DBP 2 weeks subgroup | ‐2.68 (‐4.14, ‐1.22) | 0.0003 | 56% | 77% |
| | SBP <50 yrs age subgroup | ‐4.33 (‐5.87, ‐2.79) | <0.0001 | 23% | 84% |
| | DBP <50 yrs age subgroup | ‐3.72 (‐4.70, ‐2.74) | <0.0001 | 0% | 60% |
| | | | | |
| Excluding Taubert 2007 | SBP all | ‐2.75 (‐4.79, ‐0.72) | 0.008 | 83% | 83% |
| DBP all | ‐2.20 (‐3.55, ‐0.85) | 0.001 | 71% | 70% |
| SBP flavanol‐free subgroup | ‐3.76 (‐6.22, ‐1.30) | 0.003 | 87% | 86% |
| DBP flavanol‐free subgroup | ‐2.77 (‐4.47, ‐1.06) | 0.001 | 78% | 77% |
| SBP hypertensive subgroup | ‐4.16 (‐7.48, ‐0.84) | 0.01 | 92% | 91% |
| DBP hypertensive subgroup | ‐2.11 (‐3.58, ‐0.63) | 0.005 | 60% | 85% |
| SBP >2 weeks subgroup | ‐0.20 (‐1.71, 2.12) | 0.83 | 15% | 19% |
| DBP >2 weeks subgroup | ‐0.76 (‐1.90, 0.38) | 0.19 | 0% | 0% |
| SBP >50 yrs age subgroup | ‐0.72 (‐3.48, 2.04) | 0.61 | 76% | 73% |
| DBP >50 yrs age subgroup | ‐0.70 (‐1.69, 0.28) | 0.16 | 0% | 0% |
| | | | | | |
| Excluding trials with loss‐of‐follow up/poor compliance > 20% (Muniyappa 2008, Davison 2008b) | SBP all | ‐3.03 (‐5.09, ‐0.97) | 0.004 | 83% | 83% |
| | DBP all | ‐2.48 (‐3.78, ‐1.18) | 0.0002 | 70% | 70% |
| | SBP low‐flavanol subgroup | ‐1.24 (‐4.59, 2.12) | 0.47 | 46% | 27% |
| | DBP low‐flavanol subgroup | ‐1.39 (‐3.15, 0.37) | 0.12 | 0% | 0% |
| | SBP hypertensive subgroup (–M8) | ‐4.52 (‐7.81, ‐1.22) | 0.007 | 92% | 91% |
| | DBP hypertensive subgroup (‐M8) | ‐3.12 (‐5.31, ‐0.92) | 0.005 | 84% | 85% |
| | SBP normotensive subgroup (–D8b) | ‐2.24 (‐4.95, 0.47) | 0.11 | 68% | 66% |
| | DBP normotensive subgroup (‐D8b) | ‐2.32 (‐4.02, ‐0.62) | 0.007 | 52% | 47% |
| | SBP sugar >10g, BMI > 25 subgroup (‐M8) | ‐1.07 (‐8.41, 6.26) | 0.77 | 94% | 93% |
| | DBP sugar >10g, BMI > 25 subgroup (‐M8) | ‐1.74 (‐5.49, 2.00) | 0.36 | 86% | 86% |
| | SBP sugar <10g, BMI > 25 subgroup (‐D8b) | ‐2.77 (‐5.07, ‐0.46) | 0.02 | 41% | 37% |
| | DBP sugar <10g, BMI > 25 subgroup (‐D8b) | ‐2.55 (‐4.60, ‐0.49) | 0.02 | 55% | 45% |
| | SBP 2 weeks subgroup (‐M8) | ‐5.35 (‐7.35, ‐2.85) | <0.0001 | 86% | 86% |
| | DBP 2 weeks subgroup (‐M8) | ‐3.78 (‐5.50, ‐2.06) | <0.0001 | 73% | 77% |
| | SBP >2 wks subgroup (‐D8b) | ‐0.35 (‐2.32, 1.63) | 0.73 | 26% | 19% |
| | DBP >2 wks subgroup (‐D8b) | ‐1.01 (‐2.05, 0.02) | 0.06 | 0% | 0% |
| | SBP <50 yrs age subgroup (‐D8b) | ‐5.46 (‐8.47, ‐2.45) | 0.0004 | 86% | 84% |
| | DBP <50 yrs age subgroup (‐D8b) | ‐4.37 (‐5.94, ‐2.79) | <0.0001 | 60% | 60% |
| | SBP >50 yrs age subgroup (‐M8) | ‐0.93 (‐3.79, 1.93) | 0.52 | 75% | 73% |
| | DBP >50 yrs age subgroup (‐M8) | ‐1.06 (‐2.01, ‐0.12) | 0.03 | 0% | 0% |
| | | | | |
| Using alternative correlation coefficients for cross‐over trials (main analysis: r=0.68) | SBP r=0.5 | ‐2.85 (‐4.76, ‐0.93) | 0.004 | 75% | 83% |
| SBP r=0.3 | ‐2.93 (‐4.82, ‐1.05) | 0.002 | 67.3% | 83% |
| DBP r=0.5 | ‐2.23 (‐3.45, ‐1.00) | <0.0001 | 57.2% | 70% |
| DBP r=0.3 | ‐2.24 (‐3.44, ‐1.05) | <0.0001 | 44.7% | 70% |