Tests diagnostiques rapides pour la fièvre typhoïde et paratyphoïde (fièvre entérique)
Résumé scientifique
Contexte
Différencier la typhoïde (Salmonella Typhi)et la paratyphoïde (Salmonella Paratyphi A) d'autres causes de fièvre dans les zones endémiques est un défi de diagnostic. Bien que les tests de diagnostics rapides (TDR) pour la fièvre entérique soient présentés comme une alternative à l'actuel test de référence (hémocultures ou culture à partir de la moëlle osseuse ou le Widal Test largement utilisé) pour des raisons de économiques, leur exactitude diagnostique n'est pas claire. Si les résultats trouvés avaient été précis, ils auraient pu remplacer les hémocultures comme principal test diagnostique pour la fièvre entérique recommandé par l'Organisation mondiale de la Santé (OMS).
Objectifs
Évaluer la précision diagnostique des tests de diagnostic rapide (TDR) et prototypes disponibles dans le commerce pour la détection de Salmonella Typhi ou Paratyphi A chez des personnes présentant des symptômes et vivant dans les zones endémiques.
Stratégie de recherche documentaire
Nous avons effectué des recherches dans le registre spécialisé du groupe Cochrane sur les maladies infectieuses, MEDLINE, Embase, Science Citation Index, IndMed, African Index Medicus, LILACS, ClinicalTrials.gov, et de l'Organisation mondiale de la Santé (OMS), International Clinical Trials Registry Platform (ICTRP) jusqu'au 4 mars 2016. Nous avons effectué des recherches manuelles dans les rapports d'essais cliniques de l'OMS, et des articles de conférences internationales sur les infections Salmonella. Nous avons également contacté des fabricants de test pour identifier des études.
Critères de sélection
Nous avons inclus les études portant sur l'exactitude du TDR de la fièvre entérique chez les patients atteints de fièvre ou avec des symptômes suggérant la fièvre entérique vivant dans les zones endémiques. Nous avons classé le standard de référence soit au degré 1 (résultant d'une hémoculture et d'une culture réalisée à partir de moelle osseuse) soit au degré 2 (résultat d'hémoculture avec une amplification en chaîne par polymérase, ou d'hémoculture seule).
Recueil et analyse des données
Deux auteurs de la revue ont indépendamment extrait les données de résultats de test. Nous avons utilisé un formulaire d'extraction QUADAS‐2 modifié pour évaluer la qualité méthodologique. Nous avons réalisé une méta‐analyse quand il y avait suffisamment d'études pour le test et l'hétérogénéité était correcte.
Résultats principaux
Trente‐sept études remplissaient les critères d'inclusion et incluaient un total de 5080 participants (fourchette de 50 à 1732). La prévalence de la fièvre entérique dans les populations étudiées variait de 1 % à 75 % (prévalence médiane de 24 %, intervalle interquartile (IQR) de 11 % à 46 %). Les études incluses ont évalué 16 différents TDR, et 16 études comparaient deux ou plusieurs des différents TDR. Seules trois études ont utilisé le degré 1 référence, et seulement 11 études ont recruté des patients fébriles non sélectionnés. La plupart des études incluses provenaient d'Asie, avec cinq études réalisées en Afrique sub‐saharienne. Tous les TDR ont été conçus pour détecter une infection S.Typhi uniquement.
La plupart des études évaluaient trois des TDR et leurs variantes : TUBEX dans 14 études ; Typhidot (Typhidot, Typhidot‐M, et TyphiRapid‐Tr02) dans 22 études ; et le dosage immunochromatographique à flux Test‐It typhoïde et ses prototypes antérieurs (réglette‐jauge, latex agglutinées) développés par le Royal Tropical Institute, Amsterdam (KIT) dans neuf études. Les méta‐analyses ont montré une sensibilité moyenne de 78 % (intervalle de confiance à 95 % (IC) de 71 % à 85 %) et une spécificité de 87 % (IC à 95 % de 82 % à 91 %) pour TUBEX ; et une sensibilité moyenne de 69 % (IC à 95 % de 59 % à 78 %) et une spécificité de 90 % (IC à 95 % de 78 % à 93 %) pour tous les Test‐It typhoïde et tests prototypes (KIT). Dans toutes les formes du test Typhidot, la sensibilité moyenne était de 84 % (IC à 95 % de 73 % à 91 %) et la spécificité était de 79 % (IC à 95 % de 70 % à 87 %). Lorsque nous avons basé l'analyse sur les 13 études du test Typhidot qui portait sur des résultats de tests indéterminés ou des résultats où le format du test excluait tout résultat indéterminé, la sensibilité moyenne était de 78 % (IC à 95 % de 65 % à 87 %) et la spécificité était de 77 % (IC à 95 % de 66 % à 86 %). Nous n'avons identifié aucune différence dans aucun des groupes de sensibilité ou de spécificité entre TUBEX, Typhidot ou Test‐it typhoïde lorsque les résultats des tests étaient basés sur la comparaison des 13 études Typhidot dans lesquelles les résultats indéterminés étaient rapportés ou non applicables. Si TUBEX et Test‐it typhoïde sont comparés à toutes les études Typhidot, la sensibilité de Typhidot était plus élevée que Test‐it typhoïde (15 % (IC à 95 % de 2 % à 28 %), mais d'autres comparaisons n'ont pas montré de différence au niveau des IC à 95 %.
Dans une cohorte hypothétique de 1000 patients fébriles où 30 % (300 patients) ont de la fièvre entérique, en moyenne, les test Typhidot mentionnant des résultats indéterminés ou qui ne génèrent pas de résultats indéterminés, manqueraient le diagnostic chez 66 patients atteints de fièvre entérique, TUBEX en manquerait 66, et Test‐It typhoïde et autres tests prototypes (KIT) en manqueraient 93. Parmi les 700 personnes sans fièvre entérique, le nombre de personnes diagnostiquées avec la fièvre entérique de manière erronée serait de 161 avec des tests Typhidot, 91 avec TUBEX, et 70 avec Test‐It typhoïde et autres tests prototypes (KIT). Les intervalles de confiance autour de ces estimations étaient larges, sans aucune différence dans les résultats de faux positifs observée entre les tests.
La qualité des données de chaque étude a été évaluée à l'aide d'un formulaire standardisé appelé QUADAS‐2. Dans l'ensemble, la solidité des preuves dans les études qui évaluaient la fièvre entérique par TDR était faible.
Conclusions des auteurs
Dans 37 études ayant évalué la précision diagnostique des TDR pour la fièvre entérique, peu d'études présentaient un faible risque de biais. Les trois principaux TDR et autres tests avaient une précision diagnostique modérée. Il n'y avait aucune preuve d'une différence entre la sensibilité et la spécificité moyennes des trois principaux tests TDR. Davantage d'évaluations solides de TDR alternatifs pour la fièvre entérique sont nécessaires.
Résumé simplifié
La précision des tests diagnostiques rapides pour la détection de la fièvre typhoïde et paratyphoïde (fièvre entérique)
Les chercheurs de Cochrane ont évalué la précision des tests de diagnostique rapide disponibles dans le commerce et leurs prototypes (y compris TUBEX, Typhidot, Typhidot‐M, Test‐it typhoïde, et d'autres tests) pour la détection de la fièvre typhoïde et paratyphoïde chez les personnes vivant dans des pays où le nombre estimé d'individus atteints de la maladie à tout moment est supérieur à 10 pour 100 000 personnes. Si les résultats trouvés sont précis, ils pourraient remplacer l'actuel test diagnostique recommandé par l'Organisation mondiale de la Santé (OMS) : les hémocultures (la croissance des bactéries qui causent l'infection à partir du sang ou de la moëlle osseuse d'un patient).
Contexte
La fièvre typhoïde et la fièvre paratyphoïde sont des infections causées par la bactérie Salmonella Typhi et Salmonella Paratyphi A, respectivement. Le terme de fièvre entérique est utilisé pour décrire les deux infections. La fièvre entérique peut être difficile à diagnostiquer car les signes et symptômes sont similaires à ceux d'autres maladies infectieuses qui provoquent de la fièvre comme le paludisme.
Le test recommandé pour confirmer si une personne a la fièvre entérique consiste à laisser la Salmonella se développer à partir de son sang. Il faut au moins 48 heures pour donner un résultat, nous ne pouvons donc pas aider les professionnels de santé à établir un diagnostic le jour même de la réalisation de l'hémoculture. Les hémocultures pourraient donner un résultat négatif, même si une personne a la fièvre entérique. Le test nécessite un laboratoire et un personnel formé, qui ne sont pas souvent disponibles dans les communautés où la fièvre entérique est fréquente.
Des tests diagnostiques rapides (TDR) sont conçus pour être faciles à utiliser et donner un résultat rapide sans avoir nécessairement recours à la réalisation d'une hémoculture en laboratoire. Le coût d'un TDR pour la fièvre entérique serait significativement moins élevé que celui d'une hémoculture, et nécessite moins de formation pour être réalisé.
Caractéristiques de l'étude
Les chercheurs de Cochrane ont consulté la littérature disponible jusqu'au 4 mars 2016 et ont inclus 37 études. La plupart des études avaient recruté des participants d'Asie du Sud. La plupart des participants étaient adultes, avec 22 études incluant des enfants. Tous les TDR évalués ont détecté Salmonella Typhi (la fièvre typhoïde) uniquement.
Qualité des preuves
Les chercheurs de Cochrane ont évalué la qualité des données pour chaque étude à l'aide d'un formulaire standardisé check‐list appelé QUADAS‐2. Les études de haute qualité qui comparaient différents types de TDR avec les mêmes patients étaient peu nombreuses. Deux tiers des études incluses n'ont pas évalué le TDR dans le contexte de patients qui sont généralement testés pour la maladie. De nombreuses études utilisaient un plan d'étude spécifique (une étude cas‐témoins) qui risque de surestimer l'exactitude du TDR. Dans les études évaluant le TDR Typhidot, le nombre de résultats indéterminés n'était pas souvent clair, lorsque le test ne pouvait pas distinguer une infection récente d'un épisode plus ancien de la maladie. Dans l'ensemble, la solidité des preuves dans les études qui évaluaient la fièvre entérique par TDR était faible.
Principaux résultats
La sensibilité indique le pourcentage de patients présentant un résultat de test positif qui présentent réellement la maladie. La spécificité indique le pourcentage de patients qui sont diagnostiqués comme ne souffrant pas de maladie. TUBEX a montré une moyenne de 78 % pour la sensibilité et de 87 % pour la spécificité. Les études typhidot, regroupant les études Typhidot, Typhidot‐M, et TyphiRapid‐Tr02, ont montré une moyenne de 84 % pour la sensibilité et 79 % pour la spécificité. Lorsque les études Typhidot avec une notification claire des résultats indéterminés sont prises en compte, la moyenne de la sensibilité et de la spécificité de Typhidot était de 78 % et 77 %, respectivement. Test‐It typhoïde et prototypes (KIT) ont montré une moyenne de 69 % pour la sensibilité et 90 % pour la spécificité.
Sur la base de ces résultats, chez 1000 patients atteints de fièvre où 30 % (300 patients) ont de la fièvre entérique, nous pensions que les tests de Typhidot rapportant les résultats indéterminés ratent, en moyenne, le diagnostic (donnent un résultat faux négatif) chez 66 patients atteints de fièvre entérique, TUBEX en manquerait 66, et Test‐It typhoïde et prototypes (KIT) en manqueraient 93. Dans les 700 personnes sans fièvre entérique, le nombre de personnes qui ne sont pas correctement diagnostiquées pour la fièvre entérique (un résultat faux positif) serait en moyenne de 161 avec ces tests Typhidot, 91 avec TUBEX, et 70 avec le Test‐It typhoïde et prototypes (KIT). Ces différences dans le nombre de faux négatifs et de faux positifs chez les patients des différents tests ne sont pas statistiquement importantes. Les TDR évalués ne sont pas suffisamment précis pour remplacer les hémocultures comme tests diagnostiques de la fièvre entérique.
Authors' conclusions
Summary of findings
| Review question: to assess the diagnostic accuracy of rapid diagnostic tests (RDTs) for detecting enteric fever in persons living in endemic areas presenting to a healthcare facility with fever Patients/population: clinically‐suspected enteric fever patients or unselected febrile patients Role: first test for enteric fever in patients presenting to a healthcare facility with fever in endemic areas Index tests: all RDTs specifically designed to enteric fever cases applied to patient blood or urine samples Reference standards: bone marrow culture, peripheral blood culture, peripheral blood culture, and polymerase chain reaction (PCR) on blood Studies: prospective cohort, retrospective case control Setting: healthcare facility in enteric fever endemic areas | ||||||
| Index test | Effect (95% confidence interval (CI)) | Participants Total number, number with disease, (number of studies) | Test result | Number of results per 1000 participants tested 1 (95% CI) | ||
| Prevalence 1% | Prevalence 10% | Prevalence 30% | ||||
| Typhidot (all types) | Sensitivity 84 (73 to 91) Specificity 79 (70 to 87) | 6928, 982 (22) | TP FN FP TN | 8 (7 to 9) 2 (1 to 3) 208 (129 to 297) 782 (693 to 861) | 84 (73 to 91) 16 (9 to 27) 189 (117 to 270) 711 (630 to 783) | 252 (219 to 273) 48 (27 to 81) 147 (91 to 210) 553 (490 to 609) |
| Typhidot indeterminants reported or not applicable | Sensitivity 78 (65 to 87) Specificity 77 (66 to 86) | 5555, 662 (13) | TP FN FP TN | 8 (7 to 9) 2 (1 to 3) 228 (139 to 337) 762 (653 to 851) | 78 (65 to 87) 22 (13 to 35) 207 (126 to 306) 693 (594 to 774) | 234 (195 to 261) 66 (39 to 105) 161 (98 to 238) 539 (462 to 602) |
| Typhidot indeterminate results reported | Sensitivity 66 (59 to 73) Specificity 81 (58 to 93) | 1721, 339 (6) | TP FN FP TN | 7 (6 to 7) 3 (3 to 4) 188 (69 to 416) 802 (574 to 921) | 66 (59 to 73) 34 (27 to 41) 171 (63 to 378) 729 (522 to 837) | 198 (177 to 219) 102 (81 to 123 ) 133 (49 to 294) 567 (406 to 651) |
| TUBEX | Sensitivity 78 (71 to 85) Specificity 87 (82 to 91) | 4885, 627 (14) | TP FN FP TN | 8 (7 to 9) 2 (2 to 3) 129 (89 to 178) 861 (812 to 901) | 78 (71 to 85) 22 (15 to 29) 117 (81 to 162) 783 (738 to 819) | 234 (213 to 255) 66 (45 to 87) 91 (63 to 126) 609 (574 to 637) |
| Test‐it Typhoid and KIT prototypes (threshold > 1+) | Sensitivity 69 (59 to 78) Specificity 90 (78 to 93) | 2828, 682 (9) | TP FN FP TN | 7 (6 to 8) 3 (2 to 4) 99 (69 to 218) 891 (772 to 921) | 69 (59 to 78) 31 (22 to 41) 90 (63 to 198) 810 (702 to 837) | 207 (177 to 234) 93 (66 to 123) 70 (49 to 154) 630 (546 to 651) |
| Attributes of tests contributing to benefits and risks | ||||||
| Rapid diagnostic tests (RDTs)2 | RDTs are designed to provide test results typically in less than 1 hour, whereas currently used blood culture tests require 48 hours. The technical ability needed to conduct these rapid tests is designed to be lower than typical laboratory based tests, meaning they have the potential to be delivered nearer to the patient, further reducing time to diagnosis. However, some variants of the Typhidot test requires additional laboratory equipment, whereas the TUBEX and Test‐it Typhoid test do not. The TUBEX tests and some variants of Typhidot require cold chain storage. The Test‐it Typhoid test does not. In this Cochrane Review all included rapid tests were used on blood samples. None of the included studies conducted tests on urine samples. | |||||
| Overall certainty of evidence | ||||||
| Indeterminate results: for the Typhidot index test, there are concerns about studies which do not report indeterminate results (IgM negative and IgG positive). These results can frequently occur and if these results are not included in the analysis this biases study results to be overly‐optimistic. Case control studies: many of these studies use a case control design. This study design is at risk of overestimating both sensitivity and specificity. Reference standard: the highest grade of reference standard includes either bone marrow culture or PCR using blood, in addition to blood culture. However using bone marrow as a reference standard is invasive and more severe patients may be selected into these studies. Most included studies use only blood culture, and studies using more than 1 reference standard for example, PCR showed a reduction in RDT sensitivity by 20% to 25%. Precision: average estimates of both sensitivity and specificity have low precision, due to the heterogeneity between studies. Paired studies: there are few paired studies, where more than 1 test is used in the same patients. These studies provide the most direct evidence for comparing tests. Typhidot paired with TUBEX: Total 4245, 484 patients with disease. Typhidot paired with Test‐it Typhoid and KIT prototypes: no paired studies. Test‐it Typhoid and KIT prototypes paired with TUBEX: total 127, 64 patients with disease. It remains unclear if the tests were used in the same cohort of patients. | ||||||
| Abbreviations: False Negatives (FN); False Positives (FP); immunoglobulin‐G (IgG); immunoglobulin‐M (IgM); Royal Tropical Institute, Amsterdam (KIT); polymerase chain reaction (PCR); True Negatives (TN); True Positives (TP). 1We used 2 systematic reviews of bacteraemia in Asia and Africa to inform prevalences of 30% (Asia); 10% (Africa: adults and children) and 1% (Africa: children) (Reddy 2010; Deen 2012). | ||||||
Background
Target condition being diagnosed
Typhoid and paratyphoid (enteric) fever are diseases caused by Salmonella enterica serovar Typhi and Paratyphi A respectively. Typhoid, the more common infection, is an important infectious disease in low‐ and middle‐income countries (LMICs) with over 22 million new cases worldwide and an estimated 200,000 deaths annually (WHO 2003). South and South‐East Asia are the most affected areas of the world, with an estimated annual incidence in some areas of greater than 100 people per 100,000 population (Crump 2004). Enteric fever is common in areas with inadequate sanitation and hygiene, particularly regarding food, water, and disposal of human excrement, and only to this extent are these diseases tropical (Gill 2009). Despite advances in technology and public health strategies, enteric fever remains a major cause of morbidity in the developing world (Bhutta 2006). Urbanization, global warming, and traditional methods of waterside living have created even greater demands for clean water in developing countries (UNICEF 2006). We will use the term 'enteric fever' throughout this Cochrane Review to include both typhoid and paratyphoid fever, unless specified. The causative organisms are Gram‐negative bacilli that are transmitted by the faecal‐oral route when a person ingests food or water that is contaminated with infected human faeces. The most important reservoirs of infection are short‐term convalescents or chronic human carriers. Food handlers who are carriers are a particularly important source of transmission (Gill 2009; Andrews 2015).
The clinical presentation of enteric fever varies from a mild illness with a low‐grade fever, malaise, and slight dry cough to a severe clinical illness with multiple complications including intestinal perforation (Ismail 2006). Toxic apathy, blanching 'rose spots' on the trunk, abdominal organomegaly, and diarrhoea are also associated with enteric fever, but the clinical picture is highly variable between geographical location and age groups. Enteric fever can present in many different and non‐specific ways, thus posing a diagnostic challenge for the health professional. Enteric fever is usually diagnosed on clinical grounds and treated presumptively. The diagnosis may be delayed or missed, while other febrile illnesses are being considered (Parry 2002).
There is antimicrobial resistance to S. enterica serovar Typhi and Paratyphi A worldwide (Kariuki 2015). Health professionals in the tropics overprescribe antimicrobials for many reasons, including cultural factors and patient expectation (Okeke 2005). The purchase of drugs such as antimicrobials from untrained vendors and unlicensed pharmacists is commonplace in the developing world (Larsson 2008). A major challenge is the inability to confirm diagnoses in resource‐limited settings where traditional laboratory methods of diagnosing enteric fever are unavailable. Healthcare workers are therefore reliant on their clinical skills to make an educated guess of the cause of illness or to prescribe an antimicrobial that targets several bacteria, or both (Shetty 2008). This over treatment has contributed to increasing resistance to fluoroquinolones (for example, ciprofloxacin) and multiple drug resistance (resistance to chloramphenicol, ampicillin, and co‐trimoxazole) in S. enterica serovar Typhi and Paratyphi A in endemic Asian countries (Chuang 2009).
Index test(s)
Current enteric fever rapid diagnostic tests (RDTs) include a variety of different methods and formats. RDTs can be applied to blood or urine samples, with blood RDTs (using either venous or capillary samples, or both) most common. Test formats are based on lateral flow, flow‐through, agglutination, or solid phase methods (Pastoor 2008). RDTs may detect antigens (components of the causative Salmonella organism) or antibodies (markers of the person's immune response to the antigen). The type of antibody class or immunoglobulin detected could be either immunoglobulin‐M (IgM), which may be indicative of recent exposure, or immunoglobulin‐G (IgG), which can indicate recent or previous exposure. Examples of commercial RDTs for enteric fever that have been undergoing evaluation in recent years include Typhidot®, Typhidot‐M®, and TUBEXTM (Baker 2010; Thriemer 2013). Future RDTs are also likely to take a serological approach, although the identification of novel antigens that are free of cross‐reacting epitopes is a major challenge (Baker 2010).
Typhidot, TUBEX, and Test‐It Typhoid (KIT) RDTs
The three commercially available index tests that have most commonly been evaluated in published studies are: Typhidot (including Typhidot‐M, and TyphiRapid Tr‐02); TUBEX; and Test‐It Typhoid and its earlier prototypes developed by the Royal Tropical Institute (KIT), Amsterdam. The Typhidot test measures both IgM and IgG antibodies against a 50 kDa outer membrane protein (OMP) antigen in a miniaturized dot‐blot enzyme‐linked immunosorbent assay (ELISA) format. The test is considered positive if the IgM is positive, and indeterminate if the IgG is positive but IgM negative. The Typhidot‐M test measures IgM against the same 50 kDa antigen in the same dot‐blot format after removal of the total IgG. The TyphiRapid Tr‐02 test measures IgM antibodies against the 50 kD antigen in an immunochromatographic (ICT) format.
The TUBEX TF tests for antibodies against S. Typhi lipopolysaccharide (LPS) antigen by quantifying inhibition of binding between O9 monoclonal antibodies and LPS‐coupled magnetic particles. A visible decolourization of patient serum in the test reagent solution through magnetic particle separation indicates a positive result. Samples are graded as 0 to 10 according to the colour of the reaction mixture at the end of the procedure. Those with a grade greater than 2 are considered positive. Unlike the Typhidot test there has been a single version of the TUBEX test, although there may have been minor test modifications not made public by the manufacturer (Thriemer 2013).
The tests developed by KIT detect IgM antibodies against the S. Typhi LPS O9 antigen. The test has been applied in different formats as a prototype RDT using a dipstick and latex agglutination format, and an ICT lateral flow assay. The ICT lateral flow format is now commercially available as the Test‐it Typhoid test.
Other RDTs included
Enterocheck WB® detects S. Typhi‐specific antibodies to LPS antigen in an ICT lateral flow format. As the patient sample flows through the cassette, the antibody‐antigen complexes are immobilized by a coated membrane leading to the formation of a pink to pink‐purple coloured band. The absence of this coloured band in the test region indicates a negative test result (Anusha 2011; Anagha 2012).
SD Bioline similarly utilizes an ICT method to visually and qualitatively detect IgG and IgM antibodies to unspecified S. Typhi antigens which are indirectly labelled with colloidal gold (via an antibody). The immune complexes are captured by anti‐IgM or anti‐IgG antibodies immobilized on the test strip to give a qualitatively positive or negative result (Kawano 2007).
The Multi‐Test Dip‐S‐Tick is also a qualitative test, but in a dipstick format that detects IgG antibodies against S. Typhi O, H, and Vi antigens. It is part of a fever stick which tests for five other pathogens in addition to S. Typhi (Olsen 2004).
The PanBio test utilizes a direct ELISA format. Unspecified S. Typhi antigen‐coated microwell strips are incubated with a patient’s serum for 20 minutes. The absorbance readings at a wavelength of 450 nm are converted into 'PanBio units' with greater than 10 PanBio units considered positive, and less than 10 PanBio units as negative (Gopalakrishnan 2002).
With the Mega Salmonella test, patient antibodies bind to unspecified S. Typhi antigens insolubilized on microplates, and are quantitatively detected by ELISA with both an IgM and IgG‐specific peroxidase‐labelled reagent (Kawano 2007).
Clinical pathway
Prior test(s)
A RDT for enteric fever should be used in a patient who presents with fever who currently lives in, or has recently visited, an area of medium to high endemicity. It is likely that patients would not have received any prior testing. However, it is more likely that a patient may have been given a clinical diagnosis, or indeed empirical antimicrobial treatment, based on history and examination (Darton 2014). The setting could be primary, secondary, or even tertiary care, but more commonly in a setting that has limited diagnostic laboratory facilities. Unfortunately the clinical diagnosis of the disease is imprecise, so any patient with a fever from endemic regions should be subject to an enteric fever RDT, not just those with classical signs and symptoms of the target conditions (Parry 2011). In areas endemic for HIV, dengue, and malaria as well as enteric fever, patients may have had other point‐of‐care testing performed (Abba 2011).
Role of index test(s)
The definitive diagnosis of enteric fever requires confirmation with a laboratory test to distinguish it from other infections (such as dengue, malaria, rickettsial infections, leptospirosis, and melioidosis) that present with similar symptoms (Waddington 2014). The current recommendation is to use blood culture to diagnose enteric fever (WHO 2003). This test is specific, but lacks sensitivity and so will miss patients who actually have the disease (Mogasale 2016). A bone marrow culture, although more sensitive, is impractical for routine use (Wain 2001). Furthermore, bacterial culture requires a relatively sophisticated laboratory usually unavailable in areas where enteric fever is common (Parry 2011).
It is anticipated that in low‐resource settings endemic for enteric fever, a robust RDT could be utilized instead of blood or bone marrow cultures in a febrile patient, that is to replace the expensive reference standard test in daily clinical practice. A positive RDT result at the point‐of‐care would prompt treatment with appropriate antimicrobials. A negative result would prompt consideration of other illnesses as the cause of the patient’s fever (Parry 2011). Simple, accurate, and robust RDTs would be of considerable help to clinicians managing patients in areas where enteric fever is common (Baker 2010). In addition, an enteric fever RDT could be used as a triage tool to trigger further testing, such as blood culture, in settings where microbiological culture is less accessible. In secondary or tertiary care settings a positive RDT could warrant the collection of a peripheral blood culture prior to starting antimicrobial therapy (Parry 2011).
Alternative test(s)
Widal test
The Widal test (WT) is a serological test that detects agglutinating antibodies to LPS (O antigen) and flagella (H antigen). The WT is the principal alternative test and is widely used but is neither sensitive nor specific (Olopoenia 2000). In its original format the WT required both acute and convalescent‐phase serum samples taken approximately 10 days apart. The test has also been evaluated as a single, acute‐phase serum sample (Saha 1996). In people with enteric fever, titres often rise before the clinical onset, making it very difficult to demonstrate the diagnostic four‐fold rise between initial and subsequent samples (Gill 2009).
The role of the WT is controversial because the sensitivity, specificity, and predictive values vary considerably between geographical areas (Parry 2002). Test results need to be interpreted carefully in the light of previous history of enteric fever and vaccination. Interpretation of the result is also greatly helped by knowledge of the background levels of antibodies in the local healthy population (House 2001). The increasing use of enteric fever vaccines and the occurrence of infection with other Salmonella enterica serovars lower the specificity of the WT (Waddington 2014). Infection with non‐Salmonella organisms (for example, malaria, dengue, brucellosis) also leads to cross‐reactivity in the WT in enteric fever‐endemic regions (Olopoenia 2000). There is considerable variation in agglutinin levels among non‐infected populations. These levels are susceptible to change over time and depend on the degree of endemicity (Parry 2002). Despite these shortcomings of both sensitivity and specificity, because the WT is simple and inexpensive, it is still widely used as a diagnostic test (Fadeel 2004).
Nucleic acid amplification tests
Nucleic acid amplification tests (NAATs) for enteric fever diagnosis, such as polymerase chain reaction (PCR), and real‐time PCR are being explored. Theoretically, NAATs could amplify DNA from dead or unculturable bacteria, thus addressing the concern of poor culture positivity because of pre‐treatment with antimicrobials (Wain 2001). One study found that a novel three‐colour real‐time PCR technique had the same limitations in test sensitivity as culture and deemed it an unsuitable methodology for the routine diagnosis of enteric fever (Nga 2010). Methods that combine culture and PCR methods have been also been tested (Zhou 2010). The use of NAATs in developing countries will most likely be limited in the medium‐term because of high cost and the lack of laboratory infrastructure (Olsen 2004).
Metabolomics
A new group of diagnostic tests rely on the metabolites produced by the host in response to infection. Metabolites induced by specific infections could be measured in the blood and urine of affected patients (Baker 2010). By comparing the metabolite profiles from healthy patients to profiles of patients with typhoid and paratyphoid infections, thresholds could be determined to identify those with acute enteric fever (McKinnon 2014). Similar studies have used metabolomics to identify diagnostic markers of malaria and dengue fever (Andrews 2015). The use of metabolomic tests currently requires specialized laboratory infrastructure, so use of these tests in both developed and developing countries is likely to have very restricted applicability.
Rationale
RDTs have the potential to be useful to clinicians working in resource‐limited settings in LMICs. Differentiating the common causes of the febrile patient by clinical criteria is challenging without the laboratory support for blood films, serology, or blood cultures (Bhutta 2006). A diagnostic test in such a setting must be cheap, simple to perform, and able to quickly deliver a result. Such a test should correctly identify true enteric fever cases among febrile patients, ensuring prompt and specific treatment, allowing the avoidance of broad‐spectrum medication that cover all common causes of fever. In many endemic areas, treatment for enteric fever may be given to all patients with fever (Larsson 2008). The diagnosis of enteric fever by an RDT could reduce unnecessary prescription of antimicrobials, reduce drug expenditure, and limit the development of antimicrobial resistance (Andrews 2015). The role of an enteric fever RDT in practice is to identify those febrile patients who warrant anti‐Salmonella antibiotic treatment as opposed to conservative management, antimalarial treatment, or treatment for other bacterial infections (Parry 2011).
The reference standard for diagnosing enteric fever has been culture of S. Typhi or Paratyphi A from bone marrow, peripheral blood, or other sterile sites. The mainstay of diagnosis in clinical practice is a positive blood culture, although the test is only positive in 40% to 80% of cases, usually in the first two weeks of the disease (Parry 2002; WHO 2003). This lack of sensitivity is due to the low number of bacteria circulating in the blood, and may also be affected by: prior antimicrobial therapy (Wain 1998); the type of culture medium used; the ratio of blood to broth; stage of illness at the time of presentation; and the duration of incubation (Mogasale 2016). Bone marrow culture gives a higher culture‐positive rate, probably because the concentration of organisms is higher than in the blood, and may remain positive even after antibiotic therapy has been started (Wain 2001). Bone marrow culture is positive in 80% to 95% of patients with enteric fever, including in patients who have been taking antibiotics for several days regardless of the duration of the illness (Parry 2002). Although bone marrow culture is more sensitive, it is difficult to obtain, relatively invasive, and is of little use in public health settings (Wain 2001). Even with sophisticated laboratories, confirming the diagnosis of enteric fever can be difficult with negative blood or bone marrow cultures despite a patient actually having enteric fever (Baker 2010).
It is quite possible that RDTs are more sensitive than the current reference standards for enteric fever. If laboratory isolation of the causative organisms is neither cost‐effective nor reliable, then there is a potential role for RDTs to replace microbiological culture as the main diagnostic test (Parry 2011). If no single reference standard test exists, use of a composite reference standard (CRS) could improve estimation of diagnostic test accuracy (Storey 2015).
Objectives
To assess the diagnostic accuracy of commercially available rapid diagnostic tests (RDTs) and prototypes for detecting Salmonella Typhi or Paratyphi A infection in symptomatic persons living in endemic areas.
Secondary objectives
-
To identify which types and brands of commercial test best detect enteric fever.
-
To investigate the sources of heterogeneity between study results (see the 'Investigations of heterogeneity' section).
Methods
Criteria for considering studies for this review
Types of studies
We included the following types of studies.
-
Randomized controlled trials (RCTs) in which patients are randomized to one of several index tests and all receive a reference standard.
-
Paired comparative trials in which a series of patients receive two or more index tests and a reference standard.
-
Prospective cohort studies in which a series of patients from a given population are recruited and receive one or more index test and a reference standard.
-
Retrospective case control studies that compare a group of patients with laboratory‐confirmed enteric fever cases (positive reference standard) and a group of patients without enteric fever (negative reference standard). In case control design studies, we only extracted data relating to the index test(s) from control groups participants with fever, and not from healthy control participants without fever.
Participants
Patients living in enteric fever‐endemic areas attending a healthcare facility with fever were eligible. This may or may not have included patients with a clinical suspicion of enteric fever.
When only a subgroup of participants in a study was eligible for inclusion in the review, we included the study provided that we were able to extract relevant data specific to that subgroup. Subgroups included participants enrolled as separate groups, for example a clinical cohort subgroup without healthy control patient subgroup (Fadeel 2011).
Index tests
All rapid diagnostic tests (RDTs) specifically designed to detect enteric fever cases. We categorized the tests as follows.
-
RDTs that were applied to blood samples (venous or capillary) to detect antigens.
-
RDTs that were applied to blood samples (venous or capillary) to detect antibodies (IgG, IgM, or both).
-
RDTs that were applied to urine samples to detect antigens.
-
RDTs that were applied to urine samples to detect antibodies (IgG, IgM, or both).
We classified the RDTs further by format, for example, lateral flow, flow‐through, agglutination, or solid phase kits.
Studies may have compared one or more RDT against one or more reference standard.
Target conditions
-
Typhoid fever caused by Salmonella enterica serovar Typhi.
-
Paratyphoid fever caused by Salmonella enterica serovar Paratyphi A.
Reference standards
Studies were required to diagnose enteric fever using one of the following reference standards.
-
Bone marrow culture.
-
Peripheral blood culture, peripheral blood PCR, or both.
We defined a Grade 1 study as one that used both bone marrow culture and peripheral blood culture as the reference standard. In Grade 1 studies, we considered either bone marrow or peripheral blood culture positivity a positive reference standard.
We defined a Grade 2 study as one that used either peripheral blood culture only as the reference standard, or peripheral blood culture and peripheral blood PCR as the composite reference standard. In Grade 2 studies, we considered either blood culture or blood PCR positivity a positive composite reference standard.
As overall estimates of accuracy ignoring the use of different reference standards are difficult to interpret, we reported the results separately for each grade of reference standard (Reitsma 2009).
Search methods for identification of studies
We attempted to identify all relevant studies regardless of language or publication status (published, unpublished, in press, or ongoing).
Electronic searches
We searched the following databases using the search terms and strategy described in Appendix 1: the Cochrane Infectious Diseases Group Specialized Register (4 March 2016); MEDLINE (OVID, 1966 to 1 March 2016); Embase (OVID, 1974 to 4 March 2016); Science Citation Index‐expanded (Web of Science, 1900 to 4 March 2016), IndMED; African Index Medicus, and LILACS (1982 to 4 March 2016). We also searched ClinicalTrials.gov and the World Health Organization (WHO) International Clinical Trials Registry Platform (ICTRP) (www.who.int/trialsearch). for trials in progress, using "typhoid", "paratyphoid", "enteric fever", "rapid diagnostic test", "RDT", and "diagnostics" as search terms.
Searching other resources
We checked the reference lists of all studies identified by the above methods, and we manually searched World Health Organization (WHO) reports. In addition we manually searched papers from the 3rd (1997) to the 7th (2009) International Conferences on Typhoid Fever and other Salmonellosis. We contacted test manufacturers to identify ongoing or unpublished studies.
Data collection and analysis
Selection of studies
One review author (LW) screened the titles and abstracts of articles identified by the search strategy. We coded articles that did not fulfil the inclusion criteria as 'do not retrieve'. In the case of potentially eligible articles or if we were unclear whether the articles met the inclusion criteria or not, we coded these articles as 'retrieve'. We retrieved the full‐text texts of articles in the 'retrieve' category. Two review authors (LW and CMP) independently assessed the full‐text articles for inclusion and consulted a third review author (SM) in case of disagreement. We listed all studies excluded after full‐text assessments and their reasons for exclusion in the 'Characteristics of excluded studies' section. We presented the study selection process in a study flow diagram.
Data extraction and management
Two review authors (LW and CMP) independently extracted a standard set of data from each study article (see Appendix 2), using a pre‐piloted specifically designed data extraction form. A third review author (SM) cross checked the data extraction and resolved any discrepancies by discussion with the two review authors (LW and CMP). If information was missing or not clear, we contacted the study investigators.
We extracted the number of true positives, true negatives, false positives, and false negatives based only on the Salmonella enterica serovars the test was designed to detect (Typhi or Paratyphi A) as a 2 x 2 table for each study along with the corresponding threshold value. If data for multiple 2 x 2 tables were presented based on more than one threshold for a single study, we extracted each table and the threshold values. If this data (2 x 2 table) was also available for a subgroup of patients in the study, we extracted this data if the subgroup of patients was of interest (that is, grouped by patient age). For studies that we only included a subgroup of participants in the review, we only extracted this data and presented it for that particular subgroup. In case control design studies, we restricted negative controls to febrile participants, and we excluded healthy control participants from the 2 x 2 table data.
Where a study applied multiple index tests or reference standards, we extracted data for each test. Since blood culture, bone marrow culture, and blood PCR are imperfect reference standards, where possible we extracted the results of a composite reference standard (blood culture and bone marrow culture, or blood culture and blood PCR), such that we documented a negative result if bone marrow culture, blood culture, PCR, or all three, were negative (Reitsma 2009). We extracted the number of uninterpretable or invalid test results.
For Moore 2014 and Maude 2015, two review authors (LW and CMP) were the study authors, so one review author (SM) independently extracted data using individual participant data (from CMP) as we could not extract ideal data for review from the published articles. In Fadeel 2011, the article did not report results summarized across the cohort. For both Typhidot and TUBEX tests, for nested case control results within a cohort of patients, we back calculated 2 x 2 tables to reflect cohort composition (see the 'Strengths and weaknesses of the review' section).
Assessment of methodological quality
Two review authors (LW and CMP) independently assessed the quality of each individual study using a modified QUADAS‐2 tool (Whiting 2003; see Appendix 3). We answered each quality indicator on the checklist with a 'yes', 'no', or 'unclear' response for each study, and we provided the reason for our judgment.
Statistical analysis and data synthesis
We entered all 2 x 2 table data from all RDTs in included articles into Review Manager 5 (RevMan 5) (Review Manager 2014), which calculates sensitivity and specificity with 95% confidence intervals (CIs). We used forest plots and summary receiver operating characteristic (SROC) plots to present the variation in sensitivities and specificities between studies. In the description of studies we recorded the number of uninterpretable or invalid test results.
The statistical analysis focused on sensitivity and specificity at average operating points for the three main commercially‐available RDTs and their prototypes: TUBEX; Typhidot (including Typhidot‐M); and Test‐it Typhoid (and KIT prototypes). We included each test in a separate meta‐analysis. For other tests we identified fewer than four studies, so we did not complete any meta‐analysis summary. Where sufficient data were available, we performed meta‐analyses to estimate and compare the performance of the tests.
For Test‐It Typhoid and prototypes (KIT) studies, we performed a meta‐analysis for the threshold of > 1+ only as this was the manufacturer's recommendation. Data from the same study may contribute to different comparisons (for example, RDT versus blood culture; RDT versus bone marrow and blood culture), but we only combined one set of data from each study in an individual meta‐analysis.
For meta‐analysis we used the bivariate random‐effects models of sensitivity and specificity (Reitsma 2005; Chu 2006). We exported the data from RevMan 5 (Review Manager 2014) into STATA models fitted using xtmelogit with all three main test types included in a single model allowing for unequal variances between tests and allowing correlation of sensitivity and specificity for each test in the random effects. Within xtmelogit we calculated pairwise comparisons of the difference between sensitivity and difference in specificity with 95% CIs of the three tests. We also used xtmelogit for heterogeneity analyses to compare sensitivity and specificity for the subgroup of studies where the Typhidot test reported indeterminate test results or not. We entered meta‐analysis parameter estimates (bivariate model parameter estimates and confidence and prediction region parameters) into RevMan 5 (Review Manager 2014).
For PanBio Multi‐test Dip‐S‐Tick, Mega Salmonella, and SD Bioline tests, where the only included data is from comparisons of tests with fewer than four studies, we compared individual tests with results from Typhidot and TUBEX on the same participants as available. We based comparisons on conservative estimates from unpaired comparisons of proportions, as paired data were not available from articles. Where 95% CIs did not overlap between test estimates, we established statistical significance without formal testing. Where 95% CI overlapped, we reported the differences in unpaired proportions with 95% CIs for the differences.
Investigations of heterogeneity
As part of the Secondary objectives, we planned to investigate the sources of heterogeneity between study results, including the following.
-
Salmonella enterica serovars (Typhi or Paratyphi A).
-
Study design (see 'Types of studies').
-
Test population (patients with a clinically‐suspected infection of typhoid or paratyphoid, or unselected febrile patients).
-
Reference test (Grade 1 or Grade 2 ‐ see 'Reference standards').
-
Index test format (for example, lateral flow versus agglutination; IgM versus IgG versus IgM‐IgG combination).
-
Index test sample (blood versus urine participant sample).
-
Level of disease endemicity (for example, medium versus high) (Crump 2004).
-
Participant characteristics (for example, adults versus children).
-
Geographical location (by sub‐Saharan Africa versus the rest of the world).
The rationale for distinguishing sub‐Saharan Africa from the rest of the world was that non‐typhoidal Salmonellae (NTS) are an important cause of bacteraemia in sub‐Saharan Africa (Parry 2011), and may affect the performance of enteric fever RDTs in these settings.
Sensitivity analyses
There was insufficient data to carry out sensitivity analyses to assess the robustness of the meta‐analyses based on quality components.
Assessment of reporting bias
We did not attempt to assess reporting bias.
Results
Results of the search
We have summarized the study selection process in a PRISMA flow‐chart (Figure 1). We performed a literature search up to 4 March 2016 and identified a total of 2885 titles and abstracts. There were 2411 articles after we removed duplicates. We retrieved 95 full‐text articles for assessment. From the total number of 95 full‐text articles retrieved and assessed, we included a total of 37 studies for qualitative analysis in the Cochrane Review. We did not include two of the studies (Anagha 2012 and Anusha 2011) in the quantitative analysis as together they were not powered sufficiently for a meta‐analysis of the single index test (Enterocheck WB) they evaluated (Table 1; Figure 2). The number of included studies in the quantitative analysis after full‐text assessment was 35.

PRISMA flow diagram.

Summary receiver operating characteristic plot: Enterocheck WB, PanBio, SD Bioline, Mega Salmonella, Multi‐Test Dip‐S‐Tick.
| Index Test Name | Manufacturer | Methods | Formats | Biological specimen | Threshold for positivity values | Number of evaluations |
| TUBEX® TF | IDL Biotech, Bromma, Sweden | Inhibition Binding Magnetic Immunoassay. Detects IgM to S. Typhi O9 antigen. Semi‐quantitative colorimetric. | Mix buffer/reagent into plastic well with patient specimen. 3 minutes for result. | Whole blood, plasma, or serum | Semi‐quantitative colour change scale (0 to 10) provided by manufacturer. Positive if colour change scale ≥ 3. | 14 |
| Typhidot® | Malaysian Bio‐Diagnostics Research, Selangor, Malaysia | Dot‐enzyme immunoassay. Detects IgG and IgM to 50 kdA S. Typhi Outer Membrane Protein (OMP) antigen. | Mix serum/whole blood plus reagent incubating commercially‐prepared pre‐dotted antigen filter paper strips. 60 minutes for result. | Whole blood, plasma, or serum | Qualitative: either positive or negative. A positive result is a visible reaction (IgG or IgM) of an intensity equal to or greater than that of the control reaction on the commercially prepared filter paper. | 17 |
| Typhidot‐M® | Malaysian Bio‐Diagnostics Research, Selangor, Malaysia | Dot‐enzyme immunoassay. Detects IgM to 50 kdA S. Typhi OMP antigen. | Mix serum/whole blood plus reagent incubating commercially‐prepared pre‐dotted antigen filter paper strips. 60 minutes for result. | Whole blood, plasma, or serum | Qualitative: either positive or negative. Positive as per Typhidot. The absence of any visible spot indicated a negative test result. | 6 |
| TyphiRapid Tr‐02 (Typhidot) | Reszon Diagnostics International, Malaysia | Prototype of Typhidot. Immunochromatography | Mix serum/whole blood plus buffer/reagent into a well. | Whole blood, plasma, or serum | We were unable to get hold of the manufacturer and are awaiting a response from the study author | 1 |
| KIT ICT Test‐It TyphoidTM | LifeAssay Diagnostics, Cape Town, South Africa | Lateral flow immunochromatographic (ICT) assay. Detects IgM to S. Typhi lipopolysaccharide (LPS) antigen. Semi‐quantitative. | Mix serum/whole blood plus buffer/reagent into lateral flow cassette. Two‐site (test and control) immunoassay on a porous nitrocellulose membrane. 15 minutes for result. | Whole blood, plasma, or serum | Semi‐quantitative result line intensity scale (negative to +4) provided by manufacturer. A positive result is ≥ +1 | 3 |
| KIT Dipstick Assay | Royal Tropical Institute (KIT), Amsterdam | Detects IgM to S. Typhi LPS antigen. Simplified version of ELISA technique. | Strip of nitrocellulose membrane with immobilized antigen detection band. Serum plus reagent incubated on dipstick for 3 hours at room temperature. Dipsticks rinses with water and dried. >3 hours for result. | Serum | Semi‐quantitative result line intensity scale (negative to +4) provided by manufacturer. A positive result is ≥ +1 | 5 |
| KIT Dri‐Dot Assay (latex agglutination) | Royal Tropical Institute (KIT), Amsterdam | Detects IgM to S. Typhi LPS antigen. White agglutination card. | Dot of dried detection reagent conjugated to blue latex reagent. Antigen‐activated latex stabilized by drying a drop of latex reagent onto card suspended in serum. Card rotated by hand in near‐horizontal position to further induce agglutination. 30 seconds for result. | Serum | Qualitative: positive or negative. Positive when agglutination was observed within 30 seconds. Negative when no agglutination was observed. | 1 |
| SD Bioline Salmonella typhi IgG/IgM Fast | Standard Diagnostics Inc., Gyeonggi, Korea | ICT flow method. Detects IgM and IgG antibodies to unspecified S. Typhi antigens. | 4 drops of reagent mixed well with patient specimen. Nitrocellulose strip suspended into with 3 sites (IgM, IgG, and control). 30 minutes for result. | Serum, plasma, or whole blood | Qualitative: positive or negative. Positive if line appears in both control and 1 or both of IgM or IgG test zones. | 3 |
| Enterocheck WB® | Zephyr Biologicals, Goa, India | ICT Detects IgM antibodies to S. Typhi LPS antigen. | Two‐site (IgM test, and control) immunoassay cassette on a porous nitrocellulose membrane. 15 minutes for result. | Whole blood, plasma, or serum | Qualitative: positive or negative. Presence of a line in both the test and control zones indicates a positive result. | 2 |
| Enteroscreen ® | Zephyr Biologicals, Goa, India | ICT Detects IgM and IgG antibodies to S. Typhi LPS antigen. | Three‐site (IgG, IgM, and control) immunoassay cassette on a porous nitrocellulose membrane. 15 minutes for result. | Whole blood, plasma, or serum | Qualitative: positive or negative. Presence of a line in both the test (IgG, IgM, or both) and control zones indicates a positive result. | 1 |
| Multi‐test Dip‐S‐Tick | PanBio Inc., Columbia, Maryland, USA | Tests for five pathogens, including S. Typhi. Dipstick format that detects anti‐O, anti‐H,anti‐Vi, IgM, or IgG antibodies. | Detailed information not available | Heparinized whole blood, serum, or plasma | Detailed information not available | 1 |
| Mega Salmonella | Mega Diagnostics, Los Angeles, California, USA | Detect IgG and IgM antibodies to unspecified Salmonella antigens. Quantitatively detected by ELISA with peroxidase‐labelled reagents. | Results read in a microplate ELISA reader. | Whole blood, serum, or plasma | Detailed information not available | 1 |
| OnSite Typhoid IgG/IgM Combo | CTK Biotech Inc., San Diego, California, USA | Lateral flow immunoassay. Detects IgG and IgM antibodies against recombinant O and H S. Typhi antigens. | Three‐site (IgG, IgM, and control) immunoassay cassette on a porous nitrocellulose membrane. 15 minutes for result. | Whole blood, serum, or plasma | Qualitative: positive or negative. Presence of a line in both the test (IgG, IgM, or both) and control zones indicates a positive result. | 2 |
Abbreviations: immunochromatographic (ICT); immunoglobulin‐G (IgG); immunoglobulin‐M (IgM); Tropical Institute, Amsterdam (KIT); lipopolysaccharide (LPS); outer membrane protein (OMP).
Most included studies recruited participants from the Asia‐Pacific. The South Asian study locations included: India (10 studies); Bangladesh (five studies); and Pakistan (four studies). In South‐East Asia, the study locations included: Indonesia (five studies); Vietnam (two studies); Malaysia (one study); Cambodia (one study); Thailand (one study), and Papua New Guinea (one study). East Asian countries included China (one study) and the Philippines (one study). From Africa, two studies were from the north (Egypt), and five studies were from sub‐Saharan countries (Kenya, Tanzania, Zimbabwe, and South Africa) where non‐typhoidal Salmonellae (NTS) are also an important cause of bacteraemia. Six studies recruited patients from areas of medium enteric fever endemicity (Crump 2004). Most study participants were from areas considered highly endemic for enteric fever (Crump 2004).
Eighteen of the studies included both adults and children, and seven studies included children only. The age distribution of recruited patients was not clear in 14 of the included studies. Thirty‐three studies included participants attending a tertiary healthcare facility, 15 studies included secondary (district) healthcare attendees, and seven studies included primary healthcare attendees. Twenty studies recruited inpatients, 12 studies recruited outpatients, while 10 studies did not state the point of recruitment.
All of the RDTs evaluated were antibody tests on blood designed to detect S. Typhi infection. None of the included studies evaluated a RDT that detected S. Paratyphi A infection. All the RDTs evaluated used venous blood as the biological sample with one study additionally using capillary blood samples (Anusha 2011). There were no suitable studies that evaluated RDTs using other biological samples such as saliva or urine.
The included studies evaluated 13 index tests in total (Table 1). The most commonly evaluated RDTs were Typhidot and its variants (Typhidot; Typhidot‐M; TyphiRapid Tr‐02; Malaysian Biodiagnostic Research SDN BHD, Malaysia) in 22 studies, and TUBEX TF (IDL Biotech, Sollentuna, Sweden) in 14 studies. An index test created by the Royal Tropical Institute, Amsterdam (KIT), and now commercially available as the Test‐it‐Typhoid test (LifeAssay Diagnostics, South Africa) was evaluated in three different test formats in nine studies (dipstick assay; latex agglutination assay; lateral flow immunochromatographic test (ICT)). Other index tests evaluated included: Enterocheck WB (Zephyr Biomedicals, Tulip Group, Goa, India) in two studies; Enteroscreen (Zephyr Biomedicals, Tulip Group, Goa, India); SD Bioline (Standard Diagnostics, Kyonggi‐do, Korea); Mega Salmonella (Mega Diagnostics, Los Angeles,USA); Multi‐Test Dip‐S‐Tick (PANBIO INDX Inc., Baltimore, USA); and Onsite Typhoid IgG/IgM combo (CTK Biotech Inc., San Diego, California, USA) in one study each.
Methodological quality of included studies
We have summarized the methodological quality of the 37 included studies in Figure 3. We extracted this data using a modified QUADAS‐2 criteria proforma (Appendix 3) that focused on four domains of methodological quality: patient selection; index test; reference standard; and flow and timing. The domain with the highest level of risk for bias across all studies was that of patient selection (> 50%). We have summarized the risk of bias and the review authors' judgements about the applicability concerns of these domains for each included study in Figure 4.

Risk of bias and applicability concerns graph: review authors' judgements about each domain presented as percentages across included studies.

Risk of bias and applicability concerns summary: review authors' judgements about each domain for each included study.
Only 11 studies recruited unselected febrile patients. Most included studies selected patients on the basis of a clinical suspicion of enteric fever, although the criteria for suspecting enteric fever were usually not stated. Only three studies employed the Grade 1 reference standard, with blood and bone marrow culture (Bhutta 1999; Gasem 2002; Khan 2002). All studied used peripheral blood culture. Three studies also used blood PCR (Siba 2012; Moore 2014; Maude 2015). One study used stool culture, and another used the Widal Test in a composite reference standard (Gopalakrishnan 2002; Pastoor 2008). Only half of the included studies reported that the index test results were interpreted without knowledge of the reference standard results. Patients were recruited prospectively in 26 of the 37 included studies. Index tests were performed retrospectively on stored samples in 18 studies. Twenty‐three studies reported enrolling a consecutive or random group of patients (see the 'Characteristics of included studies' section). Sixteen studies used a case control design where diagnostic accuracy results can be overestimated, although all these studies reported results separately for control groups from febrile patients. Nineteen studies used cohort (not case control) designs, and in two studies the reporting was unclear.
Findings
Typhidot and its variants
Three variants of the Typhidot test were studied: Typhidot (17 studies); Typhidot‐M (six studies); and TyphiRapid Tr‐02 (one study).
For the Typhidot test, indeterminate results can be produced which are classified as both IgM test negative but IgG test positive (Olsen 2004; Naheed 2008). Some studies explicitly classified indeterminate results, where others did not clearly report indeterminate results (Siba 2012), or only presented the IgM data without the IgG data (Khan 2002). We attempted to separately extract the IgM and IgG positive data from each study and, where possible, used the IgM data only to allow comparison of results between all three types of Typhidot test by classifying the indeterminate results as negative (see the 'Differences between protocol and review' section).
The study results plotted in receiver operating characteristic (ROC) space are shown in Figure 5. The Typhidot variant studies did not perform consistently across studies. Figure 6 shows the forest plots of studies evaluating Typhidot RDTs by various test type, and by whether indeterminate results were reported or not. There is no obvious visually distinguishable trend in test performance with prevalence across non‐case control studies.
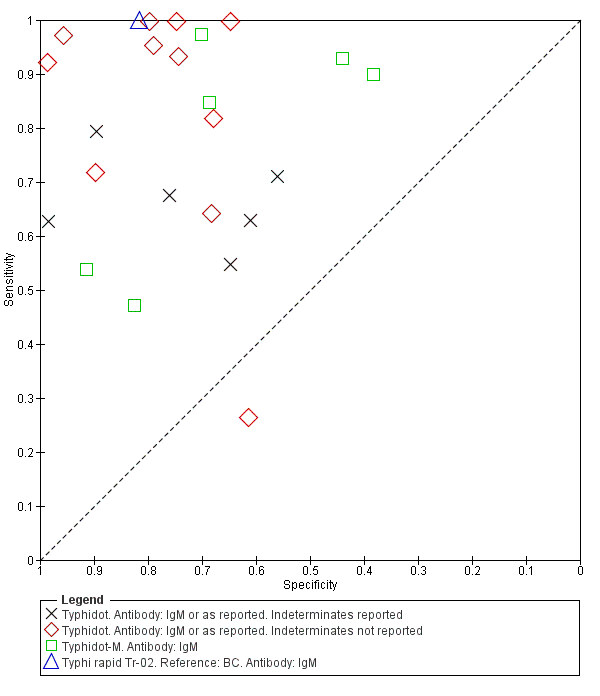
Summary ROC Typhidot all test types.

Forest plots for Typhidot all test types.
The included studies used three different grades of reference test: Grade 1 (peripheral blood culture or bone marrow culture, or both); Grade 2 (peripheral blood culture only); and Grade 2 (peripheral blood culture, nucleic acid amplification (blood PCR), or both). To determine the impact of the reference test on accuracy, we plotted the study results in ROC space according to the reference test used in Figure 7. In the study that used both blood culture alone, and blood culture combined with blood PCR on the same patients (Siba 2012), use of the composite reference standard of PCR and blood culture lowered test sensitivity results by about 25%.
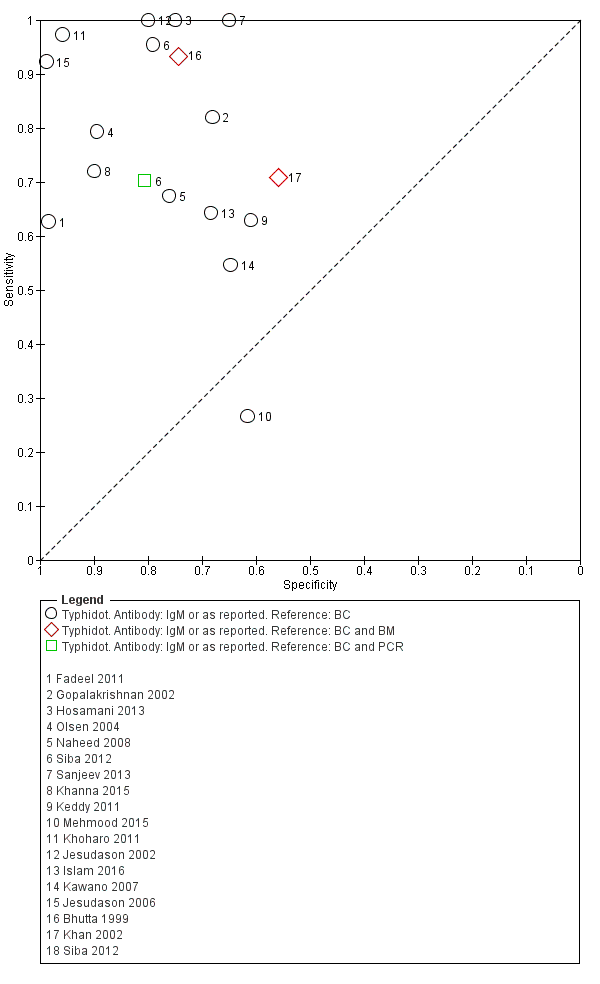
Summary receiver operating characteristic plot of tests: Typhidot and Typhidot‐M by reference test.
Abbreviations: BC: blood culture; BM: bone marrow; BC & PCR: blood culture and polymerase chain reaction.
The median sample size of all studies of Typhidot and its variants was 127 (range 50 to 1732). The earliest study was published in 1999, with the remainder being published in the 2000s. The latest study was published in 2016. Sensitivities ranged from 27% to 100%, and specificities ranged from 38% to 99% (Figure 6). The meta‐analytical average sensitivity and specificity for all three Typhidot test types were 84% (95% confidence interval (CI) 73% to 91%) and 79% (70% to 87%) respectively based on 22 studies (summary of findings Table). However, based on the 13 Typhidot studies where indeterminates were reported or were not produced by the test (Typhidot‐M and TyphiRapid Tr‐02) which have a lower risk of bias, the average sensitivity was 78% (95% CI 65% to 87%) and specificity was 77% (95% CI 66% to 86%). Comparing the 13 studies at lower risk of bias with the nine studies that did not report indeterminates, the difference in sensitivity was −9.8% (95% CI −26.1% to 6.4%) and specificity of −8.0% (95% CI −24.2% to 8.3%). Studies where indeterminates were not reported are at a higher risk of bias and have both higher average sensitivity and specificity, although neither difference is statistically significant.
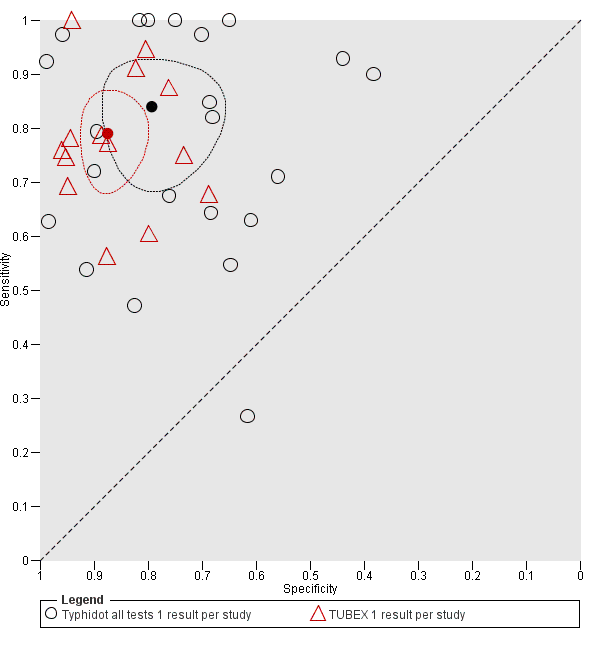
TUBEX
Fourteen studies evaluated TUBEX. We have presented the study results plotted in ROC space and as a forest plot in Figure 8 and Figure 9, which illustrate heterogeneity in test performance between studies. All included studies were Grade 2 (peripheral blood culture only as reference standard), with one study using both blood culture and blood PCR (Siba 2012). This heterogeneity is mirrored when the TUBEX test results are presented by those with and without a case control study design (Figure 10). One study used two different reference tests (Figure 11). As with the Typhidot studies, the composite reference standard of blood culture and PCR lowered sensitivity by around 25%.
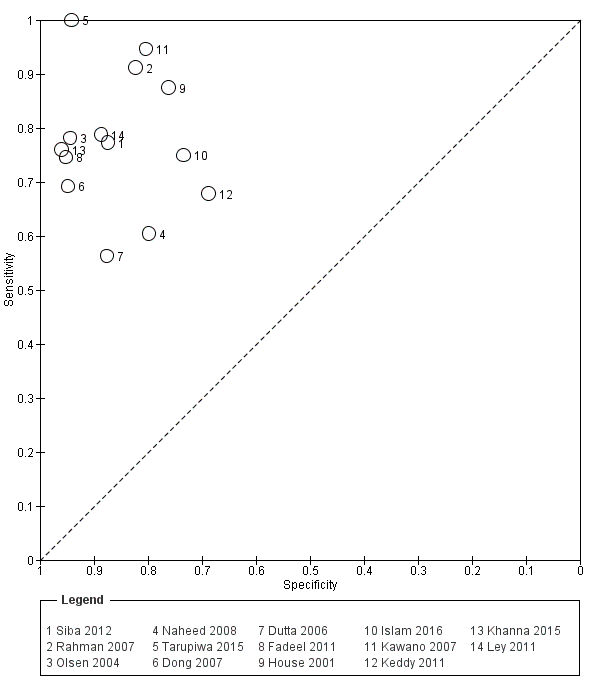
Summary receiver operating characteristic plot of test: TUBEX. Reference test: Blood culture. One result per study.

Forest plot of TUBEX. Reference test blood culture.

Summary receiver operating characteristic plot: TUBEX by case control design.
Abbreviation: BC: blood culture.

Summary receiver operating characteristic plot: TUBEX by reference test
Abbreviations: BC: blood culture; BC & PCR: blood culture and polymerase chain reaction.
The median sample size was 158 (range 73 to 1732). The earliest study was published in 2001, and the most recent study published in 2016. Sensitivities ranged from 56% to 100%, and specificities ranged from 69% to 96% (Figure 9). The meta‐analytical average sensitivity and specificity (95% CI) were 78% (71% to 85%) and 87% (82% to 91%) respectively (summary of findings Table).
Test‐It Typhoid and Royal Tropical Institute (KIT) prototypes
Nine studies evaluated the performance of the Test‐it Typhoid index test and its earlier KIT prototype formats: five as a dipstick assay; one as a latex agglutination test; and three as the ICT lateral flow assay. The KIT ICT lateral flow assay is now commercially available as Test‐It Typhoid (LifeAssay) and two studies evaluated this (Moore 2014; Maude 2015). In the dipstick and lateral flow assay formats, the test gives a semi‐quantitative result scored as 1+, 2+, 3+, or 4+ dependent on the intensity of the band on the test strip. The manufacturer's recommended threshold that is considered positive is 1+ or more. A few studies have additionally evaluated a threshold of 2+ or more.
All studies evaluating this test plotted in ROC space by different test types (1+ result classified as positive) are presented in Figure 12. Although the dipstick and ICT RDTs appear to perform better with higher average sensitivities, most studies adopted a case control design (Figure 13).
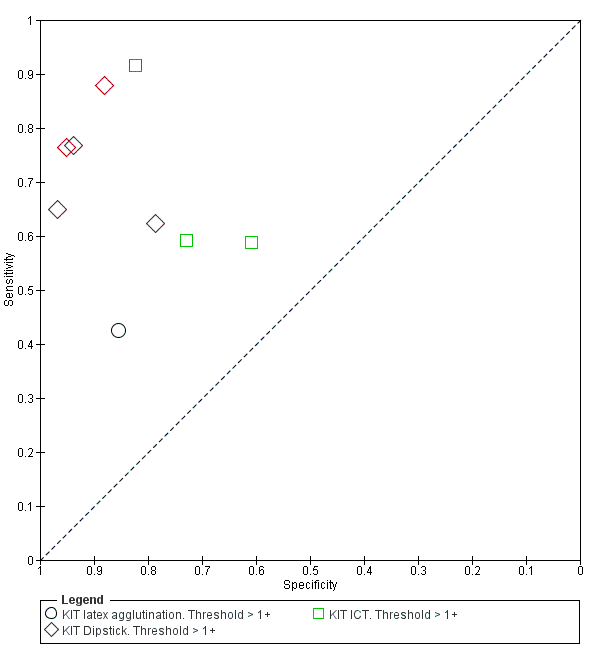
Summary receiver operating characteristic plot: KIT all test types. Threshold > 1+.

Forest plot of tests: KIT Threshold > 1+ by test type. Reference test: blood culture.
The results for both thresholds (1+ versus 2+ when we could extract these results from the same study) are illustrated in Figure 14. Increasing the threshold to greater or equal to 2 (≥ 2+) decreases the sensitivity of the index test but increases the specificity. One study suggested the diagnostic accuracy was improved by using a threshold of 2+ or more (Moore 2014).
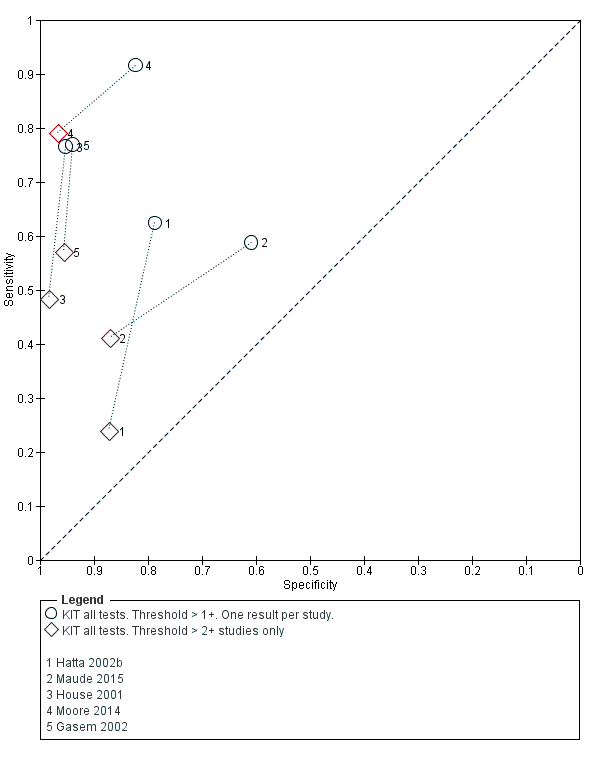
Summary receiver operating characteristic plot: KIT test by threshold > 1+ and > 2+.
Included studies evaluated these assays against different reference standards: Grade 2 (peripheral blood culture only); and Grade 2 (peripheral blood culture and blood PCR) (Moore 2014; Maude 2015). One study was a Grade 1 study (peripheral blood culture, or bone marrow culture, or both) although less than half (61/127) had a bone marrow culture performed, with the remainder using blood culture only as the reference standard (Gasem 2002). Figure 15 illustrates the performance of the ICT lateral flow assay by these different reference standards. Figure 16 present study results according to case control or non‐case control design.

Summary receiver operating characteristic plot: KIT ICT by reference test.
Abbreviations: BC: blood culture; BC & PCR: blood culture and polymerase chain reaction.

Summary receiver operating characteristic plot: KIT by case control (All test types. Threshold >1+).
Combining all different formats, the median sample size was 300 (range 85 to 502). Studies were published from 2001 to 2015. Sensitivities ranged from 42% to 92%, and specificities ranged from 61% to 97% (Figure 13). The meta‐analytical average sensitivity and specificity across all nine studies of KIT RDTs based on a threshold of > +1 was 69% (95% CI 59% to 78%) and 90% (95% CI 78% to 93%) respectively (summary of findings Table).
Comparisons between index tests
When comparing the three main tests (Typhidot, TUBEX, and Test‐it Typhoid (KIT ICT)) we used two different groups of comparator Typhidot test because of the risk of bias introduced when studies at risk of indeterminates do not report whether indeterminates were present or how they were treated in study results. Our primary analysis related to all Typhidot tests (based on 22 studies) with a sensitivity analysis based on restricting to the 13 Typhidot studies with lower risk of bias due to clear reporting of indeterminates.
Using all 37 studies including all 22 studies with Typhidot results to compare Typhidot, TUBEX, and Test‐It Typhoid (KIT) tests, TUBEX had a 10% higher average sensitivity than Test‐It Typhoid (KIT) (95% CI −1.6% to 21.7%) although this was not a statistically significant difference. The specificity was similar between tests with TUBEX having a slightly lower average specificity of 0.5% (95% CI −7.7% to 8.9%). This also was not a statistically significant difference.
Comparing Typhidot to Test‐It Typhoid (KIT), there was a statistically significant difference in average sensitivity when compared to all Typhidot tests (Typhidot higher sensitivity 15.0%, 95% CI 2.0% to 28.1%) but the difference in sensitivity was not statistically significant when Test‐It Typhoid was compared to Typhidot tests with a lower risk of bias, due to clear reporting of indeterminates (9.3%, 95% CI −5.2% to 23.7%). The differences in average specificity were not statistically significant for either comparison (22 Typhidot studies: lower Typhidot specificity of −7.6%, 95% CI −18.6% to 3.4%; 13 Typhidot studies: lower Typhidot specificity of −9.5%, 95% CI −21.5% to 2.4%).
Comparing Typhidot to TUBEX, Typhidot had a slightly higher average sensitivity when all studies were compared to TUBEX but this was not statistically significant (5.0%, 95% CI −6.1% to 16.1%). When TUBEX was compared to Typhidot tests with a lower risk of bias due to clear reporting of indeterminates, Typhidot had a slightly lower, but not significant, average sensitivity (−0.7%, 95% CI −13.6% to 12.0%). The average specificity was lower for Typhidot compared with TUBEX based on all studies (−8.2%, 95% CI −17.7% to 1.4%) and based on Typhidot studies with lower risk of bias due to clear reporting of indeterminates (−10.1%, 95% CI −20.6% to 0.5%). In neither case was the difference in specificity statistically significant.
Paired comparisons between index tests
Direct comparison of diagnostic tests in the same patients in the same study provides the highest level of evidence to compare tests (Rutter 2001; Takwoingi 2013).
Eleven studies compared different RDTs within the same study. There were 10 paired comparisons of Typhidot/Typhidot‐M and TUBEX (Figure 17), and one study compared TUBEX and Test‐It Typhoid (and KIT prototypes) (House 2001), although it is unclear whether or not these were on the same patients (Figure 18). There were no paired comparisons of Test‐It Typhoid (and KIT prototypes) and Typhidot tests. There was no statistically significant difference in either average sensitivity nor average specificity between Typhidot and TUBEX tests, with a lower sensitivity in Typhidot (−7.6%, 95% CI −19.8% to 4.6%) and a lower specificity in Typhidot (−3.7%, 95% CI −13.9% to 6.5%). This is supported by Figure 17, where no consistent direction is evident for differences between these tests.

Summary receiver operating characteristic plot: Typhidot versus TUBEX. Paired studies only. One result per index test per study.

Summary receiver operating characteristic: TUBEX versus KIT. Paired results. One result per index per study.
Other RDT evaluations
There were seven other commercial RDTs that were evaluated by only 1, 2, or 3 studies, and therefore we did include them in the meta‐analyses ('Methodological quality of included studies' section). We have presented the results of these individual studies and tests in the 'Data and analyses' section and Figure 2. Further research is needed before there is sufficient data to recommend these tests. From the current studies, the most promising tests are Enterocheck WB, Enteroscreen, and PanBio.
Enterocheck WB was not compared with any other index tests in the two included studies (Anusha 2011; Anagha 2012), so only lower quality indirect evidence is available to compare test performance to other tests (Figure 2). For both studies, both sensitivity and specificity were reasonably high (Anagha 2012: sensitivity 89%, 95% CI 67% to 99%; specificity 97%, 95% CI 89% to 100%; Anusha 2011: sensitivity 85%, 95% CI 73 to 94%; specificity 89%, 95% CI 85% to 92%).
Enteroscreen was only tested in one case control study (Prasad 2015), where it was compared to Typhdot in overlapping participants. In this single case control study, Enteroscreen had a significantly lower sensitivity (Typhidot higher sensitivity based on conservative estimate of unpaired proportions; difference in sensitivity 9%, 95% CI 3% to 16%) but a significantly higher specificity (Typhidot lower specificity; difference 17%, 95% CI 14% to 20%).
Gopalakrishnan 2002 tested both PanBio and Typhidot in the same study. While the sensitivity of the tests was similar (78% and 82% respectively), the specificity of PanBio was superior in this study (81% versus 68%; 13% difference in conservative unpaired proportions with 95% CI 0.6% to 25%. We noted that there was insufficient data for more appropriate paired comparison).
Multi‐test Dip‐S‐Tick was tested in the same study participants as TUBEX and Typhidot (Olsen 2004). There was no significant difference in sensitivity between the tests, but a clinically and statistically inferior specificity in Multi‐test‐Dip‐S‐Tick (specificity: 50%, 95% CI 26% to 74%) compared in the same participants with both TUBEX (TUBEX higher specificity; difference in specificity of 44%, 95% CI 19% to 69%) and Typhidot (Typhidot higher specificity; difference in specificity of 39% (95% CI 12% to 66%).
A single study compared Mega Salmonella to Typhidot, TUBEX, and SD Bioline using the same participants (Kawano 2007). Mega Salmonella had superior sensitivity to Typhidot and SD Bioline but significantly lower specificity (the 95% CI for specificity did not overlap with those from TUBEX or SD Bioline). In this study TUBEX has similar sensitivity to Mega Salmonella (95% and 91% respectively) and significantly higher specificity (80%, 95% CI 71 to 88) versus 49% (95% CI 39 to 59) respectively). Mega Salmonella had an inferior performance to TUBEX, SD Bioline, and Typhidot, although this was only based on evidence from one included study.
Three included studies evaluated SD Bioline (Kawano 2007; Limpitikul 2014; Maude 2015), and all three studies reported the preferred IgM test format. In Kawano 2007, SD Bioline IgM had an inferior performance to TUBEX when tested on the same participants. SD Bioline had significantly lower sensitivity to TUBEX (51% (95% CI 58% to 72%) versus 95% (95% CI 87% to 99%) respectively) and similar specificity (76% versus 80% respectively). In Maude 2015, SD Bioline IgM had significantly lower sensitivity at 21% (95% CI 9% to 38%) compared to both Test‐It Typhoid (Life Assay) and Onsite Typhoid (CTK Biotech), both with a reported sensitivity of 59% (95% CI 41% to 75%), indicated as the 95% CIs did not overlap.
Two included studies assessed Onsite Typhoid (CTK Biotech). In Maude 2015, it was compared with both Test‐It Typhoid (Life Assay) and the SD Bioline test. Onesite Typhoid had similar results to the Test‐It Typhoid test, which were superior in sensitivity to SD Bioline. However, SD Bioline had significantly higher specificity (97%, 95% CI 95% to 99%) than both Test‐It Typhoid test (61%, 95% CI 55% to 67%) and Onsite Typhoid (74%, 95% CI 68% to 79%). Tarupiwa 2015 evaluated Onsite Typhoid alongside TUBEX, where the performances of both tests were closely comparable. We note that these results are based on two studies and further research is needed.
Heterogeneity
There were insufficient studies for formal heterogeneity analysis using meta‐analysis of test subgroups, except for a comparison of Typhidot test studies at lower risk of bias due to clear reporting of indeterminate results. For other potential sources of heterogeneity ('Investigations of heterogeneity' and 'Secondary objectives' sections) where individual study characteristics could be investigated, such as study design, prevalence, and study reference standard, we presented results for visual examination of heterogeneity in summary ROC (SROC) plots and forest plots.
Discussion
The principal findings of this systematic review were that the diagnostic accuracy of the three main groups of commercially available rapid diagnostic tests (RDTs) for enteric fever (Typhidot and its variants, TUBEX, Test‐It Typhoid and prototype (KIT) tests) was moderate. There was no statistically significant difference in the average sensitivity between Typhidot, TUBEX, or Test‐It Typhoid tests, except when we compared all Typhidot tests to Test‐It Typhoid (84% all Typhidot studies, 78% Typhidot studies with low risk of bias due to clear reporting of indeterminates, 78% TUBEX, 69% Test‐It Typhoid). There was no statistically significant difference for average specificity between these tests (79% all Typhidot studies, 77% Typhidot with low risk of bias due to clear reporting of indeterminates, 87% TUBEX, 90% Test‐It Typhoid); see 'Summary of findings' table 1 (summary of findings Table).
A clinically useful test requires high values for both sensitivity and specificity. There was no statistical evidence to demonstrate that one group of tests was significantly better than the other (Figure 17; Figure 18; Figure 19; Figure 20; Figure 21). The quality of studies that evaluated the diagnostic accuracy of RDTs for enteric fever was generally low. Only three of the 37 included studies used the Grade 1 reference standard requiring a bone marrow and blood culture result, and less than one‐third of studies recruited unselected febrile patients.
Summary receiver operating characteristic plot: Typhidot versus TUBEX tests. One result per index test per study.

Summary receiver operating characteristic plot: TUBEX versus Test‐it Typhoid (KIT) tests. One result per index test per study.

Summary receiver operating characteristic: Typhidot versus KIT. No paired studies. One result per index per study.
In a hypothetical cohort of 1000 patients presenting with fever where 30% (300 patients) have enteric fever: on average, and based on all the test results, Typhidot will miss the diagnosis in 48 of the 300 patients with enteric fever (66 missed based on Typhidot studies with low risk of bias due to clear reporting of indeterminates); TUBEX will miss 66; and Test‐It Typhoid and prototype (KIT) tests will miss 93. In the 700 people without enteric fever the average number of patients with a false positive diagnosis of enteric fever would be 147 with Typhidot tests, (161 in Typhidot tests with low risk of bias due to clear reporting of indeterminates), 91 with TUBEX, and 70 with Test‐It Typhoid and prototype (KIT) tests. The target product profile of an enteric fever RDT has not been defined. A sensitivity of > 90% and specificity of > 95% are probably minimum targets. In our hypothetical cohort of patients a test with our minimum target product profile would miss on average 30 of 300 enteric fever patients and give a false positive diagnosis in 35 of 700 without enteric fever.
RDTs for other febrile illnesses, such as malaria and dengue, already have been tested extensively in standardized evaluations that have provided an evidence base for World Health Organization (WHO) guidance and for the diagnostic algorithms used in endemic regions (WHO 2009; Abba 2011). The diagnostic tests for acute enteric fever have not been evaluated with the same rigorous methods. A diagnostic test to detect chronic (asymptomatic) carriers and individuals who have had prior exposure to the causative pathogens may also be of considerable epidemiological value. Such tests could potentially strengthen surveillance programmes aimed at identifying populations with a high‐burden of enteric fever that might benefit from vaccination initiatives (Andrews 2015). The lack of such diagnostics obscures the true burden and impact of the disease; crucial information needed for policymakers, Ministries of Health, and others (Baker 2010; Crump 2014).
It is important to highlight the heterogeneity among the included studies. Patient selection (unselected febrile patients versus those suspected to have enteric fever) is a major source of heterogeneity. The variation in how indeterminate results in evaluations of Typhidot (IgG positivity, IgM positivity, or both) were treated and reported was also considerable (see the 'Strengths and weaknesses of the review' section). Most included studies took place in tertiary centres in South‐Asian settings highly endemic for enteric fever. There were also studies set in medium‐endemic regions but relatively few in sub‐Saharan Africa (Crump 2004).
Thriemer review
Thriemer and colleagues published a systematic review of TUBEX and Typhidot for the diagnosis of acute enteric fever (Thriemer 2013). They reported a meta‐analysis average sensitivity and specificity of TUBEX of 69% (95% CI 45% to 85%) and 88% (95% CI 83% to 91%) respectively. The Thriemer review authors also reported Typhidot sensitivity and specificity estimates of between 56% and 84% and 31 and 97% respectively (Thriemer 2013). They did not perform a meta‐analysis for Typhidot due to the limited data available. These results are comparable to the findings of this Cochrane Review: TUBEX sensitivity of between 71% to 85% and specificity 82% to 91%; Typhidot sensitivity 73% to 91% and specificity 70% to 87% (summary of findings Table). There are however a number of methodological differences between the two reviews.
Thriemer 2013 only included studies that used a commercial blood culture system with automated detection of positive cultures, and excluded studies using an 'in‐house' blood culture system with manual detection of positive cultures. The number of studies of these tests using commercial blood culture systems was limited, which meant a meta‐analysis was not possible. Commercial blood culture systems ensure that the reference test has been performed in a consistent and quality assured manner. If the 'in‐house' blood culture system employs accepted media formulations and is subjected to appropriate quality control testing, it should be as sensitive as commercial systems (Wilson 1994). The major difference between the commercial automated and 'in‐house' manual blood culture systems relates to the speed of result, with the automated systems detecting bacterial growth earlier.
Thriemer 2013 did not include test accuracy data for the Typhidot‐M test. The Thriemer review authors explored various classifications of how to treat the indeterminate results when describing the statistical approach to analysing the Typhidot test data. In our Cochrane Review we have included studies that looked at Typhidot‐M and classified indeterminate results as negative. To allow a clearer comparison between the Typhidot and Typhidot‐M test results, we extracted the IgM antibody data from the Typhidot studies when given in the report.
The Thriemer review only included commercially available RDTs at the time of the literature search. We included the Test‐it Typhoid ICT lateral flow assay (LifeAssay Diagnostics), which is now commercially available. This test was developed from several prototype RDTs by the Royal Tropical Institute (KIT) in Amsterdam. The Test‐it Typhoid test and the KIT protypes all measure IgM antibodies against an lipopolysaccharide (LPS) antigen in various formats. In this review we have evaluated both the KIT prototypes and the commercial RDT.
Reference standard
The evaluation of RDTs in enteric fever is complicated by the lack of a suitable reference standard (Baker 2010). The quality of the reference standard used in these studies affects the diagnostic accuracy results of each RDT. Combinations of peripheral blood culture, bone marrow culture, and blood PCR positivity have been used to indicate a true positive result (enteric fever case). If these reference tests are negative then we have described these as a non‐enteric fever case. Blood culture lacks sensitivity (WHO 2003; Mogasale 2016), so it is likely some of the culture‐negative patients will actually have enteric fever. It must be acknowledged that culture‐negative patients with a positive RDT result may actually be true positives rather than false positives. Most Grade 2 studies used blood culture only as the reference standard (Figure 7; Figure 11). The stronger studies were those where index tests were evaluated against more than one different reference test (Siba 2012; Moore 2014). Studies with more robust reference standards demonstrated reduced RDT sensitivity. The Grade 1 studies using bone marrow culture were conducted in higher prevalence populations (Khan 2002: 54%; Bhutta 1999: 47%), and perhaps in those with more severe disease. This correlates with the reduced index test performance in other high prevalence studies (Olsen 2004: 75%). In the TUBEX (Figure 7) and Typhidot (Figure 11) studies, there seem to be a common 20% to 25% reduction in sensitivity when the blood polymerase chain reaction (PCR) result was combined with blood culture as a composite reference standard. PCR has the potential ability to increase the number of typhoid cases identified by detecting dead bacteria or bacteria that cannot be cultured (Massi 2005; Nga 2010). It appears that these patients are less likely to be antibody positive in the RDTs, which explains the decrease in sensitivity when a PCR reference test is used.
Study design
The identification of studies that use or avoid a case control design formed part of the assessment of methodological quality (Whiting 2003). Case control designs can introduce bias and increase apparent accuracy as more severe disease is often compared to healthy patients. Studies that avoid a case control design by recruiting a cohort of unselected febrile patients have a lower risk of bias relating to patient selection. Over a third (16) of the 37 studies used a case control study design. Figure 22, Figure 10, and Figure 16 are receiver operating characteristic (ROC) plots for Typhidot, TUBEX, and Test‐It Typhoid and KIT prototypes respectively. Each study is plotted indicating whether they adopted or avoided a case control design. Across all three index test groups, case control studies had higher apparent accuracy, with results having a higher combination of sensitivity and specificity. This highlights the importance of robust study designs in the evaluation of diagnostic test accuracy.
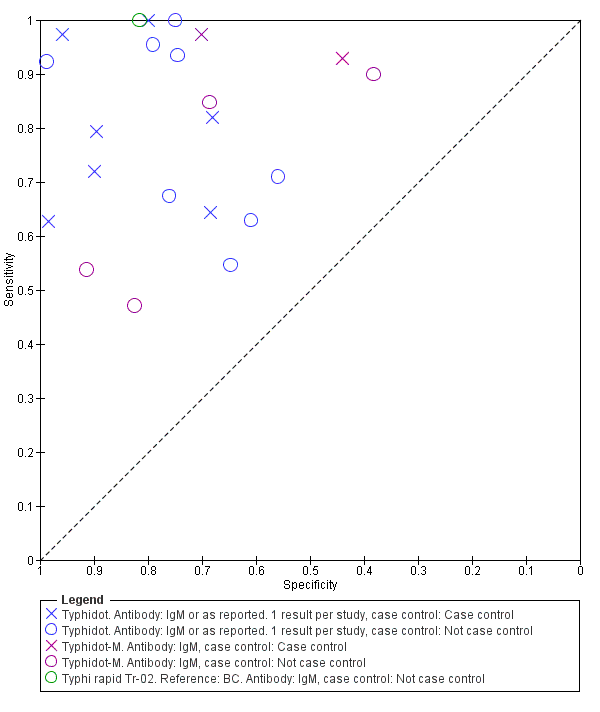
Summary receiver operating characteristic plot: Typhidot tests by case control design.
Only 11 of the 37 included studies recruited unselected febrile patients. Most of the other studies used a clinical suspicion of enteric fever as the major entry criteria, but rarely specified the precise clinical criteria used to suspect the disease. The choice of the optimum non‐disease control group is also difficult. Unselected febrile patients with another confirmed diagnosis are the optimum control group, but difficult to recruit. Thriemer 2013 also discussed this control group issue (Type 1 control). Patients with suspected enteric fever or non‐specific fever but who are blood culture negative are less satisfactory as a non‐disease control group (Type 2 control) and will decrease the apparent specificity of the test (Thriemer 2013). Cases in this group may actually have enteric fever despite testing negative on both index and reference tests. In addition to this, studies that analysed index tests in healthy afebrile controls are likely to have overestimated specificity.
Comparisons between tests
Comparisons of diagnostic tests are typically based on a combination of both direct comparisons where the tests are compared in the same patients, and indirect comparisons, where the tests being compared are conducted on different patients. Direct comparisons are at lower risk of bias as when the same patients at the same time point are tested as patients are tested with the same disease severity and comorbidities, and other features of study design that may give rise to potential for bias are also the same.
We compared Typhidot, TUBEX, and Test‐It Typhoid based on a combination of direct and indirect test comparisons. We did not detect any statistically significant difference between these tests when the comparisons were based on Typhidot tests at lower risk of bias due to clear reporting of indeterminates.
There were 11 studies with direct comparisons of different RDTs within the same study (Figure 17; Figure 18). TUBEX and Typhidot/Typhidot‐M were the most common comparisons. There was no statistical difference detected and no consistent direction of difference found between these two groups of index tests (Typhidot and variants versus TUBEX).
Summary of main results
We have summarized the main quantitative diagnostic test accuracy results in 'Summary of findings' table 1 (summary of findings Table).
-
The number of high quality studies that evaluated the diagnostic accuracy of RDTs for enteric fever was low, as many studies adopted a case control study design.
-
Only 3/37 included studies used the Grade 1 reference standard of bone marrow culture.
-
Less than one‐third of the included studies (11/37) recruited unselected febrile patients. Most used a clinical suspicion of enteric fever as the major inclusion criterion.
-
Most included studies (86%) recruited patients from the Asia‐Pacific region, and 50% of studies recruited from South Asia.
-
The three main groups of RDTs for enteric fever evaluated were: Typhidot and its variants; TUBEX; and the Test‐it Typhoid test with its earlier dipstick/latex agglutination/lateral flow assays prototypes developed by the Royal Tropical Institute (KIT), Amsterdam.
-
The diagnostic accuracy for enteric fever of the three main RDT groups was moderate. TUBEX performed the most consistently with moderate average sensitivity (78%) and better specificity (87%), but when compared to Typhidot there was no evidence to suggest that one was better than the other.
-
The Test‐it Typhoid tests and KIT protypes demonstrated moderate sensitivity, but higher levels of specificity (average 90%).
-
For Enterocheck WB, Enteroscreen, PanBio Multi‐test Dip‐S‐Tick, Mega Salmonella, SD Bioline,and Onsite Typhoid, there is insufficient evidence to recommend these tests, as there are only results from 1, 2, or 3 included studies. Several of these RDTs had inferior performance to either Typhidot or TUBEX, based on comparison of sensitivity in the same participants in single studies.
-
We did not find any statistically significant differences in sensitivity or specificity between Typhidot tests evaluated with low risk of bias due to clear reporting of indeterminates and the TUBEX and Test‐It Typhoid tests, based on combined data from both direct and indirect test comparisons (comparisons of test on either the same patients or different patients).
-
Analysis of direct paired (comparative) data was possible across 10 studies comparing Typhidot and TUBEX, but we did not find any statistically significant difference between the two tests. It is not possible to state that one group of index tests has higher accuracy than another. Within individual studies data was available to compare other commercial tests, and further studies are needed to substantiate findings from single studies.
-
There was insufficient data to formally investigate sources of heterogeneity as listed in the 'Secondary objectives' and 'Investigations of heterogeneity' sections.
-
There were no eligible studies that evaluated RDTs exclusively for detecting paratyphoid disease.
Strengths and weaknesses of the review
A major problem with most included studies was the use of a relatively weak reference standard. Blood culture has an estimated sensitivity of between 40% to 80% (WHO 2003), with a more recent systematic review estimating sensitivity to be around 60% (Mogasale 2016). Only three studies used the best reference standard currently available (blood culture and bone marrow culture). Bone marrow culture is estimated to increase the number of true positives by an additional 10% over blood culture alone (WHO 2003; Mogasale 2016). The additional benefit of a blood PCR result is undefined, and the testing methodology has not yet been standardized (Smits 2013). A weak reference standard means that a number of true positive results were classified as false negatives (Reitsma 2009). There was a great variation in the reporting of the accreditation and quality of microbiology laboratories where the cultures were processed.
Statistical analysis of Typhidot and its variants was complicated, given the evolution of the product target from measuring both IgM and IgG antibodies to just IgM alone. This was compounded by the inadequate clarity of the reported results. Many of the included studies were not well reported, and did not perform well under the scrutiny of the modified QUADAS‐2 tool. The data for a number of studies was incomplete, and could not be clarified despite contacting corresponding authors. Only a few studies reported blinding of the index and reference tests.
A weakness of the review related to the classification and subsequent analysis of indeterminate results for Typhidot tests. When we could extract both IgG and IgM data for Typhidot, we classified a case that was IgG positive and IgM negative as indeterminate. This differed from the treatment of indeterminate results of some included studies (Fadeel 2011; Olsen 2004).
Thriemer 2013 described the differences in sensitivity and specificity from one study (Kawano 2007) in three different ways: when indeterminate results were excluded; when indeterminate results were considered negative; and when indeterminate results were included in the denominator. In our Cochrane Review, this is illustrated in Figure 5 and Figure 6. These demonstrate a roughly 20% decrease in sensitivity when we included indeterminate results in the analysis. It is important to acknowledge variation in the classification of indeterminate results as a limitation in the analysis of results for Typhidot.
Data extraction from certain case control studies, Fadeel 2011, required careful recalculation where different categories of negative patients were described, for example, blood culture negative and Widal Test positive, versus known negatives. Index tests were then tested against different sub‐groups within the cohort. This change in sampling meant that the prevalence of disease changed depending on which subgroup the index test was used in.
This review covers both typhoid and paratyphoid fever, but there were no suitable studies related to paratyphoid alone. Another weakness of this review was the variability in the treatment of paratyphoid cases as part of the diagnostic test accuracy data between studies. In one study, authors excluded cases of blood culture positive Salmonella Paratyphi A (Jesudason 2006). A number of studies classified blood culture positive cases of paratyphoid as true negatives (Gasem 2002; Dutta 2006; Hosamani 2013; Sanjeev 2013). In contrast, paratyphoid fever was classified as a target condition along with typhoid fever in two studies (Dong 2007; Prasad 2015).
Applicability of findings to the review question
A low number of studies have evaluated the diagnostic test accuracy of enteric fever RDTs. Furthermore, the number of good quality studies was low. The main issues relating to quality include: utility of a second‐class reference standard; recruitment of clinically suspected enteric fever patients as opposed to unselected febrile patients; poor reporting of whether investigators were blinded to reference test results when interpreting the index tests; and frequent use of a case control design. The sensitivity and specificity of TUBEX, Typhidot and its variants, and Test‐it Typhoid test and its KIT protypes are not robust enough to replace existing diagnostic tools in enteric fever.
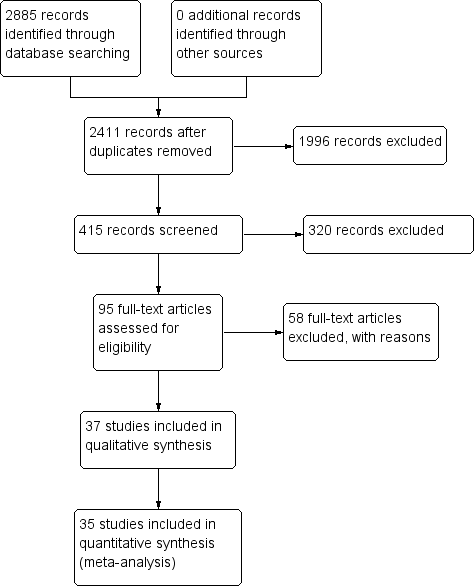
PRISMA flow diagram.

Summary receiver operating characteristic plot: Enterocheck WB, PanBio, SD Bioline, Mega Salmonella, Multi‐Test Dip‐S‐Tick.

Risk of bias and applicability concerns graph: review authors' judgements about each domain presented as percentages across included studies.

Risk of bias and applicability concerns summary: review authors' judgements about each domain for each included study.

Summary ROC Typhidot all test types.
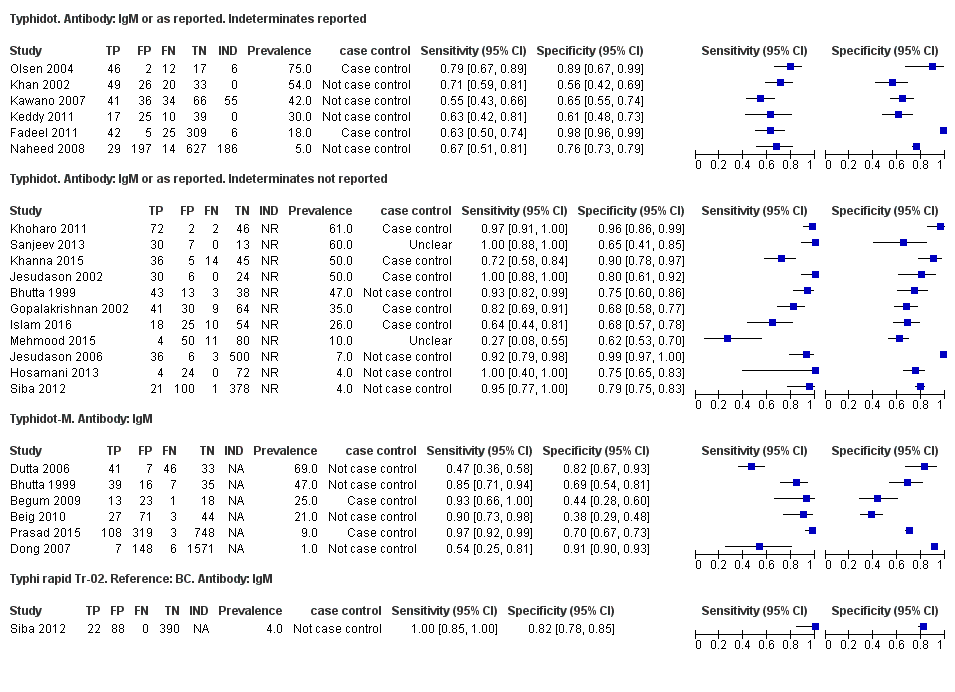
Forest plots for Typhidot all test types.

Summary receiver operating characteristic plot of tests: Typhidot and Typhidot‐M by reference test.
Abbreviations: BC: blood culture; BM: bone marrow; BC & PCR: blood culture and polymerase chain reaction.

Summary receiver operating characteristic plot of test: TUBEX. Reference test: Blood culture. One result per study.

Forest plot of TUBEX. Reference test blood culture.

Summary receiver operating characteristic plot: TUBEX by case control design.
Abbreviation: BC: blood culture.

Summary receiver operating characteristic plot: TUBEX by reference test
Abbreviations: BC: blood culture; BC & PCR: blood culture and polymerase chain reaction.

Summary receiver operating characteristic plot: KIT all test types. Threshold > 1+.
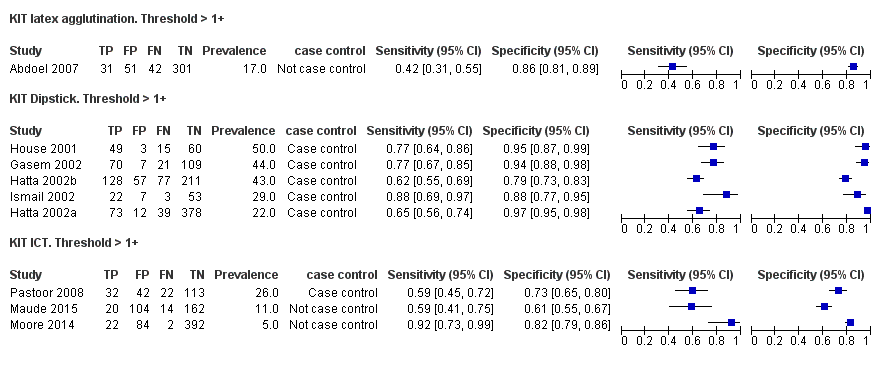
Forest plot of tests: KIT Threshold > 1+ by test type. Reference test: blood culture.

Summary receiver operating characteristic plot: KIT test by threshold > 1+ and > 2+.

Summary receiver operating characteristic plot: KIT ICT by reference test.
Abbreviations: BC: blood culture; BC & PCR: blood culture and polymerase chain reaction.
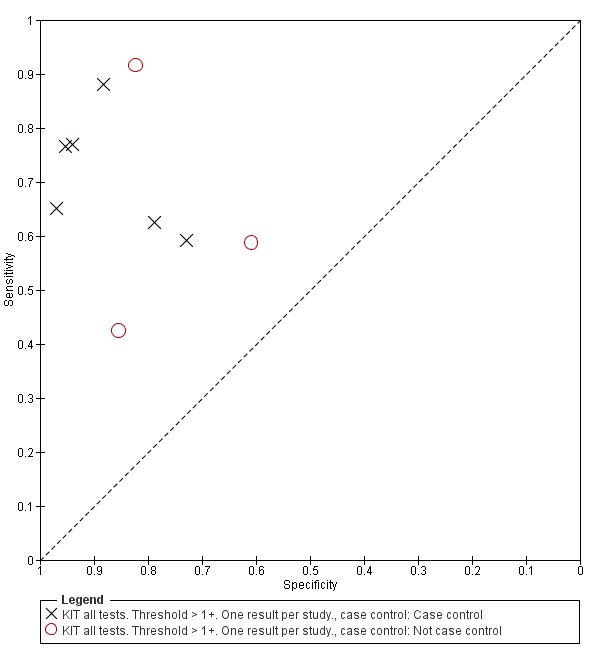
Summary receiver operating characteristic plot: KIT by case control (All test types. Threshold >1+).
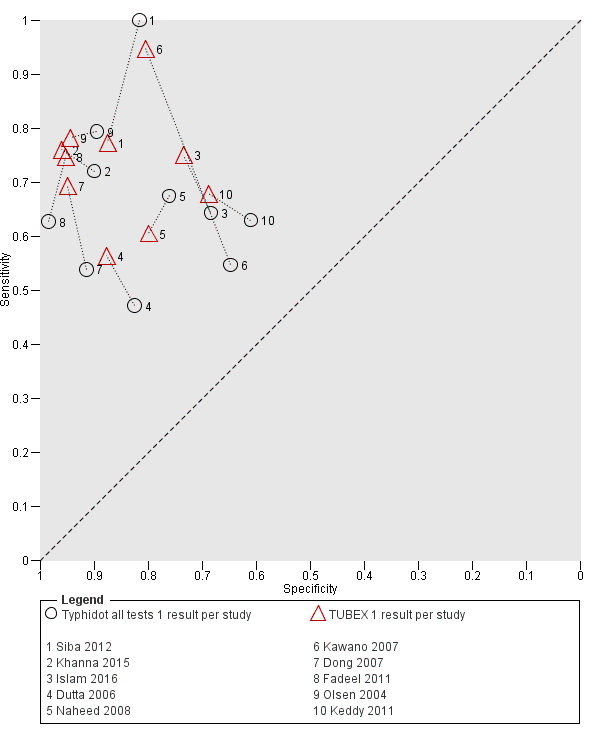
Summary receiver operating characteristic plot: Typhidot versus TUBEX. Paired studies only. One result per index test per study.

Summary receiver operating characteristic: TUBEX versus KIT. Paired results. One result per index per study.

Summary receiver operating characteristic plot: Typhidot versus TUBEX tests. One result per index test per study.
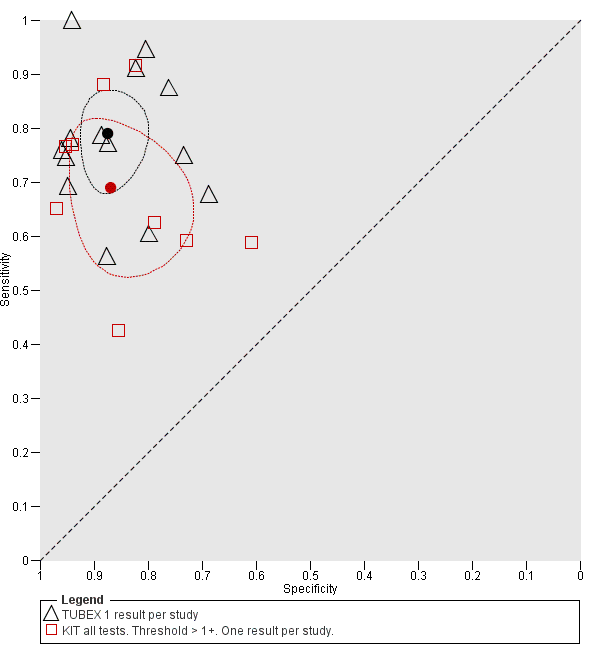
Summary receiver operating characteristic plot: TUBEX versus Test‐it Typhoid (KIT) tests. One result per index test per study.

Summary receiver operating characteristic: Typhidot versus KIT. No paired studies. One result per index per study.

Summary receiver operating characteristic plot: Typhidot tests by case control design.

Typhidot. Antibody: IgM or as reported. 1 result per study.
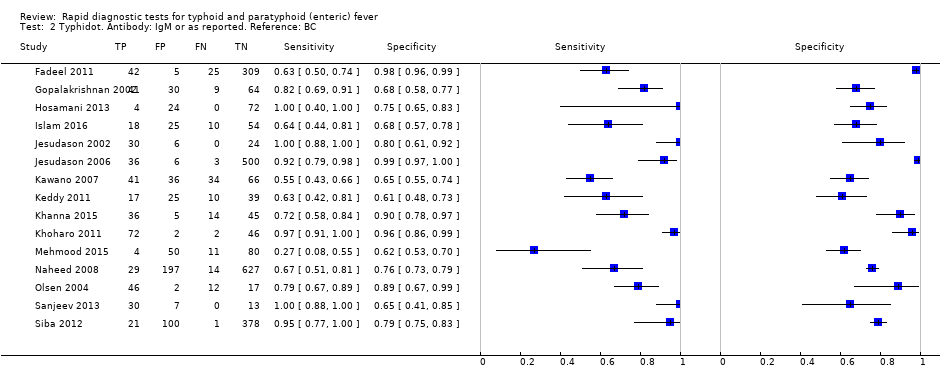
Typhidot. Antibody: IgM or as reported. Reference: BC.

Typhidot. Antibody: IgM or as reported. Reference: BC and BM.

Typhidot. Antibody: IgM or as reported. Reference: BC and PCR.

Typhidot. Antibody: IgM or as reported. Indeterminates reported.

Typhidot. Antibody: IgM or as reported. Indeterminates not reported.

Typhidot‐M. Antibody: IgM.

Typhi rapid Tr‐02. Reference: BC. Antibody: IgM.
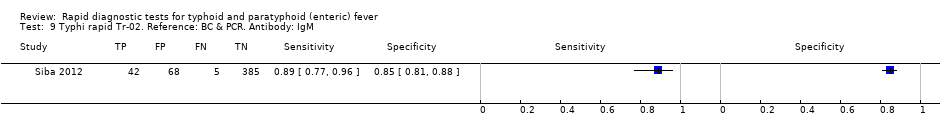
Typhi rapid Tr‐02. Reference: BC & PCR. Antibody: IgM.

Typhidot all tests 1 result per study.

TUBEX. Reference:BC.
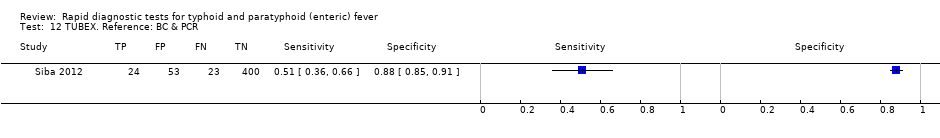
TUBEX. Reference: BC & PCR.
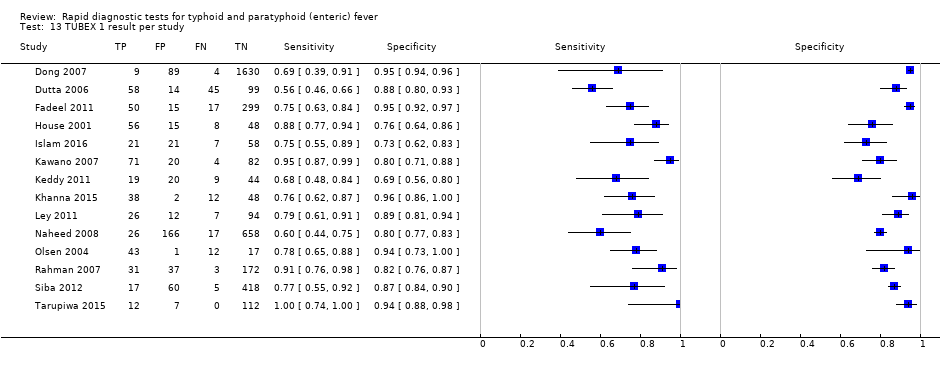
TUBEX 1 result per study.

KIT ICT. Reference:BC. Threshold > 1+.

KIT ICT. Reference: BC & PCR. Threshold > 1+.
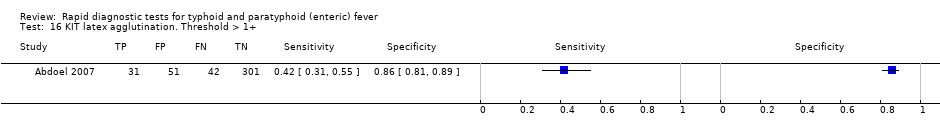
KIT latex agglutination. Threshold > 1+.

KIT Dipstick. Threshold > 1+.

KIT ICT. Threshold > 1+.

KIT all tests. Threshold > 1+. One result per study..
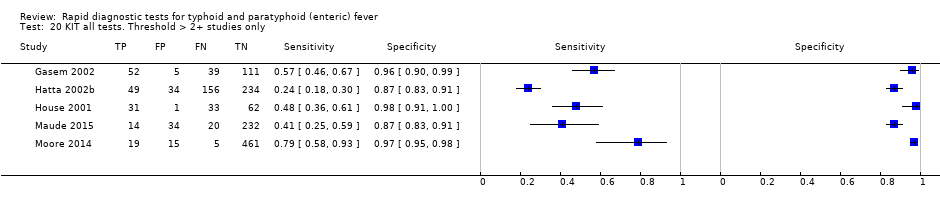
KIT all tests. Threshold > 2+ studies only.

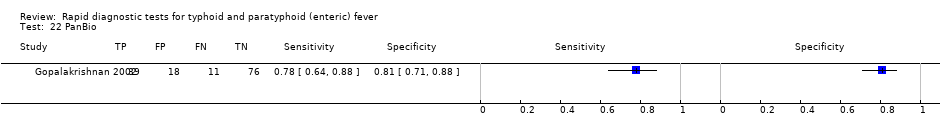

SD Bioline. Antibody: IgG.

SD Bioline. Antibody: IgM.
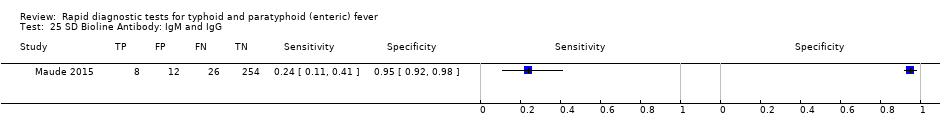
SD Bioline Antibody: IgM and IgG.

Mega Salmonella. Antibody: IgG.
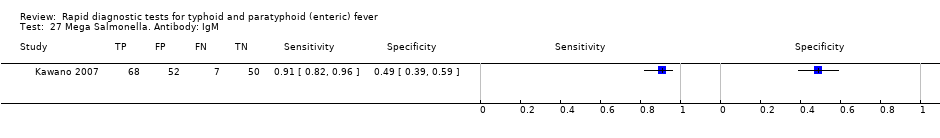
Mega Salmonella. Antibody: IgM.

Multi‐Test Dip‐S‐Tick.

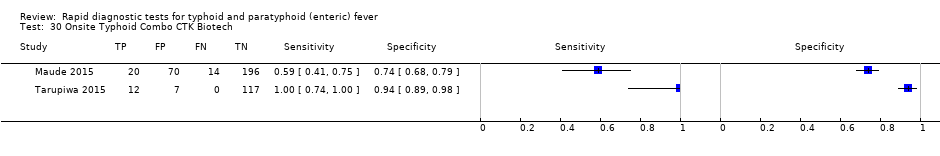
Onsite Typhoid Combo CTK Biotech.
| Review question: to assess the diagnostic accuracy of rapid diagnostic tests (RDTs) for detecting enteric fever in persons living in endemic areas presenting to a healthcare facility with fever Patients/population: clinically‐suspected enteric fever patients or unselected febrile patients Role: first test for enteric fever in patients presenting to a healthcare facility with fever in endemic areas Index tests: all RDTs specifically designed to enteric fever cases applied to patient blood or urine samples Reference standards: bone marrow culture, peripheral blood culture, peripheral blood culture, and polymerase chain reaction (PCR) on blood Studies: prospective cohort, retrospective case control Setting: healthcare facility in enteric fever endemic areas | ||||||
| Index test | Effect (95% confidence interval (CI)) | Participants Total number, number with disease, (number of studies) | Test result | Number of results per 1000 participants tested 1 (95% CI) | ||
| Prevalence 1% | Prevalence 10% | Prevalence 30% | ||||
| Typhidot (all types) | Sensitivity 84 (73 to 91) Specificity 79 (70 to 87) | 6928, 982 (22) | TP FN FP TN | 8 (7 to 9) 2 (1 to 3) 208 (129 to 297) 782 (693 to 861) | 84 (73 to 91) 16 (9 to 27) 189 (117 to 270) 711 (630 to 783) | 252 (219 to 273) 48 (27 to 81) 147 (91 to 210) 553 (490 to 609) |
| Typhidot indeterminants reported or not applicable | Sensitivity 78 (65 to 87) Specificity 77 (66 to 86) | 5555, 662 (13) | TP FN FP TN | 8 (7 to 9) 2 (1 to 3) 228 (139 to 337) 762 (653 to 851) | 78 (65 to 87) 22 (13 to 35) 207 (126 to 306) 693 (594 to 774) | 234 (195 to 261) 66 (39 to 105) 161 (98 to 238) 539 (462 to 602) |
| Typhidot indeterminate results reported | Sensitivity 66 (59 to 73) Specificity 81 (58 to 93) | 1721, 339 (6) | TP FN FP TN | 7 (6 to 7) 3 (3 to 4) 188 (69 to 416) 802 (574 to 921) | 66 (59 to 73) 34 (27 to 41) 171 (63 to 378) 729 (522 to 837) | 198 (177 to 219) 102 (81 to 123 ) 133 (49 to 294) 567 (406 to 651) |
| TUBEX | Sensitivity 78 (71 to 85) Specificity 87 (82 to 91) | 4885, 627 (14) | TP FN FP TN | 8 (7 to 9) 2 (2 to 3) 129 (89 to 178) 861 (812 to 901) | 78 (71 to 85) 22 (15 to 29) 117 (81 to 162) 783 (738 to 819) | 234 (213 to 255) 66 (45 to 87) 91 (63 to 126) 609 (574 to 637) |
| Test‐it Typhoid and KIT prototypes (threshold > 1+) | Sensitivity 69 (59 to 78) Specificity 90 (78 to 93) | 2828, 682 (9) | TP FN FP TN | 7 (6 to 8) 3 (2 to 4) 99 (69 to 218) 891 (772 to 921) | 69 (59 to 78) 31 (22 to 41) 90 (63 to 198) 810 (702 to 837) | 207 (177 to 234) 93 (66 to 123) 70 (49 to 154) 630 (546 to 651) |
| Attributes of tests contributing to benefits and risks | ||||||
| Rapid diagnostic tests (RDTs)2 | RDTs are designed to provide test results typically in less than 1 hour, whereas currently used blood culture tests require 48 hours. The technical ability needed to conduct these rapid tests is designed to be lower than typical laboratory based tests, meaning they have the potential to be delivered nearer to the patient, further reducing time to diagnosis. However, some variants of the Typhidot test requires additional laboratory equipment, whereas the TUBEX and Test‐it Typhoid test do not. The TUBEX tests and some variants of Typhidot require cold chain storage. The Test‐it Typhoid test does not. In this Cochrane Review all included rapid tests were used on blood samples. None of the included studies conducted tests on urine samples. | |||||
| Overall certainty of evidence | ||||||
| Indeterminate results: for the Typhidot index test, there are concerns about studies which do not report indeterminate results (IgM negative and IgG positive). These results can frequently occur and if these results are not included in the analysis this biases study results to be overly‐optimistic. Case control studies: many of these studies use a case control design. This study design is at risk of overestimating both sensitivity and specificity. Reference standard: the highest grade of reference standard includes either bone marrow culture or PCR using blood, in addition to blood culture. However using bone marrow as a reference standard is invasive and more severe patients may be selected into these studies. Most included studies use only blood culture, and studies using more than 1 reference standard for example, PCR showed a reduction in RDT sensitivity by 20% to 25%. Precision: average estimates of both sensitivity and specificity have low precision, due to the heterogeneity between studies. Paired studies: there are few paired studies, where more than 1 test is used in the same patients. These studies provide the most direct evidence for comparing tests. Typhidot paired with TUBEX: Total 4245, 484 patients with disease. Typhidot paired with Test‐it Typhoid and KIT prototypes: no paired studies. Test‐it Typhoid and KIT prototypes paired with TUBEX: total 127, 64 patients with disease. It remains unclear if the tests were used in the same cohort of patients. | ||||||
| Abbreviations: False Negatives (FN); False Positives (FP); immunoglobulin‐G (IgG); immunoglobulin‐M (IgM); Royal Tropical Institute, Amsterdam (KIT); polymerase chain reaction (PCR); True Negatives (TN); True Positives (TP). 1We used 2 systematic reviews of bacteraemia in Asia and Africa to inform prevalences of 30% (Asia); 10% (Africa: adults and children) and 1% (Africa: children) (Reddy 2010; Deen 2012). | ||||||
| Index Test Name | Manufacturer | Methods | Formats | Biological specimen | Threshold for positivity values | Number of evaluations |
| TUBEX® TF | IDL Biotech, Bromma, Sweden | Inhibition Binding Magnetic Immunoassay. Detects IgM to S. Typhi O9 antigen. Semi‐quantitative colorimetric. | Mix buffer/reagent into plastic well with patient specimen. 3 minutes for result. | Whole blood, plasma, or serum | Semi‐quantitative colour change scale (0 to 10) provided by manufacturer. Positive if colour change scale ≥ 3. | 14 |
| Typhidot® | Malaysian Bio‐Diagnostics Research, Selangor, Malaysia | Dot‐enzyme immunoassay. Detects IgG and IgM to 50 kdA S. Typhi Outer Membrane Protein (OMP) antigen. | Mix serum/whole blood plus reagent incubating commercially‐prepared pre‐dotted antigen filter paper strips. 60 minutes for result. | Whole blood, plasma, or serum | Qualitative: either positive or negative. A positive result is a visible reaction (IgG or IgM) of an intensity equal to or greater than that of the control reaction on the commercially prepared filter paper. | 17 |
| Typhidot‐M® | Malaysian Bio‐Diagnostics Research, Selangor, Malaysia | Dot‐enzyme immunoassay. Detects IgM to 50 kdA S. Typhi OMP antigen. | Mix serum/whole blood plus reagent incubating commercially‐prepared pre‐dotted antigen filter paper strips. 60 minutes for result. | Whole blood, plasma, or serum | Qualitative: either positive or negative. Positive as per Typhidot. The absence of any visible spot indicated a negative test result. | 6 |
| TyphiRapid Tr‐02 (Typhidot) | Reszon Diagnostics International, Malaysia | Prototype of Typhidot. Immunochromatography | Mix serum/whole blood plus buffer/reagent into a well. | Whole blood, plasma, or serum | We were unable to get hold of the manufacturer and are awaiting a response from the study author | 1 |
| KIT ICT Test‐It TyphoidTM | LifeAssay Diagnostics, Cape Town, South Africa | Lateral flow immunochromatographic (ICT) assay. Detects IgM to S. Typhi lipopolysaccharide (LPS) antigen. Semi‐quantitative. | Mix serum/whole blood plus buffer/reagent into lateral flow cassette. Two‐site (test and control) immunoassay on a porous nitrocellulose membrane. 15 minutes for result. | Whole blood, plasma, or serum | Semi‐quantitative result line intensity scale (negative to +4) provided by manufacturer. A positive result is ≥ +1 | 3 |
| KIT Dipstick Assay | Royal Tropical Institute (KIT), Amsterdam | Detects IgM to S. Typhi LPS antigen. Simplified version of ELISA technique. | Strip of nitrocellulose membrane with immobilized antigen detection band. Serum plus reagent incubated on dipstick for 3 hours at room temperature. Dipsticks rinses with water and dried. >3 hours for result. | Serum | Semi‐quantitative result line intensity scale (negative to +4) provided by manufacturer. A positive result is ≥ +1 | 5 |
| KIT Dri‐Dot Assay (latex agglutination) | Royal Tropical Institute (KIT), Amsterdam | Detects IgM to S. Typhi LPS antigen. White agglutination card. | Dot of dried detection reagent conjugated to blue latex reagent. Antigen‐activated latex stabilized by drying a drop of latex reagent onto card suspended in serum. Card rotated by hand in near‐horizontal position to further induce agglutination. 30 seconds for result. | Serum | Qualitative: positive or negative. Positive when agglutination was observed within 30 seconds. Negative when no agglutination was observed. | 1 |
| SD Bioline Salmonella typhi IgG/IgM Fast | Standard Diagnostics Inc., Gyeonggi, Korea | ICT flow method. Detects IgM and IgG antibodies to unspecified S. Typhi antigens. | 4 drops of reagent mixed well with patient specimen. Nitrocellulose strip suspended into with 3 sites (IgM, IgG, and control). 30 minutes for result. | Serum, plasma, or whole blood | Qualitative: positive or negative. Positive if line appears in both control and 1 or both of IgM or IgG test zones. | 3 |
| Enterocheck WB® | Zephyr Biologicals, Goa, India | ICT Detects IgM antibodies to S. Typhi LPS antigen. | Two‐site (IgM test, and control) immunoassay cassette on a porous nitrocellulose membrane. 15 minutes for result. | Whole blood, plasma, or serum | Qualitative: positive or negative. Presence of a line in both the test and control zones indicates a positive result. | 2 |
| Enteroscreen ® | Zephyr Biologicals, Goa, India | ICT Detects IgM and IgG antibodies to S. Typhi LPS antigen. | Three‐site (IgG, IgM, and control) immunoassay cassette on a porous nitrocellulose membrane. 15 minutes for result. | Whole blood, plasma, or serum | Qualitative: positive or negative. Presence of a line in both the test (IgG, IgM, or both) and control zones indicates a positive result. | 1 |
| Multi‐test Dip‐S‐Tick | PanBio Inc., Columbia, Maryland, USA | Tests for five pathogens, including S. Typhi. Dipstick format that detects anti‐O, anti‐H,anti‐Vi, IgM, or IgG antibodies. | Detailed information not available | Heparinized whole blood, serum, or plasma | Detailed information not available | 1 |
| Mega Salmonella | Mega Diagnostics, Los Angeles, California, USA | Detect IgG and IgM antibodies to unspecified Salmonella antigens. Quantitatively detected by ELISA with peroxidase‐labelled reagents. | Results read in a microplate ELISA reader. | Whole blood, serum, or plasma | Detailed information not available | 1 |
| OnSite Typhoid IgG/IgM Combo | CTK Biotech Inc., San Diego, California, USA | Lateral flow immunoassay. Detects IgG and IgM antibodies against recombinant O and H S. Typhi antigens. | Three‐site (IgG, IgM, and control) immunoassay cassette on a porous nitrocellulose membrane. 15 minutes for result. | Whole blood, serum, or plasma | Qualitative: positive or negative. Presence of a line in both the test (IgG, IgM, or both) and control zones indicates a positive result. | 2 |
| Abbreviations: immunochromatographic (ICT); immunoglobulin‐G (IgG); immunoglobulin‐M (IgM); Tropical Institute, Amsterdam (KIT); lipopolysaccharide (LPS); outer membrane protein (OMP). | ||||||
| Test | No. of studies | No. of participants |
| 1 Typhidot. Antibody: IgM or as reported. 1 result per study Show forest plot | 17 | 3691 |
| 2 Typhidot. Antibody: IgM or as reported. Reference: BC Show forest plot | 15 | 3466 |
| 3 Typhidot. Antibody: IgM or as reported. Reference: BC and BM Show forest plot | 2 | 225 |
| 4 Typhidot. Antibody: IgM or as reported. Reference: BC and PCR Show forest plot | 1 | 500 |
| 5 Typhidot. Antibody: IgM or as reported. Indeterminates reported Show forest plot | 6 | 1721 |
| 6 Typhidot. Antibody: IgM or as reported. Indeterminates not reported Show forest plot | 11 | 1970 |
| 7 Typhidot‐M. Antibody: IgM Show forest plot | 6 | 3334 |
| 8 Typhi rapid Tr‐02. Reference: BC. Antibody: IgM Show forest plot | 1 | 500 |
| 9 Typhi rapid Tr‐02. Reference: BC & PCR. Antibody: IgM Show forest plot | 1 | 500 |
| 10 Typhidot all tests 1 result per study Show forest plot | 22 | 6928 |
| 11 TUBEX. Reference:BC Show forest plot | 14 | 4885 |
| 12 TUBEX. Reference: BC & PCR Show forest plot | 1 | 500 |
| 13 TUBEX 1 result per study Show forest plot | 14 | 4885 |
| 14 KIT ICT. Reference:BC. Threshold > 1+ Show forest plot | 2 | 709 |
| 15 KIT ICT. Reference: BC & PCR. Threshold > 1+ Show forest plot | 2 | 800 |
| 16 KIT latex agglutination. Threshold > 1+ Show forest plot | 1 | 425 |
| 17 KIT Dipstick. Threshold > 1+ Show forest plot | 5 | 1394 |
| 18 KIT ICT. Threshold > 1+ Show forest plot | 3 | 1009 |
| 19 KIT all tests. Threshold > 1+. One result per study. Show forest plot | 9 | 2828 |
| 20 KIT all tests. Threshold > 2+ studies only Show forest plot | 5 | 1607 |
| 21 Enterocheck WB Show forest plot | 2 | 533 |
| 22 PanBio Show forest plot | 1 | 144 |
| 23 SD Bioline. Antibody: IgG Show forest plot | 3 | 1669 |
| 24 SD Bioline. Antibody: IgM Show forest plot | 3 | 1590 |
| 25 SD Bioline Antibody: IgM and IgG Show forest plot | 1 | 300 |
| 26 Mega Salmonella. Antibody: IgG Show forest plot | 1 | 177 |
| 27 Mega Salmonella. Antibody: IgM Show forest plot | 1 | 177 |
| 28 Multi‐Test Dip‐S‐Tick Show forest plot | 1 | 75 |
| 29 Enteroscreen Show forest plot | 1 | 1521 |
| 30 Onsite Typhoid Combo CTK Biotech Show forest plot | 2 | 436 |