Técnicas anestésicas para el riesgo de recidiva de tumores malignos
Resumen
Antecedentes
La cirugía sigue siendo la base del tratamiento para los tumores malignos; sin embargo, la manipulación quirúrgica da lugar a una liberación sistémica significativa de células tumorales. El hecho de que dichas células causen metástasis depende en gran parte del equilibrio entre la agresividad de las células tumorales y la adaptabilidad del cuerpo. El estrés quirúrgico per se, los agentes anestésicos y la administración de analgésicos opioides de forma perioperatoria pueden comprometer la función inmunitaria y podrían perturbar el equilibrio y dar lugar a la progresión de una enfermedad residual mínima. Las técnicas de anestesia regional brindan una analgesia perioperatoria; por lo tanto, reducen la cantidad de opioides sistémicos y de agentes anestésicos administrados. Además, se sabe que las técnicas de anestesia regional previenen o atenúan la respuesta al estrés quirúrgico. En los años recientes, el beneficio potencial de las técnicas de anestesia regional para la recidiva tumoral ha recibido mayor atención y se ha debatido muchas veces en la bibliografía. Al preparar esta revisión, se procuró resumir las pruebas actuales de forma sistemática e integral.
Objetivos
Establecer si la técnica anestésica (anestesia general versus anestesia regional o una combinación de las dos técnicas) influye en el pronóstico a largo plazo para los pacientes con tumores malignos.
Métodos de búsqueda
Se hicieron búsquedas en The Cochrane Library (2013, número 12), PubMed (1950 hasta el 15 diciembre 2013), EMBASE (1974 hasta el 15 diciembre 2013), BIOSIS (1926 hasta el 15 diciembre 2013) y en Web of Science (1965 hasta el 15 diciembre 2013). Se realizaron búsquedas manuales de sitios web relevantes, resúmenes de congresos y listas de referencias de los artículos citados. No se aplicaron restricciones de idioma.
Criterios de selección
Se incluyeron todos los ensayos controlados aleatorios o los ensayos clínicos controlados que investigaban los efectos de la anestesia general versus regional en el riesgo de recidiva de tumores malignos en pacientes sometidos a la resección de tumores malignos primarios. Las comparaciones de las intervenciones constaron de (1) anestesia general sola versus anestesia general combinada con una o más técnicas de anestesia regional; (2) anestesia general combinada con una o más técnicas de anestesia regional versus una o más técnicas de anestesia regional; y (3) anestesia general sola versus una o más técnicas de anestesia regional. Los resultados primarios incluyeron (1) supervivencia general, (2) supervivencia libre de progresión y (3) tiempo hasta la progresión tumoral.
Obtención y análisis de los datos
Dos autores de la revisión examinaron de forma independiente los títulos y resúmenes de los informes identificados y extrajeron los datos de los estudios.
Todas las variables de resultado primarias son datos del tiempo hasta el evento. Cuando el informe individual de los ensayos presentaba estadísticas de resumen con odds ratios, riesgos relativos o curvas de Kaplan‐Meier, los datos extraídos permitieron realizar el cálculo del cociente de riesgos instantáneos mediante la hoja de cálculo del cociente de riesgos instantáneos. Para evaluar el riesgo de sesgo, se utilizaron los procedimientos metodológicos estándar previstos por la Colaboración Cochrane.
Resultados principales
Se incluyeron cuatro estudios con un total de 746 participantes. Todos los estudios incluyeron a pacientes adultos sometidos a cirugía para la resección del tumor primario. Dos estudios incluyeron a participantes hombres y mujeres sometidos a cirugía abdominal mayor por cáncer. Un estudio incluyó a participantes hombres sometidos a cirugía por cáncer de próstata, y un estudio a participantes hombres sometidos a cirugía por cáncer de colon. El tiempo de seguimiento varió entre nueve y 17 años. Los cuatro estudios compararon anestesia general sola versus anestesia general combinada con anestesia epidural y analgesia. Los cuatro estudios son análisis de datos secundarios de ensayos controlados aleatorios prospectivos realizados anteriormente.
De los cuatro estudios incluidos, sólo tres contribuyeron al resultado de la supervivencia general, uno al resultado de la supervivencia libre de progresión y uno al resultado del tiempo hasta la progresión tumoral. En el metanálisis, no fue posible encontrar una ventaja para ninguno de los grupos de estudio en cuanto a los resultados de la supervivencia general (cociente de riesgos instantáneos [CRI] 1,03; intervalo de confianza [IC] del 95%: 0,86 a 1,24) y la supervivencia libre de progresión (CRI 0,88; IC del 95%: 0,56 a 1,38). Para la supervivencia libre de progresión, el nivel de inconsistencia fue alto. Los datos agrupados para el tiempo hasta la progresión tumoral mostraron un resultado algo favorable para el grupo de control (anestesia general sola) comparado con el grupo de intervención (anestesia epidural y general) (CRI 1,50; IC del 95%: 1,00 a 2,25).
La calidad de las pruebas fue calificada como baja para la supervivencia general y muy baja para la supervivencia libre de progresión y el tiempo hasta la progresión tumoral. Se disminuyó la calidad del resultado de supervivencia general debido a la imprecisión y dificultad graves. La calidad de los resultados de supervivencia libre de progresión y tiempo hasta la progresión tumoral también se disminuyó a causa de la inconsistencia grave y el riesgo grave de sesgo, respectivamente.
El informe de los eventos adversos fue escaso, y no fue posible analizar los datos.
Conclusiones de los autores
Actualmente, las pruebas sobre el beneficio de las técnicas de anestesia regional en la recidiva tumoral son insuficientes. Hay un número alentador de ensayos controlados aleatorios prospectivos en curso y se espera que los resultados, cuando sean informados, agreguen pruebas sobre este tema en un futuro próximo.
Resumen en términos sencillos
Técnicas anestésicas para el riesgo de recidiva de tumores malignos
Antecedentes
La cirugía sigue siendo la base del tratamiento para los pacientes con muchos tipos de cáncer. Sin embargo, se sabe que el estrés quirúrgico, una determinada anestesia y los fármacos para el dolor comúnmente administrados durante la anestesia en la cirugía por cáncer suprimen las defensas del cuerpo. Por lo tanto, la cirugía y la anestesia podrían contribuir a la recidiva del cáncer a largo plazo. Están disponibles diferentes tipos de anestesia. Puede usarse la anestesia general, que indica que el paciente duerme durante la cirugía; la anestesia regional, que significa que la parte del cuerpo en donde se realiza la cirugía es adormecida con una medicación para adormecer (anestésico local) o una combinación de ambas técnicas. La anestesia regional tiene el potencial de reducir la administración de determinada anestesia y fármacos para el dolor que se inyectan en las venas o se inhalan e ingresan a los pulmones, así como de atenuar el estrés quirúrgico. Por lo tanto, en estudios de investigación anteriores se ha indicado que la anestesia regional podría reducir el riesgo de recidiva del cáncer a largo plazo.
Pregunta de la investigación
Se intentó descubrir si los diferentes tipos de anestesia utilizados durante la cirugía por cáncer podrían influir en la supervivencia a largo plazo o en la tasa de recidiva tumoral en los pacientes sometidos a cirugía por cáncer.
Fecha de la búsqueda
Las pruebas están actualizadas hasta diciembre 2013.
Características de los estudios
Se encontraron cuatro estudios con un total de 746 adultos hombres y mujeres sometidos a cirugía abdominal para la extracción del cáncer. Todos los estudios fueron nuevos análisis de ensayos realizados anteriormente, lo cual significa que ninguno de los estudios incluidos estaba realmente diseñado para investigar la recidiva tumoral. Todos los pacientes fueron sometidos a cirugía por cáncer primario, lo cual significa que la cirugía para las metástasis del cáncer no estaba incluida. Un total de 354 participantes recibieron anestesia general y 392 participantes recibieron anestesia general junto con anestesia epidural. La anestesia epidural es un determinado tipo de anestesia regional que consiste en inyectar de forma continua una medicación para adormecer a través de un catéter en el espacio epidural. El espacio epidural es la parte más exterior alrededor de la médula espinal. El anestésico que se inyecta en el espacio epidural provoca que determinadas áreas del abdomen se vayan adormeciendo y sean insensibles al dolor. Los participantes en el estudio tuvieron un seguimiento durante al menos 7,8 años después de haber sido sometidos a cirugía por cáncer.
Resultados clave
No se encontró un beneficio para ningún grupo de estudio sobre la recidiva o la supervivencia del cáncer. Debido al informe incompleto y al número bajo de eventos adversos informados, no fue factible calcular las diferencias posibles en los efectos adversos entre las diferentes técnicas anestésicas utilizadas.
Calidad de la evidencia
La calidad de las pruebas sobre los resultados fue calificada como baja para la supervivencia general y como muy baja para la supervivencia libre de progresión y el tiempo hasta la progresión tumoral. Las limitaciones principales de las pruebas identificadas fueron que los resultados podrían haber sido influenciados por los tratamientos de fondo administrados a los pacientes que participaron en los ensayos.
Authors' conclusions
Summary of findings
| Epidural anaesthesia in addition to general anaesthesia compared with general anaesthesia alone for patients undergoing primary tumour surgery | |||||
| Patient or population: patients undergoing primary tumour surgery | |||||
| Outcomes | Illustrative comparative risks* (95% CI) | Relative effect† | Number of participants | Quality of the evidence | |
| Assumed risk | Corresponding risk | ||||
| General anaesthesia alone (control) | Epidural anaesthesia in addition to general anaesthesia (intervention) | ||||
| Death from all causes 7.8‐14.8 years (Myles) 8.3‐10.75 years (Christopherson) | Study population | HR 1.03 | 647 | ⊕⊕⊝⊝ | |
| 805 per 1000a | 815 per 1000 | ||||
| Tumour progression or death from all causes 7.8‐14.8 yearsd | Study population | HR 0.88 | 535 | ⊕⊝⊝⊝ | |
| 944 per 1000d | 921 per 1000 | ||||
| Tumour progression 4.5 yearsf | Study population | HR 1.50 | 545 | ⊕⊝⊝⊝ | |
| 360 per 1000g | 488 per 1000 | ||||
| *The basis for the assumed risk (e.g. median control group risk across studies) is provided in footnotes. The corresponding risk (and its 95% confidence interval) is based on the assumed risk in the comparison group and the relative effect of the intervention (and its 95% CI). | |||||
| GRADE Working Group grades of evidence. | |||||
| HR = hazard ratio, defined as intervention/control. †HR < 1 denotes advantage for the intervention group, HR > 1 denotes advantage for the control group. aThe assumed risk and the range of follow‐up times are based on data reported by Myles and Christophersen. Data on absolute events per group were not reported by Binczak. | |||||
Background
Cancer is the second most common cause of death in the United States and Europe (Centers for Disease Control and Prevention 2013; World Health Organization 2012). Cancer might be tumour forming (malignant tumour) or not (such as leukaemia). The most common cancers contributing to mortality are malignant tumours of lung, prostate and breast and colorectal malignant tumours (Jemal 2010). For these malignant tumours, surgery remains a mainstay of treatment. Surgery may be curative in the early stages, and it may at least prolong life in late stages.
Description of the condition
Metastatic disease is the most important cause of cancer‐related death in patients after malignant tumour surgery (Snyder 2010). Surgical manipulation leads to a significant systemic release of tumour cells (Eschwege 1995; Wang 2006; Yamaguchi 2000; Yamashita 2000). Whether these cells lead to metastases is largely dependent on the balance between aggressiveness of the tumour cells and resilience of the body. At least three perioperative factors shift the balance towards progression of minimal residual disease.
-
Surgery per se induces a stress response that can decrease host defences and promote tumour growth. Innate immunity and especially natural killer (NK) cells are known to play a major role in elimination of circulating tumour cells (Shakhar 2003; Whiteside 1995). Several studies have demonstrated decreased postoperative NK cell activity and an inverse correlation of NK cell activity with tumour stage and metastatic growth (Konjevic 1993; Lennard 1985; Mafune 2000; Pollock 1991; Tarle 1993). Additionally, increased postoperative concentrations of pro‐angiogenic factors such as vascular endothelial growth factor were found in humans (Ikeda 2002; Maniwa 1998). In animal models, surgical removal of the primary tumour significantly reduces concentrations of tumour‐related antiangiogenic factors (e.g. angiostatin, endostatin) and promotes tumour growth (Holmgren 1995).
-
Anaesthetic agents might impair numerous immune functions, including those of neutrophils, macrophages, dendritic cells, T cells and NK cells. Numerous in vitro and animal studies were able to show the immunosuppressive effects of anaesthetic agents such as halothane, isoflurane, sevoflurane, ketamine and thiopental (Kurosawa 2008; Melamed 2003; Mitsuhata 1995; Moudgil 1997). More recently, the immunosuppressive effects of the volatile anaesthetics isoflurane and sevoflurane were confirmed in humans undergoing surgery (Inada 2004; Schneemilch 2005; Zhang 2014).
-
Opioid analgesics inhibit both cellular and humoral immune function in humans (Beilin 1996; Sacerdote 2000; Vallejo 2004; Yardeni 2008; Yeager 1995). Moreover, in a human cell culture model, morphine increased angiogenesis and promoted breast tumour growth in a mouse model (Gupta 2002).
Other perioperative interventions or medications may influence the patient's immune response as well. In recent years, perioperative intravenous lidocaine infusion was introduced into clinical practice to improve pain management after major surgery. Randomized controlled trials in humans suggest that continuous administration of perioperative low‐dose lidocaine reduces postoperative opioid consumption, attenuates postoperative pain scores and reduces surgery‐induced alterations of immunity (Koppert 2004; Yardeni 2009).
Description of the intervention
Regional anaesthetic techniques include neuraxial techniques, such as spinal anaesthesia and epidural anaesthesia; nerve block techniques, such as intercostal or paravertebral nerve blocks; and an intravenous regional anaesthesia technique. Local anaesthetic techniques, such as wound infiltration by a single shot or continuously via a catheter, might also be considered as a type of regional anaesthesia. All these techniques provide pain relief during, as well as after, surgical procedures; they therefore reduce the quantity of systemic opioids needed perioperatively. Additionally, regional anaesthesia techniques are known to prevent or attenuate the surgical stress response by blocking afferent neuronal transmission, which prevents noxious afferent input from reaching the central nervous system (Deegan 2009; O'Riain 2005).
How the intervention might work
Regional anaesthetic techniques provide excellent pain relief during and after surgical interventions. A working regional anaesthesia technique implies that:
-
in many cases, general anaesthesia can be replaced by regional anaesthetic techniques, and the potential immunosuppressive effects of anaesthetic agents such as volatile anaesthetics can be avoided;
-
the quantity of intraoperative and postoperative opioids needed for intraoperative and postoperative pain management can at least be significantly reduced without compromising adequate pain relief; and
-
the surgical stress response is at least attenuated by regional anaesthetic techniques; therefore the immunosuppressive effect of surgical stress might be attenuated as well.
Why it is important to do this review
Based on available basic research data as outlined above, the hypothesis was stated that perioperative immunosuppression caused by surgical stress, anaesthetics and opioids might promote the progression of minimal residual disease in patients undergoing surgical resection of malignant tumours. Clinical researchers started to investigate the long‐term outcomes of patients with cancer after tumour surgery based on the anaesthetic technique used both intraoperatively and postoperatively. However, these data seem to be inconsistent until today. Therefore, the aim of this Cochrane review is to provide the clinician with an up‐to‐date and comprehensive summary of the best available evidence on whether anaesthetic techniques may influence malignant tumour recurrence.
Objectives
To establish whether anaesthetic technique (general anaesthesia versus regional anaesthesia or a combination of the two techniques) influences the long‐term prognosis for individuals with malignant tumours.
Methods
Criteria for considering studies for this review
Types of studies
We considered any randomized controlled trials (RCTs) or controlled clinical trials (CCTs) that investigated the effect of the anaesthetic technique on the risk of malignant tumour recurrence in study participants undergoing resection of primary malignant tumours. We did not include non‐randomized studies in the meta‐analysis, but we provided a narrative summary of non‐randomized studies in the discussion. To obtain the widest range of studies, we did not limit date of publication or language.
Types of participants
We considered all studies that included participants having surgery for primary malignant tumour resection. Adult and paediatric participant populations were eligible for inclusion. We defined paediatric patients as children younger than 18 years of age.
Types of interventions
Interventions of interest include different anaesthetic techniques used during the surgical procedure for primary malignant tumour resection. General anaesthesia included inhalational and intravenous techniques of drug administration. Regional anaesthesia included peripheral regional anaesthesia; neuraxial regional anaesthesia, that is, spinal anaesthesia and epidural anaesthesia; and local anaesthesia including continuous wound infiltration techniques.
Comparisons of interventions consist of:
-
general anaesthesia alone versus general anaesthesia combined with one or more regional anaesthetic techniques;
-
general anaesthesia combined with one or more regional anaesthetic techniques versus one or a combination of regional anaesthetic techniques; and
-
general anaesthesia alone versus one or more regional anaesthetic techniques.
Types of outcome measures
Primary outcomes
-
Overall survival (OS): the time elapsed between surgery and death from any cause.
-
Progression‐free survival (PFS): the time elapsed between surgery and tumour progression or death from any cause.
-
Time to tumour progression (TTP): the time elapsed between surgery and tumour progression.
Secondary outcomes
-
Postoperative adverse events including failed epidural catheter placement, postoperative nausea and vomiting (PONV), postoperative respiratory complications and postoperative cardiac complications.
Search methods for identification of studies
Electronic searches
We searched The Cochrane Library (2013, Issue 12), PubMed (1950 to 15 December 2013), EMBASE (1974 to 15 December 2013), BIOSIS (1926 to 15 December 2013) and Web of Science (1965 to 15 December 2013). We developed a specific search strategy for each database based on that developed for PubMed (Appendix 1). We combined the PubMed search strategy with the Cochrane highly sensitive search strategy for identifying RCTs (Higgins 2011a).
Searching other resources
We identified trials by manually searching abstracts of relevant conference proceedings, such as Annual Meetings of the American Society of Anesthesiologists and the European Society of Anaesthesiologists, as well as the National Cancer Research Institute Cancer Conference.
We checked the reference lists of relevant articles and contacted relevant trial authors to identify additional or ongoing studies. We also searched for relevant trials by searching specific websites.
http://www.science.gov/index.html.
We applied no language or publication date restrictions.
Data collection and analysis
Selection of studies
We merged results identified by the described variety of search strategies using literature manager software (Reference Manager). Two review authors (OSC, KK) independently scanned the titles and abstracts of identified reports. We retrieved and evaluated potentially relevant studies chosen by at least one review author in the full‐text version. We identified multiple reports of the same study. Two review authors (OSC and KK) independently assessed the congruence of the remaining trials with the review's inclusion criteria, using a checklist that had been designed in advance (study eligibility screening form) (Appendix 2). A third review author (NLP) resolved disagreements.
Data extraction and management
Two review authors (OSC, KK) independently extracted data using a data extraction form (Appendix 3) that was based on the Cochrane Anaesthesia Review Group data extraction form (CARG 2007; Jüni 2001). For each of the outcome variables (OS, PFS, TTP), the review authors used the data extraction tables suggested by Tierney 2007. If the individual trial report provided summary statistics with odds ratios, risk ratios or Kaplan‐Meier curves, the extracted data enabled us to calculate the hazard ratio (HR) using the HR calculating spreadsheet (Tierney 2007). We resolved disagreements through consultation with a third review author (NLP).
Assessment of risk of bias in included studies
We judged the study quality using the The Cochrane Collaboration's tool for assessing risk of bias—a two‐part tool that addresses the six specific domains of random sequence generation; allocation concealment; blinding of participants, personnel and outcome assessors; incomplete outcome data; selective reporting; and other sources of bias (Higgins 2011b). The first part describes the risk of bias, and the second part provides criteria for making judgements about risk of bias based on each of the six domains in the tool (Appendix 4). Based on this tool, we completed the 'Risk of bias' table—enclosed in the RevMan 5.2 software—for each included study. Risk of bias was assessed by two review authors (OSC, KK). We resolved disagreements through consultation with a third review author (NLP). We created a 'Risk of bias' graph and a 'Risk of bias' summary figure using RevMan 5.2 software to display the results. We present the risk of bias in the Results section and provide summary assessments of the risk of bias for each outcome within and across studies.
Measures of treatment effect
All primary outcome variables are time‐to‐event data. The treatment effect was the log hazard ratio for general anaesthesia versus regional anaesthesia or a combination of the two for the primary outcomes of OS, PFS and TTP. Treatment effects for the dichotomous secondary outcomes (adverse events) were planned to be expressed as the risk ratio .
Unit of analysis issues
We found no studies with non‐standard design, including no non‐randomized controlled trials.
Dealing with missing data
When necessary, we contacted the authors of included studies regarding missing data. When data were found to be missing and the study authors could not be contacted, we calculated missing statistics from other quoted statistics, if possible. When data were still missing, we performed an available case analysis, excluding data from which outcome information was unavailable. An intention‐to‐treat analysis was attempted to address missing data resulting from participant dropout.
Assessment of heterogeneity
We assessed statistical heterogeneity using the Chi2 test. We increased the significance level from 0.05 to 0.10 to adjust for the fact that a small number of studies and studies with small sample sizes were included. We assessed the level of inconsistency across studies using the I2 statistic, where I2 > 50 % indicates significant inconsistency. We evaluated clinical heterogeneity by comparing clinical characteristics of the included studies. If present, we explored and discussed possible reasons for heterogeneity and inconsistency (Higgins 2011a).
Assessment of reporting biases
We assessed reporting biases through careful attention to quality assessment, particularly of study methodology. A thorough search for unpublished studies through contact with known experts in the field also assisted in reducing the risk of publication bias. We deferred funnel plot analysis to examine publication bias because of the low number of studies included in the review.
Data synthesis
The effect measure for comparing interventions for survival outcomes was the log HR and the standard error (SEHR). We defined HR as intervention group/control group so that HR < 1 denotes advantage for the intervention group and HR > 1 denotes advantage for the control group. We adjusted the HR derived from individual trials accordingly as appropriate. We report HRs with 95% confidence intervals (CIs) on a non‐log scale. For trials providing the HR but not providing individual participant data and not reporting the SEHR, we used the methods of Parmar 1998 to estimate variance from the reported CI (Parmar 1998). For trials that did not report the HR, we used the approximation methods of Parmar 1998 and Williamson 2002 to estimate HR and variance from cumulative survival rates (Kaplan‐Meier plots), observed and expected event tallies, logrank statistics or the Mantel‐Haenszel test (Parmar 1998; Williamson 2002). Estimation of the summary HR across trials was attained by the generic inverse variance method with a fixed‐effect model, using the statistical software Review Manager. To meet concerns about judgement of clinical heterogeneity, we additionally used a random‐effects model to analyse the data.
The pooled treatment effect for the risk ratio was planned using an inverse variance approach. Because data on adverse events were lacking, the analysis was deferred.
Subgroup analysis and investigation of heterogeneity
Because data were few, we did not perform subgroup analysis.
Sensitivity analysis
Because data were few, planned sensitivity analyses were deferred (see Differences between protocol and review) .
'Summary of findings' table
The primary outcomes of OS, PFS and TTP were incorporated into a 'Summary of findings' table. The treatment effect for these three primary outcomes is the HR of time‐to‐event data, incorporating both beneficial and adverse effects. Because data were lacking, we did not include secondary outcomes (adverse events) into the 'Summary of findings' table.
Based on the content of the included studies and the 'Risk of bias' tables, the quality of evidence is presented using the Grades of Recommendation, Assessment, Development and Evaluation (GRADE) approach, with particular attention to limitations of study design and heterogeneity of results.
Results
Description of studies
Results of the search
Results of the database searches are displayed in the study flow diagram (Figure 1). The manual search of conference proceedings and specific websites, as well as handsearching of reference lists, did not reveal additional eligible studies. Handsearching yielded nine ongoing clinical trials possibly meeting the inclusion criteria, all registered on ClinicalTrials.gov (http://www.clinicaltrials.gov/).
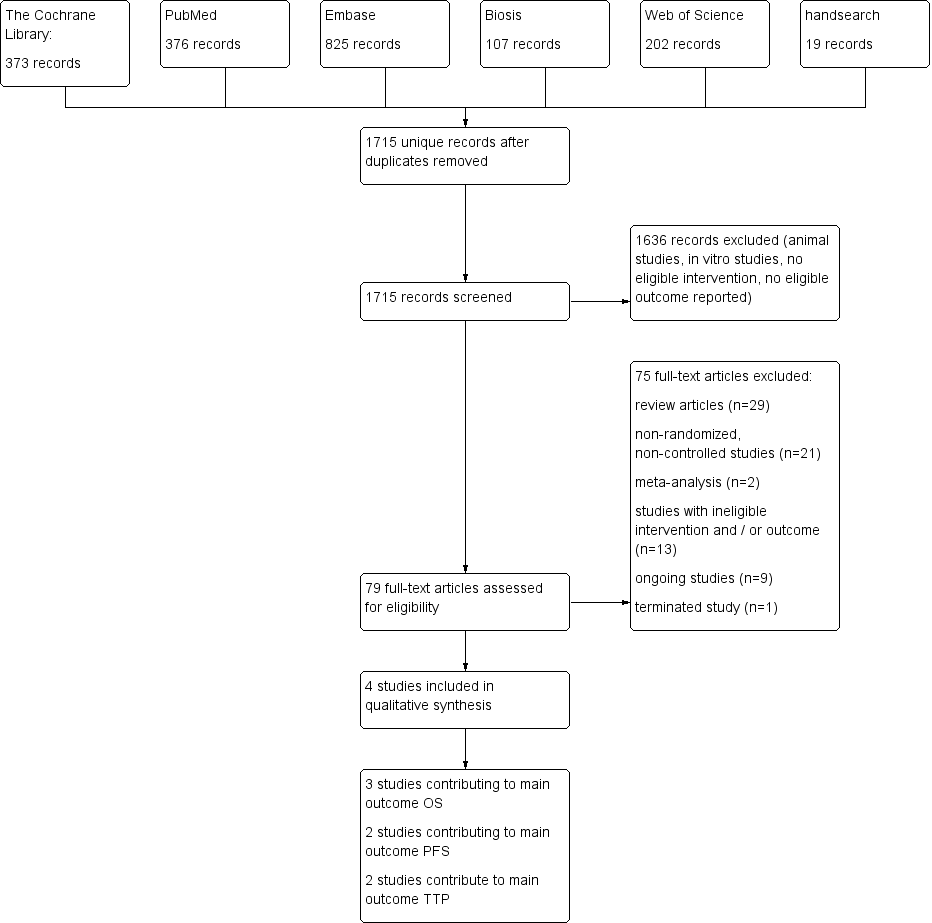
Study flow diagram.
Included studies
We included four studies with a total of 746 participants (Binczak 2013; Christopherson 2008; Myles 2011; Tsui 2010). All four studies are secondary data analyses of previously published prospective RCTs (Jayr 1993; O'Connor 2006; Park 2001; Rigg 2000; Rigg 2002). The subset of the included patient population is described in Characteristics of included studies/notes). All studies included adult participants undergoing surgery for primary tumour resection. Two studies enrolled participants undergoing major abdominal surgery for cancer. Major abdominal surgery included oesophagectomy, gastrectomy, hepatectomy, pancreatectomy, colectomy, nephrectomy, cystectomy, radical hysterectomy and open prostatectomy in one trial (Myles 2011), and surgery for colorectal cancer, gastric cancer, pancreatic cancer, bladder cancer, bile duct carcinoma, small intestine cancer, adenopathy and peritoneal gelatinous disease in the other trial (Binczak 2013). One study enrolled participants undergoing surgery for prostate cancer (Tsui 2010), and one study for colon cancer (Christopherson 2008). Two studies included male participants only (Christopherson 2008; Tsui 2010), and the remaining two studies enrolled male and female participants. Follow‐up time ranged from nine years to 17 years postoperatively. Two studies (Christopherson 2008; Myles 2011) reported results of multi‐centre trials, and the two remaining studies were single‐centre studies. Demographics and perioperative data are displayed in Table 1.
| Number of participants | Recruitment site(s) | Age (years) | Male sex | ASA | Type of surgery | Outcome data derived from | |
| 112 | USA; multi‐centre | Control group: 69.1 ± 7.8 Epidural group: 68.6 ± 7.7 | Male only | IIIa | Elective surgery for colon cancer | Veterans Affairs Beneficiary Information and Records Locator System (VA BIRLS) | |
| 446 | Australia, East Asia, Middle East; multi‐centre (MASTERS trial) | Control group: 70 ± 11 Epidural group: 71 ± 9.5 | Control group: 53% Epidural group: 60% | 'High risk patients'b | Major abdominal surgery for cancer | 1. Medical hospital record 2. Contact with participant's general practitioner 3. State‐based cancer registry or National Health Index 4. Participant contact 5. Contact with next of kin | |
| 99 | Canada; single‐centre | Control group: 63.9 ± 6.1 Epidural group: 63.0 ± 5.5 | Male only | ASA I‐III | Radical prostatectomy and bilateral pelvic lymphadenectomy | Participant's hospital charts and medical records | |
| 89 | France; single‐centre | Not reported for subcohort (mean for full cohort 58 years) | Not reported for subcohort (full cohort includes > 62% male) | Not reported | Major abdominal surgery for cancer | 1. Hospital intern cancer registry 2. Participant contact 3. French National Registry |
ASA = American Society of Anesthesiologists physical status classification.
USA = United States of America.
aThe study by Christopherson 2008 reports that ASA I‐III patients were included. However, the original trial included only ASA III patients (Park 2001).
bAccording to the inclusion criteria noted in the original study (Rigg 2002), 'high risk' translates to ASA II‐III.
All four studies compared general anaesthesia alone versus general anaesthesia combined with epidural anaesthesia and analgesia. General anaesthesia was a balanced anaesthesia in all four studies. Three studies used isoflurane to maintain anaesthesia, and one study did not specify the type of volatile anaesthetic used (Myles 2011). Intraoperative and early postoperative analgesia was mainly archived with participant‐ or physician‐controlled administration of opioids. We summarize the data on epidural and intravenous analgesia in the table "Intraoperative and early postoperative analgesia" (Table 2).
| GA maintenance | Epidural catheter level | Time placed | Duration | LA used | Epidural medications intraoperatively | Epidural medications postoperatively | Intraoperative IV opioids | Postoperative IV opioids | |
| Isoflurane 0.9% (mean) + N2O | Thoracic or lumbar epidural catheter | Preoperatively | "as long as needed" | Bupivacaine 0.5% | 3‐6 mg morphine; 25‐50 mg boluses bupivacaine/3‐5 hours as needed; epinephrine | 25‐50 mg boluses bupivacaine/3‐5 hours as needed; morphine 3‐6 mg/12‐24hours as needed | Fentanyl for both groups | Morphine, meperidine as needed (IV in epidural group, IV or IM in control group) | |
| Balanced anaesthesia (volatile anaesthetic not specified), N2O use not specified or recorded, but usual practice was to include it | At discretion of the anaesthesiologist "With the exception of some pelvic operations, all epidural catheters were inserted in the thoracic region" | Preoperatively | 3 days after surgery | Bupivacaine or ropivacaine | Bupivacaine or ropivacaine | Continuous infusion of ropivacaine or bupivacaine, supplemented with fentanyl or pethidine | Fentanyl pethidine | Postoperative opioids, mostly PCA in control group (fentanyl, pethidine) | |
| Isoflurane 1‐2% + N2O 60% | Low thoracic or high lumbar epidural catheter | Preoperatively | Not reported | Ropivacaine | Ropivacaine bolus + continuous infusion; fentanyl | Not reported | Morphine for control group | Not reported | |
| Isoflurane 1‐2% + N2O 70% | Thoracic 7‐11 | Preoperatively | Until 5th postoperative day | Bupivacaine | 50 mg bupivacaine as needed; epinephrine | 12.5 mg/h bupivacaine; 0.25 mg/h morphine | Fentanyl for both groups | Epidural group: morphine boluses SC as needed; control group: 2.5 mg/h morphine SC via catheter |
GA = general anaesthesia.
LA = local anaesthetic.
IV = intravenous.
IM = intramuscular.
SC = subcutaneous.
We did not identify any studies comparing general anaesthesia plus regional anaesthesia versus regional anaesthesia alone or general anaesthesia alone versus regional anaesthesia alone.
Three studies with 647 participants reported OS (Binczak 2013; Christopherson 2008; Myles 2011), two studies with 535 participants reported PFS (Binczak 2013; Myles 2011) and two studies with 545 participants reported TTP (Myles 2011; Tsui 2010). Investigators from only one study commented on postoperative adverse events (secondary outcomes) (Tsui 2010).
We summarized the included studies in the Characteristics of included studies table. We developed Table 3 to display additional results reported in each included study.
| Tumour stage (TNM) | Clinical vs pathologic staging | Median overall survival (95% CI) | Median progression‐free survival | Median time to tumour progression | 5‐Year survival | Follow‐up time | Statistical test used (uni‐ vs. multivariable) | |
| All T, N0, M0 | Pathological | 6.14 (5.22 to 7.99) | Not reported | Not reported | Not reported | Up to 9 years | Data extracted from Kaplan‐Meier curve; HR and SEHR calculated according to Tierney (Tierney 2007) | |
| All T, all N, no distant metastasis (M0) 'complete surgical excision' | Not reported | Epidural group: 3.3 (95% CI 2.1 to 4.5) Control group: 3.7 (95% 2.0 to 5.4) | Epidural group: 2.6 (IQR 0.7 to 8.7) Control group: 2.8 (IQR 0.7 to 8.7) | Epidural group: 1.1 (95% CI 0.7 to 1.6) Control group: 1.4 (95% CI 0.6 to 2.3) | Epidural group: 42% Control group: 44% | Up to 12 years | Univariable testing, log‐rank statistics, intention‐to‐treat analysis | |
| All T, all N, M not reported | Pathological | Not reported | Not reported | 1644 days | Not reported | Up to 3403 days (˜9.3 years) | Unadjusted Cox model, no intention‐to‐treat analysis | |
| Primary tumour resection (all stages) with or without residual disease postoperatively | Not reported | Not reported | Not reported | Not reported | Not reported | Up to 17 years | Unadjusted HR (reported by the contact author through personal communication) |
IQR = interquartile range.
TNM classification of malignant tumours: T = tumour size, N = lymph node involvement, M = distant metastasis.
HR = hazard ratio.
SEHR = standard error of hazard ratio.
CI = confidence interval.
We contacted the corresponding authors of three included studies via email to clarify reported results or to ask for additional data. Two study authors replied and provided precise data clarification (Binczak 2013; Myles 2011). One study author did not respond to our inquiry (Tsui 2010).
Assessment of clinical heterogeneity
| Commonality | Differences |
| Adult participant population | Different types of tumours |
| Abdominal surgery for primary tumour resection | Different or unknown opioid regimens |
| Comparison: general anaesthesia versus general anaesthesia plus epidural analgesia | |
| Intervention: epidural catheter | |
| Epidural catheter placed before surgery and run intraoperatively | |
| Intraoperative and postoperative epidural opioids administered | |
| Balanced anaesthesia for maintenance during surgery |
Although the type of cancer broadly varies among and within the studies, all participants underwent abdominal surgery for tumour removal. This might indicate that the invasiveness of the surgical procedure was very similar. Given the clinical commonalities of the included studies, we deemed it appropriate to perform meta‐analyses.
Ongoing studies
We identified nine ongoing clinical trials registered at clinicaltrials.gov that potentially met inclusion criteria. Three trials investigated breast cancer recurrence, two trials each colon cancer and lung cancer recurrence and one trial each malignant melanoma recurrence and pancreatic cancer recurrence. Characteristics of ongoing trials are summarized under Characteristics of ongoing studies and in Table 4.
| Study PI | Start date (clinical trials.gov) | Population | Sample size | Intervention | Control group |
| 2007 | Female patients 18‐85 years of age, diagnosed with primary breast cancer without known extension beyond the breast and axillary nodes, scheduled for unilateral or bilateral mastectomy with or without implant or isolated "lumpectomy" with axillary node dissection (anticipated removal of at least 5 nodes) | 1100 | Regional anaesthesia and analgesia (epidural or paravertebral), combined with deep sedation or general anaesthesia (sevoflurane) | General anaesthesia (sevoflurane) followed by opioid administration | |
| 2008 | Patients scheduled for open, laparoscopic or laparoscopic‐assisted surgery for colon cancer without known extension beyond colon | 2500 | Intraoperative and postoperative regional anaesthesia and analgesia (epidural or paravertebral anaesthesia) plus intraoperative general anaesthesia | General anaesthesia followed by postoperative opioid analgesia | |
| 2009 | Female patients 21‐75 years of age, ASA I‐II, diagnosed with biopsy‐proven breast cancer, scheduled for mastectomy and axillary node dissection in a single procedure | 40 | Local anaesthesia + sedation | General anaesthesia | |
| 2010 | Male and female patients 18‐85 years of age, diagnosed with primary non‐small cell lung cancer and scheduled for potentially curative tumour resection | 1532 | Intraoperative and postoperative general anaesthesia + epidural anaesthesia and analgesia | General anaesthesia and postoperative intravenous analgesia | |
| 2010 | Female patients 18 years of age and older, undergoing unilateral or bilateral mastectomy | 60 | Postoperative paravertebral catheter analgesia with ropivacaine | Placebo (normal saline) | |
| 2011 | Male and female patients 40‐80 years of age, ASA I‐III, undergoing elective surgery for colorectal cancer | 300 | Epidural analgesia with ropivacaine and opioid | PCA with morphine | |
| 2011 | Male and female patients 25‐80 years of age, diagnosed with non‐small cell lung cancer with clinical staging of I or II for whom thoracoscopic lobectomy (VATS) is feasible | 100 | Intraoperative thoracic epidural anaesthesia | Intraoperative general anaesthesia | |
| 2012 | Patients scheduled for inguinal lymph node dissection because of malignant melanoma of the lower limb | 230 | Spinal anaesthesia | General anaesthesia | |
| 2013 | Male and female patients 20‐85 years of age with pancreatic cancer, expected to receive curative Whipple operation | 150 | Epidural analgesia with ropivacaine and opioid | PCA with opioid |
VATS = video‐assisted thoracic surgery.
ASA = American Society of Anesthesiologists physical status classification.
PCA = patient‐controlled analgesia.
Risk of bias in included studies
See Figure 2, Figure 3 and Characteristics of included studies.
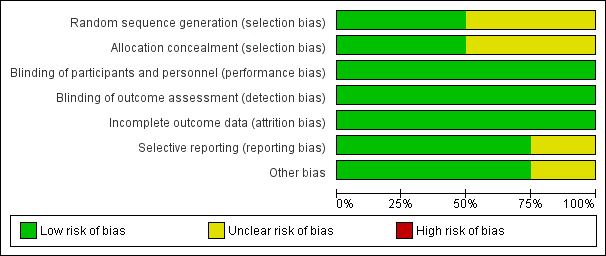
'Risk of bias' graph: review authors' judgements about each risk of bias item presented as percentages across all included studies.
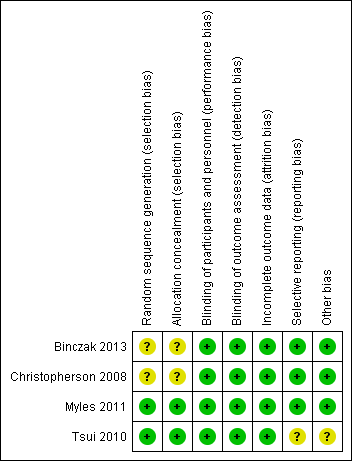
'Risk of bias' summary: review authors' judgements about each risk of bias item for each included study.
Allocation
Two studies describe a proper, concealed randomization and allocation process (Myles 2011; Tsui 2010). One study used an adaptive randomization scheme, but concealment of allocation was not described (Christopherson 2008). The authors of another study described the study as randomized without further elaboration (Binczak 2013).
One study described the randomization process for the full analysed cohort (Tsui 2010). The remaining three studies are secondary analyses of subgroups of previously published randomized controlled trials. Therefore, it can only be assumed that the analysed subgroups were evenly distributed despite proper randomization of the original trial. One study reported that the distribution of demographic and perioperative characteristics of the analysed subgroups was comparable, and it was judged as having low risk of selection bias, accordingly (Myles 2011). Two studies did not provide information on the distribution of perioperative characteristics within the analysed subgroups, and we deemed the risk of selection bias for these as unclear (Binczak 2013; Christopherson 2008).
Blinding
Blinding of participants and personnel was attempted in one trial with the placement of a subcutaneous sham catheter at the site where an epidural catheter could be found (Binczak 2013). Three other studies were not blinded to participants and personnel.
One of the included studies reported an attempt to blind the outcome assessment process by temporary removal of the treatment allocation from the data set (Tsui 2010). The three remaining studies did not comment on the blinding of the outcome assessor.
Given the well‐defined end points (OS, PFS, TTP), we deemed the risk low that lack of blinding could influence the outcome measurement.
Incomplete outcome data
All four studies described excluded participants appropriately. One study used intention‐to‐treat analysis (Myles 2011), and one study explicitly did not (Tsui 2010). The two remaining studies did not comment on intention‐to‐treat.
Selective reporting
For none of the four studies was a study protocol available. Two studies reported outcomes in accordance with their methods description (Binczak 2013; Christopherson 2008). One study reported a secondary outcome that was not mentioned and defined in the methods section (Myles 2011). Another study did not define its outcome variable without ambiguity (Tsui 2010). The outcome was named 'survival', 'disease‐free survival' and 'recurrence', and it remained unclear whether these terms were used interchangeably, or if only one of these outcomes was reported. Therefore, we judged the risk of reporting bias for this study as unclear.
Other potential sources of bias
We did not identify other sources of potential bias in two studies (Binczak 2013; Christopherson 2008). In two other studies, we noted a mismatch in the reported numbers of included participants across the published articles. We deemed this unlikely to introduce bias for one study because of the very small difference (Myles 2011) and judged the risk of bias as unclear for the other study (Tsui 2010).
In addition, the outcome definition of one study (Tsui 2010) did not exactly match the outcome definitions of our review. However, given a small actual difference, we did not expect this to add bias.
Effects of interventions
Intervention 1: general anaesthesia alone versus general anaesthesia combined with one or more regional anaesthetic techniques (summary of findings Table for the main comparison).
Primary outcomes
Overall survival (OS)
Three studies with a total of 647 participants reported OS (Binczak 2013; Christopherson 2008; Myles 2011). None of the single studies showed a difference between study groups. Pooled results of these three studies did not show a survival benefit for either study group in a fixed‐effect model (HR 1.03, 95% CI 0.86 to 1.24; Figure 4). Statistical heterogeneity did not reach the significance level (P value 0.21), and the level of inconsistency across studies was low (I2 = 36%). To address concerns on clinical heterogeneity, we repeated the analysis using a random‐effects model. The results changed only marginally (HR 1.02, 95% CI 0.78 to 1.34).
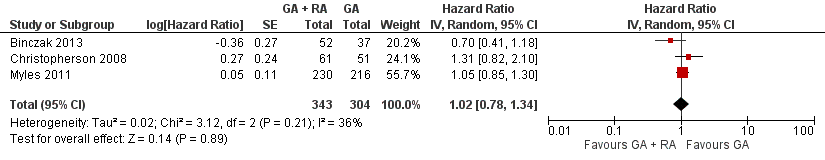
Forest plot of comparison: 1 general anaesthesia + regional anaesthesia (GA + RA) vs general anaesthesia (GA), outcome: 1.1 overall survival.
Progression‐free survival (PFS)
Two studies with a total of 535 participants reported PFS (Binczak 2013; Myles 2011). None of the single studies showed a difference between study groups. Pooled results of these studies showed a high level of heterogeneity and inconsistency (I2 = 64%, P value 0.10). We therefore pooled the results in a random‐effects model. The analysis did not show a survival benefit for either study group (HR 0.88, 95% CI 0.56 to 1.38; Figure 5). With only two studies included and no individual participant data available, subgroup analysis to further evaluate the source of heterogeneity was not feasible.
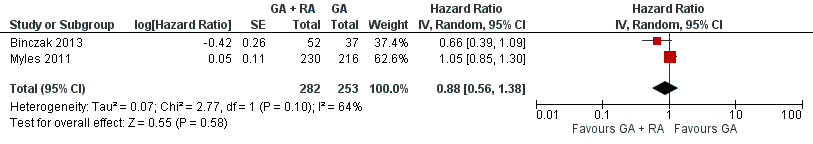
Forest plot of comparison: 1 general anaesthesia + regional anaesthesia (GA + RA) vs general anaesthesia (GA), outcome: 1.2 progression‐free survival.
Time to tumour progression (TTP)
Two studies with a total of 545 participants reported TTP (Myles 2011; Tsui 2010). None of the single studies showed a difference between study groups. Pooled results of these studies just reached the significance level in favour of the control group in a fixed‐effect model (HR 1.50, 95% CI 1.00 to 2.25; Figure 6). Statistical heterogeneity did not reach the significance level (P value 0.70), and the level of inconsistency across studies was I2 = 0%. The results did not change in a random‐effects model analysis (HR 1.50, 95% CI 1.00 to 2.25).
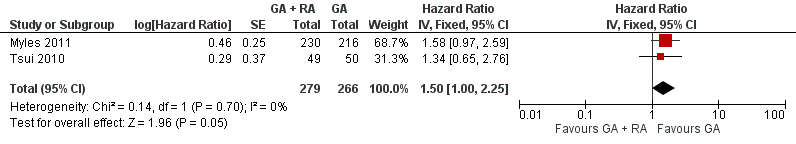
Forest plot of comparison: 1 general anaesthesia + regional anaesthesia (GA + RA) vs general anaesthesia (GA), outcome: 1.3 time to tumour progression.
Intervention 2: general anaesthesia combined with one or more regional anaesthetic techniques versus one or a combination of regional anaesthetic techniques.
We identified no trials investigating this comparison.
Intervention 3: general anaesthesia alone versus one or more regional anaesthetic techniques.
We identified no trials investigating this comparison.
Secondary outcomes
Postoperative adverse events including failed epidural catheter placement, PONV, postoperative respiratory complications and postoperative cardiac complications were reported only sparsely. In one study, epidural placement failed in two of 51 participants assigned to the epidural group. Both were excluded from the study and from the analysis (Tsui 2010). The same study reported one participant with postdural puncture headache postoperatively and one participant with postoperative ST depressions in the epidural group. Another study noted that epidural catheter placement was not always possible, but the study did not provide numbers on the failure rate (Myles 2011). Because of lack of data, no further analysis was performed on secondary outcomes.
Discussion
Summary of main results
Only three of four included studies contributed to the outcome of overall survival (OS) (Binczak 2013; Christopherson 2008; Myles 2011), and two each to the outcomes of progression‐free survival (PFS) (Binczak 2013; Myles 2011) and time to tumour progression (TTP) (Myles 2011; Tsui 2010). In our meta‐analysis, we could find no advantage for either study group for the outcomes of OS and PFS. Pooled results for the outcome of PFS showed a high level of inconsistency and heterogeneity. One possible explanation could be the interaction of risk factors that was not controlled for in the RCTs (i.e. opioid administration regimen and/or type of tumour).
Pooled data for TTP showed a slightly favourable outcome for the control group (general anaesthesia alone) compared with the intervention group (epidural and general anaesthesia). However, only two studies are included, and confidence intervals are wide. We therefore interpret these results very cautiously and would not derive clinical recommendations from these data at this point.
Overall completeness and applicability of evidence
All four identified studies are secondary data analyses of previous randomized controlled trials. Although we judged the quality of all included randomized trials and the following secondary data analyses as moderate, this study design has important limitations. All studies indeed compared regional anaesthesia techniques versus general anaesthesia in accordance with our inclusion criteria. However, regional anaesthesia techniques are meant to be only a surrogate for three important factors that might influence long‐term outcomes after cancer surgery: (1) reduction in or avoidance of anaesthetics, especially volatile anaesthetics; (2) reduction in or avoidance of opioid analgesics; and (3) reduction in or avoidance of surgical stress. In all four trials, both study groups received volatile anaesthetics in a comparable fashion, most often isoflurane, and the study design allowed for opioid administration in both study groups. The study reports do suggest that the total quantity of opioids was less in the regional anaesthesia group, but no study actually reported real‐time numbers on opioid consumption and comparisons between study groups (Table 2; Myles 2011). Moreover, the protocol of all four studies allowed for epidural opioid administration in the intervention group perioperatively. Preliminary retrospective data in patients undergoing surgery for pancreatic cancer suggest the possibility that large amounts of epidural opioids might worsen long‐term survival (Alexander 2009; Kienbaum 2010).
In addition, type of cancer was considerably different within as well as between studies. Characteristics of different types of cancer such as aggressiveness, natural course and affected patient population might be so different that the fusion of those into a single set of data might blur the results significantly.
We therefore established that currently available data prove only lack of evidence. RCTs are sparse, and the study designs of available RCTs are not ideal for illuminating the underlying hypothesis.
Quality of the evidence
The GRADE approach considers the domains risk of bias (methodological quality), directness of evidence, heterogeneity, precision of effect estimates and risk of publication bias to assess the quality of evidence. We graded the quality of evidence as low for the outcome OS because of serious imprecision and serious indirectness. For PFS we graded the quality of evidence as very low because of serious imprecision, serious indirectness and serious inconsistency and for TTP we graded the quality of evidence as very low because of serious imprecision, serious indirectness and serious risk of bias (Summary of findings table 1).
We downgraded all three outcomes in the domain of precision because of a small sample size in relation to the expected effect size and also in the domain of directness because the proposed surrogate measure regional anaesthetic techniques did not in fact truly reflect the three possible pathways of how the intervention might work (see How the intervention might work). In detail, all study patients received volatile anaesthetics and none of the included studies reported complete data on perioperative opioid administration in each study group. In addition, we downgraded PFS for serious inconsistency based on the unexplained heterogeneity, and TTP for serious risk of bias (see Risk of bias in included studies).
Potential biases in the review process
The type of cancer was not specified in two of the four studies, and the remaining studies included participants with colorectal cancer or prostate cancer. Different types of cancer can have a very different biology and natural course. Therefore, a possible effect of anaesthetic technique on tumour recurrence is better investigated with stratification according to type of tumour and tumour stage. Current data do not allow for subgroup analysis according to type of cancer.
Data on perioperative opioid management were not available for any of the included studies. However, all four studies administered opioids to both study groups. Given the immunosuppressive effects of opioids (see Background section), the quantity of opioids administered might be a highly relevant factor influencing tumour recurrence. We based the rationale of this review on the assumption that a regional anaesthetic technique would reduce the amount of administered opioid considerably. However, this assumption could not be quantified with the current data. Moreover, in all studies, both study groups received a balanced general anaesthesia with comparable administration of volatile anaesthetics. Consequently, the immunosuppressive effects of volatile anaesthetics (see How the intervention might work) cannot be investigated using this study design. Therefore, the results of this review are based on incomplete data and might only provide direction for further research rather than clinical recommendations.
Agreements and disagreements with other studies or reviews
The effect of the anaesthetic technique on tumour recurrence has been discussed intensely in the literature over recent years. The hypothesis that the anaesthesiologist could influence long‐term outcomes after cancer surgery seemed obvious based on the scientific findings of in vitro and animal studies. Although the first encouraging clinical reports date back to the 1990s (Schlagenhauff 2000; Seebacher 1990), the retrospective analysis performed by Exadaktylos and colleagues in 2006 received major attention and, as of 2013, was cited more than 160 times in the literature (Exadaktylos 2006). Our comprehensive literature search until December 2013 revealed no prospective RCTs with the primary outcome of tumour recurrence at the date the study was performed. We identified four secondary data analyses of RCTs previously conducted on other outcomes.
In addition, our search yielded 21 non‐randomized retrospective studies. Type of cancer, type of surgery, type of intervention(s), outcome measures and definitions, as well as statistical analysis, vary broadly, and so do the results. We summarize characteristics of the non‐randomized studies in Table 5. Overall, 10 non‐randomized studies report some positive effects of regional anaesthesia techniques on tumour recurrence, often only for a subgroup of the participant population or for one of two or more outcome measures. Three studies report negative effects of regional anaesthesia techniques on tumour recurrence, and eight studies found no significant correlation of anaesthesia techniques and tumour recurrence.
| Author year | Type of cancer | Type of surgery | Intervention 1 (n) | Intervention 2 (n) | Control (n) | Endpoint | Statistical method | Result* | Date of surgery | Follow‐up until |
| Breast CA | Mastectomy + LND | GA + paravertebral catheter (50) | ‐ | GA (79) | Time to tumour recurrence (local or metastasis) | Adjusted Cox regression | HR 0.21 (0.06‐0.71) | 2001‐2002 | 2005 | |
| Cervical CA | First brachytherapy (of several) | SPA or EC (63) | ‐ | GA (69) | 1. Time to tumour recurrence 2. Overall survival | Adjusted Cox regression | 1. HR 0.95 (0.54‐1.67) 2. HR 1.46 (0.81‐2.61) | 1996‐2003 | nr | |
| Colon CA | Colorectal cancer surgery (open) | GA + EC preop (302) | ‐ | GA (58) | Overall mortality | Adjusted Cox regression with stratification on propensity score | HR 0.82 (0.30‐2.19) | 2004‐2009 | 2009 | |
| Rectal CA | Colorectal cancer surgery (open) | GA + EC preop (260) | ‐ | GA (35) | Overall mortality | Adjusted Cox regression with stratification on propensity score | HR 0.45 (0.22‐0.90) | 2004‐2009 | 2009 | |
| Vogelaar 2012 (abstract) | Colon CA | Surgery for colon CA | EC 'perioperative' (407) | ‐ | GA (198) | Overall survival | Adjusted Cox regression | HR 0.93 (0.93‐0.98) | 1995‐2003 | 2011 |
| (abstract) | Colon CA | Primary colon surgery | GA + EC (182) | ‐ | GA (931) | Tumour recurrence | Univariable | HR 1.33 (0.94‐1.87) | 2001‐2006 | 2009 |
| Colorectal CA | Colorectal cancer surgery | GA + EC preop (256) | ‐ | GA (253) | Time to tumour recurrence | Adjusted Cox model with stratification on propensity score quintiles | HR 0.74 (0.45‐1.22) | 2000‐2007 | 2008 | |
| Colorectal CA w/no metastases | Open colectomy | EC (Medicare code) (9670) | ‐ | No EC (Medicare code) (32481) | 1. Overall survival 2. 4‐Year tumour recurrence | 1. Adjusted marginal Cox model with propensity score as co‐variate 2. Adjusted logistic regression | 1. HR 0.92 (0.88‐0.96) 2. OR 1.05 (0.95‐1.15) | 1996‐2005 | 2009 | |
| Colorectal CA | Laparoscopic resection | EC preop (107) | SPA (144) | GA + PCA (173) | 1. Overall survival 2. Disease‐free survival | KM estimate, log‐rank test | 1. P value 0.622 2. P value 0.490 | 2003‐2010 | ||
| Hepatocellular CA | Percutaneous radiofrequency ablation | GA + EC preop (62) | ‐ | GA (117) | 1. Recurrence‐free survival 2. Overall survival | Adjusted Cox model with propensity score as co‐variate | 1. 3.66 (2.59‐5.15) 2. 0.77 (0.50‐1.18) | 1999‐2008 | 2011 | |
| Malignant melanoma | Lymph node dissection | SPA (52) | ‐ | GA (221) | Long‐term survival | Mean survival (months) of matched pairs (52 pairs) | 95.9 (81.2‐110.5) SPA 70.4 (53.6‐87.1) GA P value 0.087 | 1998‐2005 | 2009 | |
| Malignant melanoma | Melanoma resection | Local anaesthesia (376) | ‐ | GA (190) | Survival | KM estimate, log‐rank test | P value 0.51 (stage pT1/2, n = 237) P value 0.006 (stage pT3a, n = 195) in favour of local anaesthesia P value 0.47 (stage pT3b/4, n = 134) | Control: 1972‐1980 Intervention: 1981‐88 | 1988 | |
| Malignant melanoma w/no metastases | Primary melanoma excision | Local anaesthesia (2185) | ‐ | GA (2136) | Survival | Log‐rank test on matched pairs (1501 pairs) | P value < 0.01 in favour of local anaesthesia | 1976‐1986 | nr | |
| Ovarian CA | Surgery for ovarian cancer | GA + EC preop (26) | GA intraop/EC postop (29) | GA (127) | 1. Overall survival 2. Time to recurrence | 1. Median survival time (months), log‐rank test 2. Adjusted Cox model | 1. 71 m (62‐80) for GA 96 m (84‐109) for EC intraop 70 m (58‐83) for EC postop P value 0.01 for GA vs EC intraop (favours EC intraop) 2. HR 0.37 (0.19‐0.73) for intraop EC HR 0.86 (0.52‐1.41) for postop EC | 2000‐2006 | 2009 | |
| Ovarian CA | Surgery for ovarian cancer | EC only preop (106) | ‐ | GA (37) | Survival time | Adjusted Cox regression on propensity matched pairs (29 pairs) | HR 0.83 (0.67‐0.99) | 1994‐2006 | 2008 | |
| (abstract) | Ovarian CA | Primary radical tumour debulking | EC preop + GA (72) | GA (33) | 1. Recurrence‐free survival 2. Overall survival | KM estimate, log‐rank test | 1. HR 1.52 (1.4‐1.56), P value 0.008 2. nr | 2003‐2010 | nr | |
| Ovarian cancer (Figo IIIc‐IV) | Exploratory laparotomy | EC preop or postop + GA (37) | GA (43) | 1. Time to recurrence 2. Cancer‐specific survival | Adjusted Cox regression with propensity score weighting | 1. HR 0.65 (0.40‐1.08) 2. HR 0.59 (0.32‐1.08) | 2000‐2011 | nr | ||
| Kienbaum 2010/Alexander 2009 (abstracts) | Pancreatic CA | Radical pancreatic tumour resection | GA + EC (71) | ‐ | GA (29) | Overall survival | Log‐rank | P value 0.05 (P value 0.025 in favour of control for participants receiving high‐dose epidural opioids) | 2005‐2008 | nr |
| Prostate CA | Open radical prostatectomy | GA + EC preop (102) | ‐ | GA (123) | BCR‐free survival | Univariable Cox regression on propensity matched pairs (71 pairs) | HR 0.48 (0.23‐1.00) | 1994‐2003 | 2006 | |
| Prostate CA w/no metastasis | Radical prostatectomy | GA + EC preop (578) | ‐ | GA (533) | BCR‐free survival | Adjusted Cox model | HR 0.84 (0.52‐1.17) | 1993‐2006 | 2006 | |
| Prostate CA (all stages) | Open radical retropubic prostatectomy w/LND | GA + EC preop (103) | ‐ | GA (158) | 1. BCR‐free survival 2. Clinical progression‐free survival 3. Cancer‐specific survival 4. Overall survival | Adjusted Cox model with propensity score as co‐variate | 1. HR 0.82 (0.50‐1.34) 2. HR 0.40 (0.20‐0.79) 3. HR 0.95 (0.36‐2.47) 4. HR 1.01 (0.44‐2.32) | Intervention: 1994‐1997 Control: 1997‐2000 | nr | |
| Prostate CA (pT3/4) | Retropubic radical prostatectomy w/LND | GA + EC preop (67) | ‐ | GA (81) | 1. BCR‐free survival 2. Local recurrence‐free survival 3. Distant recurrence‐free survival 4. Cancer‐specific survival 5. Overall survival | Univariable Cox regression on matched pairs (67 pairs) | 1. HR 1.00 (0.69‐1.47) 2. HR 1.16 (0.41‐3.29) 3. HR 0.56 (0.26‐1.25) 4. HR 0.96 (0.45‐2.05) 5. HR 1.17 (0.63‐2.17) | 1994‐2000 | nr |
Several statistical methods were used in most studies. We weighted reported results in the following descending order: adjusted regression with propensity score or matched pairs, adjusted regression, univariable analysis. Only the highest weighted analysis is reported in the table.
HR = hazard ratio, defined as intervention/control.
*HR < 1 denotes advantage for the intervention group, HR > 1 denotes advantage for the control group. We adjusted the HR derived from individual trials accordingly, as needed.
bold font denotes significant results in favour of the intervention group (EC).
italic font denotes significant results in favour of the control group (GA).
CA = cancer.
pT = pathological tumour staging.
EC = epidural catheter.
SPA = spinal anaesthesia.
GA = general anaesthesia.
LND = lymph node dissection.
preop = preoperatively.
postop = postoperatively.
n = number of participants.
OR = odds ratio.
n.s. = non‐significant.
BCR = biochemical recurrence.
nr = not reported.
m = months.
We identified two meta‐analyses on the effects of anaesthesia technique on the risk of tumour recurrence (Chang 2011; Chen 2013). Both meta‐analyses pooled randomized and non‐randomized data; one included seven studies, and the other 14 studies. The meta‐analysis by Chang and colleagues (Chang 2011) did not find a significant difference overall between the effects of general anaesthesia versus general and epidural anaesthesia on tumour recurrence. The meta‐analysis by Chen and colleagues (Chen 2013) reported significant benefit of general and epidural anaesthesia versus general anaesthesia on overall survival but not on recurrence‐free survival. Further evaluation using subgroup analysis by study design showed that the benefit of regional anaesthesia for overall survival was evident in non‐randomized studies only, but no effect could be shown for randomized studies. This result is in accordance with those of our meta‐analysis on RCTs.

Study flow diagram.

'Risk of bias' graph: review authors' judgements about each risk of bias item presented as percentages across all included studies.

'Risk of bias' summary: review authors' judgements about each risk of bias item for each included study.

Forest plot of comparison: 1 general anaesthesia + regional anaesthesia (GA + RA) vs general anaesthesia (GA), outcome: 1.1 overall survival.

Forest plot of comparison: 1 general anaesthesia + regional anaesthesia (GA + RA) vs general anaesthesia (GA), outcome: 1.2 progression‐free survival.

Forest plot of comparison: 1 general anaesthesia + regional anaesthesia (GA + RA) vs general anaesthesia (GA), outcome: 1.3 time to tumour progression.

Comparison 1 GA + RA versus GA, Outcome 1 Overall survival.

Comparison 1 GA + RA versus GA, Outcome 2 Progression‐free survival.

Comparison 1 GA + RA versus GA, Outcome 3 Time to tumour progression.
| Epidural anaesthesia in addition to general anaesthesia compared with general anaesthesia alone for patients undergoing primary tumour surgery | |||||
| Patient or population: patients undergoing primary tumour surgery | |||||
| Outcomes | Illustrative comparative risks* (95% CI) | Relative effect† | Number of participants | Quality of the evidence | |
| Assumed risk | Corresponding risk | ||||
| General anaesthesia alone (control) | Epidural anaesthesia in addition to general anaesthesia (intervention) | ||||
| Death from all causes 7.8‐14.8 years (Myles) 8.3‐10.75 years (Christopherson) | Study population | HR 1.03 | 647 | ⊕⊕⊝⊝ | |
| 805 per 1000a | 815 per 1000 | ||||
| Tumour progression or death from all causes 7.8‐14.8 yearsd | Study population | HR 0.88 | 535 | ⊕⊝⊝⊝ | |
| 944 per 1000d | 921 per 1000 | ||||
| Tumour progression 4.5 yearsf | Study population | HR 1.50 | 545 | ⊕⊝⊝⊝ | |
| 360 per 1000g | 488 per 1000 | ||||
| *The basis for the assumed risk (e.g. median control group risk across studies) is provided in footnotes. The corresponding risk (and its 95% confidence interval) is based on the assumed risk in the comparison group and the relative effect of the intervention (and its 95% CI). | |||||
| GRADE Working Group grades of evidence. | |||||
| HR = hazard ratio, defined as intervention/control. †HR < 1 denotes advantage for the intervention group, HR > 1 denotes advantage for the control group. aThe assumed risk and the range of follow‐up times are based on data reported by Myles and Christophersen. Data on absolute events per group were not reported by Binczak. | |||||
| Number of participants | Recruitment site(s) | Age (years) | Male sex | ASA | Type of surgery | Outcome data derived from | |
| 112 | USA; multi‐centre | Control group: 69.1 ± 7.8 Epidural group: 68.6 ± 7.7 | Male only | IIIa | Elective surgery for colon cancer | Veterans Affairs Beneficiary Information and Records Locator System (VA BIRLS) | |
| 446 | Australia, East Asia, Middle East; multi‐centre (MASTERS trial) | Control group: 70 ± 11 Epidural group: 71 ± 9.5 | Control group: 53% Epidural group: 60% | 'High risk patients'b | Major abdominal surgery for cancer | 1. Medical hospital record 2. Contact with participant's general practitioner 3. State‐based cancer registry or National Health Index 4. Participant contact 5. Contact with next of kin | |
| 99 | Canada; single‐centre | Control group: 63.9 ± 6.1 Epidural group: 63.0 ± 5.5 | Male only | ASA I‐III | Radical prostatectomy and bilateral pelvic lymphadenectomy | Participant's hospital charts and medical records | |
| 89 | France; single‐centre | Not reported for subcohort (mean for full cohort 58 years) | Not reported for subcohort (full cohort includes > 62% male) | Not reported | Major abdominal surgery for cancer | 1. Hospital intern cancer registry 2. Participant contact 3. French National Registry | |
| ASA = American Society of Anesthesiologists physical status classification. USA = United States of America. aThe study by Christopherson 2008 reports that ASA I‐III patients were included. However, the original trial included only ASA III patients (Park 2001). bAccording to the inclusion criteria noted in the original study (Rigg 2002), 'high risk' translates to ASA II‐III. | |||||||
| GA maintenance | Epidural catheter level | Time placed | Duration | LA used | Epidural medications intraoperatively | Epidural medications postoperatively | Intraoperative IV opioids | Postoperative IV opioids | |
| Isoflurane 0.9% (mean) + N2O | Thoracic or lumbar epidural catheter | Preoperatively | "as long as needed" | Bupivacaine 0.5% | 3‐6 mg morphine; 25‐50 mg boluses bupivacaine/3‐5 hours as needed; epinephrine | 25‐50 mg boluses bupivacaine/3‐5 hours as needed; morphine 3‐6 mg/12‐24hours as needed | Fentanyl for both groups | Morphine, meperidine as needed (IV in epidural group, IV or IM in control group) | |
| Balanced anaesthesia (volatile anaesthetic not specified), N2O use not specified or recorded, but usual practice was to include it | At discretion of the anaesthesiologist "With the exception of some pelvic operations, all epidural catheters were inserted in the thoracic region" | Preoperatively | 3 days after surgery | Bupivacaine or ropivacaine | Bupivacaine or ropivacaine | Continuous infusion of ropivacaine or bupivacaine, supplemented with fentanyl or pethidine | Fentanyl pethidine | Postoperative opioids, mostly PCA in control group (fentanyl, pethidine) | |
| Isoflurane 1‐2% + N2O 60% | Low thoracic or high lumbar epidural catheter | Preoperatively | Not reported | Ropivacaine | Ropivacaine bolus + continuous infusion; fentanyl | Not reported | Morphine for control group | Not reported | |
| Isoflurane 1‐2% + N2O 70% | Thoracic 7‐11 | Preoperatively | Until 5th postoperative day | Bupivacaine | 50 mg bupivacaine as needed; epinephrine | 12.5 mg/h bupivacaine; 0.25 mg/h morphine | Fentanyl for both groups | Epidural group: morphine boluses SC as needed; control group: 2.5 mg/h morphine SC via catheter | |
| GA = general anaesthesia. LA = local anaesthetic. IV = intravenous. IM = intramuscular. SC = subcutaneous. | |||||||||
| Tumour stage (TNM) | Clinical vs pathologic staging | Median overall survival (95% CI) | Median progression‐free survival | Median time to tumour progression | 5‐Year survival | Follow‐up time | Statistical test used (uni‐ vs. multivariable) | |
| All T, N0, M0 | Pathological | 6.14 (5.22 to 7.99) | Not reported | Not reported | Not reported | Up to 9 years | Data extracted from Kaplan‐Meier curve; HR and SEHR calculated according to Tierney (Tierney 2007) | |
| All T, all N, no distant metastasis (M0) 'complete surgical excision' | Not reported | Epidural group: 3.3 (95% CI 2.1 to 4.5) Control group: 3.7 (95% 2.0 to 5.4) | Epidural group: 2.6 (IQR 0.7 to 8.7) Control group: 2.8 (IQR 0.7 to 8.7) | Epidural group: 1.1 (95% CI 0.7 to 1.6) Control group: 1.4 (95% CI 0.6 to 2.3) | Epidural group: 42% Control group: 44% | Up to 12 years | Univariable testing, log‐rank statistics, intention‐to‐treat analysis | |
| All T, all N, M not reported | Pathological | Not reported | Not reported | 1644 days | Not reported | Up to 3403 days (˜9.3 years) | Unadjusted Cox model, no intention‐to‐treat analysis | |
| Primary tumour resection (all stages) with or without residual disease postoperatively | Not reported | Not reported | Not reported | Not reported | Not reported | Up to 17 years | Unadjusted HR (reported by the contact author through personal communication) | |
| IQR = interquartile range. TNM classification of malignant tumours: T = tumour size, N = lymph node involvement, M = distant metastasis. HR = hazard ratio. SEHR = standard error of hazard ratio. CI = confidence interval. | ||||||||
| Study PI | Start date (clinical trials.gov) | Population | Sample size | Intervention | Control group |
| 2007 | Female patients 18‐85 years of age, diagnosed with primary breast cancer without known extension beyond the breast and axillary nodes, scheduled for unilateral or bilateral mastectomy with or without implant or isolated "lumpectomy" with axillary node dissection (anticipated removal of at least 5 nodes) | 1100 | Regional anaesthesia and analgesia (epidural or paravertebral), combined with deep sedation or general anaesthesia (sevoflurane) | General anaesthesia (sevoflurane) followed by opioid administration | |
| 2008 | Patients scheduled for open, laparoscopic or laparoscopic‐assisted surgery for colon cancer without known extension beyond colon | 2500 | Intraoperative and postoperative regional anaesthesia and analgesia (epidural or paravertebral anaesthesia) plus intraoperative general anaesthesia | General anaesthesia followed by postoperative opioid analgesia | |
| 2009 | Female patients 21‐75 years of age, ASA I‐II, diagnosed with biopsy‐proven breast cancer, scheduled for mastectomy and axillary node dissection in a single procedure | 40 | Local anaesthesia + sedation | General anaesthesia | |
| 2010 | Male and female patients 18‐85 years of age, diagnosed with primary non‐small cell lung cancer and scheduled for potentially curative tumour resection | 1532 | Intraoperative and postoperative general anaesthesia + epidural anaesthesia and analgesia | General anaesthesia and postoperative intravenous analgesia | |
| 2010 | Female patients 18 years of age and older, undergoing unilateral or bilateral mastectomy | 60 | Postoperative paravertebral catheter analgesia with ropivacaine | Placebo (normal saline) | |
| 2011 | Male and female patients 40‐80 years of age, ASA I‐III, undergoing elective surgery for colorectal cancer | 300 | Epidural analgesia with ropivacaine and opioid | PCA with morphine | |
| 2011 | Male and female patients 25‐80 years of age, diagnosed with non‐small cell lung cancer with clinical staging of I or II for whom thoracoscopic lobectomy (VATS) is feasible | 100 | Intraoperative thoracic epidural anaesthesia | Intraoperative general anaesthesia | |
| 2012 | Patients scheduled for inguinal lymph node dissection because of malignant melanoma of the lower limb | 230 | Spinal anaesthesia | General anaesthesia | |
| 2013 | Male and female patients 20‐85 years of age with pancreatic cancer, expected to receive curative Whipple operation | 150 | Epidural analgesia with ropivacaine and opioid | PCA with opioid | |
| VATS = video‐assisted thoracic surgery. ASA = American Society of Anesthesiologists physical status classification. PCA = patient‐controlled analgesia. | |||||
| Author year | Type of cancer | Type of surgery | Intervention 1 (n) | Intervention 2 (n) | Control (n) | Endpoint | Statistical method | Result* | Date of surgery | Follow‐up until |
| Breast CA | Mastectomy + LND | GA + paravertebral catheter (50) | ‐ | GA (79) | Time to tumour recurrence (local or metastasis) | Adjusted Cox regression | HR 0.21 (0.06‐0.71) | 2001‐2002 | 2005 | |
| Cervical CA | First brachytherapy (of several) | SPA or EC (63) | ‐ | GA (69) | 1. Time to tumour recurrence 2. Overall survival | Adjusted Cox regression | 1. HR 0.95 (0.54‐1.67) 2. HR 1.46 (0.81‐2.61) | 1996‐2003 | nr | |
| Colon CA | Colorectal cancer surgery (open) | GA + EC preop (302) | ‐ | GA (58) | Overall mortality | Adjusted Cox regression with stratification on propensity score | HR 0.82 (0.30‐2.19) | 2004‐2009 | 2009 | |
| Rectal CA | Colorectal cancer surgery (open) | GA + EC preop (260) | ‐ | GA (35) | Overall mortality | Adjusted Cox regression with stratification on propensity score | HR 0.45 (0.22‐0.90) | 2004‐2009 | 2009 | |
| Vogelaar 2012 (abstract) | Colon CA | Surgery for colon CA | EC 'perioperative' (407) | ‐ | GA (198) | Overall survival | Adjusted Cox regression | HR 0.93 (0.93‐0.98) | 1995‐2003 | 2011 |
| (abstract) | Colon CA | Primary colon surgery | GA + EC (182) | ‐ | GA (931) | Tumour recurrence | Univariable | HR 1.33 (0.94‐1.87) | 2001‐2006 | 2009 |
| Colorectal CA | Colorectal cancer surgery | GA + EC preop (256) | ‐ | GA (253) | Time to tumour recurrence | Adjusted Cox model with stratification on propensity score quintiles | HR 0.74 (0.45‐1.22) | 2000‐2007 | 2008 | |
| Colorectal CA w/no metastases | Open colectomy | EC (Medicare code) (9670) | ‐ | No EC (Medicare code) (32481) | 1. Overall survival 2. 4‐Year tumour recurrence | 1. Adjusted marginal Cox model with propensity score as co‐variate 2. Adjusted logistic regression | 1. HR 0.92 (0.88‐0.96) 2. OR 1.05 (0.95‐1.15) | 1996‐2005 | 2009 | |
| Colorectal CA | Laparoscopic resection | EC preop (107) | SPA (144) | GA + PCA (173) | 1. Overall survival 2. Disease‐free survival | KM estimate, log‐rank test | 1. P value 0.622 2. P value 0.490 | 2003‐2010 | ||
| Hepatocellular CA | Percutaneous radiofrequency ablation | GA + EC preop (62) | ‐ | GA (117) | 1. Recurrence‐free survival 2. Overall survival | Adjusted Cox model with propensity score as co‐variate | 1. 3.66 (2.59‐5.15) 2. 0.77 (0.50‐1.18) | 1999‐2008 | 2011 | |
| Malignant melanoma | Lymph node dissection | SPA (52) | ‐ | GA (221) | Long‐term survival | Mean survival (months) of matched pairs (52 pairs) | 95.9 (81.2‐110.5) SPA 70.4 (53.6‐87.1) GA P value 0.087 | 1998‐2005 | 2009 | |
| Malignant melanoma | Melanoma resection | Local anaesthesia (376) | ‐ | GA (190) | Survival | KM estimate, log‐rank test | P value 0.51 (stage pT1/2, n = 237) P value 0.006 (stage pT3a, n = 195) in favour of local anaesthesia P value 0.47 (stage pT3b/4, n = 134) | Control: 1972‐1980 Intervention: 1981‐88 | 1988 | |
| Malignant melanoma w/no metastases | Primary melanoma excision | Local anaesthesia (2185) | ‐ | GA (2136) | Survival | Log‐rank test on matched pairs (1501 pairs) | P value < 0.01 in favour of local anaesthesia | 1976‐1986 | nr | |
| Ovarian CA | Surgery for ovarian cancer | GA + EC preop (26) | GA intraop/EC postop (29) | GA (127) | 1. Overall survival 2. Time to recurrence | 1. Median survival time (months), log‐rank test 2. Adjusted Cox model | 1. 71 m (62‐80) for GA 96 m (84‐109) for EC intraop 70 m (58‐83) for EC postop P value 0.01 for GA vs EC intraop (favours EC intraop) 2. HR 0.37 (0.19‐0.73) for intraop EC HR 0.86 (0.52‐1.41) for postop EC | 2000‐2006 | 2009 | |
| Ovarian CA | Surgery for ovarian cancer | EC only preop (106) | ‐ | GA (37) | Survival time | Adjusted Cox regression on propensity matched pairs (29 pairs) | HR 0.83 (0.67‐0.99) | 1994‐2006 | 2008 | |
| (abstract) | Ovarian CA | Primary radical tumour debulking | EC preop + GA (72) | GA (33) | 1. Recurrence‐free survival 2. Overall survival | KM estimate, log‐rank test | 1. HR 1.52 (1.4‐1.56), P value 0.008 2. nr | 2003‐2010 | nr | |
| Ovarian cancer (Figo IIIc‐IV) | Exploratory laparotomy | EC preop or postop + GA (37) | GA (43) | 1. Time to recurrence 2. Cancer‐specific survival | Adjusted Cox regression with propensity score weighting | 1. HR 0.65 (0.40‐1.08) 2. HR 0.59 (0.32‐1.08) | 2000‐2011 | nr | ||
| Kienbaum 2010/Alexander 2009 (abstracts) | Pancreatic CA | Radical pancreatic tumour resection | GA + EC (71) | ‐ | GA (29) | Overall survival | Log‐rank | P value 0.05 (P value 0.025 in favour of control for participants receiving high‐dose epidural opioids) | 2005‐2008 | nr |
| Prostate CA | Open radical prostatectomy | GA + EC preop (102) | ‐ | GA (123) | BCR‐free survival | Univariable Cox regression on propensity matched pairs (71 pairs) | HR 0.48 (0.23‐1.00) | 1994‐2003 | 2006 | |
| Prostate CA w/no metastasis | Radical prostatectomy | GA + EC preop (578) | ‐ | GA (533) | BCR‐free survival | Adjusted Cox model | HR 0.84 (0.52‐1.17) | 1993‐2006 | 2006 | |
| Prostate CA (all stages) | Open radical retropubic prostatectomy w/LND | GA + EC preop (103) | ‐ | GA (158) | 1. BCR‐free survival 2. Clinical progression‐free survival 3. Cancer‐specific survival 4. Overall survival | Adjusted Cox model with propensity score as co‐variate | 1. HR 0.82 (0.50‐1.34) 2. HR 0.40 (0.20‐0.79) 3. HR 0.95 (0.36‐2.47) 4. HR 1.01 (0.44‐2.32) | Intervention: 1994‐1997 Control: 1997‐2000 | nr | |
| Prostate CA (pT3/4) | Retropubic radical prostatectomy w/LND | GA + EC preop (67) | ‐ | GA (81) | 1. BCR‐free survival 2. Local recurrence‐free survival 3. Distant recurrence‐free survival 4. Cancer‐specific survival 5. Overall survival | Univariable Cox regression on matched pairs (67 pairs) | 1. HR 1.00 (0.69‐1.47) 2. HR 1.16 (0.41‐3.29) 3. HR 0.56 (0.26‐1.25) 4. HR 0.96 (0.45‐2.05) 5. HR 1.17 (0.63‐2.17) | 1994‐2000 | nr | |
| Several statistical methods were used in most studies. We weighted reported results in the following descending order: adjusted regression with propensity score or matched pairs, adjusted regression, univariable analysis. Only the highest weighted analysis is reported in the table. HR = hazard ratio, defined as intervention/control. *HR < 1 denotes advantage for the intervention group, HR > 1 denotes advantage for the control group. We adjusted the HR derived from individual trials accordingly, as needed. bold font denotes significant results in favour of the intervention group (EC). italic font denotes significant results in favour of the control group (GA). CA = cancer. pT = pathological tumour staging. EC = epidural catheter. SPA = spinal anaesthesia. GA = general anaesthesia. LND = lymph node dissection. preop = preoperatively. postop = postoperatively. n = number of participants. OR = odds ratio. n.s. = non‐significant. BCR = biochemical recurrence. nr = not reported. m = months. | ||||||||||
| Outcome or subgroup title | No. of studies | No. of participants | Statistical method | Effect size |
| 1 Overall survival Show forest plot | 3 | 647 | Hazard Ratio (Random, 95% CI) | 1.02 [0.78, 1.34] |
| 2 Progression‐free survival Show forest plot | 2 | 535 | Hazard Ratio (Random, 95% CI) | 0.88 [0.56, 1.38] |
| 3 Time to tumour progression Show forest plot | 2 | 545 | Hazard Ratio (Fixed, 95% CI) | 1.50 [1.00, 2.25] |