| 1 The mean change of total recall on the Selective Reminding Test (SRT) from baseline Show forest plot | 2 | 189 | Mean Difference (IV, Random, 95% CI) | 1.68 [‐2.21, 5.58] |
|
| 2 The mean total recall on the Selective Reminding Test (SRT) at exit Show forest plot | 2 | 189 | Mean Difference (IV, Random, 95% CI) | 1.23 [‐3.07, 5.53] |
|
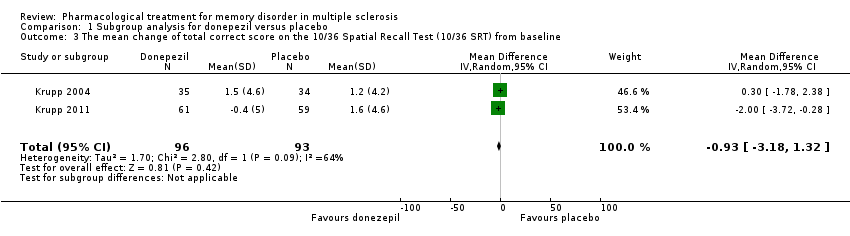
| 3 The mean change of total correct score on the 10/36 Spatial Recall Test (10/36 SRT) from baseline Show forest plot | 2 | 189 | Mean Difference (IV, Random, 95% CI) | ‐0.93 [‐3.18, 1.32] |
|
| 4 The mean total correct score on the 10/36 Spatial Recall Test (10/36 SRT) at exit Show forest plot | 2 | 189 | Mean Difference (IV, Random, 95% CI) | 0.29 [‐2.64, 3.23] |
|
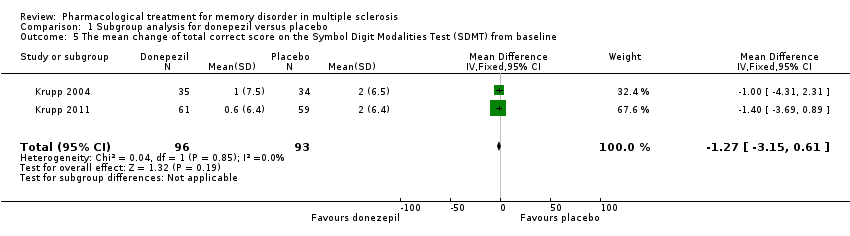
| 5 The mean change of total correct score on the Symbol Digit Modalities Test (SDMT) from baseline Show forest plot | 2 | 189 | Mean Difference (IV, Fixed, 95% CI) | ‐1.27 [‐3.15, 0.61] |
|
| 6 The mean total correct score on the Symbol Digit Modalities Test (SDMT) at exit Show forest plot | 2 | 189 | Mean Difference (IV, Fixed, 95% CI) | 1.15 [‐2.71, 5.01] |
|
| 7 The mean change of total correct score on the Paced Auditory Serial Addition Test (PASAT) (2+3 sec) from baseline Show forest plot | 2 | 189 | Mean Difference (IV, Random, 95% CI) | 2.23 [‐1.87, 6.33] |
|
| 8 The mean total correct score on the Paced Auditory Serial Addition Test (PASAT) (2+3 sec) at exit Show forest plot | 2 | 189 | Mean Difference (IV, Fixed, 95% CI) | 5.41 [‐1.42, 12.23] |
|
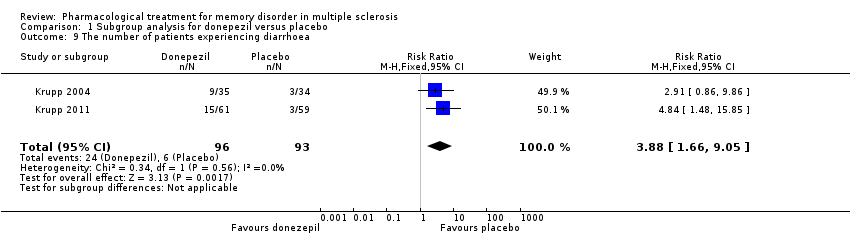
| 9 The number of patients experiencing diarrhoea Show forest plot | 2 | 189 | Risk Ratio (M‐H, Fixed, 95% CI) | 3.88 [1.66, 9.05] |
|
| 10 The number of patients experiencing diarrhoea Show forest plot | 2 | 189 | Odds Ratio (M‐H, Fixed, 95% CI) | 4.84 [1.87, 12.51] |
|
| 11 The number of patients experiencing nausea Show forest plot | 2 | 189 | Risk Ratio (M‐H, Fixed, 95% CI) | 1.71 [0.93, 3.18] |
|
| 12 The number of patients experiencing nausea Show forest plot | 2 | 189 | Odds Ratio (M‐H, Fixed, 95% CI) | 1.94 [0.92, 4.12] |
|
| 13 The number of patients experiencing abnormal dreams Show forest plot | 2 | 189 | Risk Ratio (M‐H, Fixed, 95% CI) | 2.91 [1.38, 6.14] |
|
| 14 The number of patients experiencing abnormal dreams Show forest plot | 2 | 189 | Odds Ratio (M‐H, Fixed, 95% CI) | 3.55 [1.50, 8.37] |
|