L’agomélatine par rapport à d'autres agents antidépresseurs pour la dépression majeure
Résumé scientifique
Contexte
Le trouble dépressif majeur (TDM), ou la dépression, est un syndrome caractérisé par un certain nombre de caractéristiques comportementales, cognitives et émotionnelles. Il est le plus souvent associé à une humeur dépressive ou triste, une capacité réduite à éprouver du plaisir, un sentiment de désespoir, une perte d'énergie, des troubles du sommeil, un manque de concentration, des fluctuations de poids et des pensées suicidaires. Des antidépresseurs plus efficaces et mieux tolérés sont nécessaires pour lutter contre cette affection. L’agomélatine a récemment été ajoutée à la liste des médicaments antidépresseurs disponibles; il s’agit d’un nouvel antidépresseur qui fonctionne sur les récepteurs mélatoninergiques (MT 1 Et MT 2 ), 5 ‐HT 2 B Et 5 ‐HT 2 C . Du fait que le mécanisme d'action soit sensé être nouveau, il pourrait fournir une stratégie pharmacologique plus efficace comparée aux médicaments antidépresseurs existants.
Objectifs
L'objectif de cette revue était de 1) déterminer l'efficacité de l'agomélatine dans le soulagement des symptômes aigus du trouble dépressif majeur en comparaison avec d'autres antidépresseurs, 2) examiner l'acceptabilité de l’agomélatine en comparaison avec d'autres médicaments et 3) examiner les effets indésirables de l’agomélatine, y compris la prévalence générale des effets secondaires chez l'adulte.
Stratégie de recherche documentaire
Nous avons effectué des recherches dans le registre spécialisé du groupe de la Collaboration Cochrane sur la dépression, l’anxiété et la névrose (CCDANTR) jusqu' au 31 juillet 2013. Le CCDANTR comprend des essais contrôlés randomisés pertinents issus des bases de données bibliographiques suivantes : CENTRAL (le registre Cochrane des essais contrôlés) (toutes les années), EMBASE (à partir de 1974), MEDLINE (à partir de 1950) et PsycINFO (à partir de 1967). Nous avons examiné les références bibliographiques des études pertinentes avec les revues et les rapports de l’organisme de règlementation. Aucune restriction concernant la date, la langue ou le statut de publication n'a été appliquée à la recherche. Les Laboratoires Servier (développeur de l’agomélatine) et d'autres experts dans le domaine ont été contactés pour obtenir des données supplémentaires.
Critères de sélection
Essais contrôlés randomisés chez des participants adultes atteints de dépression majeure pour comparer l’agomélatine par rapport à un autre antidépresseur.
Recueil et analyse des données
Deux auteurs de la revue ont indépendamment extrait les données et une procédure de double entrée a été utilisée. Les informations extraites comprenaient les caractéristiques des études, les caractéristiques des participants, les détails de l'intervention et les mesures de résultat en termes d'efficacité, d'acceptabilité et de tolérance.
Résultats principaux
Un total de 13 études (4 495 participants) a été inclus dans cette revue. L’agomélatine était comparée à des inhibiteurs sélectifs du recaptage de la sérotonine (ISRS), à savoir la paroxétine, la fluoxétine, la sertraline, l'escitalopram, ainsi qu’à l’inhibiteur puissant du recaptage de la sérotonine et de la noradrénaline (IRSN), la venlafaxine. Les participants ont été suivis pendant 6 à 12 semaines. L’agomélatine ne rapportait ni plus, ni moins d’effets bénéfiques ou néfastes par rapport aux autres antidépresseurs pour notre principal critère de jugement, la réponse au traitement (risque relatif (RR) 1,01, intervalle de confiance à 95% (IC) de 0,95 à 1,08, valeur P 0,75 par rapport aux ISRS, et RR 1,06; IC à 95% de 0,98 à 1,16, valeur P 0,16, par rapport à la venlafaxine). De même, l’agomélatine n'a démontré aucun avantage ou inconvénient par rapport à d'autres antidépresseurs pour la rémission (RR 0,83; IC à 95% de 0,68 à 1,01, valeur P 0,07 par rapport aux ISRS, et RR 1,08; IC à 95% 0,94 à 1,24, valeur P 0,73 par rapport à la venlafaxine). Dans l'ensemble, l’agomélatine semblait être mieux tolérée que la venlafaxine en termes de diminution des taux de sorties d'étude (RR 0,40; IC à 95% 0,24 à 0,67, valeur P 0,0005) et a montré le même niveau de tolérance que les ISRS (RR 0,95; IC à 95% 0,83 à 1,09, valeur P 0,44). L’agomélatine induit un taux plus faible d'étourdissements que la venlafaxine (RR 0,19, IC à 95% 0,06 à 0,64, valeur P 0,007).
En ce qui concerne la qualité de l'ensemble des preuves, il y avait un risque de biais modéré pour tous les critères de jugement, en raison du nombre d’études incluses non publiées. Il y avait une certaine hétérogénéité, en particulier entre les études publiées et non publiées. Les études incluses ont été menées dans des environnements hospitaliers et ambulatoires, limitant ainsi la possibilité de généraliser les résultats à des environnements de soins primaires. En ce qui concerne la précision, les résultats d'efficacité étaient précis, mais les critères de jugement sur la tolérance étaient généralement imprécis. Les biais de publication étaient variables et dépendaient du critère de jugement de l'essai. Notre revue a inclus des études non publiées et nous pensons que cela réduisait l'impact du biais de publication. La qualité méthodologique globale des études n'était pas très bonne. Presque toutes les études étaient parrainées par la société pharmaceutique fabriquant l’agomélatine (Servier) et certaines ont été publiées. Les tentatives de contact avec la société pharmaceutique Servier pour obtenir des informations supplémentaires sur toutes les études non publiées ont été infructueuses.
Conclusions des auteurs
L’agomélatine ne semble pas offrir d’avantage significatif en termes d'efficacité par rapport à d'autres agents antidépresseurs pour le traitement de la phase aiguë de la dépression majeure. L’agomélatine était mieux tolérée que la paroxétine et la venlafaxine pour l'ensemble des effets secondaires. De même, moins de participants traités à l'agomélatine abandonnaient les essais en raison d'effets secondaires par rapport à la sertraline et la venlafaxine, mais les données étaient limitées car le nombre d'études incluses était de petite taille. Nous avons trouvé des preuves qui comparaient l'agomélatine avec seulement un nombre restreint d'autres agents antidépresseurs actifs et il n'existe que quelques essais pour chaque comparaison, ce qui limite la possibilité de généraliser les résultats. De plus, la qualité méthodologique globale des études était faible. Par conséquent, aucune conclusion définitive ne peut être apportée concernant l'efficacité et la tolérance de l’agomélatine.
PICO
Résumé simplifié
L’agomélatine par rapport à d'autres médicaments antidépresseurs pour le traitement de la dépression
Pourquoi cette revue est‐elle importante?
La dépression majeure est une maladie grave qui peut entraîner une gêne significative chez les personnes qui en souffrent et leurs familles. La dépression majeure affecte la capacité des personnes à travailler, les relations et l'estime de soi. Elle affecte également les personnes physiquement suite à un changement dans leurs habitudes de sommeil et à une perte d'appétit. Les symptômes de la dépression majeure peuvent amener les patients à se sentir désespérés et même suicidaires. Les médicaments antidépresseurs sont une option de traitement efficace pour la dépression majeure, mais beaucoup souffrent d’effets secondaires désagréables.
Cette revue est importante, car elle compare un nouvel antidépresseur, appelé agomélatine, par rapport à d'autres antidépresseurs utilisés pour traiter la dépression majeure. L’agomélatine fonctionne différemment comparée aux antidépresseurs existants, elle affecte l'hormone mélatonine dans le cerveau et stimule la libération de substances chimiques dans le cerveau, la dopamine et la noradrénaline.
Qui pourraient être intéressés par cette revue?
Les personnes touchées par la dépression majeure.
Les médecins généralistes, les psychiatres et les pharmaciens.
Les professionnels travaillant dans des services de santé mentale pour adultes.
La famille et les amis des personnes qui souffrent de dépression majeure.
Quelles sont les questions de cette revue ?
L’agomélatine est‐elle plus efficace que les autres médicaments antidépresseurs ?
Les patients tolèrent‐ils mieux l’agomélatine par rapport aux autres antidépresseurs ?
Quels sont les effets secondaires de l’agomélatine comparée à d'autres antidépresseurs?
Quelles études ont été incluses dans la revue ?
En juillet 2013, nous avons utilisé les bases de données médicales électroniques pour trouver tous les essais médicaux publiés et non publiés qui comparaient l'agomélatine à n'importe quel autre antidépresseur. Nous avons également contacté les Laboratoires Servier (le développeur de l’agomélatine) pour obtenir des informations supplémentaires. Pour être inclus dans la revue, les essais médicaux devaient avoir un plan randomisé (c'est‐à‐dire être essais contrôlés randomisés), regroupant des participants adultes (âgés de plus de 18) atteints d’une dépression majeure.
Nous avons identifié 13 essais médicaux, impliquant un total de 4 495 participants, qui ont pu être inclus dans la revue. Les examinateurs ont évalué la qualité globale des essais comme «modérée». Presque tous les essais inclus étaient parrainés par le laboratoire pharmaceutique qui a développé l’agomélatine (Servier), ce qui pourrait entrainer des biais (les recherches démontrent que le financement affecte fortement les résultats des études).
Que nous apportent les preuves de la revue ?
La revue a inclus les essais comparant l’agomélatine à un groupe sous antidépresseurs appelés inhibiteurs sélectifs du recaptage de la sérotonine (ISRS) et à un antidépresseur du groupe sous venlafaxine, un inhibiteur puissant du recaptage de la sérotonine et de la noradrénaline. Les participants ont été suivis pendant 6 à 12 semaines.
‐ L’agomélatine n'était ni plus, ni moins efficace lorsque comparée aux autres antidépresseurs pour réduire les symptômes de dépression.
‐ L’agomélatine n'était ni plus, ni moins efficace lorsque comparée à tout autre antidépresseur dans la prévention des rechutes de la dépression.
‐ L’agomélatine était mieux tolérée que la venlafaxine (moins de patients arrêtaient le traitement), mais équivalait aux ISRS.
‐ L’agomélatine causait un taux plus faible d'étourdissements que la venlafaxine.
‐ L’agomélatine causait un taux plus faible de vomissements, de nausées et d’effets secondaires que les ISRS.
Que se passe‐t‐il ensuite ?
Les évaluateurs ont conclu que l’agomélatine n'est pas plus efficace que d'autres antidépresseurs actuellement sur le marché. Les patients semblaient mieux la tolérer en termes de diminution de certains effets secondaires. Cependant, la qualité des essais était faible et seulement quelques essais comparaient l'agomélatine avec chaque médicament. Aucune conclusion définitive sur l’agomélatine ne peut être émise en raison de problèmes liés à la consignation des données dans les essais inclus. Les auteurs recommandent que d'autres essais de l’agomélatine versus le placebo (pilule factice), en particulier dans des environnements de soins primaires (où la majorité des contacts entre les patients/médecins généralistes sont réalisés, tels que dans les cabinets médicaux), doivent être réalisés pour améliorer la qualité des preuves.
Authors' conclusions
Summary of findings
| Agomelatine compared to SSRI for major depression | ||||||
| Patient or population: patients with major depression | ||||||
| Outcomes | Illustrative comparative risks* (95% CI) | Relative effect | No of Participants | Quality of the evidence | Comments | |
| Assumed risk | Corresponding risk | |||||
| SSRI | Agomelatine | |||||
| Response rates | Study population | RR 1.01 | 3826 | ⊕⊝⊝⊝ | ||
| 610 per 1000 | 616 per 1000 | |||||
| Moderate | ||||||
| 557 per 1000 | 563 per 1000 | |||||
| Remission rates | Study population | RR 0.83 | 3826 | ⊕⊝⊝⊝ | Most of the difference in heterogeneity existed between published and unpublished studies | |
| 363 per 1000 | 302 per 1000 | |||||
| Moderate | ||||||
| 264 per 1000 | 219 per 1000 | |||||
| Total drop outs | Study population | RR 0.95 | 3826 | ⊕⊝⊝⊝ | ||
| 189 per 1000 | 180 per 1000 | |||||
| Moderate | ||||||
| 188 per 1000 | 179 per 1000 | |||||
| Drop out due to inefficacy | Study population | RR 0.99 | 3377 | ⊕⊝⊝⊝ | ||
| 44 per 1000 | 43 per 1000 | |||||
| Moderate | ||||||
| 49 per 1000 | 49 per 1000 | |||||
| Drop outs due to side effects | Study population | RR 0.68 | 3377 | ⊕⊝⊝⊝ | ||
| 70 per 1000 | 47 per 1000 | |||||
| Moderate | ||||||
| 65 per 1000 | 44 per 1000 | |||||
| Total number of participants with side effects | Study population | RR 0.91 | 2490 | ⊕⊝⊝⊝ | ||
| 594 per 1000 | 540 per 1000 | |||||
| Moderate | ||||||
| 611 per 1000 | 556 per 1000 | |||||
| *The basis for the assumed risk (e.g. the median control group risk across studies) is provided in footnotes. The corresponding risk (and its 95% confidence interval) is based on the assumed risk in the comparison group and the relative effect of the intervention (and its 95% CI). | ||||||
| GRADE Working Group grades of evidence | ||||||
| 1 Most studies were funded by the pharmaceutical company that manufactures agomelatine (Servier). Four out of ten studies were unpublished | ||||||
| Agomelatine compared to SNRI for major depression | ||||||
| Patient or population: patients with major depression | ||||||
| Outcomes | Illustrative comparative risks* (95% CI) | Relative effect | No of Participants | Quality of the evidence | Comments | |
| Assumed risk | Corresponding risk | |||||
| SNRI | Agomelatine | |||||
| Response rates | Study population | RR 1.06 | 669 | ⊕⊝⊝⊝ | ||
| 727 per 1000 | 771 per 1000 | |||||
| Moderate | ||||||
| 707 per 1000 | 749 per 1000 | |||||
| Remission rates | Study population | RR 1.08 | 669 | ⊕⊝⊝⊝ | ||
| 454 per 1000 | 490 per 1000 | |||||
| Moderate | ||||||
| 333 per 1000 | 360 per 1000 | |||||
| Total drop outs | Study population | RR 0.4 | 392 | ⊕⊝⊝⊝ | ||
| 228 per 1000 | 91 per 1000 | |||||
| Moderate | ||||||
| 258 per 1000 | 103 per 1000 | |||||
| Drop out due to inefficacy | Study population | RR 1.01 | 332 | ⊕⊝⊝⊝ | ||
| 18 per 1000 | 18 per 1000 | |||||
| Moderate | ||||||
| 18 per 1000 | 18 per 1000 | |||||
| Drop outs due to side effects | Study population | RR 0.3 | 608 | ⊕⊝⊝⊝ | ||
| 111 per 1000 | 33 per 1000 | |||||
| Moderate | ||||||
| 109 per 1000 | 33 per 1000 | |||||
| Total number of patients with side effects | Study population | RR 0.72 | 611 | ⊕⊝⊝⊝ | ||
| 481 per 1000 | 346 per 1000 | |||||
| Moderate | ||||||
| 471 per 1000 | 339 per 1000 | |||||
| *The basis for the assumed risk (e.g. the median control group risk across studies) is provided in footnotes. The corresponding risk (and its 95% confidence interval) is based on the assumed risk in the comparison group and the relative effect of the intervention (and its 95% CI). | ||||||
| GRADE Working Group grades of evidence | ||||||
| 1 The studies included in our review were conducted in inpatient and outpatient settings. Results may not be generalisable for a primary care setting | ||||||
Background
Description of the condition
Major depressive disorder (MDD), or depression, is a syndrome characterised by a number of behavioural, cognitive and emotional features. It is most commonly associated with a sad or depressed mood, a reduced capacity to feel pleasure, hopelessness, loss of energy, altered sleep patterns, weight fluctuations, difficulty in concentrating and suicidal ideation (APA 2000). MDD is among the most common medical illnesses. The National Co‐morbidity Survey Replication estimated the lifetime prevalence of MDD to be 16.2% and the 12‐month prevalence to be 6.6%, with a mean depressive episode duration of 16 weeks (Kessler 2003). Women were 1.7 times more likely than men to have MDD (Kessler 2003). MDD is associated with marked personal, social and economic morbidity; loss of functioning and productivity; and creates significant demands on service providers in terms of workload (NICE 2004). It is the third leading cause of burden from disease and accounts for 4.5% of all human disability (WHO 2008). Additionally, MDD is expected to show a rising trend in the next 20 years (WHO 2008).
Description of the intervention
The treatment of depression includes both psychological (most commonly cognitive behavioural and interpersonal therapies) and pharmacological therapies. With the arrival of selective serotonin reuptake inhibitors (SSRIs) in the 1980s, and subsequent new antidepressant drugs, the use of antidepressants to treat depression has increased greatly (Middleton 2001). SSRIs have been recommended for first‐line drug use in depression by most of the treatment guidelines (APA 2000a; Lam 2009; NICE 2004; Taylor 2009), largely because of having a better safety profile, rather than superior efficacy. SSRIs are not without problems. Their effect size has been found to be small in comparison to placebo, in mild to moderate depression (Fournier 2010). Moreover, in clinical trials, SSRIs are associated with sexual dysfunction in 30% to 70% of participants (Clayton 2006). SSRIs also cause difficulties in sleep and agitation (Dording 2002). Therefore, the search is on for better antidepressant drugs. The ideal medication for depression would be a drug with a high level of effectiveness and a favourable side‐effect profile. Until now there has been little evidence to support one antidepressant over another. A number of previous meta‐analyses have concluded that there are no significant differences in either efficacy or acceptability between the various second‐generation antidepressants currently on the market (AHRQ 2007; Hansen 2005), although a recent multiple treatment meta‐analysis of 12 new‐generation antidepressant drugs, which used both direct and indirect data, reported the possible superiority of sertraline and escitalopram in terms of efficacy and acceptability (Cipriani 2009).
Agomelatine was recently added to the list of available antidepressant drugs; it works on melatonergic (MT1 and MT2), 5‐HT2B and 5‐HT2C receptors. Since its mechanism of action is claimed to be novel, it may provide a useful alternative pharmacological strategy to existing antidepressant drugs. Its positive effect on the sleep‐wake cycle and lack of serious side effects, including sexual side effects, may provide added advantages (Dolder 2008). Agomelatine has been licensed in the EU for the treatment of depression since 2009 (EMEA 2009). Novartis discontinued the development of agomelatine for the US market in 2011 (Novartis 2012).
How the intervention might work
Agomelatine is a new antidepressant drug with a unique mechanism of action. It acts as an agonist on melatonin MT1 and MT2 receptors, and an antagonist on 5‐HT2B and 5‐HT2C receptors. The MT1 receptor directly inhibits firing of the neurons in the suprachiasmatic areas in the hypothalamus, regulating the amplitude of circadian rhythmicity, whilst the MT2 receptor is responsible for the entrainment of circadian rhythms (San 2008). Antagonism at 5‐HT2C receptor causes a postulated increase in frontal dopamine transmission in animal models (Millan 2003). Agomelatine has shown some antidepressant‐like activity in animal models of depression (Popoli 2009). It has been studied for major depression in adults at doses of 25 mg to 50 mg/day given in the evenings (Popoli 2009).
Why it is important to do this review
Agomelatine is a unique antidepressant drug that has been found to be effective when compared with placebo and other antidepressant drugs (Kasper 2008). Its efficacy and tolerability compared to other antidepressants have been assessed in a recent meta‐analyses of published trials (Singh 2011), and a pooled analysis of selected trials (Kasper 2013). Another systematic review of placebo controlled trials (Koesters 2013), questioned whether there is a clinically important difference between agomelatine and placebo. However, as shown by Howland 2011 and Koesters 2013, published evidence for agomelatine may be influenced by publication bias. Therefore, there is good reason to conduct a systematic quantitative review using both published and unpublished evidence for its comparative efficacy, and adverse effects, against other antidepressant drugs.
Objectives
The objective of this review was 1) to determine the efficacy of agomelatine in alleviating acute symptoms of major depressive disorder in comparison with other antidepressants, 2) to review the acceptability of agomelatine in comparison with other antidepressant drugs, and, 3) to investigate the adverse effects of agomelatine, including the general prevalence of side effects in adults.
Methods
Criteria for considering studies for this review
Types of studies
We included all randomised controlled trials using a parallel group design that compared agomelatine with other antidepressant agents as monotherapies. For cross‐over trials we included only the results from the first randomised period.
Types of participants
-
Participants of both sexes, aged 18 years or older, with a primary diagnosis of major depression.
-
We included studies that used any standardised criteria to define unipolar major depression. We expected that most studies would use DSM‐IV (APA 1994), DSM‐ IV‐TR (APA 2000), or ICD‐10 (WHO 1992). Older studies might have used ICD‐9 (WHO 1978), DSM‐III (APA 1980), DSM‐ III‐R (APA 1987), or other diagnostic systems. We excluded studies that used ICD‐9 because it does not have operationalised criteria, but only disease names and no diagnostic criteria. However, we included studies that used Feighner criteria (Feighner 1972), or Research Diagnostic Criteria (Spitzer 1978).
-
We included studies in which less than 20% of participants were suffering from bipolar depression, but we examined the validity of the decision in a sensitivity analysis.
-
We did not consider a concurrent secondary diagnosis of another psychiatric disorder as a criterion for exclusion, though we did consider a concurrent primary diagnosis of Axis I or II disorders as an exclusion criterion. We excluded participants with a concurrent DSM‐IV diagnosis of schizophrenia, delusional disorder, or a psychosis not otherwise specified. We excluded antidepressant trials in depressive participants with a serious concomitant medical illness.
Types of interventions
Experimental intervention
-
Agomelatine
Comparator interventions
-
Selective serotonin reuptake inhibitors (SSRIs; fluoxetine, fluvoxamine, citalopram, paroxetine, escitalopram)
-
Serotonin–norepinephrine reuptake inhibitors (SNRIs; venlafaxine, duloxetine, milnacipran)
-
Other antidepressive agents (tricyclic or heterocyclic antidepressants; monoamine oxidase inhibitors (MAOIs); newer agents (mirtazapine, bupropion, reboxetine); atypical antipsychotics in monotherapy (risperidone, paliperidone, olanzapine, quetiapine, aripiprazole, amisulpride, ziprasidone); non‐conventional (herbal products such as Hypericum).
In future updates, if studies become available, we will group the other antidepressants according to classes in further comparisons.
We applied no restrictions regarding dose, frequency, intensity or duration.
We excluded trials in which agomelatine was used as an augmentation strategy.
Types of outcome measures
Primary outcomes
Our primary outcome measure for efficacy was:
-
the number of participants who responded to treatment, showing a reduction of at least 50% on the Hamilton Rating Scale for Depression (HAM‐D) (Hamilton 1960), the Montgomery Asberg Depression Rating Scale (MADRS) (Montgomery 1979), or any other depression scale (e.g. the Beck Depression Inventory (Beck 1987), or the CES‐D scale (Radloff 1977)); or were 'much or very much improved' (score 1 or 2) on the Clinical Global Impression‐Improvement (CGI‐I) (Guy 1976).
Secondary outcomes
Our secondary outcome measures included:
-
the number of participants who achieved remission as defined by: a score of 7 or less on the 17‐item HAM‐D, or 8 or less on the longer version of HAM‐D; 10 or less on the MADRS; 'not ill or borderline mentally ill' on the CGI‐S (Guy 1976); or any other equivalent value on a depression scale defined by the authors. We preferred remission rates defined by the HAM‐D or MADRS scores.
-
group mean scores at endpoint on HAM‐D, MADRS, CGI‐S or any other depression rating scale score.
Acceptability was evaluated using the following outcome measures:
-
total drop‐out rate: i.e. total number of participants who dropped out during the trial as a proportion of the total number of randomised participants.
-
drop‐out rates due to inefficacy: i.e. number of participants who dropped out due to inefficacy during the trial as a proportion of the total number of randomised participants.
-
drop‐out rates due to side effects: i.e. number of participants who dropped out due to side effects during the trial as a proportion of the total number of randomised participants.
Tolerability was evaluated using the following outcome measures:
-
total number of participants experiencing at least some side effects.
-
total number of participants experiencing the following specific side effects:
-
sleepiness or drowsiness;
-
insomnia;
-
dry mouth;
-
constipation;
-
dizziness;
-
hypotension;
-
agitation or anxiety;
-
suicide wishes, gestures or attempts;
-
completed suicide;
-
vomiting or nausea;
-
diarrhoea;
-
sexual dysfunction;
-
abnormal liver function tests;
-
weight gain;
-
hypertension.
-
In order not to miss any relatively rare or unexpected yet important side effects, in the data extraction phase we collected all side‐effect data reported in the literature and discussed ways to summarize them later.
Search methods for identification of studies
The Cochrane Depression, Anxiety and Neurosis Review Group's Specialised Register (CCDANCTR)
The Cochrane Depression, Anxiety and Neurosis Group (CCDAN) maintains two clinical trials registers at the editorial base in Bristol, UK: a references register and a studies‐based register. The CCDANCTR‐References Register contains over 31,500 reports of RCTs in depression, anxiety and neurosis. Approximately 65% of these references have been tagged to individual, coded trials. The coded trials are held in the CCDANCTR‐Studies Register and records are linked between the two registers through the use of unique Study ID tags. Coding of trials is based on the EU‐Psi coding manual, using a controlled vocabulary (please contact the CCDAN Trials Search Co‐ordinator for further details). Reports of trials for inclusion in the Group's registers are collated from routine (weekly), generic searches of MEDLINE (1950 onwards), EMBASE (1974 onwards) and PsycINFO (1967 onwards); quarterly searches of the Cochrane Central Register of Controlled Trials (CENTRAL) and review‐specific searches of additional databases. Reports of trials are also sourced from international trials registers c/o the World Health Organization's (WHO) trials portal (the International Clinical Trials Registry Platform (ICTRP)), pharmaceutical companies, the handsearching of key journals, conference proceedings and other (non‐Cochrane) systematic reviews and meta‐analyses.
Details of CCDAN's generic search strategies (used to identify RCTs) can be found on the Group's website.
Electronic searches
-
The CCDANCTR‐Studies Register was searched using the following terms: Diagnosis = depress* and Intervention = agomelatine and Age group = (adult or aged or unclear or "not stated")
-
The CCDANCTR‐References Register was searched using free‐text terms to identify additional untagged/uncoded reports of RCTs: (depress* and agomelatine)
-
International trial registers were searched via the WHO International Clinical Trials Registry Platform (ICTRP), which includes access to Controlled‐Trials.com where Servier Laboratories (developers of agomelatine) register their trial protocols. The following search terms were used: (agomelatine or valdoxan or thymanax)
The literature search was last updated on 31 July 2013.
Searching other resources
Personal communication
We contacted experts in the field for information on unpublished or ongoing studies, or to request additional trial data.
We contacted Servier Laboratories directly in Slough (UK) and Paris (France), but they failed to respond to our request for additional data.
Reference checking
We checked the reference lists of all included studies, relevant reviews and regulatory agency reports to identify additional studies missed from the original electronic searches, and also conducted a cited reference search on the Web of Science.
Data collection and analysis
Selection of studies
The selection of trials for inclusion in this systematic review was done by two of the review authors.
Both review authors inspected the search hits by reading the titles and the abstracts to see if they met the inclusion criteria. Possible doubts were resolved by consultation with each other. We obtained each potentially relevant study located in the search as a full article, then two review authors independently assessed each for inclusion, and, if there was disagreement sought resolution through discussion between review authors. The discordance in the selection of studies was calculated using Cohen’s Kappa (k) (Cohen 1960), a more robust measure than a simple per cent agreement calculation since it takes into account the agreement between review authors that occurs by chance. Where it was not possible to evaluate the study because of language problems or missing information, we have classified the study as a 'study awaiting classification' until we can obtain either a translation or further information. We have reported the reasons for exclusion of trials in the 'Characteristics of included studies' table.
Data extraction and management
Two review authors independently used a data extraction form to extract the data from included studies concerning participant characteristics (age, sex, severity of depression, study setting), intervention details (dosage, duration of study, sponsorship), study characteristics (blinding, allocation etc.) and outcome measures of interest. Again, any disagreement was resolved by consensus or by the third member of the review team. If necessary, we contacted authors of studies to obtain clarification.
Main comparisons
-
Agomelatine versus SSRIs
-
Agomelatine versus SNRIs
-
Agomelatine versus other antidepressive agents (see Types of interventions)
Where sufficient data were available, we presented the results grouped by substance as well.
Assessment of risk of bias in included studies
Again working independently, two authors assessed risk of bias using the tool described in the Cochrane Handbook for Systematic Reviews of Interventions (Higgins 2011). This tool encourages consideration of how the sequence was generated, how allocation was concealed, the integrity of blinding at outcome assessment, the completeness of outcome data, selective reporting and other biases. We also considered sponsorship bias.
The risk of bias, in each domain and overall, was assessed and categorised as either:
-
low risk of bias, i.e. plausible bias unlikely to seriously alter the results; or
-
high risk of bias, i.e. plausible bias that seriously weakens confidence in the results; or
-
unclear risk of bias, i.e. plausible bias that raises some doubt about the results.
If the assessors disagreed, the final rating was made by consensus or with the involvement of another member of the review group. Where insufficient details of randomisation and other characteristics of trials were provided, we contacted authors of the studies in order to obtain further information. We agreed to report non‐concurrence in quality assessment.
Measures of treatment effect
The main outcome result was response to treatment. The improvement is usually presented as either a change in a depression scale(s) (mean and standard deviation), or as a dichotomous outcome (responder or non‐responder, remitted or not‐remitted), or both.
(1) Binary or dichotomous data
For binary outcomes we calculated a standard estimation of the random‐effects model risk ratio (RR) and its 95% confidence interval (CI). It has been shown that RR is more intuitive than odds ratio (Boissel 1999), and odds ratios tend to be interpreted as RR by clinicians (Deeks 2000). This misinterpretation then leads to an overestimation of the impression of the effect. For statistically significant results we calculated the number needed to treat to benefit or harm statistic (NNTB or NNTH) and its 95% CI using Visual Rx (http://www.nntonline.net/), taking account of the event rate in the control group.
(2) Continuous data
(a) Summary statistics
It was likely that different studies would use a variety of depression rating scales; therefore we used standardised mean difference (SMD). If all included studies had used the same instrument, we would have used mean differences (MD).
(b) Endpoint versus change data
We preferred to use scale endpoint data, which typically cannot have negative values and are easier to interpret from a clinical point of view. When endpoint data were unavailable, we used the change data. If we used MD, we pooled results based on change data and endpoint data in the same analysis.
Unit of analysis issues
(1) Cross‐over trials
Cross‐over trials are trials in which all participants receive both the control and intervention treatment but not in the same order. The major problem with this design of trial is a carry‐over effect from the first phase to the second phase of the study, especially if the condition of interest is unstable (Elbourne 2002). As this is the case with depression, randomised cross‐over studies were eligible, but we would only use data up to the point of first cross‐over.
(2) Studies with multiple treatment groups
Where a study involved more than two agomelatine arms, especially two appropriate dose groups of an antidepressant drug, the different dose arms were pooled and considered to be one. For dichotomous outcomes sample sizes and the event numbers were summed across groups. For continuous outcomes, means and standard deviations were grouped using the methods described in Chapter 7 (Section 7.7.3.8) of the Cochrane Handbook for Systematic Reviews of Interventions (Higgins 2011). In three‐armed trials with placebo groups, we only considered data from active treatments.
Dealing with missing data
We tried to contact the authors for all relevant missing data.
(1) Dichotomous outcomes
Response, or remission on treatment, was calculated using an intention‐to‐treat analysis (ITT). We followed the principle 'once randomised always analyse'. In trials where participants left the study before the intended endpoint, it was be assumed that they would have experienced a negative outcome. The validity of the above assumption was tested by sensitivity analysis, applying worst‐case and best‐case scenarios. When dichotomous outcomes were not reported, but the baseline mean and standard deviation on a depression scale were reported, we calculated the number of responding or remitted participants according to a validated imputation method (Furukawa 2005). We analysed the validity of the above approach by sensitivity analysis.
(2) Continuous outcomes
The Cochrane Handbook for Systematic Reviews of Interventions recommends avoiding imputations of continuous data and suggests that the data must be used in the form they were presented by the original authors. We preferred ITT data, when available, to 'per‐protocol analysis'.
(3) Skewed or qualitative data
We presented skewed and qualitative data descriptively.
We considered several strategies for skewed data. If papers reported a mean and standard deviation, and there was also an absolute minimum possible value for the outcome, we divided the mean by the standard deviation. If this was less than two, then we concluded that there was some indication of skewness. If it was less than one (that is the standard deviation was bigger than the mean) then skewness was almost certainly present. If papers had not reported the skewness and simply reported means, standard deviations and sample sizes, these numbers were used. We did this because there was a possibility that these data may not have been properly analysed, and can also be misleading; we conducted analyses with and without these studies. If the data had been log‐transformed for analysis, and the geometric means were reported, skewness was reduced. This is the recommended method of analysis of skewed data. If papers used non‐parametric tests and described averages using medians, they could not be pooled formally in the analysis. We followed the recommendation made by the Cochrane Handbook for Systematic Reviews of Interventions (Higgins 2011) that results of these studies are reported in a table in our review, along with all other papers. This meant that the data were not lost from the review and these results could be considered when drawing conclusions, even if they could not be pooled formally in the analyses.
(4) Missing statistics
When only P or standard error (SE) values were reported, we calculated standard deviations (SDs) (Altman 1996). In the absence of supplementary data after requests to the authors, we calculated the SDs according to a validated imputation method (Furukawa 2006). We examined the validity of these imputations in the sensitivity analyses. We applied ITT analyses, in which all the drop outs not included in the analyses were considered to be non‐responders. We examined the validity of this decision in the sensitivity analyses by applying worst‐case and best‐case scenarios. We presented symptom levels as either continuous (mean ± SD) or dichotomous outcomes (improved or not improved).
Assessment of heterogeneity
We followed the Cochrane Handbook for Systematic Reviews of Interventions' recommendations (I2 statistic values 0% to 40%: might be important; 30% to 60%: may represent moderate heterogeneity; 50% to 90%: may represent substantial heterogeneity; 75% to 100%: represent considerable heterogeneity). We also used Chi2 and its P value to determine the direction and magnitude of the treatment effects. In a meta‐analysis of few trials, Chi2 will be underpowered to detect heterogeneity, if it exists. Therefore, a P value of less than 0.10 was used as the threshold for statistical significance (Higgins 2011).
Assessment of reporting biases
Reporting biases arise when the dissemination of research findings is influenced by the nature and direction of results. These are described in section 10.1 of the Cochrane Handbook for Systematic Reviews of Interventions (Higgins 2011). A funnel plot is usually used to investigate publication bias. However, it has a limited role when there are only a few studies of similar size. Secondly, asymmetry of a funnel plot does not always reflect publication bias. We did not use funnel plots for outcomes if there were 10 or fewer studies, or if all studies were of similar size.
Data synthesis
We used a random‐effects model to calculate the treatment effects. We preferred the random‐effects model as it takes in to account differences between studies even when there is no evidence of statistical heterogeneity. It gives a more conservative estimate than the fixed‐effect model. We note that the random‐effects model gives added weight to small studies, which can either increase or decrease the effect size. We also did the analysis using a fixed‐effect model to see whether it changed the effect size markedly.
Subgroup analysis and investigation of heterogeneity
We note that subgroup analyses are often exploratory in nature and should be interpreted very cautiously: firstly, because they often involve multiple analyses and this can lead to false positive results; and secondly, because these analyses lack power and are more likely to result in false positive results. Bearing the above reservations in mind, we performed the following subgroup analyses.
-
Agomelatine dosing (fixed low dosage: 25 mg/day; fixed high dosage: 50 mg and above; flexible high dose and flexible low dose). The standard dose of agomelatine is 25 mg to 50 mg per day. There is evidence to suggest that low dose antidepressants may be associated with better outcomes both in terms of effectiveness and tolerability (Bollini 1999). Similarly, fixed versus flexible dose can also affect the estimate of treatment effectiveness (Khan 2003).
-
Severity of depression (mild, moderate, severe depression). This analysis might have been useful in assessing the efficacy of agomelatine in different subpopulations of participants divided by severity.
-
Treatment settings (primary care, psychiatric inpatients, or psychiatric outpatients). This analysis might have been useful in identifying whether agomelatine could have been more or less effective in different treatment settings.
-
Older participants (participants aged 65 years or more) separately from other adult participants. This analysis might have been useful for finding out whether agomelatine could have more or less efficacy among older participants.
-
Examination of 'wish bias' by comparing agomelatine as the investigational drug versus agomelatine as the comparator, as there is evidence to suspect that a new antidepressant might perform worse when used as a comparator than when used as an experimental agent (Barbui 2004).
-
Examination of publication bias by assessing response to agomelatine in unpublished studies versus response to agomelatine in published studies. This analysis might be useful in determining whether there is a significant difference in reported outcome in published studies versus unpublished studies, in order to be able to assess publication bias.
If groups within any of the subgroups were found to be significantly different from one another, we planned to run meta‐regressions for exploratory analyses of additive or multiplicative influences of the variables in question.
Sensitivity analysis
The following sensitivity analyses were planned a priori. By limiting the included studies to those of higher quality, we examined whether the results changed, and checked for the robustness of the observed findings.
-
Excluding trials with unclear concealment of random allocation or unclear double blinding, or both; and trials with inadequate concealment of random allocation.
-
Excluding trials with drop‐out rates greater than 20%.
-
Performing the worst‐case scenario ITT (i.e. all the participants in the experimental group experienced the negative outcome and all those allocated to the comparison group experienced the positive outcome) and the best‐case scenario ITT (i.e. all the participants in the experimental group experienced the positive outcome and all those allocated to the comparison group experienced the negative outcome).
-
Excluding trials for which the response rates had to be calculated via the imputation method (Furukawa 2005), and those for which the SD had to be borrowed from other trials (Furukawa 2006).
-
Excluding all cross‐over trials.
-
Excluding studies funded by the pharmaceutical company marketing agomelatine (Servier). This sensitivity analysis is particularly important in view of the repeated findings that funding strongly affects the outcomes of research studies (Als‐Nielsen 2003; Bhandari 2004; Lexchin 2003), and because industry sponsorship and authorship of clinical trial reports has increased over the last 20 years (Buchkowsky 2004).
-
Excluding studies in which there were any participants diagnosed with bipolar depression.
Our routine application of random‐effects and fixed‐effect models, as well as our secondary outcomes of remission rates and continuous severity measures, might be considered to be additional forms of sensitivity analyses.
'Summary of findings' table
A 'Summary of findings' (SoF) table was made for each comparison (agomelatine versus SSRI and agomelatine versus SNRI). Six outcomes were chosen to build the two tables, based on their importance (response rate, remission rates, total drop outs, drop out due to inefficacy, drop outs due to side effects, total number of participants experiencing at least one side effect). The SoF table is based on the GRADE (Grading of Recommendations Assessment Development and Evaluation) system (Rosenbaum 2010). The GRADE system is a formal way of evaluating the quality of evidence, using several parameters, in order to achieve transparency and simplicity (Guyatt 2008). Initially, evidence for each RCT is considered as high, and then downgraded for a variety of reasons, including study limitations, inconsistency of results, indirectness of evidence, imprecision and reporting bias. On the basis of these criteria, the evidence can be downgraded to moderate, low or very low (Guyatt 2008). The inclusion of SoF tables in Cochrane reviews improves understanding and rapid retrieval of key findings (Rosenbaum 2010).
Results
Description of studies
See Characteristics of included studies; Characteristics of excluded studies; Characteristics of studies awaiting classification; Characteristics of ongoing studies.
Results of the search
Initially, we identified 120 references, 88 through database searching and 32 through other sources. These included 28 duplicates that were excluded, and a further 44 records were excluded after screening of abstracts. We retrieved full‐text copies of the remaining 48 references for more detailed evaluation. Thirty‐five studies were excluded for a variety of reasons. In the end, 13 studies were included in the qualitative and quantitative synthesis. The literature search was last updated in July 2013.
See Figure 1 for more details on the result of the search.

Study flow diagram
Included studies
A total of 13 studies was included in this systematic review. Four of these were unpublished trials carried out by a pharmaceutical company (Servier; CAGO2303; CL3‐022; CL3‐023; CL3‐024). Attempts to contact the pharmaceutical company (Servier) for additional information on all unpublished studies were unsuccessful. With the exception of one study (Martinotti 2012), requests to authors concerning missing data were also unsuccessful.
Design
All the included studies were randomised trials. Eleven were reported to be double blind, and one study used an open label parallel group design (Martinotti 2012). Five studies were three‐armed with agomelatine, an active comparator and placebo (CAGO2303; CL3‐022; CL3‐023; CL3‐024; Loo 2002a). Seven studies were two‐armed with agomelatine versus another antidepressant (Corruble 2013; Hale 2010; Kasper 2010; Kennedy 2008; Lemoine 2007; Martinotti 2012; Quera‐Salva 2011).
Sample sizes
Overall, the studies included 4495 participants in active treatment arms. Of these, 2457 were randomised to agomelatine. Of the remaining 2048 participants, 1701 were randomised to SSRIs: 862 to fluoxetine, 453 to paroxetine,159 to sertraline and 227 to escitalopram. The remaining 337 participants were randomised to an SNRI, venlafaxine. The mean sample size per arm was 156 participants (range 30 to 314). Only one study recruited fewer than 100 participants overall (Martinotti 2012).
Setting
All studies were multicentre trials. Three studies were conducted in a single nation, namely, the USA (CAGO2303), France (CL3‐022), and Italy (Martinotti 2012). One study was conducted in France and Spain (Lemoine 2007). One multinational study recruited Asian participants only (Shu 2013). The other studies were multinational across continents.
Three studies enrolled both inpatients and outpatients (CL3‐022; CL3‐023; CL3‐024). Eight studies recruited outpatients (Corruble 2013; Hale 2010; Kasper 2010; Kennedy 2008; Lemoine 2007; Martinotti 2012; Quera‐Salva 2011; Shu 2013). Two studies did not report the setting (CAGO2303; Loo 2002a).
Participants
All studies included participants with a diagnosis of major depressive disorder (MDD). One study also included participants with bipolar II depression (Loo 2002a), although the proportion suffering from this condition was no more than 3%. As per our protocol for the review, Loo 2002a was included in the present review as less than 20% of the participants in the study had bipolar disorder.
All studies randomised participants from 18 years of age, but the age ranges recruited varied: two studies recruited participants up to 70 years of age (CAGO2303; Corruble 2013); three studies recruited between the ages of 18 to 59 years (CL3‐022; CL3‐023; CL3‐024); four studies recruited between the ages of 18 to 60 (Kasper 2010; Kennedy 2008; Martinotti 2012; Quera‐Salva 2011); and the final four studies recruited between the ages of 18 to 65 (Hale 2010; Lemoine 2007; Loo 2002a; Shu 2013).
Interventions and comparators
Most studies compared agomelatine to SSRIs: three compared agomelatine to paroxetine (CAGO2303; CL3‐023; Loo 2002a); four compared agomelatine to fluoxetine (CL3‐022; CL3‐024; Hale 2010; Shu 2013); two compared agomelatine to escitalopram (Corruble 2013; Quera‐Salva 2011); and one compared agomelatine to sertraline (Kasper 2010). Three studies compared agomelatine to an SNRI, venlafaxine (Kennedy 2008; Lemoine 2007; Martinotti 2012).
Outcomes
Efficacy data (either as dichotomous or as continuous outcome) and tolerability/acceptability data were available for all 13 included studies and could be entered into a meta‐analysis.
All but one study used HAM‐D as rating scale for primary or secondary outcome measures; Kennedy 2008 used MADRS instead. Ten studies reported response rates: data for one study was provided by the authors upon request (Martinotti 2012), and we imputed response rates for the remaining two studies from continuous data (CL3‐023; CL3‐024). Seven studies reported remission rates: data for one study was provided by the authors upon request (Martinotti 2012), and we imputed remission rates for the remaining five studies from continuous data (CL3‐023; CL3‐024; Lemoine 2007; Quera‐Salva 2011; Shu 2013).
All but one study reported drop outs due to any reason (Kennedy 2008). Nine studies reported drop outs due to side effects (CAGO2303; CL3‐022; CL3‐023; Corruble 2013; Hale 2010; Kasper 2010; Loo 2002a; Quera‐Salva 2011; Shu 2013), and the same nine also reported drop outs due to inefficacy. Six studies reported the total number of participants who experienced side effects (CAGO2303; Hale 2010; Kasper 2010; Loo 2002a; Quera‐Salva 2011; Shu 2013).
Excluded studies
Overall, we excluded 20 studies from the systematic review because of the inclusion criteria. Nineteen of these did not have an active control group and one trial was withdrawn prior to enrolment (see Characteristics of excluded studies and Figure 1).
Ongoing studies
We identified six ongoing studies (see Characteristics of ongoing studies) (CL3‐060; CL3‐074; CL3‐083; GENRAS; Lundbeck 2011; NCT01483053).
Studies awaiting classification
We classified nine studies as awaiting classification (CL3‐027; CL3‐048; CL3‐062; CL3‐073; CRSC11003; CTRI/2011/04/001659; Karaiskos 2013; Montgomery 2004; Vasile 2011. Those trials were either published (Karaiskos 2013; Montgomery 2004), included in EMEA documents (CL3‐027; CL3‐048; CL3‐062; CL3‐073), retreived from Clinical Trial Registry India (CRSC11003; CTRI/2011/04/001659) or retreived from conference proceedings (Vasile 2011). One of the published studies was designed to examine withdrawal symptoms (Montgomery 2004); data for the first 12 weeks of the study, comparing agomelatine (25 mg/day) and paroxetine (20 mg/day) were not adequately reported to be included (see: Characteristics of studies awaiting classification). The other published study was rated as awaiting classification because it was unclear whether the trial was randomised (Karaiskos 2013); a request to the authors remains unanswered.
Risk of bias in included studies
See: Characteristics of included studies, Figure 2, Figure 3.
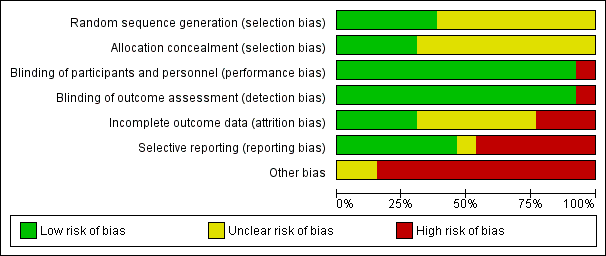
Risk of bias graph: review authors' judgements about each risk of bias item presented as percentages across all included studies
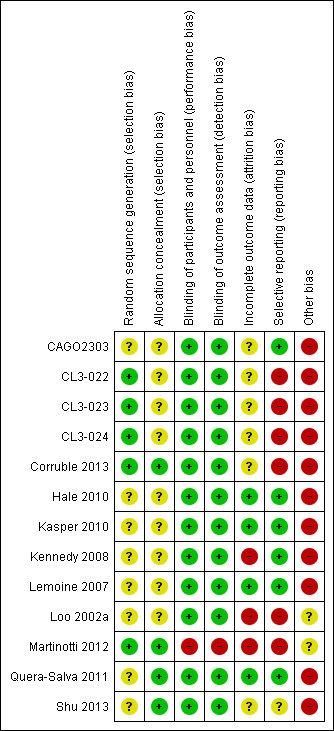
Risk of bias summary: review authors' judgements about each risk of bias item for each included study
The overall methodological quality of the studies was not very good; every study judged as having high or unclear risk of bias in at least one domain (see Figure 2 and Figure 3 for summary graphs). Almost all of the studies were sponsored by the pharmaceutical company that manufactures agomelatine (Servier), and some of them were unpublished. This last source of bias should be taken into account when interpreting the results.
Allocation
Ten studies reported no details about the randomisation procedure and so were judged as having unclear risk of bias (CAGO2303; CL3‐022; CL3‐023; CL3‐024; Hale 2010; Kasper 2010; Kennedy 2008; Lemoine 2007; Loo 2002a; Shu 2013). One study reported that randomisation was non‐adaptive, balanced, and stratified on the centre and that an interactive computer‐based system allocated a therapeutic unit number (Martinotti 2012). One study reported that randomisation was balanced but, did not provide any more details on the sequence generation (Quera‐Salva 2011).
Blinding
All RCTs apart from Martinotti 2012 were reported as double blind and so were deemed to have low risk of bias. Martinotti 2012, which was an open‐label parallel group trial, was judged as having a high risk of bias in this domain. All but two double‐blind studies reported details of measures employed to ensure successful blinding (CAGO2303; Loo 2002a).
Incomplete outcome data
Overall, the drop out rate was around 18% for agomelatine and 19% for the control medication; this ranged from 10% in Quera‐Salva 2011 to 22% in CAGO2303. Three studies had a drop‐out rate of more than 20% (CAGO2303; CL3‐024; Loo 2002a).
Selective reporting
Study protocols were not available for all the studies. Data from CL3‐022; CL3‐023; CL3‐024 were limited, as we could not gain access to the full dataset because the studies were unpublished; attempts to obtain data from the pharmaceutical company manufacturing agomelatine (Servier) were unsuccessful. Loo 2002a, CL3‐022, CL3‐023 and CL3‐024 were not registered, thus increasing risk of selective reporting, and Martinotti 2012 did not report full data on adverse events. CL3‐022, CL3‐023, CL3‐024, Loo 2002a, Martinotti 2012 and Corruble 2013 were all judged as having a high risk of bias in this domain. The risk of bias in Shu 2013 was assessed as unclear, and the remaining studies were deemed as having low risk of bias.
Other potential sources of bias
All but two of the included RCTs were sponsored by the company that manufactures agomelatine (Servier) and so were assessed as having high risk of bias. Martinotti 2012 was funded by a research department without industry support and it was unclear whether Loo 2002a was sponsored or not, so these two studies were assessed as having unclear risk of bias in this domain.
Effects of interventions
See: Summary of findings for the main comparison Agomelatine compared to SSRI for major depression; Summary of findings 2 Agomelatine compared to SNRI for major depression
We have reported the results of the present systematic review by grouping the comparators into three classes: SSRIs, SNRIs and other antidepressive agents. Where possible, each comparator is presented in subgroups.
Comparison one: agomelatine versus other SSRIs
Primary outcome
1.1 Efficacy ‐ number of participants who responded to treatment
There was no evidence that agomelatine was less or more effective than SSRIs as a whole (Mantel‐Haenszel risk ratio (RR) 1.01, 95% confidence interval (CI) 0.95 to 1.08, P value 0.75; 10 trials, 3826 participants), statistical heterogeneity was moderate (I² = 31%). Considering each comparator, there was no evidence that agomelatine was less or more effective than: paroxetine (RR 0.92, 95% CI 0.77 to 1.09, P value 0.33, I² = 56%; three trials, 1189 participants); fluoxetine (RR 1.01, 95% CI 0.92 to 1.11, P value 0.80, I² = 31%; four trials, 1862 participants); sertraline (RR 1.11, 95% CI 0.94 to 1.30, P value 0.23, one trial, 313 participants); or escitalopram (RR 1.05, 95% CI 0.95 to 1.16, P value 0.33, I² = 0%; two trials, 462 participants) (see Analysis 1.1 and Figure 4).
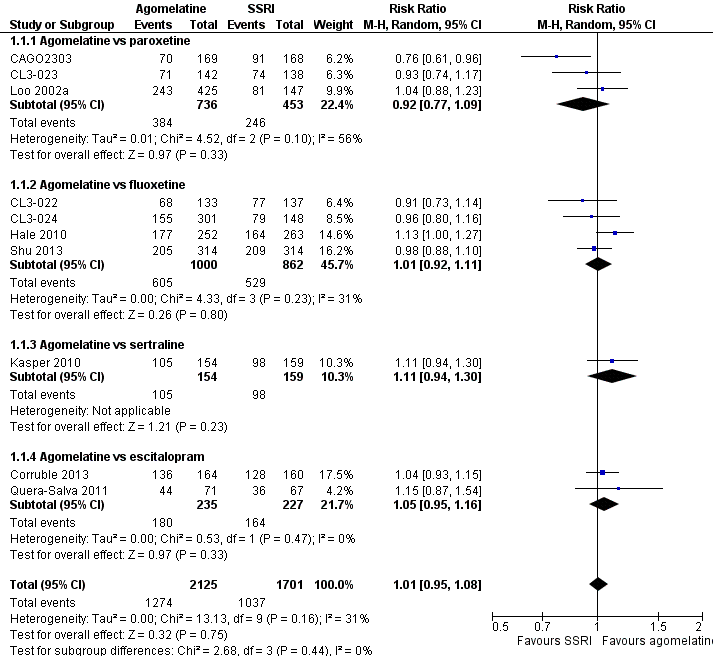
Forest plot of comparison: 1 Agomelatine vs SSRI, outcome: 1.1 Response rates
Secondary outcomes
1.2 Efficacy ‐ number of participants who achieve remission
There was no significant difference in the number of participants who achieved remission between agomelatine and SSRIs as a whole (RR 0.83, 95% CI 0.68 to 1.01, P value 0.07; ten trials, 3826 participants). Heterogeneity was substantial between studies (I² = 78%). There was no significant difference in the number of participants who achieved remission between: agomelatine and paroxetine (RR 0.61, 95% CI 0.32 to 1.18, P value 0.14, I² = 84%; three trials, 1189 participants); fluoxetine (RR 0.76, 95% CI 0.55 to 1.05, P value 0.10, I² = 84%; four trials, 1862 participants); sertraline (RR 1.12, 95% CI 0.80 to 1.58, P value 0.50; one trial, 313 participants); and escitalopram (RR 1.13, 95% CI 0.94 to 1.35, P value 0.20, I² = 0%; two trials, 462 participants) (see Analysis 1.2 and Figure 5).
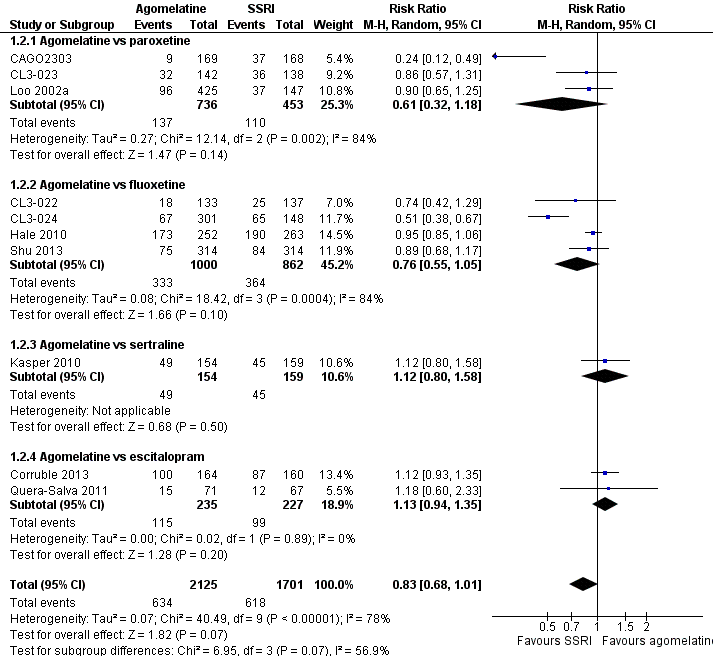
Forest plot of comparison: 1 Agomelatine vs SSRI, outcome: 1.2 Remission rates
1.3 Acceptability ‐ total drop‐out rate
There was no evidence that agomelatine was associated with a lower or higher total drop‐out rate than SSRIs as a whole (RR 0.95, 95% CI 0.83 to 1.09, P value 0.44, I² = 0%; ten trials, 3826 participants). There was no evidence that agomelatine was associated with a higher total drop‐out rate than: paroxetine (RR 1.01, 95% CI 0.80 to 1.28, P value 0.94; three trials, 1189 participants); fluoxetine (RR 0.96, 95% CI 0.74 to 1.26, P value 0.78, I² = 43%; four trials, 1862 participants); sertraline (RR 0.72, 95% CI 0.43 to 1.21, P value 0.21; one trial, 313 participants); and escitalopram (RR 0.81, 95% CI 0.50 to 1.32, P value 0.76, I² = 0%; two trials, 462 participants) (see Analysis 1.3 and Figure 6).
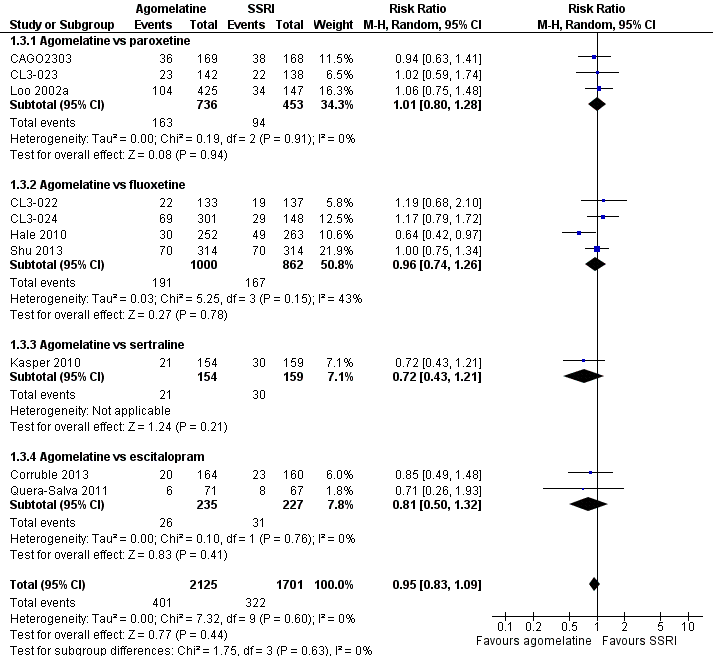
Forest plot of comparison: 1 Agomelatine vs SSRI, outcome: 1.3 Total drop outs
1.4 Acceptability ‐ drop‐out rates due to inefficacy
There was no evidence that agomelatine was associated with a higher drop‐out rate due to inefficacy than SSRIs as a whole (RR 0.99, 95% CI 0.71 to 1.37, P value 0.95, I² = 0%; nine trials, 3377 participants). There was no evidence that agomelatine was associated with a lower or higher drop‐out rate due to inefficacy than: paroxetine (RR 1.07, 95% CI 0.64 to 1.80, P value 0.80, I² = 0%; three trials, 1189 participants); fluoxetine (RR 0.97, 95% CI 0.57 to 1.65, P value 0.91, I² = 17%; three trials, 1413 participants); sertraline (RR 0.52, 95% CI 0.16 to 1.68, P value 0.27; one trial, 313 participants); or escitalopram (RR 1.34, 95% CI 0.43 to 4.21, P value 0.61, I² = 0%; two trials, 462 participants) (see Analysis 1.4).
1.5 Acceptability ‐ drop‐out rates due to side effects
There was evidence that fewer participants dropped out due to side effects when treated with agomelatine compared to other SSRIs as a whole (RR 0.68, 95% CI 0.51 to 0.91, P value 0.009, I² = 0%; nine studies, 3377 participants, NNTH = 47).
There was no evidence that fewer or more people dropped out due to side effects when treated with agomelatine compared to: paroxetine (RR 0.83, 95% CI 0.49 to 1.41, P value 0.49, I² = 0%; three studies, 1189 participants); fluoxetine (RR 0.74, 95% CI 0.50 to 1.09, P value 0.13, I² = 0%; three studies, 1413 participants); and escitalopram (RR 0.40, 95% CI 0.15 to 1.06, P value 0.07; two studies, 462 participants). There was some evidence (albeit with a small effect size) that agomelatine was associated with a lower drop‐out rate due to side effects compared to sertraline (RR 0.37, 95% CI 0.14 to 1.00, P value 0.05; one study, 313 participants, NNTH = 18) (see Analysis 1.5).
1.6 Tolerability ‐ total number of participants experiencing at least some side effects
There was evidence (albeit with a small effect size) that fewer participants experienced side effects when treated with agomelatine than when treated with other SSRIs as a whole (RR 0.91, 95% CI 0.84 to 0.98, P value 0.01, I² = 28%; six studies, 2490 participants, NNTH = 23).
There was evidence that fewer participants experienced at least some side effects when treated with agomelatine compared to paroxetine (RR 0.86, 95% CI 0.78 to 0.94, P value 0.0010, I² = 0%; two studies, 905 participants, NNTH = 7). There was no evidence that fewer or more participants experienced at least some side effects when treated with agomelatine compared to either fluoxetine (RR 1.00, 95% CI 0.89 to 1.11, P value 0.95, I² = 0%; two studies, 1141 participants) or sertraline (RR 0.98, 95% CI 0.78 to 1.23, P value 0.86; one study, 307 participants). There was some evidence (albeit with a small effect size) that agomelatine was associated with a lower rate of participants experiencing side effects compared to escitalopram (RR 0.81, 95% CI 0.66 to 0.99, P value 0.04; one study, 137 participants, NNTH = 6). See Analysis 1.6.
We also analysed the six outcomes above using a fixed‐effect model; this produced no change in significance levels and only negligible changes in effect sizes.
1.7 Tolerability ‐ total number of participants experiencing specific side effects
(a) Sleepiness or drowsiness
There was no evidence that agomelatine was associated with a lower or higher rate of participants experiencing sleepiness or drowsiness compared to all other SSRIs as a group (RR 0.96, 95% CI 0.43 to 2.15, P value 0.92, I² = 68%; five studies, 1868 participants).
There was no evidence that agomelatine was associated with a lower or higher rate of participants experiencing sleepiness or drowsiness than: paroxetine (RR 0.63, 95% CI 0.32 to 1.21, P value 0.16; two studies, 905 participants); fluoxetine (RR 1.75, 95% CI 0.78 to 3.93, P value 0.17; one study, 513 participants); or escitalopram (RR 0.19, 95% CI 0.02 to 1.55, P value 0.12; one study, 137 participants). There was evidence that agomelatine was associated with a higher rate of participants experiencing sleepiness or drowsiness compared to sertraline (RR 4.65, 95% CI 1.02 to 21.16, P value 0.05; one study, 313 participants, NNTH = 22) (see Analysis 1.7).
(b) Insomnia
There was no evidence that agomelatine was associated with a lower or higher rate of participants experiencing Insomnia compared to other SSRIs as a group (RR 0.78, 95% CI 0.38 to 1.59, P value 0.49, I² = 14%; two studies, 1192 participants).
There was no evidence that agomelatine was associated with a lower or higher rate of participants experiencing insomnia than paroxetine (RR 0.54, 95% CI 0.21 to 1.38, P value 0.20; one study, 572 participants) or fluoxetine (RR 1.13, 95% CI 0.44 to 2.88, P value 0.81; one study, 620 participants) (see Analysis 1.8). No data were available for sertraline or escitalopram for this outcome.
(c) Dry mouth
There was no evidence that agomelatine was associated with a lower or higher rate of participants experiencing dry mouth compared to all other SSRIs as a group (RR 0.94, 95% CI 0.64 to 1.40, P value 0.77, I² = 0%; five studies, 2349 participants).
There was no evidence that agomelatine was associated with a higher rate of participants experiencing dry mouth than: paroxetine (RR 0.90, 95% CI 0.51 to 1.57, P value 0.71; two studies, 905 participants); fluoxetine (RR 0.96, 95% CI 0.49 to 1.89, P value 0.92, I² = 0%; two studies, 1133 participants); or sertraline (RR 1.05, 95% CI 0.40 to 2.72, P value 0.93; one study, 311 participants) (see Analysis 1.9). No data were available for escitalopram for this outcome.
(d) Constipation
There was no evidence that agomelatine was associated with a higher rate of participants experiencing constipation than fluoxetine (RR 2.81, 95% CI 0.75 to 10.46, P value 0.12; one study, 513 participants). See Analysis 1.10. No data were available for paroxetine, sertraline and escitalopram for this outcome.
(e) Dizziness
There was no evidence that agomelatine was associated with a lower or higher rate of participants experiencing dizziness compared to all other SSRIs as a group (RR 1.00, 95% CI 0.64 to 1.55; P value 0.99, I² = 3%; four studies, 1603 participants).
There was no evidence that agomelatine was associated with a lower or higher rate of participants experiencing dizziness than: paroxetine (RR 0.80, 95% CI 0.32 to 1.96, P value 0.62; one study, 333 participants); fluoxetine (RR 1.17, 95% CI 0.71 to 1.94, P value 0.54; I² = 0%; two studies, 1133 participants); or escitalopram (RR 0.23, 95% CI 0.03 to 2.03, P value 0.19; one study, 137 participants) (see Analysis 1.11). No data were available for sertraline for this outcome.
(f) Hypotension
None of the included studies reported data for this outcome.
(g) Agitation or anxiety
There was no evidence that agomelatine was associated with a lower or higher rate of participants experiencing agitation or anxiety compared to other SSRIs as a group (RR 1.02, 95% CI 0.46 to 2.27, P value 0.97, I² = 0%; two studies, 1192 participants).
There was no evidence that agomelatine was associated with a higher rate of participants experiencing agitation and anxiety than paroxetine (RR 1.21, 95% CI 0.40 to 3.62, P value 0.73; one study, 572 participants) or fluoxetine (RR 0.83; 95% CI 0.26 to 2.70, P value 0.76; one study, 620 participants) (see Analysis 1.12). No data were available for sertraline and escitalopram for this outcome.
(h) Suicide wishes, gestures or attempts
There was no evidence that agomelatine was associated with a higher rate of participants experiencing suicide wishes, gestures or attempts than paroxetine (RR 0.86, 95% CI 0.17 to 4.41, P value 0.86; one study, 572 participants) (see Analysis 1.13). No data were available for fluoxetine, sertraline and escitalopram for this outcome.
(i) Completed suicide
There was no evidence that agomelatine was associated with a higher rate of participants completing suicide than paroxetine (RR 0.35 , 95% CI 0.02 to 5.49, P value 0.45; one study, 572 participants) (see Analysis 1.14). No data were available for fluoxetine, sertraline and escitalopram for this outcome.
(j) Vomiting or nausea
There was no evidence that agomelatine was associated with a lower rate of participants experiencing vomiting or nausea compared to all other SSRIs as a group (RR 0.70, 95% CI 0.33 to 1.45, P value 0.34, I² = 83%; five studies, 2175 participants).
There was evidence that agomelatine was associated with a lower rate of participants experiencing vomiting or nausea than paroxetine (RR 0.34, 95% CI 0.23 to 0.52, P value < 0.00001, I² = 0%; two studies, 905 participants, NNTH = 9) There was no evidence that agomelatine was associated with a lower rate of participants experiencing vomiting or nausea compared to fluoxetine (RR 1.54, 95% CI 0.30 to 7.90, P value 0.60, I² = 90%; two studies, 1133 participants) or escitalopram (RR 0.65, 95% CI 0.26 to 1.61, P value 0.35; one study, 137 participants) (see Analysis 1.15). No data were available for sertraline for this outcome.
(k) Diarrhoea
There was no evidence that agomelatine was associated with a lower or higher rate of participants experiencing diarrhoea compared to all other SSRIs as a group (RR 0.80, 95% CI 0.46 to 1.40, P value 0.43, I² = 0%; four studies, 1533 participants).
There was no evidence that agomelatine was associated with a lower or higher rate of participants experiencing diarrhoea than: paroxetine (RR 0.52, 95% CI 0.19 to 1.43, P value 0.21; one study, 572 participants); fluoxetine (RR 1.05, 95% CI 0.37 to 2.96, P value 0.92; one study, 513 participants); sertraline (RR 0.70, 95% CI 0.25 to 1.91, P value 0.48; one study, 311 participants); or escitalopram (RR 1.86, 95% CI 0.35 to 9.82, P value 0.47; one study, 137 participants) (see Analysis 1.16).
(l) Sexual dysfunction
There was evidence that agomelatine was associated with a lower rate of participants experiencing sexual dysfunction than paroxetine (RR 0.14, 95% CI 0.04 to 0.47, P value 0.001; one study, 333 participants, NNTH = 9) (see Analysis 1.17). No data were available for fluoxetine, sertraline and escitalopram for this outcome.
(m) Abnormal liver function tests
There was no statistically significant higher rate of abnormal liver function tests in participants treated with agomelatine compared to all other SSRIs as a group (RR 3.04, 95% CI 0.90 to 10.22, P value 0.07, I² = 0%; four studies, 1755 participants).
There was no statistically significant higher rate of abnormal liver function tests in participants treated with agomelatine compared to: paroxetine (RR 3.04, 95% CI 0.32 to 28.89, P value 0.33; one study, 318 participants); fluoxetine (RR 3.02, 95% CI 0.60 to 15.17, P value 0.18; two studies, 1124 participants); or sertraline (RR 3.10, 95% CI 0.13 to 75.44, P value 0.49; one study, 313 participants). See Analysis 1.18. No data were available for escitalopram for this outcome.
(n) Weight gain
No data reported for this outcome.
(o) Hypertension
No data reported for this outcome.
1.8 Continuous outcome ‐ depression scale endpoint score
There was no evidence that agomelatine was associated with a statistically significant difference compared to the other SSRIs as a group (SMD 0.00; 95% CI ‐0.11 to 0.12, P value 0.94, I² = 66%; ten studies, 3457 participants). There was no evidence that agomelatine was associated with a lower or higher depression endpoint score compared to: paroxetine (SMD 0.16; 95% CI ‐0.11 to 0.43, P value 0.24, I² = 75%; three studies, 882 participants); fluoxetine (SMD ‐0.01; 95% CI ‐0.15 to 0.13, P value 0.87, I² = 54%; four studies, 1816 participants); or escitalopram (SMD ‐0.08; 95% CI ‐0.26 to 0.11, P value 0.42, I² = 0%; two studies, 453 participants).There was a small but statistically significant advantage of agomelatine compared to sertraline (SMD ‐0.23; 95% CI ‐0.46 to ‐0.01, P value 0.04; one study, 306 participants) (see Analysis 1.19).
Comparison two: agomelatine versus other SNRIs
Primary outcome
2.1 Efficacy ‐ number of participants who responded to treatment
There was no evidence that agomelatine was less or more effective than venlafaxine (RR 1.06, 95% CI 0.98 to 1.16, P value 0.16, I² = 0%; three trials, 669 participants) (see Analysis 2.1 and Figure 7).
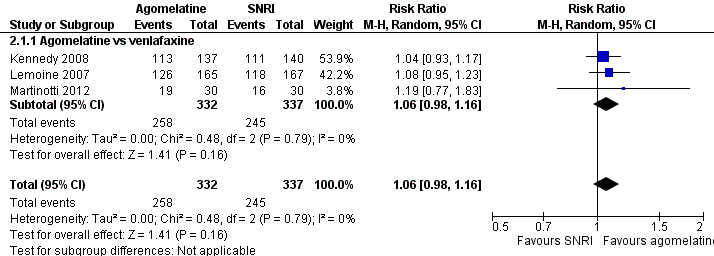
Forest plot of comparison: 2 Agomelatine vs SNRI, outcome: 2.1 Response rates
Secondary outcomes
2.2 Efficacy ‐ number of participants who achieved remission
There was no significant difference in the number of participants who achieved remission between agomelatine and venlafaxine (RR 1.08, 95% CI 0.94 to 1.24, P value 0.26, I² = 0%; three trials, 669 participants) (see Analysis 2.2 and Figure 8).
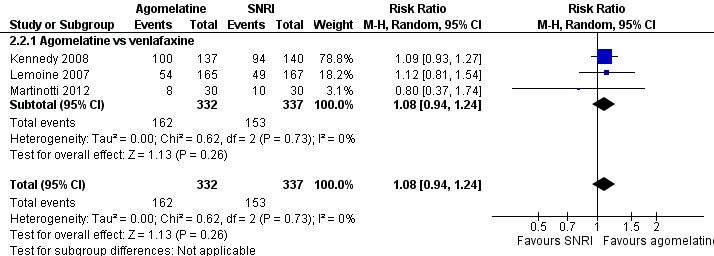
Forest plot of comparison: 2 Agomelatine vs SNRI, outcome: 2.2 Remission rates
2.3 Acceptability ‐ total drop‐out rate
There was evidence that agomelatine was associated with a lower total drop‐out rate than venlafaxine (RR 0.40, 95% CI 0.24 to 0.67, P value 0.0005, I² = 0%; two trials, 392 participants, NNTB = 2) (See Analysis 2.3 and Figure 9).
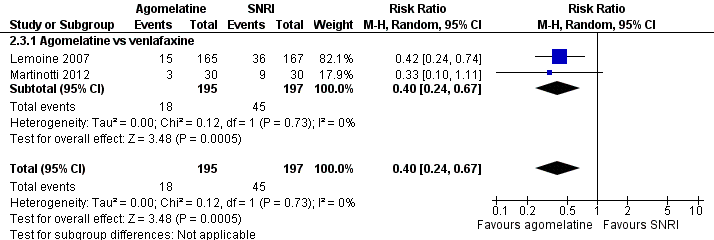
Forest plot of comparison: 2 Agomelatine vs SNRI, outcome: 2.3 Total drop outs
2.4 Acceptability ‐ drop‐out rates due to inefficacy
There was no evidence that agomelatine was associated with a lower or higher drop‐out rate due to inefficacy compared to venlafaxine (RR 1.01, 95% CI 0.21 to 4.94, P value 0.99; one trial, 332 participants) (see Analysis 2.4).
2.5 Acceptability ‐ drop‐out rates due to side effects
There was evidence that agomelatine was associated with a lower drop‐out rate due to side effects compared to venlafaxine (RR 0.30, 95% CI 0.15 to 0.59, P value 0.0006, I² = 0%; two trials, 608 participants, NNTH = 13) (see Analysis 2.5).
2.6 Tolerability ‐ total number of participants experiencing at least some side effects
There was no evidence that fewer or more participants experienced at least some side effects compared to venlafaxine (RR 0.72, 95% CI 0.44 to 1.18, P value 0.19, I² = 80%; two trials, 611 participants) (see Analysis 2.6).
We also analysed the six outcomes above using a fixed‐effect model and noted no change in significance levels and only negligible changes in effect sizes.
2.7 Tolerability ‐ total number of participants experiencing specific side effects
(a) Sleepiness or drowsiness
There was no evidence that agomelatine was associated with a higher rate of participants experiencing sleepiness or drowsiness than venlafaxine (RR 0.76, 95% CI 0.27 to 2.14, P value 0.60; one study, 334 participants) (see Analysis 2.7).
(b) Insomnia
There was no evidence that agomelatine was associated with a higher rate of participants experiencing insomnia than venlafaxine (RR 0.25, 95% CI 0.03 to 2.24, P value 0.22; one study, 332 participants) (see Analysis 2.8).
(c) Dry mouth
There was no evidence that agomelatine was associated with a higher rate of participants experiencing dry mouth than venlafaxine (RR 0.51, 95% CI 0.13 to 1.99, P value 0.33; one study, 332 participants) (see Analysis 2.9).
(d) Constipation
There was no evidence that agomelatine was associated with a higher rate of participants experiencing constipation than venlafaxine (RR 0.87, 95% CI 0.30 to 2.53, P value 0.79; one study, 332 participants) (see Analysis 2.10).
(e) Dizziness
There was evidence that agomelatine was associated with a lower rate of participants experiencing dizziness than venlafaxine (RR 0.19, 95% CI 0.06 to 0.64, P value 0.007, one study, 332 participants, NNTH = 13) (see Analysis 2.11).
(f) Hypotension
No data were available for the comparison of agomelatine and venlafaxine for this outcome.
(g) Agitation or anxiety
No data were available for the comparison of agomelatine and venlafaxine for this outcome.
(h) Suicide wishes, gestures or attempts
No data were available for the comparison of agomelatine and venlafaxine for this outcome.
(i) Completed suicide
No data were available for the comparison of agomelatine and venlafaxine for this outcome.
(j) Vomiting or nausea
There was no evidence that agomelatine was associated with a higher rate of participants experiencing vomiting and nausea than venlafaxine (RR 0.42, 95% CI 0.17 to 1.08, P value 0.07, I² = 80%; two studies, 609 participants) (see Analysis 2.12).
(k) Diarrhoea
There was no evidence that agomelatine was associated with a higher rate of participants experiencing diarrhoea than venlafaxine (RR 2.70, 95% CI 0.73 to 10.00, P value 0.14; one study, 332 participants) (see Analysis 2.13).
(l) Sexual dysfunction
No data were available for the comparison of agomelatine and venlafaxine for this outcome.
(m) Abnormal liver function tests
No data were available for the comparison of agomelatine and venlafaxine for this outcome.
(n) Weight gain
No data were available for the comparison of agomelatine and venlafaxine for this outcome.
(o) Hypertension
No data were available for the comparison of agomelatine and venlafaxine for this outcome.
2.8 Continuous outcome ‐ depression scale endpoint score
There was no evidence that agomelatine was associated with a statistically significant difference compared to venlafaxine (SMD ‐0.07; 95% CI ‐0.22 to 0.08, P value 0.37, I² = 0%; three studies, 668 participants) (see Analysis 2.14).
Comparison three: agomelatine versus other antidepressive agents
No studies were found comparing agomelatine with tricyclic or heterocyclic antidepressants, MAOIs, newer agents (mirtazapine, bupropion, reboxetine), atypical antipsychotics in monotherapy (risperidone, paliperidone, olanzapine, quetiapine, aripiprazole, amisulpride, ziprasidone) or non‐conventional antidepressive agents (herbal products such as Hypericum).
Subgroup analyses
Where possible, the pre‐planned subgroup analyses were conducted for the primary outcome. Results were interpreted with caution, because of the small number of studies included. Furthermore, multiple comparisons could lead to false positive conclusions (Oxman 1992).
(a) Agomelatine dosing (fixed low dosage: 25 mg/day; fixed high dosage: 50 mg and above; flexible high and flexible low)
Subgroup analyses of fixed versus flexible dosages were performed for the comparisons of agomelatine with SSRIs (Analysis 1.20), and agomelatine with venlafaxine (Analysis 2.15). There was no evidence for a difference between flexible or fixed dosage schemes for the former comparison (P value 0.42) or the latter (P value 0.74).
(b) Severity of depression (mild, moderate, severe depression)
Mean HAM‐D scores of the agomelatine groups ranged from 25.7 (CL3‐023), to 28.7 (Martinotti 2012). Kennedy 2008 reported a mean MADRS score of 17.9 at baseline. We defined 'severe depression' at a threshold of 25 or more for HAM‐D and 31 or more on MADRS (Müller 2003); this meant that all the trials, except for one (Kennedy 2008), were rated as trials in severe depression. The subgroup analysis was conducted, therefore, for agomelatine versus SNRIs only. There was no evidence (P value 0.59) of a difference in response rates of agomelatine compared to venlafaxine for severely depressed (RR 1.09, 95% CI 0.96 to 1.23, P value 0.18; two studies, 392 participants) or moderate depressed participants (RR 1.04, 95% CI 0.93 to 1.17, P value 0.50; one study, 277 participants) (see Analysis 2.16).
(c) Treatment settings (primary care, psychiatric inpatients, or psychiatric outpatients)
No study was conducted in a primary care or inpatient setting only. One study did not report detailed setting information (CAGO2303). All other studies included outpatients only or in‐ and outpatients without separating the two groups. Therefore, it was not meaningful to carry out this subgroup‐analysis.
(d) Older participants (participants aged 65 years or more) versus other adult participants
None of the included studies specifically recruited older participants. Only one study recruited participants up to 70 years of age (CAGO2303), all others included participants under 65 years of age. Therefore, this subgroup analysis could not be performed.
(e) Examination of 'wish bias' by comparing agomelatine as the investigational drug versus agomelatine as the comparator
Only one study that used agomelatine as the investigational drug was not conducted by the manufacturer of agomelatine (Martinotti 2012). Accordingly, it was not considered meaningful to perform this subgroup analyses.
(f) Examination of publication bias by assessing response to agomelatine in unpublished studies versus response to agomelatine in published studies
Four unpublished studies were included in the review, all comparing agomelatine to SSRIs (see CAGO2303, CL3‐022, CL3‐023, CL3‐024 and Analysis 1.30). This analysis showed a significant difference between published and unpublished trials (P value 0.009), with a better outcome for participants in the published trials who were treated with agomelatine.
Sensitivity analyses
(a) Excluding trials with unclear concealment of random allocation or unclear double blinding, or both; and trials with inadequate concealment of random allocation
We rated all but two studies as having an unclear risk of bias for allocation concealment (Martinotti 2012; Quera‐Salva 2011). Martinotti 2012 compared agomelatine to venlafaxine (an SNRI), and Quera‐Salva 2011 compared agomelatine to escitalopram (an SSRI). Consequently, it was not considered meaningful to conduct this sensitivity analysis.
(b) Excluding trials with drop‐out rates greater than 20%
Four studies reported overall drop‐out rates of more than 20% and were excluded (CAGO2303; CL3‐024; Loo 2002a; Shu 2013). Kennedy 2008 did not report drop‐out rates and was also excluded. Martinotti 2012 reported drop‐out rates of exactly 20%. Excluding the studies with drop‐out rates over 20%, results from the sensitivity analysis changed the findings only marginally (see Analysis 1.21 and Analysis 2.17).
(c) Worst‐case scenario and best‐case scenario ITT analyses
All studies calculated response and remission rates based on ITT population as defined by the authors. Therefore, participants who terminated their participation in the study early by dropping out could also be responders or remitters. Accordingly, we calculated the best‐ and worst‐case scenarios only for participants who were not included in the ITT analysis. Two studies did not report difference between ITT samples and randomised participants and were left unchanged (Lemoine 2007; Martinotti 2012). One study did not report the number of participants included in the ITT analysis and was also left unchanged (Corruble 2013). Although the analyses did not differ significantly from the main analyses (see Analysis 1.25; Analysis 1.26; Analysis 1.27; Analysis 1.28; Analysis 2.19; Analysis 2.20; Analysis 2.21; Analysis 2.22), the worst‐case scenario for remission rates showed a small but significant effect in favour of SSRIs (RR 0.73, 95% CI 0.57 to 0.94, P value 0.01, I² = 76%; ten studies, 3502 participants, see Analysis 1.28).
(d) Excluding trials for which the response or remission rates had to be calculated based on the imputation method and those for which the SD had to be borrowed from other trials
Response rates were imputed for two SSRI studies (CL3‐023; CL3‐024). The exclusion of these trials changed the results only marginally (Analysis 1.22). No response rates were imputed in studies that compared agomelatine to SNRIs.
Remission rates were imputed for four studies that compared agomelatine to SSRIs (CL3‐023; CL3‐024; Quera‐Salva 2011; Shu 2013), and one study that compared agomelatine to an SNRI (Lemoine 2007). The exclusion of these studies did not change the results of the overall estimates comparing agomelatine with SSRIs as a group or SNRIs substantially (Analysis 1.23 and Analysis 2.18). However, exclusion of one study, CL3‐023, led to a significant difference in the number of participants who achieved remission between agomelatine and paroxetine, with a lower number of remitters when treated with agomelatine (RR 0.90, 95% CI 0.67 to 1.21, P value 0.02; I² = 78%; two trials, 909 participants).
Post test SDs were imputed for one study (Corruble 2013). Exclusion of this study did not change the results significantly (see Analysis 1.24).
(e) Excluding all cross‐over trials
This review did not include any cross‐over trials.
(f) Excluding studies funded by the pharmaceutical company that manufactures agomelatine
Only one of the included studies was not conducted by Servier, the manufacturer of agomelatine (Martinotti 2012), so it was not considered meaningful to conduct this sensitivity analysis.
(g) Excluding studies in which there were any participants diagnosed with bipolar depression
Only one study allowed the inclusion of bipolar participants (Loo 2002a). Exclusion of this study showed no difference between agomelatine and paroxetine (RR 0.84, 95% CI 0.70 to 1.03, P value 0.09, I² = 32%; two studies, 617 participants) (see Analysis 1.29).
Reporting bias
We did not use funnel plots to investigate publication bias, because none of the comparisons contained more than 10 studies. The review included four unpublished trials (CAGO2303; CL3‐022; CL3‐023; CL3‐024), but the Studies awaiting classification section lists further unpublished trials. We added an additional subgroup analyses to compare published and unpublished trials (Analysis 1.30).
Discussion
Summary of main results
A total of 13 studies (4495 participants) were included in this review. Agomelatine does not seem to have any clinically significant advantage over other antidepressants, in terms of efficacy, for response or remission, for the acute phase treatment of major depression. It may even have some disadvantages compared to other antidepressants, in terms of remission. Overall, agomelatine appeared to be slightly better tolerated than venlafaxine, and showed the same level of tolerability as the other SSRIs examined (fluoxetine, sertraline, paroxetine and escitalopram). Agomelatine was associated with a lower rate of dizziness than venlafaxine, and a lower rate of vomiting and nausea than paroxetine. Agomelatine also appeared to be associated with less sexual dysfunction than paroxetine, although only one study was included in that analysis. With regard to liver function test abnormalities, the evidence for agomelatine compared to paroxetine, fluoxetine or sertraline, is inconclusive. Although our analysis did not reach statistical significance, all comparisons showed a risk ratio greater than 3, indicating an increased risk of liver function abnormalities in people treated with agomelatine, but only four studies could be included in these analyses. In the light of the recently updated contraindication for people with increased transaminase levels due to reports of liver injuries and hepatic failures (Servier 2013), it seems likely that these elevations are clinically relevant and masked in our review due to a reporting bias. Unfortunately, agomelatine was compared to a limited number of antidepressants, only SSRIs and venlafaxine, which limits the generalisability of the results. We found no clear evidence that agomelatine has advantages over other antidepressants. There is limited evidence that agomelatine could be more tolerable than venlafaxine, but this is based only on two studies with a limited number of events.
Please see summary of findings Table for the main comparison and summary of findings Table 2 for more details.
Overall completeness and applicability of evidence
The present review focused on the comparison between agomelatine and other antidepressants. This may limit the applicability of the findings as, ideally, an agent should be assessed against placebo. Data from seven unpublished studies were included in our review, but, given the number of completed studies awaiting assessment, we can not be sure that all unpublished material has been included. Furthermore, there was a high chance of selective reporting bias, especially for analysis of side effects. For example, data from placebo‐controlled studies submitted to the European Medicines Agency showed that agomelatine was consistently associated with a significantly higher incidence of abnormal liver function tests than placebo. Moreover, a recent review based on surveillance data from the French national monitoring system, EU periodic safety update reports (PSURs), and the European pharmacovigilance database concluded that the harms associated with agomelatine may outweigh its benefits (Prescrire 2013). Thus, the evidence is insufficient to guide treatment decisions based on considerations of side effects. Furthermore, the number of studies for each comparator was quite small, limiting the applicability of the findings. Indeed, only one trial included participants over 70 years of age, and no study was conducted in a primary care setting, which further limits the generalisability of the evidence. It may also be possible that the population selected, given the stringent exclusion criteria employed in the studies, may not have been representative of the 'real world' population. Often, 'real' patients with depressive disorder have several co‐morbidities (physical or psychiatric), and this may not be accurately reflected in the severity of the condition evident in participants in the RCTs.
Quality of the evidence
We chose six outcomes for assessing the quality of evidence and to construct the 'Summary of findings' tables (the chosen outcomes being response rates; remission rates; total drop outs; drop outs due to inefficacy; drop outs due to side effects; total number of participants with side effects). We constructed two separate 'Summary of findings' tables: one for agomelatine compared to SSRIs (summary of findings Table for the main comparison), and one for agomelatine compared to SNRIs (summary of findings Table 2). The quality of the evidence was low and outcomes may have been selectively reported, particularly in the unpublished material, which limits the generalisability of our findings. Ten out of 11 studies were sponsored by the pharmaceutical company that manufactures agomelatine (Servier). Evidence shows that sponsored trials may be associated with a more favourable outcome (Lundh 2012), so the results in this review should be considered with caution.
Study limitations (risk of bias)
We judged that the studies have a moderate risk of bias for all outcomes. There were several unpublished studies in our review, which may not have reported all the outcomes. Also, unpublished studies may not have been subject to peer review. We decided to downgrade the quality of evidence by one level accordingly.
Consistency of effect
Studies showed some heterogeneity, and our additional analysis revealed a significant difference between published and unpublished studies in the 'response rates' outcome; we decided to downgrade the quality of evidence by one level for this outcome. The other outcomes did not show any significant evidence of heterogeneity and, therefore, we did not downgrade the level of evidence.
Indirectness
The studies included in our review were conducted in inpatient and outpatient settings, so results may not be generalisable to the primary care setting. Therefore we downgraded the quality of evidence for all the outcomes, by one level.
Imprecision
The results on efficacy showed a variable level of precision depending on the outcome. With regard to the efficacy outcomes, the 'response rates' and 'remission rates' showed sufficient precision. The tolerability outcomes, on the other hand, were mostly imprecise. The 'total drop outs' and 'drop outs due to inefficacy' outcomes had large CIs. The 'drop outs due to side effects' outcome had a narrow confidence interval but the event rate was low. We decided to the downgrade for imprecision, based on the tolerability outcomes. The 'total number of participants with side effects' outcome, showed a narrow confidence interval in addition to a high event rate, so we did not downgrade it for imprecision.
Publication bias
In accordance with the protocol, publication bias was not formally assessed by funnel plot analyses, because all analyses included fewer than 10 studies. Our review included unpublished studies and we think that this reduced the impact of publication bias. Our additional subgroup analysis showed a clear difference between published and unpublished trials, and we are aware of a number of unpublished studies that we were not able to include. Therefore, our results may still be biased to some extent. Furthermore, these studies may raise further doubts with regard to the generalisabilty of the results. For example, one unpublished study compared agomelatine to paroxetine in older people (CL3‐048), and according to data from this study included in a pooled analysis (Kasper 2013), agomelatine was not more effective than paroxetine in this study.
Overall the quality of the evidence was quite low.
Potential biases in the review process
Some biases and limitations can be noted.
-
We tried to perform a thorough article search, however, it is possible that we missed some relevant studies. Some of the data from this review come from unpublished material, and it may be possible that more unpublished studies have not been identified.
-
Some of the included studies were not designed to test efficacy of agomelatine as a primary outcome (Lemoine 2007; Martinotti 2012; Quera‐Salva 2011), but focused on sleep (Lemoine 2007; Quera‐Salva 2011), and anhedonia (Martinotti 2012), though they did include data for efficacy and tolerability. This means that the applicability of the results may be limited, because the studies may not have been sufficiently powered to detect differences in depressive symptoms.
Agreements and disagreements with other studies or reviews
A recent pooled analysis on agomelatine compared to SSRIs and SNRIs has been published (Kasper 2013). This review is very similar in scope to our review, but the authors did not conduct a systematic literature review and only included trials without placebo control groups. The authors concluded that agomelatine can be used as first‐line treatment for depression, however, the study included only six of the studies that are analysed in the present review. Moreover, only one unpublished study was included, which could mean that Kasper 2013 is at greater risk of having publication bias than this systematic review. Another systematic review of published trials comparing agomelatine to placebo and SSRIs and SNRIs concluded that agomelatine had a marginal superior effect compared to other antidepressants (Singh 2011). Although the review included published trials only, the authors judged the effect to be 'fragile' and not clinically relevant. The review included only five of the studies included in our review and combined SSRIs and SNRIs as comparators.
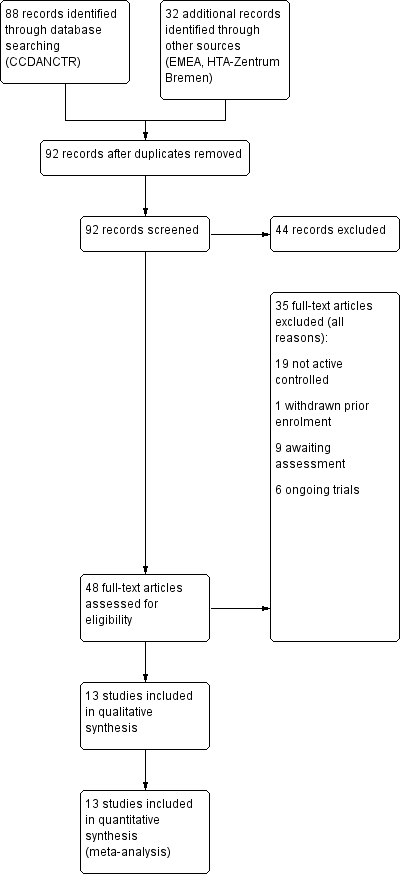
Study flow diagram

Risk of bias graph: review authors' judgements about each risk of bias item presented as percentages across all included studies

Risk of bias summary: review authors' judgements about each risk of bias item for each included study

Forest plot of comparison: 1 Agomelatine vs SSRI, outcome: 1.1 Response rates

Forest plot of comparison: 1 Agomelatine vs SSRI, outcome: 1.2 Remission rates

Forest plot of comparison: 1 Agomelatine vs SSRI, outcome: 1.3 Total drop outs

Forest plot of comparison: 2 Agomelatine vs SNRI, outcome: 2.1 Response rates

Forest plot of comparison: 2 Agomelatine vs SNRI, outcome: 2.2 Remission rates

Forest plot of comparison: 2 Agomelatine vs SNRI, outcome: 2.3 Total drop outs

Comparison 1 Agomelatine vs SSRI, Outcome 1 Response rates.

Comparison 1 Agomelatine vs SSRI, Outcome 2 Remission rates.

Comparison 1 Agomelatine vs SSRI, Outcome 3 Total drop outs.

Comparison 1 Agomelatine vs SSRI, Outcome 4 Drop out due to inefficacy.

Comparison 1 Agomelatine vs SSRI, Outcome 5 Drop outs due to side effects.

Comparison 1 Agomelatine vs SSRI, Outcome 6 Total number of patients with side effects.
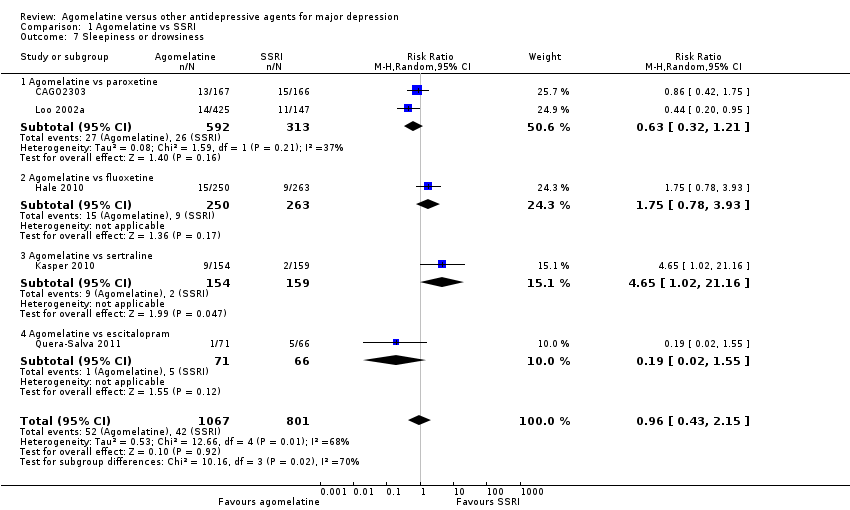
Comparison 1 Agomelatine vs SSRI, Outcome 7 Sleepiness or drowsiness.

Comparison 1 Agomelatine vs SSRI, Outcome 8 Insomnia.
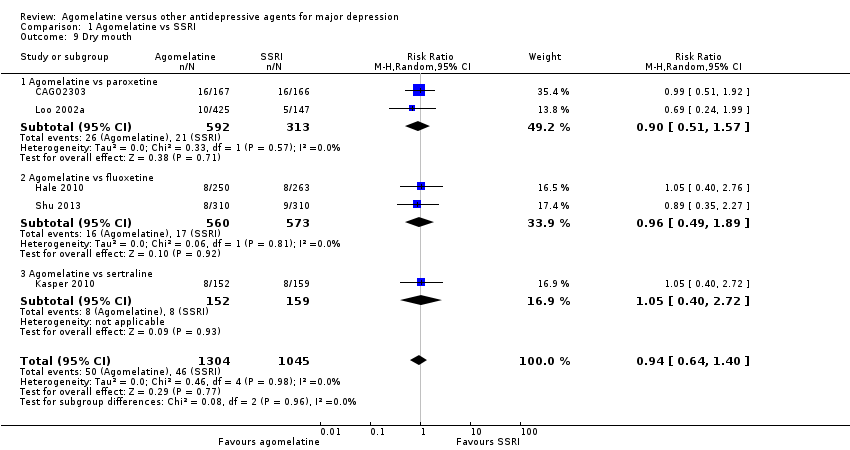
Comparison 1 Agomelatine vs SSRI, Outcome 9 Dry mouth.

Comparison 1 Agomelatine vs SSRI, Outcome 10 Constipation.

Comparison 1 Agomelatine vs SSRI, Outcome 11 Dizziness.

Comparison 1 Agomelatine vs SSRI, Outcome 12 Agitation or anxiety.
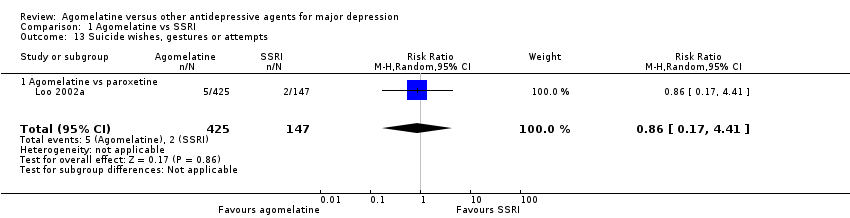
Comparison 1 Agomelatine vs SSRI, Outcome 13 Suicide wishes, gestures or attempts.

Comparison 1 Agomelatine vs SSRI, Outcome 14 Completed suicide.

Comparison 1 Agomelatine vs SSRI, Outcome 15 Vomiting or nausea.

Comparison 1 Agomelatine vs SSRI, Outcome 16 Diarrhoea.

Comparison 1 Agomelatine vs SSRI, Outcome 17 Sexual dysfunction.
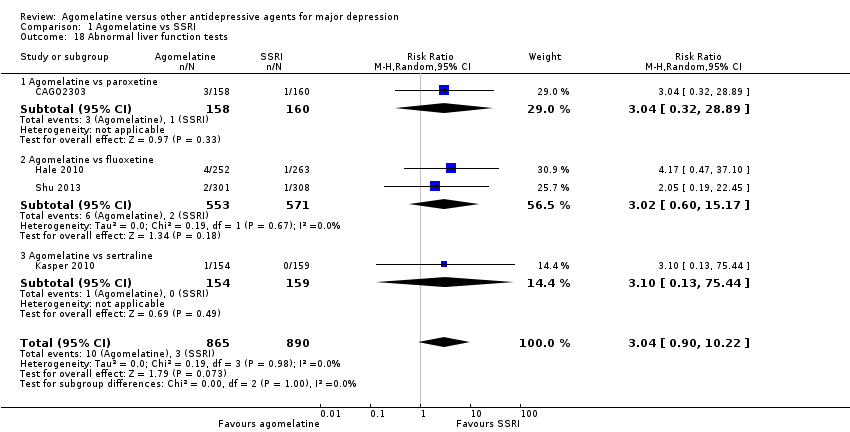
Comparison 1 Agomelatine vs SSRI, Outcome 18 Abnormal liver function tests.

Comparison 1 Agomelatine vs SSRI, Outcome 19 Depression scales endpoint score.

Comparison 1 Agomelatine vs SSRI, Outcome 20 Subgroup analysis: dosing ‐ response rates.

Comparison 1 Agomelatine vs SSRI, Outcome 21 Sensitivity analysis: excluding trials with > 20% drop outs ‐ response rates.

Comparison 1 Agomelatine vs SSRI, Outcome 22 Sensitivity analysis: excluding imputed response rates.

Comparison 1 Agomelatine vs SSRI, Outcome 23 Sensitivity analysis: excluding imputed remission rates.

Comparison 1 Agomelatine vs SSRI, Outcome 24 Sensitivity analysis: excluding trials with imputed SDs.

Comparison 1 Agomelatine vs SSRI, Outcome 25 Sensitivity analysis: response rates ‐ best case.

Comparison 1 Agomelatine vs SSRI, Outcome 26 Sensitivity analysis: response rates ‐ worst case.

Comparison 1 Agomelatine vs SSRI, Outcome 27 Sensitivity analysis: remission rates ‐ best case.

Comparison 1 Agomelatine vs SSRI, Outcome 28 Sensitivity analysis:remission rates ‐ worst case.

Comparison 1 Agomelatine vs SSRI, Outcome 29 Sensitivity anal': excluding studies with bipolar participants ‐ response rates.

Comparison 1 Agomelatine vs SSRI, Outcome 30 Additional subgroup analysis: unpublished vs published trials ‐ response rates.

Comparison 2 Agomelatine vs SNRI, Outcome 1 Response rates.

Comparison 2 Agomelatine vs SNRI, Outcome 2 Remission rates.

Comparison 2 Agomelatine vs SNRI, Outcome 3 Total drop outs.

Comparison 2 Agomelatine vs SNRI, Outcome 4 Drop out due to inefficacy.

Comparison 2 Agomelatine vs SNRI, Outcome 5 Drop outs due to side effects.
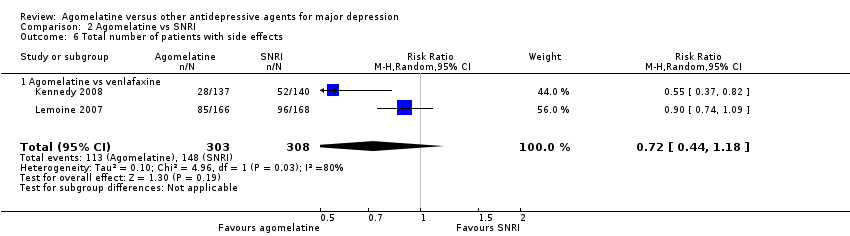
Comparison 2 Agomelatine vs SNRI, Outcome 6 Total number of patients with side effects.

Comparison 2 Agomelatine vs SNRI, Outcome 7 Sleepiness or drowsiness.

Comparison 2 Agomelatine vs SNRI, Outcome 8 Insomnia.

Comparison 2 Agomelatine vs SNRI, Outcome 9 Dry mouth.

Comparison 2 Agomelatine vs SNRI, Outcome 10 Constipation.

Comparison 2 Agomelatine vs SNRI, Outcome 11 Dizziness.

Comparison 2 Agomelatine vs SNRI, Outcome 12 Vomiting or nausea.

Comparison 2 Agomelatine vs SNRI, Outcome 13 Diarrhoea.

Comparison 2 Agomelatine vs SNRI, Outcome 14 Depression scales endpoint score.

Comparison 2 Agomelatine vs SNRI, Outcome 15 Subgroup analysis: dosing ‐ response rates.

Comparison 2 Agomelatine vs SNRI, Outcome 16 Subgroup analysis: severity ‐ response rates.
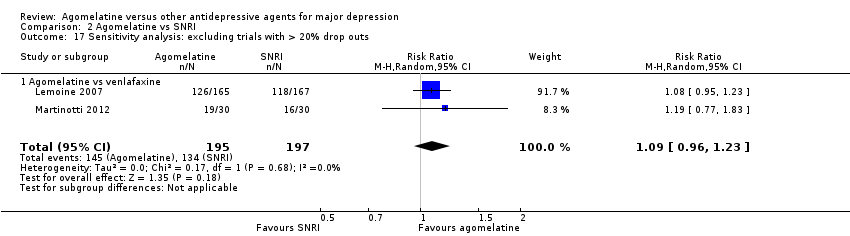
Comparison 2 Agomelatine vs SNRI, Outcome 17 Sensitivity analysis: excluding trials with > 20% drop outs.

Comparison 2 Agomelatine vs SNRI, Outcome 18 Sensitivity analysis: excluding imputed remission rates.

Comparison 2 Agomelatine vs SNRI, Outcome 19 Sensitivity analysis: response rates ‐ best case.

Comparison 2 Agomelatine vs SNRI, Outcome 20 Sensitivity analysis: response rates ‐ worst case.
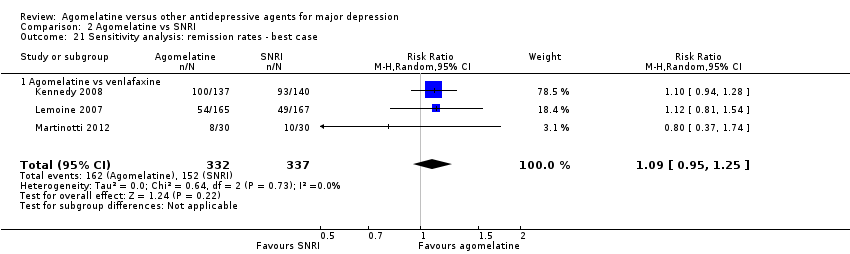
Comparison 2 Agomelatine vs SNRI, Outcome 21 Sensitivity analysis: remission rates ‐ best case.

Comparison 2 Agomelatine vs SNRI, Outcome 22 Sensitivity analysis: remission rates ‐ worst case.
| Agomelatine compared to SSRI for major depression | ||||||
| Patient or population: patients with major depression | ||||||
| Outcomes | Illustrative comparative risks* (95% CI) | Relative effect | No of Participants | Quality of the evidence | Comments | |
| Assumed risk | Corresponding risk | |||||
| SSRI | Agomelatine | |||||
| Response rates | Study population | RR 1.01 | 3826 | ⊕⊝⊝⊝ | ||
| 610 per 1000 | 616 per 1000 | |||||
| Moderate | ||||||
| 557 per 1000 | 563 per 1000 | |||||
| Remission rates | Study population | RR 0.83 | 3826 | ⊕⊝⊝⊝ | Most of the difference in heterogeneity existed between published and unpublished studies | |
| 363 per 1000 | 302 per 1000 | |||||
| Moderate | ||||||
| 264 per 1000 | 219 per 1000 | |||||
| Total drop outs | Study population | RR 0.95 | 3826 | ⊕⊝⊝⊝ | ||
| 189 per 1000 | 180 per 1000 | |||||
| Moderate | ||||||
| 188 per 1000 | 179 per 1000 | |||||
| Drop out due to inefficacy | Study population | RR 0.99 | 3377 | ⊕⊝⊝⊝ | ||
| 44 per 1000 | 43 per 1000 | |||||
| Moderate | ||||||
| 49 per 1000 | 49 per 1000 | |||||
| Drop outs due to side effects | Study population | RR 0.68 | 3377 | ⊕⊝⊝⊝ | ||
| 70 per 1000 | 47 per 1000 | |||||
| Moderate | ||||||
| 65 per 1000 | 44 per 1000 | |||||
| Total number of participants with side effects | Study population | RR 0.91 | 2490 | ⊕⊝⊝⊝ | ||
| 594 per 1000 | 540 per 1000 | |||||
| Moderate | ||||||
| 611 per 1000 | 556 per 1000 | |||||
| *The basis for the assumed risk (e.g. the median control group risk across studies) is provided in footnotes. The corresponding risk (and its 95% confidence interval) is based on the assumed risk in the comparison group and the relative effect of the intervention (and its 95% CI). | ||||||
| GRADE Working Group grades of evidence | ||||||
| 1 Most studies were funded by the pharmaceutical company that manufactures agomelatine (Servier). Four out of ten studies were unpublished | ||||||
| Agomelatine compared to SNRI for major depression | ||||||
| Patient or population: patients with major depression | ||||||
| Outcomes | Illustrative comparative risks* (95% CI) | Relative effect | No of Participants | Quality of the evidence | Comments | |
| Assumed risk | Corresponding risk | |||||
| SNRI | Agomelatine | |||||
| Response rates | Study population | RR 1.06 | 669 | ⊕⊝⊝⊝ | ||
| 727 per 1000 | 771 per 1000 | |||||
| Moderate | ||||||
| 707 per 1000 | 749 per 1000 | |||||
| Remission rates | Study population | RR 1.08 | 669 | ⊕⊝⊝⊝ | ||
| 454 per 1000 | 490 per 1000 | |||||
| Moderate | ||||||
| 333 per 1000 | 360 per 1000 | |||||
| Total drop outs | Study population | RR 0.4 | 392 | ⊕⊝⊝⊝ | ||
| 228 per 1000 | 91 per 1000 | |||||
| Moderate | ||||||
| 258 per 1000 | 103 per 1000 | |||||
| Drop out due to inefficacy | Study population | RR 1.01 | 332 | ⊕⊝⊝⊝ | ||
| 18 per 1000 | 18 per 1000 | |||||
| Moderate | ||||||
| 18 per 1000 | 18 per 1000 | |||||
| Drop outs due to side effects | Study population | RR 0.3 | 608 | ⊕⊝⊝⊝ | ||
| 111 per 1000 | 33 per 1000 | |||||
| Moderate | ||||||
| 109 per 1000 | 33 per 1000 | |||||
| Total number of patients with side effects | Study population | RR 0.72 | 611 | ⊕⊝⊝⊝ | ||
| 481 per 1000 | 346 per 1000 | |||||
| Moderate | ||||||
| 471 per 1000 | 339 per 1000 | |||||
| *The basis for the assumed risk (e.g. the median control group risk across studies) is provided in footnotes. The corresponding risk (and its 95% confidence interval) is based on the assumed risk in the comparison group and the relative effect of the intervention (and its 95% CI). | ||||||
| GRADE Working Group grades of evidence | ||||||
| 1 The studies included in our review were conducted in inpatient and outpatient settings. Results may not be generalisable for a primary care setting | ||||||
| Outcome or subgroup title | No. of studies | No. of participants | Statistical method | Effect size |
| 1 Response rates Show forest plot | 10 | 3826 | Risk Ratio (M‐H, Random, 95% CI) | 1.01 [0.95, 1.08] |
| 1.1 Agomelatine vs paroxetine | 3 | 1189 | Risk Ratio (M‐H, Random, 95% CI) | 0.92 [0.77, 1.09] |
| 1.2 Agomelatine vs fluoxetine | 4 | 1862 | Risk Ratio (M‐H, Random, 95% CI) | 1.01 [0.92, 1.11] |
| 1.3 Agomelatine vs sertraline | 1 | 313 | Risk Ratio (M‐H, Random, 95% CI) | 1.11 [0.94, 1.30] |
| 1.4 Agomelatine vs escitalopram | 2 | 462 | Risk Ratio (M‐H, Random, 95% CI) | 1.05 [0.95, 1.16] |
| 2 Remission rates Show forest plot | 10 | 3826 | Risk Ratio (M‐H, Random, 95% CI) | 0.83 [0.68, 1.01] |
| 2.1 Agomelatine vs paroxetine | 3 | 1189 | Risk Ratio (M‐H, Random, 95% CI) | 0.61 [0.32, 1.18] |
| 2.2 Agomelatine vs fluoxetine | 4 | 1862 | Risk Ratio (M‐H, Random, 95% CI) | 0.76 [0.55, 1.05] |
| 2.3 Agomelatine vs sertraline | 1 | 313 | Risk Ratio (M‐H, Random, 95% CI) | 1.12 [0.80, 1.58] |
| 2.4 Agomelatine vs escitalopram | 2 | 462 | Risk Ratio (M‐H, Random, 95% CI) | 1.13 [0.94, 1.35] |
| 3 Total drop outs Show forest plot | 10 | 3826 | Risk Ratio (M‐H, Random, 95% CI) | 0.95 [0.83, 1.09] |
| 3.1 Agomelatine vs paroxetine | 3 | 1189 | Risk Ratio (M‐H, Random, 95% CI) | 1.01 [0.80, 1.28] |
| 3.2 Agomelatine vs fluoxetine | 4 | 1862 | Risk Ratio (M‐H, Random, 95% CI) | 0.96 [0.74, 1.26] |
| 3.3 Agomelatine vs sertraline | 1 | 313 | Risk Ratio (M‐H, Random, 95% CI) | 0.72 [0.43, 1.21] |
| 3.4 Agomelatine vs escitalopram | 2 | 462 | Risk Ratio (M‐H, Random, 95% CI) | 0.81 [0.50, 1.32] |
| 4 Drop out due to inefficacy Show forest plot | 9 | 3377 | Risk Ratio (M‐H, Random, 95% CI) | 0.99 [0.71, 1.37] |
| 4.1 Agomelatine vs paroxetine | 3 | 1189 | Risk Ratio (M‐H, Random, 95% CI) | 1.07 [0.64, 1.80] |
| 4.2 Agomelatine vs fluoxetine | 3 | 1413 | Risk Ratio (M‐H, Random, 95% CI) | 0.97 [0.57, 1.65] |
| 4.3 Agomelatine vs sertraline | 1 | 313 | Risk Ratio (M‐H, Random, 95% CI) | 0.52 [0.16, 1.68] |
| 4.4 Agomelatine vs escitalopram | 2 | 462 | Risk Ratio (M‐H, Random, 95% CI) | 1.34 [0.43, 4.21] |
| 5 Drop outs due to side effects Show forest plot | 9 | 3377 | Risk Ratio (M‐H, Random, 95% CI) | 0.68 [0.51, 0.91] |
| 5.1 Agomelatine vs paroxetine | 3 | 1189 | Risk Ratio (M‐H, Random, 95% CI) | 0.83 [0.49, 1.41] |
| 5.2 Agomelatine vs fluoxetine | 3 | 1413 | Risk Ratio (M‐H, Random, 95% CI) | 0.74 [0.50, 1.09] |
| 5.3 Agomelatine vs sertraline | 1 | 313 | Risk Ratio (M‐H, Random, 95% CI) | 0.37 [0.14, 1.00] |
| 5.4 Agomelatine vs escitalopram | 2 | 462 | Risk Ratio (M‐H, Random, 95% CI) | 0.40 [0.15, 1.06] |
| 6 Total number of patients with side effects Show forest plot | 6 | 2490 | Risk Ratio (M‐H, Random, 95% CI) | 0.91 [0.84, 0.98] |
| 6.1 Agomelatine vs paroxetine | 2 | 905 | Risk Ratio (M‐H, Random, 95% CI) | 0.86 [0.78, 0.94] |
| 6.2 Agomelatine vs fluoxetine | 2 | 1141 | Risk Ratio (M‐H, Random, 95% CI) | 1.00 [0.89, 1.11] |
| 6.3 Agomelatine vs sertraline | 1 | 307 | Risk Ratio (M‐H, Random, 95% CI) | 0.98 [0.78, 1.23] |
| 6.4 Agomelatine vs escitalopram | 1 | 137 | Risk Ratio (M‐H, Random, 95% CI) | 0.81 [0.66, 0.99] |
| 7 Sleepiness or drowsiness Show forest plot | 5 | 1868 | Risk Ratio (M‐H, Random, 95% CI) | 0.96 [0.43, 2.15] |
| 7.1 Agomelatine vs paroxetine | 2 | 905 | Risk Ratio (M‐H, Random, 95% CI) | 0.63 [0.32, 1.21] |
| 7.2 Agomelatine vs fluoxetine | 1 | 513 | Risk Ratio (M‐H, Random, 95% CI) | 1.75 [0.78, 3.93] |
| 7.3 Agomelatine vs sertraline | 1 | 313 | Risk Ratio (M‐H, Random, 95% CI) | 4.65 [1.02, 21.16] |
| 7.4 Agomelatine vs escitalopram | 1 | 137 | Risk Ratio (M‐H, Random, 95% CI) | 0.19 [0.02, 1.55] |
| 8 Insomnia Show forest plot | 2 | 1192 | Risk Ratio (M‐H, Random, 95% CI) | 0.78 [0.38, 1.59] |
| 8.1 Agomelatine vs paroxetine | 1 | 572 | Risk Ratio (M‐H, Random, 95% CI) | 0.54 [0.21, 1.38] |
| 8.2 Agomelatine vs fluoxetine | 1 | 620 | Risk Ratio (M‐H, Random, 95% CI) | 1.13 [0.44, 2.88] |
| 9 Dry mouth Show forest plot | 5 | 2349 | Risk Ratio (M‐H, Random, 95% CI) | 0.94 [0.64, 1.40] |
| 9.1 Agomelatine vs paroxetine | 2 | 905 | Risk Ratio (M‐H, Random, 95% CI) | 0.90 [0.51, 1.57] |
| 9.2 Agomelatine vs fluoxetine | 2 | 1133 | Risk Ratio (M‐H, Random, 95% CI) | 0.96 [0.49, 1.89] |
| 9.3 Agomelatine vs sertraline | 1 | 311 | Risk Ratio (M‐H, Random, 95% CI) | 1.05 [0.40, 2.72] |
| 10 Constipation Show forest plot | 1 | 513 | Risk Ratio (M‐H, Random, 95% CI) | 2.81 [0.75, 10.46] |
| 10.1 Agomelatine vs fluoxetine | 1 | 513 | Risk Ratio (M‐H, Random, 95% CI) | 2.81 [0.75, 10.46] |
| 11 Dizziness Show forest plot | 4 | 1603 | Risk Ratio (M‐H, Random, 95% CI) | 1.00 [0.64, 1.55] |
| 11.1 Agomelatine vs paroxetine | 1 | 333 | Risk Ratio (M‐H, Random, 95% CI) | 0.80 [0.32, 1.96] |
| 11.2 Agomelatine vs fluoxetine | 2 | 1133 | Risk Ratio (M‐H, Random, 95% CI) | 1.17 [0.71, 1.94] |
| 11.3 Agomelatine vs escitalopram | 1 | 137 | Risk Ratio (M‐H, Random, 95% CI) | 0.23 [0.03, 2.03] |
| 12 Agitation or anxiety Show forest plot | 2 | 1192 | Risk Ratio (M‐H, Random, 95% CI) | 1.02 [0.46, 2.27] |
| 12.1 Agomelatine vs paroxetine | 1 | 572 | Risk Ratio (M‐H, Random, 95% CI) | 1.21 [0.40, 3.62] |
| 12.2 Agomelatine vs fluoxetine | 1 | 620 | Risk Ratio (M‐H, Random, 95% CI) | 0.83 [0.26, 2.70] |
| 13 Suicide wishes, gestures or attempts Show forest plot | 1 | 572 | Risk Ratio (M‐H, Random, 95% CI) | 0.86 [0.17, 4.41] |
| 13.1 Agomelatine vs paroxetine | 1 | 572 | Risk Ratio (M‐H, Random, 95% CI) | 0.86 [0.17, 4.41] |
| 14 Completed suicide Show forest plot | 1 | 572 | Risk Ratio (M‐H, Random, 95% CI) | 0.35 [0.02, 5.49] |
| 14.1 Agomelatine vs paroxetine | 1 | 572 | Risk Ratio (M‐H, Random, 95% CI) | 0.35 [0.02, 5.49] |
| 15 Vomiting or nausea Show forest plot | 5 | 2175 | Risk Ratio (M‐H, Random, 95% CI) | 0.70 [0.33, 1.45] |
| 15.1 Agomelatine vs paroxetine | 2 | 905 | Risk Ratio (M‐H, Random, 95% CI) | 0.34 [0.23, 0.52] |
| 15.2 Agomelatine vs fluoxetine | 2 | 1133 | Risk Ratio (M‐H, Random, 95% CI) | 1.54 [0.30, 7.90] |
| 15.3 Agomelatine vs escitalopram | 1 | 137 | Risk Ratio (M‐H, Random, 95% CI) | 0.65 [0.26, 1.61] |
| 16 Diarrhoea Show forest plot | 4 | 1533 | Risk Ratio (M‐H, Random, 95% CI) | 0.80 [0.46, 1.40] |
| 16.1 Agomelatine vs paroxetine | 1 | 572 | Risk Ratio (M‐H, Random, 95% CI) | 0.52 [0.19, 1.43] |
| 16.2 Agomelatine vs fluoxetine | 1 | 513 | Risk Ratio (M‐H, Random, 95% CI) | 1.05 [0.37, 2.96] |
| 16.3 Agomelatine vs sertraline | 1 | 311 | Risk Ratio (M‐H, Random, 95% CI) | 0.70 [0.25, 1.91] |
| 16.4 Agomelatine vs escitalopram | 1 | 137 | Risk Ratio (M‐H, Random, 95% CI) | 1.86 [0.35, 9.82] |
| 17 Sexual dysfunction Show forest plot | 1 | 333 | Risk Ratio (M‐H, Random, 95% CI) | 0.14 [0.04, 0.47] |
| 17.1 Agomelatine vs paroxetine | 1 | 333 | Risk Ratio (M‐H, Random, 95% CI) | 0.14 [0.04, 0.47] |
| 18 Abnormal liver function tests Show forest plot | 4 | 1755 | Risk Ratio (M‐H, Random, 95% CI) | 3.04 [0.90, 10.22] |
| 18.1 Agomelatine vs paroxetine | 1 | 318 | Risk Ratio (M‐H, Random, 95% CI) | 3.04 [0.32, 28.89] |
| 18.2 Agomelatine vs fluoxetine | 2 | 1124 | Risk Ratio (M‐H, Random, 95% CI) | 3.02 [0.60, 15.17] |
| 18.3 Agomelatine vs sertraline | 1 | 313 | Risk Ratio (M‐H, Random, 95% CI) | 3.10 [0.13, 75.44] |
| 19 Depression scales endpoint score Show forest plot | 10 | 3457 | Std. Mean Difference (IV, Random, 95% CI) | 0.00 [‐0.11, 0.12] |
| 19.1 Agomelatine vs paroxetine | 3 | 882 | Std. Mean Difference (IV, Random, 95% CI) | 0.16 [‐0.11, 0.43] |
| 19.2 Agomelatine vs fluoxetine | 4 | 1816 | Std. Mean Difference (IV, Random, 95% CI) | ‐0.01 [‐0.15, 0.13] |
| 19.3 Agomelatine vs sertraline | 1 | 306 | Std. Mean Difference (IV, Random, 95% CI) | ‐0.23 [‐0.46, ‐0.01] |
| 19.4 Agomelatine vs escitalopram | 2 | 453 | Std. Mean Difference (IV, Random, 95% CI) | ‐0.08 [‐0.26, 0.11] |
| 20 Subgroup analysis: dosing ‐ response rates Show forest plot | 10 | 3826 | Risk Ratio (M‐H, Random, 95% CI) | 1.01 [0.95, 1.08] |
| 20.1 Flexible dosing | 6 | 2255 | Risk Ratio (M‐H, Random, 95% CI) | 1.03 [0.94, 1.12] |
| 20.2 Fixed dosing | 4 | 1571 | Risk Ratio (M‐H, Random, 95% CI) | 0.97 [0.88, 1.07] |
| 21 Sensitivity analysis: excluding trials with > 20% drop outs ‐ response rates Show forest plot | 5 | 1516 | Risk Ratio (M‐H, Random, 95% CI) | 1.06 [0.97, 1.16] |
| 21.1 Agomelatine vs paroxetine | 1 | 280 | Risk Ratio (M‐H, Random, 95% CI) | 0.93 [0.74, 1.17] |
| 21.2 Agomelatine vs fluoxetine | 2 | 785 | Risk Ratio (M‐H, Random, 95% CI) | 1.03 [0.84, 1.27] |
| 21.3 Agomelatine vs sertraline | 1 | 313 | Risk Ratio (M‐H, Random, 95% CI) | 1.11 [0.94, 1.30] |
| 21.4 Agomelatine vs escitalopram | 1 | 138 | Risk Ratio (M‐H, Random, 95% CI) | 1.15 [0.87, 1.54] |
| 22 Sensitivity analysis: excluding imputed response rates Show forest plot | 8 | 3097 | Risk Ratio (M‐H, Random, 95% CI) | 1.02 [0.95, 1.10] |
| 22.1 Agomelatine vs paroxetine | 2 | 909 | Risk Ratio (M‐H, Random, 95% CI) | 0.90 [0.67, 1.21] |
| 22.2 Agomelatine vs fluoxetine | 3 | 1413 | Risk Ratio (M‐H, Random, 95% CI) | 1.02 [0.91, 1.15] |
| 22.3 Agomelatine vs sertraline | 1 | 313 | Risk Ratio (M‐H, Random, 95% CI) | 1.11 [0.94, 1.30] |
| 22.4 Agomelatine vs escitalopram | 2 | 462 | Risk Ratio (M‐H, Random, 95% CI) | 1.05 [0.95, 1.16] |
| 23 Sensitivity analysis: excluding imputed remission rates Show forest plot | 6 | 2331 | Risk Ratio (M‐H, Random, 95% CI) | 0.97 [0.83, 1.14] |
| 23.1 Agomelatine vs paroxetine | 2 | 909 | Risk Ratio (M‐H, Random, 95% CI) | 0.81 [0.67, 0.97] |
| 23.2 Agomelatine vs fluoxetine | 2 | 785 | Risk Ratio (M‐H, Random, 95% CI) | 0.98 [0.67, 1.45] |
| 23.3 Agomelatine vs sertraline | 1 | 313 | Risk Ratio (M‐H, Random, 95% CI) | 1.12 [0.80, 1.58] |
| 23.4 Agomelatine vs escitalopram | 1 | 324 | Risk Ratio (M‐H, Random, 95% CI) | 1.12 [0.93, 1.35] |
| 24 Sensitivity analysis: excluding trials with imputed SDs Show forest plot | 8 | 2524 | Std. Mean Difference (IV, Random, 95% CI) | 0.01 [‐0.15, 0.16] |
| 24.1 Agomelatine vs paroxetine | 3 | 882 | Std. Mean Difference (IV, Random, 95% CI) | 0.16 [‐0.11, 0.43] |
| 24.2 Agomelatine vs fluoxetine | 3 | 1207 | Std. Mean Difference (IV, Random, 95% CI) | ‐0.02 [‐0.23, 0.18] |
| 24.3 Agomelatine vs sertraline | 1 | 306 | Std. Mean Difference (IV, Random, 95% CI) | ‐0.23 [‐0.46, ‐0.01] |
| 24.4 Agomelatine vs escitalopram | 1 | 129 | Std. Mean Difference (IV, Random, 95% CI) | ‐0.21 [‐0.55, 0.14] |
| 25 Sensitivity analysis: response rates ‐ best case Show forest plot | 10 | 3826 | Risk Ratio (M‐H, Random, 95% CI) | 1.05 [0.99, 1.11] |
| 25.1 Agomelatine vs paroxetine | 3 | 1189 | Risk Ratio (M‐H, Random, 95% CI) | 0.96 [0.83, 1.11] |
| 25.2 Agomelatine vs fluoxetine | 4 | 1862 | Risk Ratio (M‐H, Random, 95% CI) | 1.06 [0.99, 1.14] |
| 25.3 Agomelatine vs sertraline | 1 | 313 | Risk Ratio (M‐H, Random, 95% CI) | 1.15 [0.98, 1.35] |
| 25.4 Agomelatine vs escitalopram | 2 | 462 | Risk Ratio (M‐H, Random, 95% CI) | 1.08 [0.93, 1.26] |
| 26 Sensitivity analysis: response rates ‐ worst case Show forest plot | 10 | 3826 | Risk Ratio (M‐H, Random, 95% CI) | 0.98 [0.92, 1.04] |
| 26.1 Agomelatine vs paroxetine | 3 | 1189 | Risk Ratio (M‐H, Random, 95% CI) | 0.88 [0.73, 1.07] |
| 26.2 Agomelatine vs fluoxetine | 4 | 1862 | Risk Ratio (M‐H, Random, 95% CI) | 0.98 [0.90, 1.07] |
| 26.3 Agomelatine vs sertraline | 1 | 313 | Risk Ratio (M‐H, Random, 95% CI) | 1.08 [0.92, 1.27] |
| 26.4 Agomelatine vs escitalopram | 2 | 462 | Risk Ratio (M‐H, Random, 95% CI) | 1.03 [0.94, 1.13] |
| 27 Sensitivity analysis: remission rates ‐ best case Show forest plot | 9 | 3502 | Risk Ratio (M‐H, Random, 95% CI) | 0.91 [0.72, 1.15] |
| 27.1 Agomelatine vs paroxetine | 3 | 1189 | Risk Ratio (M‐H, Random, 95% CI) | 0.75 [0.48, 1.17] |
| 27.2 Agomelatine vs fluoxetine | 4 | 1862 | Risk Ratio (M‐H, Random, 95% CI) | 0.89 [0.61, 1.30] |
| 27.3 Agomelatine vs sertraline | 1 | 313 | Risk Ratio (M‐H, Random, 95% CI) | 1.22 [0.87, 1.69] |
| 27.4 Agomelatine vs escitalopram | 1 | 138 | Risk Ratio (M‐H, Random, 95% CI) | 1.42 [0.74, 2.71] |
| 28 Sensitivity analysis:remission rates ‐ worst case Show forest plot | 9 | 3502 | Risk Ratio (M‐H, Random, 95% CI) | 0.73 [0.57, 0.94] |
| 28.1 Agomelatine vs paroxetine | 3 | 1189 | Risk Ratio (M‐H, Random, 95% CI) | 0.57 [0.29, 1.12] |
| 28.2 Agomelatine vs fluoxetine | 4 | 1862 | Risk Ratio (M‐H, Random, 95% CI) | 0.74 [0.52, 1.05] |
| 28.3 Agomelatine vs sertraline | 1 | 313 | Risk Ratio (M‐H, Random, 95% CI) | 1.08 [0.77, 1.50] |
| 28.4 Agomelatine vs escitalopram | 1 | 138 | Risk Ratio (M‐H, Random, 95% CI) | 0.79 [0.43, 1.43] |
| 29 Sensitivity anal': excluding studies with bipolar participants ‐ response rates Show forest plot | 2 | 617 | Risk Ratio (M‐H, Random, 95% CI) | 0.84 [0.70, 1.03] |
| 29.1 Agomelatine vs paroxetine | 2 | 617 | Risk Ratio (M‐H, Random, 95% CI) | 0.84 [0.70, 1.03] |
| 30 Additional subgroup analysis: unpublished vs published trials ‐ response rates Show forest plot | 10 | 3826 | Risk Ratio (M‐H, Random, 95% CI) | 1.01 [0.95, 1.08] |
| 30.1 Unpublished | 4 | 1336 | Risk Ratio (M‐H, Random, 95% CI) | 0.90 [0.81, 1.00] |
| 30.2 Published | 6 | 2490 | Risk Ratio (M‐H, Random, 95% CI) | 1.05 [1.00, 1.11] |
| Outcome or subgroup title | No. of studies | No. of participants | Statistical method | Effect size |
| 1 Response rates Show forest plot | 3 | 669 | Risk Ratio (M‐H, Random, 95% CI) | 1.06 [0.98, 1.16] |
| 1.1 Agomelatine vs venlafaxine | 3 | 669 | Risk Ratio (M‐H, Random, 95% CI) | 1.06 [0.98, 1.16] |
| 2 Remission rates Show forest plot | 3 | 669 | Risk Ratio (M‐H, Random, 95% CI) | 1.08 [0.94, 1.24] |
| 2.1 Agomelatine vs venlafaxine | 3 | 669 | Risk Ratio (M‐H, Random, 95% CI) | 1.08 [0.94, 1.24] |
| 3 Total drop outs Show forest plot | 2 | 392 | Risk Ratio (M‐H, Random, 95% CI) | 0.40 [0.24, 0.67] |
| 3.1 Agomelatine vs venlafaxine | 2 | 392 | Risk Ratio (M‐H, Random, 95% CI) | 0.40 [0.24, 0.67] |
| 4 Drop out due to inefficacy Show forest plot | 1 | 332 | Risk Ratio (M‐H, Random, 95% CI) | 1.01 [0.21, 4.94] |
| 4.1 Agomelatine vs venlafaxine | 1 | 332 | Risk Ratio (M‐H, Random, 95% CI) | 1.01 [0.21, 4.94] |
| 5 Drop outs due to side effects Show forest plot | 2 | 608 | Risk Ratio (M‐H, Random, 95% CI) | 0.30 [0.15, 0.59] |
| 5.1 Agomelatine vs venlafaxine | 2 | 608 | Risk Ratio (M‐H, Random, 95% CI) | 0.30 [0.15, 0.59] |
| 6 Total number of patients with side effects Show forest plot | 2 | 611 | Risk Ratio (M‐H, Random, 95% CI) | 0.72 [0.44, 1.18] |
| 6.1 Agomelatine vs venlafaxine | 2 | 611 | Risk Ratio (M‐H, Random, 95% CI) | 0.72 [0.44, 1.18] |
| 7 Sleepiness or drowsiness Show forest plot | 1 | 334 | Risk Ratio (M‐H, Random, 95% CI) | 0.76 [0.27, 2.14] |
| 7.1 Agomelatine vs venlafaxine | 1 | 334 | Risk Ratio (M‐H, Random, 95% CI) | 0.76 [0.27, 2.14] |
| 8 Insomnia Show forest plot | 1 | 332 | Risk Ratio (M‐H, Random, 95% CI) | 0.25 [0.03, 2.24] |
| 8.1 Agomelatine vs venlafaxine | 1 | 332 | Risk Ratio (M‐H, Random, 95% CI) | 0.25 [0.03, 2.24] |
| 9 Dry mouth Show forest plot | 1 | 332 | Risk Ratio (M‐H, Random, 95% CI) | 0.51 [0.13, 1.99] |
| 9.1 Agomelatine vs venlafaxine | 1 | 332 | Risk Ratio (M‐H, Random, 95% CI) | 0.51 [0.13, 1.99] |
| 10 Constipation Show forest plot | 1 | 332 | Risk Ratio (M‐H, Random, 95% CI) | 0.87 [0.30, 2.53] |
| 10.1 Agomelatine vs venlafaxine | 1 | 332 | Risk Ratio (M‐H, Random, 95% CI) | 0.87 [0.30, 2.53] |
| 11 Dizziness Show forest plot | 1 | 332 | Risk Ratio (M‐H, Random, 95% CI) | 0.19 [0.06, 0.64] |
| 11.1 Agomelatine vs venlafaxine | 1 | 332 | Risk Ratio (M‐H, Random, 95% CI) | 0.19 [0.06, 0.64] |
| 12 Vomiting or nausea Show forest plot | 2 | 609 | Risk Ratio (M‐H, Random, 95% CI) | 0.42 [0.17, 1.08] |
| 12.1 Agomelatine vs venlafaxine | 2 | 609 | Risk Ratio (M‐H, Random, 95% CI) | 0.42 [0.17, 1.08] |
| 13 Diarrhoea Show forest plot | 1 | 332 | Risk Ratio (M‐H, Random, 95% CI) | 2.70 [0.73, 10.00] |
| 13.1 Agomelatine vs venlafaxine | 1 | 332 | Risk Ratio (M‐H, Random, 95% CI) | 2.70 [0.73, 10.00] |
| 14 Depression scales endpoint score Show forest plot | 3 | 668 | Std. Mean Difference (IV, Random, 95% CI) | ‐0.07 [‐0.22, 0.08] |
| 14.1 Agomelatine vs venlafaxine | 3 | 668 | Std. Mean Difference (IV, Random, 95% CI) | ‐0.07 [‐0.22, 0.08] |
| 15 Subgroup analysis: dosing ‐ response rates Show forest plot | 3 | 669 | Risk Ratio (M‐H, Random, 95% CI) | 1.06 [0.98, 1.16] |
| 15.1 Flexible dosing | 1 | 332 | Risk Ratio (M‐H, Random, 95% CI) | 1.08 [0.95, 1.23] |
| 15.2 Fixed dosing | 2 | 337 | Risk Ratio (M‐H, Random, 95% CI) | 1.05 [0.94, 1.17] |
| 16 Subgroup analysis: severity ‐ response rates Show forest plot | 3 | 669 | Risk Ratio (M‐H, Random, 95% CI) | 1.06 [0.98, 1.16] |
| 16.1 Agomelatine vs venlafaxine (moderate depression) | 1 | 277 | Risk Ratio (M‐H, Random, 95% CI) | 1.04 [0.93, 1.17] |
| 16.2 Agomelatine vs venlafaxine (severe depression) | 2 | 392 | Risk Ratio (M‐H, Random, 95% CI) | 1.09 [0.96, 1.23] |
| 17 Sensitivity analysis: excluding trials with > 20% drop outs Show forest plot | 2 | 392 | Risk Ratio (M‐H, Random, 95% CI) | 1.09 [0.96, 1.23] |
| 17.1 Agomelatine vs venlafaxine | 2 | 392 | Risk Ratio (M‐H, Random, 95% CI) | 1.09 [0.96, 1.23] |
| 18 Sensitivity analysis: excluding imputed remission rates Show forest plot | 2 | 337 | Risk Ratio (M‐H, Random, 95% CI) | 1.09 [0.93, 1.26] |
| 18.1 Agomelatine vs venlafaxine | 2 | 337 | Risk Ratio (M‐H, Random, 95% CI) | 1.09 [0.93, 1.26] |
| 19 Sensitivity analysis: response rates ‐ best case Show forest plot | 3 | 669 | Risk Ratio (M‐H, Random, 95% CI) | 1.06 [0.98, 1.16] |
| 19.1 Agomelatine vs venlafaxine | 3 | 669 | Risk Ratio (M‐H, Random, 95% CI) | 1.06 [0.98, 1.16] |
| 20 Sensitivity analysis: response rates ‐ worst case Show forest plot | 3 | 669 | Risk Ratio (M‐H, Random, 95% CI) | 1.06 [0.97, 1.15] |
| 20.1 Agomelatine vs venlafaxine | 3 | 669 | Risk Ratio (M‐H, Random, 95% CI) | 1.06 [0.97, 1.15] |
| 21 Sensitivity analysis: remission rates ‐ best case Show forest plot | 3 | 669 | Risk Ratio (M‐H, Random, 95% CI) | 1.09 [0.95, 1.25] |
| 21.1 Agomelatine vs venlafaxine | 3 | 669 | Risk Ratio (M‐H, Random, 95% CI) | 1.09 [0.95, 1.25] |
| 22 Sensitivity analysis: remission rates ‐ worst case Show forest plot | 3 | 669 | Risk Ratio (M‐H, Random, 95% CI) | 1.08 [0.94, 1.24] |
| 22.1 Agomelatine vs venlafaxine | 3 | 669 | Risk Ratio (M‐H, Random, 95% CI) | 1.08 [0.94, 1.24] |