Pemberian ubat besar‐besaran untuk malaria
Referencias
References to studies included in this review
References to studies excluded from this review
References to studies awaiting assessment
Additional references
References to other published versions of this review
Characteristics of studies
Characteristics of included studies [ordered by study ID]
| Study characteristics | ||
| Methods | Dates of study: 2014‐2017 Location of study: Zambia Malaria endemicity (prevalence): Clusters stratified by ≤ 10% and > 10% parasite prevalence prior to randomization. This study includes the low transmission strata [Low]. Transmission season: January to May Malaria species: Plasmodium falciparum Vector species: Anopheles funestus (hereafter An funestus) and Anophelesgambiae (hereafter An gambiae) Antimalarial drug resistance context: Widespread resistance to chloroquine and sulfadoxine‐pyrimethamine, but no evidence of resistance to artemisinin. Study design: Cluster‐randomized trial (3 arms: MDA, fMDA, and a no fMDA or MDA control; only MDA and control arms included in this review) Statistical power: 80% power (alpha = 0.05) to detect a 50% reduction in parasite prevalence accounting for clustering, and 80% power (alpha = 0.05) to detect a 50% reduction in parasite incidence accounting for clustering For cluster‐RCTs Unit of randomization: Health facility catchment area (HFCA) Adjusted analyses for clustering: Yes; however, in this review, we performed cluster adjustment of the raw data using the study‐provided ICC to calculate effective sample sizes Adjustment method: Random intercept for HFCA ICC (estimated at the HFCA level in the low transmission strata): 0.06517 (in 2014); 0.01753 (in 2015); 0.01515 (in 2016); 0.04184 (in 2017) Number of clusters randomized: 20 Number of clusters analysed: 20 Number of people: 82,866 (low), 184,928 (total) Average cluster size: 9246 Features: Stratified by low vs high (below and above 10%) transmission strata and HFCA population size prior to randomization of clusters | |
| Participants | Age groups included: All ages above 3 months. Children < 3 months and pregnant women in first trimester excluded from MDA with dihyrdroartemisinin piperaquine, but offered appropriate dose of antimalarial treatment in accordance with national policy if found to be RDT positive (note: testing was performed in fMDA and MDA arms, but all eligible persons were treated in the MDA arm, irrespective of RDT result). Population targeted Intervention: 37,694 Comparison: 45,172 | |
| Interventions | Intervention: Drug/dose:
Number of rounds (timing/dates): 4 (December 2014 at the end of the dry season, February‐March 2015 at the start of the rainy season, September‐October 2015 during dry season, and February‐March 2016 at start of the rainy season) Interval: Variable Duration implemented: 15 months Coverage (%): 79% in round 1, 63% in round 2, 76% in round 3, and 66% in round 4 Co‐interventions: Baseline IRS household coverage in the preceding 12 months was 6.9%; Baseline household LLIN coverage of at least 1 net was 70.3%; Enhanced standard of care was scaled up in the study area, which consisted of RDT or microscopic confirmation of all suspected cases presenting to health facility and treating positives with artemether‐lumefantrine and reactive case detection in areas with manageable case counts. Comparison: Type: No MDA and no placebo Co‐interventions: Baseline IRS household coverage in the preceding 12 months was 16.9%; Baseline household LLIN coverage of at least 1 net was 75.3%; Enhanced standard of care was scaled up in the study area, which consisted of RDT or microscopic confirmation of all suspected cases presenting to health facility and treating positives with artemether‐lumefantrine and reactive case detection in areas with manageable case counts. | |
| Outcomes | Parasitaemia prevalence Measurement: Cross‐sectional surveys of P falciparum prevalence by RDT in children ≥ 3 months and < 6 years Time points: Pre‐MDA (April‐May 2014), During MDA (April‐May 2015), and Post‐MDA 1‐3 months (April‐May 2016) Sample size (range): 372‐545 (intervention); 361‐453 (comparison) Parasitaemia incidence Measurement: Prospective cohort of persons ≥ 3 months of age to capture P falciparum incidence by RDT Time points: Followed through 2 months post‐MDA (January 2015 ‐ May 2016) Sample size: 410 (intervention); 326 (comparison) Confirmed malaria illness incidence Measurement: Passive surveillance as measured by outpatient department confirmed malaria cases (by microscopy or RDT) reported through routine health management information systems data Time points: Pre‐MDA (January‐May 2013 combined with January‐May 2014) and Post‐MDA 1‐3 months (January 2015 ‐ May 2016) Adverse effects (AEs) (reported in both MDA and fMDA arms) A total of 687 AEs (0.24% of participants and 0.43% of treatments) were reported and one was a serious AE. The most common AEs reported were stomach pains, dry cough, and vomiting. | |
| Notes | ClinicalTrials.gov: NCT02329301 Outcomes stratified by low and high transmission strata as specified a priori by study design (defined as above and below 10% parasite prevalence) Two out of ten low transmission strata clusters received two additional rounds of programmatic MDA (for a total of six rounds) at 10 and 12 months following the fourth round of trial MDA, however no outcomes were analysed following the first round of programmatic MDA. Abbreviations: ICC = intracluster correlation coefficient, fMDA = focal mass drug administration, IRS = indoor residual spraying, LLIN = long‐lasting insecticide‐treated bed net, MDA = mass drug administration, RDT = rapid diagnostic test | |
| Risk of bias | ||
| Bias | Authors' judgement | Support for judgement |
| Random sequence generation (selection bias) | Low risk | Following stratification by transmission setting and health facility catchment area population size, clusters were randomly allocated to study arms using random allocation rule. |
| Allocation concealment (selection bias) | Low risk | Allocation was conducted by an institution. |
| Baseline imbalance (selection bias) | Low risk | The proportion of households that received IRS in the previous 12 months was higher at baseline in control (17%) compared to MDA (7%) clusters, but other baseline characteristics were balanced. Analysis adjusted for baseline differences. |
| Contamination protection | Low risk | Households within a 3 km buffer around HFCA borders were excluded from the sampling frame for parasite prevalence and incidence. |
| Blinding of participants and personnel (performance bias) | Unclear risk | Participants were not blinded to allocation, but access to antimalarials through enhanced standard of care was comparable across arms. |
| Blinding of participants and personnel (performance bias) | Low risk | Participants were not blinded to allocation, but parasitaemia incidence was assessed through active follow‐up in a prospective cohort cleared of parasitaemia at baseline. |
| Blinding of participants and personnel (performance bias) | Unclear risk | Participants were not blinded to allocation, which may have impacted care‐seeking. |
| Blinding of outcome assessment (detection bias) | Unclear risk | Outcome assessment by microscopy not described. |
| Blinding of outcome assessment (detection bias) | Low risk | Blood samples for malaria testing collected from all individuals, irrespective of study arm at follow‐up visits. |
| Blinding of outcome assessment (detection bias) | Unclear risk | Blinding of health facility staff to allocation arm was not described. |
| Incomplete outcome data (attrition bias) | Low risk | Simple random sample of children at baseline and follow‐up. |
| Incomplete outcome data (attrition bias) | Unclear risk | "No statistically significant differences in primary outcomes or covariates between individuals" included in analysis and those lost to follow‐up, "although fewer individuals were lost to follow up in high transmission areas than in low transmission areas". Based on this information provided, it is unclear whether attrition bias was a concern once lost to follow‐up is stratified by baseline endemicity. |
| Incomplete outcome data (attrition bias) | Low risk | Based on routine data from health management information system with established reporting from January 2011 onwards. |
| Selective reporting (reporting bias) | Low risk | All pre‐stated outcomes of interest were reported. |
| Other bias | Low risk | No other bias detected. |
| Recruitment bias (cluster RCT) | Low risk | No recruitment following randomization. |
| Loss of clusters (cluster RCT) | Low risk | No clusters were lost. |
| Incorrect analysis (cluster RCT) | Low risk | Mixed models were used to adjust for clustering by investigators; however, in this review, we performed cluster adjustment of the raw data using a study‐provided ICC to calculate effective sample sizes |
| Comparability with individually randomized trials (cluster RCT) | Low risk | MDA, by definition, is applied at the population level, so this criteria is irrelevant for the intervention evaluated in this review. |
| Study characteristics | ||
| Methods | Dates of study: 2014 to 2017 Location of study: Zambia Malaria endemicity (prevalence): Clusters stratified by ≤ 10% and > 10% parasite prevalence prior to randomization. This study includes the high transmission strata [High]. Transmission season: January to May Malaria species: Plasmodium falciparum Vector species: An funestus and Angambiae Antimalarial drug resistance context: Widespread resistance to chloroquine and sulfadoxine‐pyrimethamine, but no evidence of resistance to artemisinin. Study design: Cluster‐randomized trial (3 arms: MDA, fMDA, and a no fMDA or MDA control; only MDA and control arms included in this review) Statistical power: 80% power (alpha = 0.05) to detect a 50% reduction in parasite prevalence accounting for clustering, and 80% power (alpha = 0.05) to detect a 50% reduction in parasite incidence accounting for clustering For cluster RCTs Unit of randomization: Health facility catchment area (HFCA) Adjusted analyses for clustering: Yes; however, in this review, we performed cluster adjustment of the raw data using the study‐provided ICC to calculate effective sample sizes Adjustment method: Random intercept for HFCA ICC (estimated at the HFCA level for the high transmission strata): 0.16142 (in 2014); 0.11301 (in 2015); 0.08066 (in 2016); 0.13479 (in 2017) Number of clusters randomized: 20 Number of clusters analysed: 20 Number of people: 102,062 (high), 184,928 (total) Average cluster size: 9246 Features: Stratified by low vs high (below and above 10%) transmission strata and HFCA population size prior to randomization of clusters | |
| Participants | Age groups included: All ages above 3 months. Children < 3 months and pregnant women in first trimester excluded from MDA with dihydroartemisinin piperaquine, but offered appropriate dose of antimalarial treatment in accordance with national policy if found to be RDT positive (note: testing was performed in fMDA and MDA arms, but all eligible persons were treated in the MDA arm, irrespective of RDT result). Population targeted Intervention: 45,442 Comparison: 56,620 | |
| Interventions | Intervention: Drug/dose:
Number of rounds (timing/dates): 4 (December 2014 at the end of the dry season, February to March 2015 at the start of the rainy season, September to October 2015 during dry season, and February to March 2016 at start of the rainy season) Interval: Variable Duration implemented: 15 months Coverage (%): 79% in round 1, 63% in round 2, 76% in round 3, and 66% in round 4 Co‐interventions: Baseline IRS household coverage in the preceding 12 months was 6.9%; Baseline household LLIN coverage of at least 1 net was 70.3%; Enhanced standard of care was scaled up in the study area, which consisted of RDT or microscopic confirmation of all suspected cases presenting to health facility and treating positives with artemether‐lumefantrine and reactive case detection in areas with manageable case counts. Comparison: Type: No MDA and no placebo Co‐interventions: Baseline IRS household coverage in the preceding 12 months was 16.9%; Baseline household LLIN coverage of at least 1 net was 75.3%; Enhanced standard of care was scaled up in the study area, which consisted of RDT or microscopic confirmation of all suspected cases presenting to health facility and treating positives with artemether‐lumefantrine and reactive case detection in areas with manageable case counts. | |
| Outcomes | Parasitaemia prevalence Measurement: Cross‐sectional surveys of P falciparum prevalence by RDT in children ≥ 3 months and < 6 years Time points: Pre‐MDA (April to May 2014), During MDA (April to May 2015), and Post‐MDA 1 to 3 months (April to May 2016) Sample size (range): 348 to 490 (intervention); 332 to 505 (comparison) Parasitaemia incidence Measurement: Prospective cohort of persons ≥ 3 months of age to capture P falciparum incidence by RDT Time points: Followed through 2 months post‐MDA (January 2015 to May 2016) Sample size: 371 (intervention); 368 (comparison) Confirmed malaria illness incidence Measurement: Passive surveillance as measured by outpatient department confirmed malaria cases (by microscopy or RDT) reported through routine health management information systems data Time points: Pre‐MDA (January to May 2013 combined with January to May 2014) and Post‐MDA 1 to 3 months (January to May 2015) Adverse effects (AEs) (reported in both MDA and fMDA arms) A total of 687 AEs (0.24% of participants and 0.43% of treatments) were reported and one was a serious AE. The most common AEs reported were stomach pains, dry cough, and vomiting. | |
| Notes | ClinicalTrials.gov: NCT02329301 Outcomes stratified by low and high transmission strata as specified a priori by study design (defined as above and below 10% parasite prevalence) Abbreviations: ICC = intracluster correlation coefficient, fMDA = focal mass drug administration, IRS = indoor residual spraying, LLIN = long‐lasting insecticide‐treated bed net, MDA = mass drug administration, RDT = rapid diagnostic test | |
| Risk of bias | ||
| Bias | Authors' judgement | Support for judgement |
| Random sequence generation (selection bias) | Low risk | Following stratification by transmission setting and health facility catchment area population size, clusters were randomly allocated to study arms using random allocation rule. |
| Allocation concealment (selection bias) | Low risk | Allocation was conducted by an institution. |
| Baseline imbalance (selection bias) | Low risk | The proportion of households that received IRS in the previous 12 months was higher at baseline in control (17%) compared to MDA (7%) clusters, but other baseline characteristics were balanced. Analysis adjusted for baseline differences. |
| Contamination protection | Low risk | Households within a 3 km buffer around HFCA borders were excluded from the sampling frame for parasite prevalence and incidence. |
| Blinding of participants and personnel (performance bias) | Unclear risk | Participants were not blinded to allocation, but access to antimalarials through enhanced standard of care was comparable across arms. |
| Blinding of participants and personnel (performance bias) | Low risk | Participants were not blinded to allocation, but parasitaemia incidence was assessed through active follow‐up in a prospective cohort cleared of parasitaemia at baseline. |
| Blinding of participants and personnel (performance bias) | Unclear risk | Participants were not blinded to allocation, which may have impacted care‐seeking. |
| Blinding of outcome assessment (detection bias) | Unclear risk | Outcome assessment by microscopy not described. |
| Blinding of outcome assessment (detection bias) | Low risk | Blood samples for malaria testing collected from all individuals, irrespective of study arm at follow‐up visits. |
| Blinding of outcome assessment (detection bias) | Unclear risk | Blinding of health facility staff to allocation arm was not described. |
| Incomplete outcome data (attrition bias) | Low risk | Simple random sample of children at baseline and follow‐up. |
| Incomplete outcome data (attrition bias) | Unclear risk | "No statistically significant differences in primary outcomes or covariates between individuals" included in analysis and those lost to follow‐up, "although fewer individuals were lost to follow up in high transmission areas than in low transmission areas". Based on this information provided, it is unclear whether attrition bias was a concern once lost to follow‐up is stratified by baseline endemicity. |
| Incomplete outcome data (attrition bias) | Low risk | Based on routine data from health management information system with established reporting from January 2011 onwards. |
| Selective reporting (reporting bias) | Low risk | All pre‐stated outcomes of interest were reported. |
| Other bias | Low risk | No other bias detected. |
| Recruitment bias (cluster RCT) | Low risk | No recruitment following randomization. |
| Loss of clusters (cluster RCT) | Low risk | No clusters were lost. |
| Incorrect analysis (cluster RCT) | Low risk | Mixed models were used to adjust for clustering by investigators. However, in this review, we performed cluster adjustment of the raw data using a study‐provided ICC to calculate effective sample sizes |
| Comparability with individually randomized trials (cluster RCT) | Low risk | MDA, by definition, is applied at the population level, so this criteria is irrelevant for the intervention evaluated in this review. |
| Study characteristics | ||
| Methods | Dates of study: 1960 to 1961 Location of study: Burkina Faso Malaria endemicity (prevalence): 56.1% prevalence in children 0 to 10 years at baseline in control [High] Transmission season: June to December Malaria species: P falciparum, P ovale, P malariae Vector species: An gambiae, An funestus, Anopheles nili (hereafter An nili) Antimalarial drug resistance context: Not described Study design: Controlled before‐and‐after study (6 arm study: CQ+PQ or AQ+PQ every 4 weeks, CQ+PQ or AQ+PQ every 2 weeks, CQ+PQ or AQ+PQ every 4 weeks with IRS, CQ+PQ or AQ+PQ every 2 weeks with IRS, IRS only, non‐IRS control; the 3 arms with IRS are excluded in this review since the population size and number of villages for the IRS only control were not reported) Statistical power: Not described | |
| Participants | Age groups included: All ages Population targeted Intervention (CQ+PQ or AQ+PQ every 4 weeks): 1890 in 5 villages Intervention (CQ+PQ or AQ+PQ every 2 weeks): 2560 in 3 villages Comparison (non‐IRS control): 6 villages, population size not described | |
| Interventions | Drug/dose (for all intervention arms receiving MDA):
Intervention (CQ+PQ or AQ‐PQ every 4 weeks, "low frequency"): Number of rounds (timing/dates): 8 (June, July, August, September, October, November, December 1960) Interval: Every 28 days Duration implemented: 7 months (June to December 1960) Coverage (%): 75% to 91% per round Co‐interventions: None Intervention (CQ+PQ or AQ+PQ every 2 weeks, "high frequency"): Number of rounds (timing/dates): 15 (June to December 1960) Interval: Every 14 days Duration implemented: 7 months (June to December 1960) Coverage (%): 84% to 97% per round Co‐interventions: None Comparison (non‐IRS control): Type: No MDA and no placebo Co‐interventions: None | |
| Outcomes | Parasitaemia prevalence Measurement: Cross‐sectional surveys in all children ages 2 to 9 years every 4 months (microscopy) Time points: Pre‐MDA (June 1960), During‐MDA (October 1960), and at 3 months post‐MDA (March 1961) Sample size (range): 274 to 348 (intervention: CQ+PQ or AQ+PQ every 4 weeks); 390 to 467 (intervention: CQ+PQ or AQ+PQ every 2 weeks); 217 to 691 (comparison: non‐IRS control) Gametocytaemia prevalence Measurement: Cross‐sectional surveys in all children ages 2 to 9 years every 4 months (microscopy) Time points: Pre‐MDA (June 1960), During MDA (October 1960), and at 3 months post‐MDA (March 1961) Sample size (range): 274 to 348 (intervention: CQ+PQ or AQ+PQ every 4 weeks); 390 to 467 (intervention: CQ+PQ or AQ+PQ every 2 weeks); 217 to 691 (comparison: non‐IRS control) | |
| Notes | Samples for outcome assessment in June 1960 were collected prior to MDA distribution; therefore the survey in June 1960 was considered as "pre‐MDA". Abbreviations: AQ = amodiaquine, CQ = chloroquine, IRS = indoor residual spraying, MDA = mass drug administration, PQ = primaquine | |
| Risk of bias | ||
| Bias | Authors' judgement | Support for judgement |
| Random sequence generation (selection bias) | High risk | Assignment to intervention or control was not randomized although drug assignment within intervention was randomized in arms with more than one drug. |
| Allocation concealment (selection bias) | High risk | Non‐randomized controlled study (controlled before‐and‐after study) |
| Baseline imbalance (selection bias) | Unclear risk | Baseline characteristics were not described. |
| Contamination protection | Unclear risk | No information is provided to assess the risk of contamination. |
| Blinding of participants and personnel (performance bias) | Unclear risk | Participants were not blinded to allocation. |
| Blinding of outcome assessment (detection bias) | High risk | Microscopists were not blinded to study arm. |
| Incomplete outcome data (attrition bias) | Low risk | Outcomes were assessed in all children ages 2 to 9 years in the study area. |
| Selective reporting (reporting bias) | Low risk | All pre‐stated outcomes were reported. |
| Other bias | Low risk | No other bias detected. |
| Study characteristics | ||
| Methods | Dates of study: 2013 to 2015 Location of study: Kayin (Karen) state, Myanmar Malaria endemicity (prevalence): Plasmodium falciparum prevalence 11.0% in MDA villages and 5.4% in control villages at baseline by ultrasensitive polymerase chain reaction (uPCR); P vivax prevalence 18.9% in MDA villages and 17.5% in control villages at baseline by uPCR [Low ‐ estimated P falciparum slide prevalence 1.2%] Transmission season: June to October Malaria species: P falciparum and P vivax Vector species: Anopheles minimus s.l., An maculatus s.l., and An dirus s.l. Antimalarial drug resistance context: “Area where artemisinin resistance is firmly established” Statistical power: For the multi‐country trial (Landier 2017 MMRa; Tripura 2018 KHM; Pongvongsa 2018 LAO; von Seidlein 2019 VNM), 80% power (alpha = 0.05) to detect a 95% reduction in parasite prevalence from a baseline prevalence of 10% For cluster RCTs Unit of randomization: Village Adjusted analyses for clustering: Yes; however, in this review, we performed cluster adjustment of the raw data using ICC values estimated from the study data to calculate effective sample sizes Adjustment method: Generalized estimating equations ICC: 0.03512 (P falciparum outcomes at baseline before MDA), 0 (P falciparum outcomes at post‐MDA 1 to 3, 4 to 6, and 7 to 12 months); 0 (P vivax outcomes at baseline before MDA, post‐MDA 4 to 6 months and 7 to 12 months), 0.000798 (P vivax outcomes at post‐MDA 1 to 3 months) Number of clusters randomized: 4 Number of clusters analysed: 4 Number of people: 3238 Average cluster size: 810 Features: Two village pairs (4 villages) were established by geographical proximity, population size, and parasite prevalence. Within each pair, one village was randomly selected to receive early MDA, while the other village received deferred MDA | |
| Participants | Age groups included: All ages ≥ 6 months. All pregnant women in their first trimester were excluded from MDA and pregnant women in any trimester were excluded from primaquine. Population targeted Intervention: 1434 Comparison: 1804 | |
| Interventions | Intervention: Drug/dose: Dihydroartemisinin (7 mg/kg) plus piperaquine (55 mg/kg) administered once a day for 3 days with a single dose of primaquine (0.25 mg/kg) Number of rounds (timing/dates): 3 (May, June, July 2013 or June, July, August 2013) Interval: Every 1 month Duration implemented: 3 months Coverage (%): 66% in round 1, 56% in round 2, and 65% in round 3 Co‐interventions: LLITNs, uninterrupted access to diagnosis and treatment in study villages Comparison: Type: Deferred MDA administered in control villages in January, February, and March 2014 Co‐interventions: LLITNs, uninterrupted access to diagnosis and treatment in study villages | |
| Outcomes | Parasitaemia prevalence (P falciparum andP vivax ) Measurement: Cross‐sectional surveys in all ages every 3 months by uPCR; all individuals present at the time of the survey in the study villages were sampled. Time points: Pre‐MDA (May 2013) and at 1 (Aug 2013), 4 (Nov 2013), and 7 (Jan 2014) months post‐MDA Sample size (range): 419 to 689 (intervention) and 750 to 848 (control) Confirmed malaria illness incidence (P falciparum andP vivax ) Measurement: Passive case detection at malaria posts for measured or self‐reported fever (≥ 37.5C) and confirmed P falciparum or P vivax infection by RDT or microscopy. Time points: 7 (May 2013 to January 2014) months post‐MDA Adverse effects (AEs) AEs monitored by active surveillance through structured interviews on the second, third, and seventh day of MDA treatment course and by passive surveillance via reporting to medical assistants in mobile clinics located in study villages during MDA rounds. From interviews, no serious AEs were reported. The most common AEs were dizziness (n=192) and pruritus (n=17). There were three reports of black urine, from glucose 6‐phosphate dehydrogenase (G6PD) deficient (report prior to PQ), G6PD‐normal (48 hours after PQ), and G6PD‐heterozygous individuals. Among participants reporting passively to mobile clinics, there were 23 serious AEs and 15 deaths that were not drug‐related, 9 moderate AEs of which 4 were possibly related to the study drug, and 191 mild AEs of which 1 was highly likely related and 7 were possibly related to the study drug. | |
| Notes | One of four sites from a multi‐country trial in Southeast Asia (ClinicalTrials.gov: NCT01872702) Abbreviations: ICC = intracluster correlation coefficient, LLITN = long‐lasting insecticide‐treated bed net, MDA = mass drug administration, uPCR = ultrasensitive polymerase chain reaction | |
| Risk of bias | ||
| Bias | Authors' judgement | Support for judgement |
| Random sequence generation (selection bias) | Low risk | "The randomisation was based on computer‐generated random numbers provided by the trial statistician" |
| Allocation concealment (selection bias) | Low risk | Allocation was conducted by an institution. |
| Baseline imbalance (selection bias) | High risk | Small number of clusters (4 villages) randomized. |
| Contamination protection | High risk | Intervention and control clusters were pair‐matched by geographical proximity, which likely led to a high risk of contamination due to population movement. |
| Blinding of participants and personnel (performance bias) | Unclear risk | Participants were not blinded to allocation. |
| Blinding of participants and personnel (performance bias) | Unclear risk | Participants were not blinded to allocation, which may have impacted care‐seeking. |
| Blinding of outcome assessment (detection bias) | Low risk | Laboratory staff performing PCR were unaware of the study arm allocation of samples. |
| Blinding of outcome assessment (detection bias) | Unclear risk | Unclear if the health facility staff performing malaria testing were aware of which study arm participants were assigned to. |
| Incomplete outcome data (attrition bias) | Low risk | Parasitaemia surveys were performed in all individuals aged six months or older residing in the study villages. |
| Incomplete outcome data (attrition bias) | Low risk | Data collected at malaria health posts with dedicated study staff. |
| Selective reporting (reporting bias) | Low risk | All pre‐specified outcomes reported. |
| Other bias | Low risk | No other bias detected. |
| Recruitment bias (cluster RCT) | Low risk | No recruitment following randomization. |
| Loss of clusters (cluster RCT) | Low risk | No clusters were lost. |
| Incorrect analysis (cluster RCT) | Low risk | Although no adjustment for clustering was performed by investigators, in this review, we performed cluster adjustment of the raw data using a study‐provided ICC to calculate effective sample sizes. |
| Comparability with individually randomized trials (cluster RCT) | Low risk | MDA, by definition, is applied at the population level, so this criteria is irrelevant for the intervention evaluated in this review. |
| Study characteristics | ||
| Methods | Dates of study: 2014 to 2017 Location of study: Myanmar Malaria endemicity (prevalence): P falciparum < 20 cases per 1000 population per year and P falciparum/P vivax 2.7% at baseline by rapid diagnostic test (RDT) [Low] Transmission season: June to August Malaria species: P falciparum, P vivax, P ovale, P malariae Vector species: Not described Antimalarial drug resistance context: Artemisinin resistance reported; Kelch 13 in 57% (54/94) of samples at baseline. Study design: Cluster‐randomized trial Statistical power: Not statistically powered for outcomes For cluster RCTs Unit of randomization: Village Adjusted analyses for clustering: No; however, in this review, we performed cluster adjustment of the raw data using the study‐provided ICC to calculate effective sample sizes Adjustment method: Not applicable ICC: 0.056 Number of clusters randomized: 16 Number of clusters analysed: 16 Number of people: 8721 Average cluster size: 554 Features: Intervention and control clusters were pair‐matched based on P falciparum prevalence (+/‐ 8%), geographical proximity and distance to main road | |
| Participants | Age groups included: All ages ≥ 1 year and pregnant women in first trimester excluded. No primaquine administered to pregnant women in other trimesters. Population targeted Intervention: 5481 Comparison: 3240 | |
| Interventions | Intervention: Drug/dose: Dihydroartemisinin (7 mg/kg) plus piperaquine (55 mg/kg) administered once a day for three days with a single dose of primaquine (0.25 mg/kg) Number of rounds (timing/dates): 3 (March, April, May 2015, during dry season) Interval: Every 1 month Duration implemented: 3 months Coverage (%): 90% completed at least one round; Round 1: 86%, Round 2: 86%, Round 3: 88% Co‐interventions: LLITNs distributed at the start of study; routine malaria control by village health workers. Comparison: Type: No MDA and no placebo Co‐interventions: LLITNs distributed at the start of study; routine malaria control by village health workers. | |
| Outcomes | Parasitaemia prevalence (P falciparum and P vivax) Measurement: Cross‐sectional surveys of P falciparum and P vivax prevalence by ultrasensitive PCR in adults 18 to 55 years; up to 2 participants sampled from randomly selected households at baseline and the same participants were sampled at follow‐up surveys. Time points: Pre‐MDA (January 2015) and at < 1 (3‐8 June 2015), 3 (24‐29 August 2015), 8 (15‐26 January 2016), 13 (7‐14 June 2016), 19 (2‐19 December 2016), 25 (13‐18 June 2017), and 31 (1‐13 December 2017) months post‐MDA Sample size (range): 620 to 1106 (intervention); 412 to 543 (comparison) Adverse effects (AEs) A total of 151 (1.4% of all doses, 3.6% of treated individuals) adverse effects reported: 12 (7.9%) not related to drug, 40 (26.5%) unlikely related to drug, 81 (53.6%) possibly related to drug, and 18 (11.9%) probably related to drug. 6 serious AEs: 1 possibly related, 5 unrelated | |
| Notes | Prior to randomization, villages selected based on baseline PCR prevalence survey conducted in 58 villages in study area. Selected villages: (1) had a population between 75 to 1200 people (excluded 15 villages), and (2) were a hotspot village defined as > 30% parasite prevalence (all types) or > 10% P falciparum prevalence by PCR (excluded 27 non‐hotspot villages) Abbreviations: ICC = intracluster correlation coefficient, LLITN = long‐lasting insecticide‐treated bed net, MDA = mass drug administration, PCR = polymerase chain reaction | |
| Risk of bias | ||
| Bias | Authors' judgement | Support for judgement |
| Random sequence generation (selection bias) | High risk | Randomization of clusters was performed by flipping a coin. |
| Allocation concealment (selection bias) | Low risk | Allocation was conducted by an institution. |
| Baseline imbalance (selection bias) | Low risk | Baseline malaria risk and co‐intervention coverage were similar across intervention arms. |
| Contamination protection | High risk | Intervention and control clusters were pair‐matched by geographical proximity, which likely led to a high risk of contamination due to population movement. |
| Blinding of participants and personnel (performance bias) | Unclear risk | Participants were not blinded to allocation. |
| Blinding of outcome assessment (detection bias) | Low risk | Laboratory staff performing PCR were unaware of the study arm allocation of samples. |
| Incomplete outcome data (attrition bias) | High risk | Outcome data was assessed only in participants aged 18 to 55 years. Up to 2 participants from randomly selected households at baseline were surveyed at each time point and alternative participants (similarly matched by gender, age, and occupation) were surveyed if selected participants were unavailable during follow‐up. Substantial variation in denominators suggesting different participants sampled (non‐randomly) during each survey. |
| Selective reporting (reporting bias) | Low risk | All pre‐specified outcomes reported. |
| Other bias | Low risk | No other bias detected. |
| Recruitment bias (cluster RCT) | Low risk | No recruitment following randomization. |
| Loss of clusters (cluster RCT) | Low risk | No clusters were lost. |
| Incorrect analysis (cluster RCT) | Low risk | Although no adjustment for clustering was performed by investigators, in this review, we performed cluster adjustment of the raw data using a study‐provided ICC to calculate effective sample sizes |
| Comparability with individually randomized trials (cluster RCT) | Low risk | MDA, by definition, is applied at the population level, so this criteria is irrelevant for the intervention evaluated in this review. |
| Study characteristics | ||
| Methods | Dates of study: 1970 to 1976 (included data from 1970 to 1973 in this review) Location of study: Nigeria Malaria endemicity (prevalence): 46% in all ages [High] Transmission season: April to October Malaria species: Plasmodium falciparum, P malariae, P ovale Vector species: Anopheles gambiae, An funestus Antimalarial drug resistance context: Not described Study design: Controlled before‐and‐after study (4 arms: no intervention, IRS only, low frequency MDA+IRS, and high frequency MDA+IRS; IRS only, low frequency+IRS, and high frequency+IRS arms included in this review) Statistical power: Consideration of statistical power was mentioned, but the parameters were not described. | |
| Participants | Age groups included: All ages, but infants not included in MDA until their first malaria episode. Population targeted Intervention (low frequency MDA+IRS): 14,129 Intervention (high frequency MDA+IRS): 1810 Comparison (IRS only): 32,828 | |
| Interventions | Drug/dose (for all intervention arms receiving MDA):
Intervention (Low frequency MDA+IRS group): Number of rounds (timing/dates): 9 (April 1972 ‐ October 1973) Interval: Every 10 weeks Duration implemented: 18 months Coverage (%): 73% to 92% Co‐interventions: IRS using propoxur 3 to 4 rounds per year Intervention (High frequency MDA+IRS group): Number of rounds (timing/dates): 23 (April 1972 ‐ October 1973) Interval: Every two weeks during the wet season (May‐October 1972 and May‐October 1973) and every 10 weeks during the dry season (December 1972, March 1973, and October‐November 1973) Duration implemented: 18 months Coverage (%): 72% to 91% Co‐interventions: IRS using propoxur 3 to 4 rounds per year Comparison (IRS only) Type: No MDA and no placebo Co‐interventions: IRS using propoxur 3 to 4 rounds per year | |
| Outcomes | Parasitaemia prevalence Measurement: Cross‐sectional surveys in selected village clusters (all ages) (microscopy) Time points: Pre‐MDA (8 surveys), During MDA (8 surveys) Sample size (range): 1257 to 2099 (intervention: low frequency MDA+IRS); 1486 to 1679 (intervention: high frequency MDA+IRS); 1104 to 1171 (comparison: IRS only) Gametocytaemia prevalence Measurement: Cross‐ sectional surveys in selected villages clusters (all ages) (microscopy) Time points: Pre‐MDA (8 surveys), During MDA (8 surveys) Sample size (range): 1257 to 2099 (intervention: low frequency MDA+IRS); 1486 to 1679 (intervention: high frequency MDA+IRS); 1104 to 1171 (comparison: IRS only) | |
| Notes | Abbreviations: IRS = indoor residual spraying, MDA = mass drug administration | |
| Risk of bias | ||
| Bias | Authors' judgement | Support for judgement |
| Random sequence generation (selection bias) | High risk | Non‐randomized controlled study |
| Allocation concealment (selection bias) | High risk | Non‐randomized controlled study |
| Baseline imbalance (selection bias) | Unclear risk | Similar malaria characteristics between groups at baseline, but unclear if other demographic factors were balanced. |
| Contamination protection | Low risk | Evaluation villages in both arms were surrounded by similarly treated buffer zones to mitigate possible contamination due to migration. |
| Blinding of participants and personnel (performance bias) | Unclear risk | Participants were not blinded to allocation, but there was limited access to antimalarials outside of MDA. |
| Blinding of outcome assessment (detection bias) | Low risk | Microscopists were blinded to study arm allocation through the use of a numeric identification code. Slides were read independently by two microscopists. |
| Incomplete outcome data (attrition bias) | Low risk | Parasitaemia surveys were performed in all ages in selected study villages. |
| Selective reporting (reporting bias) | Low risk | All pre‐stated outcomes were reported. |
| Other bias | Low risk | No other bias detected. |
| Comparability with individually randomized trials (cluster RCT) | Low risk | MDA, by definition, is applied at the population level, so this criteria is irrelevant for the intervention evaluated in this review. |
| Study characteristics | ||
| Methods | Dates of study: 2016 to 2017 Location of study: Zanzibar (three districts in Unguja, Central, South, and West districts) Malaria endemicity (prevalence): 2.5% (range between clusters 0.7‐4.5%) in control group at baseline by quantitative polymerase chain reaction (qPCR) [Very low ‐ estimated Plasmodium falciparum slide prevalence 0.2%] Transmission season: April to August Malaria species: P falciparum (predominant), P malaria, P ovale, and P vivax (rare) Vector species: Anopheles gambiae s.l., An arabiensis, An merus and An funestus Antimalarial drug resistance context: No evidence of resistance to first line treatment artesunate‐amodiaquine, with 100% efficacy in clinical trial conducted in 2017. Study design: Cluster‐randomized trial (allocation of shehias, or administrative wards, within the trial arms conducted using computerized block randomization based on shehia population size) Statistical power: Assuming a coefficient of variation of 0.35 and baseline malaria incidence of 12 per 1000, there was 80% power (alpha = 0.05) to detect a 50% reduction in confirmed malaria illness incidence in the intervention group. Study was not powered for parasitaemia prevalence. For cluster‐RCTs Unit of randomization: Shehia (hotspot shehia, defined as a shehia with an with an annual parasite index of greater than 8 confirmed malaria cases per 1000 population) Adjusted analyses for clustering: Yes; however, in this review, we performed cluster adjustment of the raw data using an estimated ICC to calculate effective sample sizes Adjustment method: Generalized estimating equations ICC: Not determined Number of clusters randomized: 16 Number of clusters analysed: 16 Number of people: 23,251 Average cluster size: 1453 | |
| Participants | Age groups included: All ages > 6 months. Pregnant women in their first trimester and anyone on concurrent antimalarial treatment at the time of MDA were excluded from MDA with dihydroartemisinin piperaquine. Pregnant women (all trimesters) or women breast feeding infants < 6 months were excluded from receiving low dose primaquine. Population targeted Intervention: 10,944 Comparison: 12,307 | |
| Interventions | Intervention: Drug/dose:
Number of rounds (timing/dates): 2 (30 April to 7 May 2016 at the start of high transmission season, and 28 May to 4 June 4 2016 during the peak of high transmission season) Interval: Every 4 weeks Duration implemented: 6 weeks Coverage (%): 91% in round 1 and 88% in round 2 (dihydroartemisinin piperaquine (DHAp)); 86% in round 1 and 80% in round 2 (low dose primaquine). Co‐interventions: IRS (single round in March 2016 with pirimiphos methyl; 85% of households sprayed at baseline) and ITNs (universal distribution campaign in 2015‐2016; self‐reported ITN use among all ages 75% at baseline). Comparison: Type: No MDA and no placebo Co‐interventions: IRS (single round in March 2016 with pirimiphos methyl; 85% of households sprayed at baseline) and ITNs (universal distribution campaign in 2015‐2016; self‐reported ITN use among all ages 71% at baseline). | |
| Outcomes | Parasitaemia prevalence Measurement: Cross‐sectional surveys of P falciparum (and Plasmodium) prevalence by two‐step pooled 18s‐quantitative PCR (qPCR) with first step screening by cytochrome b (Cytb) qPCR and 18s‐qPCR in participants of all ages from households randomly selected (50% of households randomly selected at each time point). Time points: During MDA (30 April to 7 May 2016) and 3 months post‐MDA (30 August to 9 September 2016) Sample size (range): 4402 to 4896 (intervention); 3875 to 4905 (comparison) Confirmed malaria illness incidence Measurement: Passive case detection at health facilities via malaria case notification system which captures confirmed malaria infections in real time. Time points: Pre‐MDA (May ‐ November 2015) and at 2 (May‐August 2016), 5 (May‐November 2016), 10 (May 2016 ‐ April 2017), and 14 (May 2016 ‐ August 2017) months post‐MDA Adverse effects (AEs) Among participants receiving MDA, 11.6% and 3.2% reported at least one AE after the first and second round, respectively. An additional 85 and 29 AE reports were passively identified at health facilities after rounds 1 and 2, respectively. The most commonly reported AEs were: nausea and vomiting (33.1%), stomach pain and diarrhoea (18.9%), and dizziness, headache, and fatigue (23.5%). Across all AEs, 44.1% were considered mild, 52.0% as moderate, and 0.5% as severe. There were no MDA‐associated deaths or other serious AEs. | |
| Notes | ClinicalTrials.gov: NCT02721186 The timing of the first parasitaemia survey coincided with the first round of MDA and continued for 10 days following the end of the first MDA distribution; therefore, the first parasitaemia survey was considered as "during MDA". Abbreviations: ICC = intracluster correlation coefficient, IRS = indoor residual spraying, ITN = insecticide‐treated bed net, MDA = mass drug administration, PCR = polymerase chain reaction | |
| Risk of bias | ||
| Bias | Authors' judgement | Support for judgement |
| Random sequence generation (selection bias) | Low risk | Random allocation of shehias to trial arms was conducted using computerized block randomization based on shehia population size. |
| Allocation concealment (selection bias) | Low risk | Allocation was conducted by an institution. |
| Baseline imbalance (selection bias) | High risk | Baseline malaria prevalence was higher in control (2.5%) compared to intervention (0.8%) shehias. Baseline vector control interventions and demographic characteristics were balanced across arms. |
| Contamination protection | Unclear risk | Distance between hotspot shehias was not described and there was no mention of buffer zones. |
| Blinding of participants and personnel (performance bias) | Unclear risk | Allocation concealment was not described. |
| Blinding of participants and personnel (performance bias) | Unclear risk | Participants were not blinded to allocation, which may have impacted care‐seeking. |
| Blinding of outcome assessment (detection bias) | Low risk | Laboratory staff performing PCR were unaware of the study arm allocation of samples. |
| Blinding of outcome assessment (detection bias) | Unclear risk | Unclear if the health facility staff performing malaria testing were aware of which study arm participants were assigned to. |
| Incomplete outcome data (attrition bias) | Low risk | Outcomes were assessed in participants of all ages residing in randomly sampled households. 50% of households randomly selected at each survey |
| Incomplete outcome data (attrition bias) | Low risk | Malaria cases reported in real time at health facilities through the malaria case notification system (MCN). |
| Selective reporting (reporting bias) | Low risk | All pre‐specified outcomes were reported. |
| Other bias | Low risk | No other bias detected. |
| Recruitment bias (cluster RCT) | Low risk | No recruitment following randomization. |
| Loss of clusters (cluster RCT) | Low risk | No clusters were lost. |
| Incorrect analysis (cluster RCT) | Low risk | Clustering accounted for using generalized estimating equations; however, in this review, we performed cluster adjustment of the raw data using an estimated ICC to calculate effective sample sizes. |
| Comparability with individually randomized trials (cluster RCT) | Low risk | MDA, by definition, is applied at the population level, so this criteria is irrelevant for the intervention evaluated in this review. |
| Study characteristics | ||
| Methods | Dates of study: 2016 to 2017 Location of study: Savannakhet Province, Laos Malaria endemicity (prevalence): Plasmodium falciparum prevalence 4.8% in MDA villages and 17.5% in control villages at baseline by ultrasensitive polymerase chain reaction (uPCR); P vivax prevalence 2.3% in MDA villages and 14.7% in control villages at baseline by uPCR [Low ‐ estimated P falciparum slide prevalence 5.3%] Transmission season: May to October Malaria species: P falciparum and P vivax Vector species: Not described Antimalarial drug resistance context: Not described Statistical power: For the multi‐country trial (Landier 2017 MMRa; Tripura 2018 KHM; Pongvongsa 2018 LAO; von Seidlein 2019 VNM), 80% power (alpha = 0.05) to detect a 95% reduction in parasite prevalence from a baseline prevalence of 10% For cluster‐RCTs Unit of randomization: Village Adjusted analyses for clustering: Yes; however, in this review, we performed cluster adjustment of the raw data using ICC values estimated from the study data to calculate effective sample sizes Adjustment method: Generalized estimating equations ICC: 0.1416 (P falciparum outcomes at baseline before MDA), 0.0944 (P falciparum outcomes at post‐MDA 1‐3 months), 0.05406 (P falciparum outcomes at post‐MDA 4‐6 months), 0.04319 (P falciparum outcomes at post‐MDA 7‐12 months); 0.1438 (P vivax outcomes at baseline before MDA), 0.0913 (P vivax outcomes at post‐MDA 1‐3 months), 0.02963 (P vivax outcomes at post‐MDA 4‐6 months), 0.01452 (P vivax outcomes at post‐MDA 7‐12 months) Number of clusters randomized: 4 Number of clusters analysed: 4 Number of people: 1889 Average cluster size: 472 Features: Two village pairs (4 villages) were established by geographical proximity, population size and parasite prevalence. Within each pair, one village was randomly selected to receive early MDA, while the other village received deferred MDA. | |
| Participants | Age groups included: All ages ≥ 6 months. All pregnant women were excluded from MDA. Population targeted Intervention: 1006 Comparison: 883 | |
| Interventions | Intervention: Drug/dose: Dihydroartemisinin (7 mg/kg) plus piperaquine (55 mg/kg) administered once a day for 3 days with a single dose of primaquine (0.25 mg/kg). Number of rounds (timing/dates): 3 (April, June, and July 2016) Interval: Every 1 month Duration implemented: 3 months Coverage (%): 81% in round 1, 80% in round 2, and 82% in round 3 Co‐interventions: LLITNs, uninterrupted access to diagnosis and treatment in study villages Comparison: Type: Deferred MDA administered in control villages in April, June, and July 2017 Co‐interventions: LLITNs, uninterrupted access to diagnosis and treatment in study villages | |
| Outcomes | Parasitaemia prevalence (P falciparum and P vivax) Measurement: Cross‐sectional surveys in all ages every 3 months by uPCR; all individuals present at the time of the survey in the study villages were sampled. Time points: Pre‐MDA (April 2016, just prior to first MDA round) and at 1 (August 2016), 4 (late October 2016), 7 (January 2017), and 10* (April 2017) months post‐MDA Sample size (range): 745 to 859 (intervention) and 618 to 802 (control) Adverse effects (AEs) AEs were assessed by home visits from village volunteers and clinicians following a report of an AE. Following MDA rounds, 282 individuals reported 295 AEs: 291 (99%) were mild, 3 (1%) were moderate, and 1 (< 1%) was severe (case of pneumonia requiring hospitalization). The most common AEs were common cold (17%), gastritis (8%), diarrhoea (8%), vomiting (7%), dizziness (6%), pruritus (6%), watery stool (4%), nausea (3%), and headache (3%). | |
| Notes | One of four sites from a multi‐country trial in Southeast Asia (ClinicalTrials.gov: NCT01872702) Abbreviations: ICC = intracluster correlation coefficient, LLITN = long‐lasting insecticide‐treated bed net, MDA = mass drug administration, uPCR = ultrasensitive polymerase chain reaction * Data from this survey was analysed as post‐MDA 7 to 12 month time period | |
| Risk of bias | ||
| Bias | Authors' judgement | Support for judgement |
| Random sequence generation (selection bias) | Low risk | "The randomisation was based on computer‐generated random numbers provided by the trial statistician" |
| Allocation concealment (selection bias) | Low risk | Allocation was conducted by an institution. |
| Baseline imbalance (selection bias) | High risk | Baseline prevalence of both P falciparum and P vivax substantially higher in control compared to intervention villages. Small number of clusters (4 villages) randomized. |
| Contamination protection | High risk | Intervention and control clusters were pair‐matched by geographical proximity, which likely led to a high risk of contamination due to population movement. |
| Blinding of participants and personnel (performance bias) | Unclear risk | Participants were not blinded to allocation. |
| Blinding of outcome assessment (detection bias) | Low risk | Laboratory staff performing PCR were unaware of the study arm allocation of samples. |
| Incomplete outcome data (attrition bias) | Low risk | Parasitaemia surveys were performed in all individuals aged six months or older residing in the study villages. |
| Selective reporting (reporting bias) | Low risk | All pre‐specified outcomes reported. |
| Other bias | Low risk | No other bias detected. |
| Recruitment bias (cluster RCT) | Low risk | No recruitment following randomization. |
| Loss of clusters (cluster RCT) | Low risk | No clusters were lost. |
| Incorrect analysis (cluster RCT) | Low risk | Although no adjustment for clustering was performed by investigators, in this review, we performed cluster adjustment of the raw data using a study‐provided ICC to calculate effective sample sizes |
| Comparability with individually randomized trials (cluster RCT) | Low risk | MDA, by definition, is applied at the population level, so this criteria is irrelevant for the intervention evaluated in this review. |
| Study characteristics | ||
| Methods | Dates of study: 1953 to 1954 Location of study: Kenya Malaria endemicity (prevalence): 37.6% (control) or 23% (intervention) at baseline in all ages by microscopy [Moderate] Transmission season: May to July Malaria species: P falciparum, P malariae Vector species: Anopheles gambiae, An funestus Antimalarial drug resistance context: Not described Study design: Controlled before‐and‐after study Statistical power: Not described | |
| Participants | Age groups included: All ages Population targeted Intervention (mean): 101,000 Comparison (mean): population not specified, but control area spans an entire district (Tiriki) | |
| Interventions | Intervention: Drug/dose:
Number of rounds (timing/dates): 2 (May 1953 and May 1954, just prior to the start of the rainy season) Interval: Every 1 year Duration implemented: 13 months Coverage (%): 95% in round 1 and 93% in round 2 Co‐interventions: None Comparison: Type: No MDA and no placebo Co‐interventions: None | |
| Outcomes | Parasitaemia prevalence Measurement: Cross‐sectional surveys conducted in a sub‐sample of study population (see notes); 14 surveys in total (microscopy) Time points: Pre‐MDA, During MDA, and at 1, 2, 3, 4, 6, and 7 months post‐MDA Sample size (range): 300 to 2100 (intervention); 300 to 2100 (comparison) | |
| Notes | Roberts 1964 KEN (1956 article) states: “Three hundred blood films were taken at each of the two places from people in the following age groups: 0‐10 years (100 films), 11‐20 years (100 films), 21 years and over (100 films)”. Therefore, we assumed that the total participants examined at each survey was 300 in intervention and 300 in comparison groups in order to calculate number of events (malaria cases) for parasitaemia prevalence. We also assumed that samples at each survey time point were independent and aggregated data within follow‐up time point categories. Abbreviations: MDA = mass drug administration | |
| Risk of bias | ||
| Bias | Authors' judgement | Support for judgement |
| Random sequence generation (selection bias) | High risk | Non‐randomized controlled study |
| Allocation concealment (selection bias) | High risk | Non‐randomized controlled study |
| Baseline imbalance (selection bias) | High risk | Baseline parasitaemia in the control group was much higher than the intervention group. No other baseline characteristics are described. |
| Contamination protection | High risk | The control area was located 10 miles from the centre of the intervention area with several major roads connecting both areas. No buffer zone. |
| Blinding of participants and personnel (performance bias) | Unclear risk | Participants were not blinded to allocation and unclear if this affected outcomes since the sampling methodology at each parasitaemia survey was not described. |
| Blinding of outcome assessment (detection bias) | Unclear risk | Examination of slides not described. Unclear if multiple reads were taken or if microscopists were blinded. |
| Incomplete outcome data (attrition bias) | Low risk | Data from three hundred slides at each survey sampled in 3 age groups are presented as described. |
| Selective reporting (reporting bias) | Low risk | All pre‐stated outcomes were reported. |
| Other bias | Low risk | No other bias detected. |
| Study characteristics | ||
| Methods | Dates of study: 2008 Location of study: Tanzania Malaria endemicity (prevalence): 0% in all ages at baseline by microscopy [Very low] Transmission season: March to May, October to November Malaria species: Plasmodium falciparum Vector species: Not described Antimalarial drug resistance context: Not described Study design: Cluster‐randomized trial Statistical power: 80% power (alpha = 0.05) to detect a 10‐fold lower malaria incidence in the intervention arm vs control (assuming 0.5 episodes per child) accounting for repeated measures and clustering. For cluster‐RCTs Unit of randomization: Geographical clusters of households Adjusted analyses for clustering: Yes; however, in this review, we performed cluster adjustment of the raw data using an estimated ICC to calculate effective sample sizes Adjustment method: Generalized estimating equations ICC: Not described Number of clusters randomized: 16 Number of clusters analysed: 16 Number of people: 3457 Average cluster size: 216 | |
| Participants | Age groups included: Ages > 1 year, but individuals who had received a full dose of artemisinin‐based combination therapy in the two weeks before the intervention were excluded. Pregnant women and individuals who were anaemic did not receive primaquine. Population targeted Intervention: 1110 Comparison: 2347 | |
| Interventions | Intervention: Drug/dose:
Number of rounds (timing/dates): 1 (February‐March 2008) Interval: Not applicable Duration implemented: 16 days Coverage (%): 94.6% received at least one dose and 93% received a complete dose of an efficacious anti‐malarial drug prior to the transmission season or immediately upon arrival to the area Co‐interventions: Reported ITN use 36.1% (2007) and a single treatment campaign for trachoma with azithromycin was undertaken by a non‐governmental organization. Comparison: Type: Placebo administered to all persons in eight clusters once daily over three days. Co‐interventions: Reported ITN use 36.1% (2007) and a single treatment campaign for trachoma with azithromycin was undertaken by a non‐governmental organization. If Placebo: Number of rounds (timing/dates): 1 (February‐March 2008) | |
| Outcomes | Parasitaemia prevalence Measurement: Cross‐sectional surveys of P falciparum prevalence by microscopy and QT‐NASBA in 50 randomly‐selected individuals per cluster Time points: Pre‐MDA (January‐February 2008) and at < 1 (April 2008), 2 (May 2008), 3 (June 2008), and 4 (July 2008) months post‐MDA Sample size (range): 261 to 399 (intervention); 212 to 395 (comparison) Confirmed malaria illness incidence Measurement: Active case surveillance of 150 randomly‐selected children (ages 1 to 10 years) from each arm, visited every 2 weeks to monitor symptoms and test by RDT if febrile. Passive surveillance in entire population. Time points: Followed every 2 weeks for 6 months (February‐July 2008) Gametocytaemia prevalence Measurement: Cross‐sectional surveys of gametocytaemia prevalence by microscopy and QT‐NASBA in 50 randomly selected individuals per cluster Time points: Pre‐MDA (January‐February 2008) and at < 1 (April 2008), 2 (May 2008), 3 (June 2008), and 4 (July 2008) months post‐MDA Sample size (range): 261‐399 (intervention); 212‐395 (comparison) Adverse effects One individual was diagnosed with possibly‐drug related severe skin reaction in the week following MDA. A second individual presented with non‐drug related skin hyperpigmentation on the face. Both individuals were treated with steroids and monitored until symptoms disappeared. In those given primaquine, moderate anaemia (Hb level of < 8 g/dL) was observed in 40% (6/15 individuals) of the G6PD A‐, 11.1% (3/27 individuals) of the G6PD A, and 4.5% (18/399 individuals) of the G6PD B individuals; one case of severe anaemia (haemoglobin level of < 5 g/dL) was observed. | |
| Notes | ClinicalTrials.gov: NCT00509015 Due to the following reasons, we excluded this study from quantitative synthesis in this review: outcome evaluation by 18S QT‐NASBA ended prematurely during the follow‐up period; we were unable to classify events in microscopy outcomes by post‐MDA time point (reported in aggregate in the publication); and the baseline before MDA number of events for multiple outcomes was zero. Abbreviations: ICC = intracluster correlation coefficient, ITN = insecticide‐treated bed net, MDA = mass drug administration, QT‐NASBA = real‐time quantitative nucleic acid sequence based amplification, RDT = rapid diagnostic test | |
| Risk of bias | ||
| Bias | Authors' judgement | Support for judgement |
| Random sequence generation (selection bias) | Low risk | "Clusters were randomized to the intervention or control arm using computer generated randomization tables using excel." |
| Allocation concealment (selection bias) | Low risk | Placebo‐controlled trial, therefore allocation was concealed. |
| Baseline imbalance (selection bias) | Low risk | Baseline demographic and malaria characteristics were similar across arms. |
| Contamination protection | Low risk | "Households that were located between clusters (i.e. within 1 km distance from the boundary of intervention and/or control clusters) were considered as buffer zones. Members of these households received the intervention in order to minimize contamination." |
| Blinding of participants and personnel (performance bias) | Low risk | Placebo‐controlled trial and, at each cross‐sectional survey, individuals were randomly selected from computer‐generated random tables. However, placebo tablets appear different from intervention drug. |
| Blinding of participants and personnel (performance bias) | Low risk | Placebo‐controlled trial. |
| Blinding of outcome assessment (detection bias) | Low risk | Placebo‐controlled trial; slides were read independently by two microscopists. |
| Blinding of outcome assessment (detection bias) | Low risk | Placebo‐controlled trial. |
| Incomplete outcome data (attrition bias) | Low risk | Random sample of individuals surveyed at baseline and follow‐up. |
| Incomplete outcome data (attrition bias) | Low risk | Active (visit by trained fieldworker every 2 weeks) and passive case detection. |
| Selective reporting (reporting bias) | Low risk | All pre‐specified outcome measures were reported. |
| Other bias | Low risk | No other bias detected. |
| Recruitment bias (cluster RCT) | Low risk | No recruitment following randomization. |
| Loss of clusters (cluster RCT) | Low risk | No clusters were lost. |
| Incorrect analysis (cluster RCT) | Low risk | Clustering accounted for using generalized estimating equations; however, in this review, we performed cluster adjustment of the raw data using an estimated ICC to calculate effective sample sizes. |
| Comparability with individually randomized trials (cluster RCT) | Low risk | MDA, by definition, is applied at the population level, so this criteria is irrelevant for the intervention evaluated in this review. |
| Study characteristics | ||
| Methods | Dates of study: 2014‐2016 Location of study: Battambang province, Cambodia Malaria endemicity (prevalence): Plasmodium falciparum prevalence 0.9% in MDA villages and 2.4% in control villages at baseline by ultrasensitive polymerase chain reaction (uPCR); P vivax prevalence 10.7% in MDA villages and 8.8% in control villages at baseline by uPCR [Very low ‐ estimated P falciparum slide prevalence 0.5%] Transmission season: May to October Malaria species: P falciparum and P vivax Vector species: Not described Antimalarial drug resistance context: Reduced susceptibility to artemisinins and ACT partner drug resistance Study design: Pair‐matched cluster‐randomized trial Statistical power: For the multi‐country trial (Landier 2017 MMRa; Tripura 2018 KHM; Pongvongsa 2018 LAO; von Seidlein 2019 VNM), 80% power (alpha = 0.05) to detect a 95% reduction in parasite prevalence from a baseline prevalence of 10% For cluster‐RCTs Unit of randomization: Village Adjusted analyses for clustering: Yes; however, in this review, we performed cluster adjustment of the raw data using ICC values estimated from the study data to calculate effective sample sizes Adjustment method: Generalized estimating equations ICC: 0.004175 (P falciparum outcomes at baseline before MDA), 0 (P falciparum outcomes at post‐MDA 1‐3, 4‐6, and 7‐12 months); 0.02167 (P vivax outcomes at baseline before MDA), 0.01637 (P vivax outcomes at post‐MDA 1‐3 months), 0.02229 (P vivax outcomes at post‐MDA 4‐6 months), 0.002531 (P vivax outcomes at post‐MDA 7‐12 months) Number of clusters randomized: 4 Number of clusters analysed: 4 Number of people: 2,770 Average cluster size: 693 Features: Two village pairs (4 villages) were established by geographical proximity, population size, and parasite prevalence. Within each pair, one village was randomly selected to receive early MDA, while the other village received deferred MDA | |
| Participants | Age groups included: All ages ≥ 6 months. All pregnant women were excluded from MDA. Population targeted Intervention: 858 Comparison: 1912 | |
| Interventions | Intervention: Drug/dose: Dihydroartemisinin (7 mg/kg) plus piperaquine tetraphosphate (55 mg/kg) administered once a day for 3 days. Visitors or returning residents were offered a single course of piperaquine tetraphosphate. Number of rounds (timing/dates): 3 (July, August, September 2015) Interval: Every 1 month Duration implemented: 3 months Coverage (%): 74% in round 1, 60% in round 2, and 71% in round 3 Co‐interventions: LLITNs, uninterrupted access to diagnosis and treatment in study villages Comparison: Type: Deferred MDA administered in control villages in July, August, and September 2016 Co‐interventions: LLITNs, uninterrupted access to diagnosis and treatment in study villages | |
| Outcomes | Parasitaemia prevalence (P falciparum and P vivax) Measurement: Cross‐sectional surveys in all ages every 3 months by uPCR; all individuals present at the time of the survey in the study villages were sampled. Time points: Pre‐MDA (July 2015) and at 1 (Oct 2015), 4 (Jan 2016), 7 (April 2016), and 10* (July 2016) months post‐MDA Sample size (range): 470 to 543 (intervention) and 583 to 1090 (control) Confirmed malaria illness incidence (P falciparum and P vivax) Measurement: Passive case detection at malaria posts for measured or self‐reported fever (≥ 37.5 °C) and confirmed Pfalciparum or P vivax infection by RDT or microscopy. Time points: Pre‐MDA (July 2014 ‐ June 2015) and at 9 (July 2015 to June 2016) months' post‐MDA Adverse effects (AEs) AEs were assessed through active surveillance on days 1, 2, 3, and 7 following MDA rounds. AEs were reported by 46% (n=909) participants and a majority (96%) were mild; 4% (n=40) required medical attention and there were 3 non‐study‐related deaths. No serious AEs were reported. The most common AEs reported were dizziness (22%), headache (18%), fever (10%), and nausea (8%). | |
| Notes | One of four sites from a multi‐country trial in Southeast Asia (ClinicalTrials.gov: NCT01872702) Abbreviations: ACT = artemisinin‐based combination therapy, ICC = intracluster correlation coefficient, LLITN = long‐lasting insecticide‐treated bed net, MDA = mass drug administration, uPCR = ultrasensitive polymerase chain reaction * Data from this survey was analysed as post‐MDA 7‐12 month time point | |
| Risk of bias | ||
| Bias | Authors' judgement | Support for judgement |
| Random sequence generation (selection bias) | Low risk | "The randomisation was based on computer‐generated random numbers provided by the trial statistician" |
| Allocation concealment (selection bias) | Low risk | Allocation was conducted by an institution. |
| Baseline imbalance (selection bias) | High risk | Baseline prevalence of P falciparum substantially higher in control compared to intervention villages baseline. Small number of clusters (4 villages) randomized. |
| Contamination protection | High risk | Intervention and control clusters were pair‐matched by geographical proximity, which likely led to a high risk of contamination due to population movement. |
| Blinding of participants and personnel (performance bias) | Unclear risk | Participants were not blinded to allocation. |
| Blinding of participants and personnel (performance bias) | Unclear risk | Participants were not blinded to allocation, which may have impacted care‐seeking. |
| Blinding of outcome assessment (detection bias) | Low risk | Laboratory staff performing PCR were unaware of the study arm allocation of samples. |
| Blinding of outcome assessment (detection bias) | Unclear risk | Unclear if the health facility staff performing malaria testing were aware of which study arm participants were assigned to. |
| Incomplete outcome data (attrition bias) | Low risk | Parasitaemia surveys were performed in all individuals aged six months or older residing in the study villages. |
| Incomplete outcome data (attrition bias) | Low risk | Data collected at malaria health posts with dedicated study staff. |
| Selective reporting (reporting bias) | Low risk | All pre‐specified outcomes reported. |
| Other bias | Low risk | No other bias detected. |
| Recruitment bias (cluster RCT) | Low risk | No recruitment following randomization. |
| Loss of clusters (cluster RCT) | Low risk | No clusters were lost. |
| Incorrect analysis (cluster RCT) | Low risk | Although no adjustment for clustering was performed by investigators, in this review, we performed cluster adjustment of the raw data using a study‐provided ICC to calculate effective sample sizes |
| Comparability with individually randomized trials (cluster RCT) | Low risk | MDA, by definition, is applied at the population level, so this criteria is irrelevant for the intervention evaluated in this review. |
| Study characteristics | ||
| Methods | Dates of study: 1999 Location of study: The Gambia Malaria endemicity: 42.9% in children ≤ 5 years in control at baseline [High] Transmission season: June to December Malaria species: Plasmodium falciparum Vector species: Not described Antimalarial drug resistance context: Not described Study design: Cluster‐randomized trial Statistical power: 90% power (alpha = 0.05) to detect a 40% reduction in malaria incidence among children < 11 years assuming coefficient of variation between pair‐matched villages of 0.25, 20% loss to follow‐up, and mean incidence of malaria of 1 attack per child per week during the 20 week transmission season. For cluster‐RCTs Unit of randomization: Villages Adjusted analyses for clustering: Yes; however, in this review, we performed cluster adjustment of the raw data using an estimated ICC to calculate effective sample sizes Adjustment method: Poisson regression model adjusting for population size ICC: Not described Number of clusters randomized: 18 Number of clusters analysed: 18 Number of people: 3655 Average cluster size: 203 Feature: Matched villages by population size, spleen rate in children < 5 years, and distance from the river | |
| Participants | Age groups included: All persons ≥ 6 months old; pregnant women excluded. Population targeted Intervention: 12,331 Control: 1686 | |
| Interventions | Intervention: Drug/dose:
Number of rounds (timing/dates): 1 (June 1999) Interval: Not applicable Duration implemented: 1 month Coverage (%): 89% in total population, 90.8% in evaluated group Co‐interventions: None Comparison: Type: Placebo Co‐interventions: None If placebo: Number of rounds (timing/dates): 1 (June 1999) | |
| Outcomes | Parasitaemia prevalence Measurement: Cross‐sectional surveys of P falciparum prevalence by microscopy in children and weekly surveillance in all ages Time points: Pre‐MDA (children ≤ 5 years, May 1999) and at 6 months post‐MDA (children < 11 years, November 1999) Sample size (range): 808 to 985 (intervention); 605 or 606 (comparison) Parasitaemia incidence Measurement: Weekly surveillance in children aged < 11 years for cases with temperature ≥ 37.5 °C and P falciparum parasitaemia > 5000 parasites per µL by microscopy Time points: at 5 months post‐MDA (20 July 1999 to 2 December 1999) Sample size: 769 (intervention); 607 (comparison) Gametocytaemia prevalence Measurement: Cross‐sectional surveys of gametocytaemia prevalence by microscopy in children Time points: Pre‐MDA (children ≤ 5 years) and at 6 months post‐MDA (children < 11 years) Sample size (range): 808 to 985 (intervention); 605 or 606 (comparison) Malaria‐specific mortality Measurement: Verbal autopsy confirmed by 3 physicians in children < 11 years Adverse effects (AEs) Monitored through passive and active surveillance. Active surveillance consisted of asking 90 randomly selected individuals across all 42 study area villages about AEs one month following MDA. AEs reported (passive surveillance system): 1 episode of pruritus in intervention group. AEs reported (active surveillance system): 25 of 75 individuals in intervention group remembered one or more complaints within 2 days of taking the drug including dizziness (13), fever (6), diarrhoea (5), vomiting (5) and itching (4). In the comparison group, 2 of 15 individuals (13%) who had received placebo remembered complaints | |
| Notes | Abbreviations: ICC = intracluster correlation coefficient, MDA = mass drug administration | |
| Risk of bias | ||
| Bias | Authors' judgement | Support for judgement |
| Random sequence generation (selection bias) | Low risk | Method of randomization not described, but previous author correspondence revealed that randomization was computer generated. |
| Allocation concealment (selection bias) | Low risk | One study nurse administered all study drugs to the 18 villages and left the study area following administration. Study personnel and participants were blinded to the intervention status. Placebo‐controlled trial, therefore allocation was concealed. |
| Baseline imbalance (selection bias) | Low risk | Intervention and control villages were similar across baseline characteristics reported. |
| Contamination protection | Low risk | All individuals in neighbouring non‐randomized villages in the study area received MDA in order to minimize the risk of contamination. |
| Blinding of participants and personnel (performance bias) | Low risk | Cluster‐randomized, double‐blind, placebo‐controlled trial in which neither study personnel nor participants were aware of the intervention status of villages. Placebo tablets identical to intervention drug. |
| Blinding of participants and personnel (performance bias) | Low risk | Cluster‐randomized, double‐blind, placebo‐controlled trial in which neither study personnel nor participants were aware of the intervention status of villages. Placebo tablets identical to intervention drug. |
| Blinding of outcome assessment (detection bias) | Low risk | Outcome assessment by microscopy was blinded to intervention status. |
| Blinding of outcome assessment (detection bias) | Low risk | Outcome assessment by microscopy was blinded to intervention status. Cases diagnosed at health centre by RDT, but neither study personnel nor participants were aware of the intervention status of villages. |
| Incomplete outcome data (attrition bias) | Low risk | All children < 11 years in the surveillance villages were surveyed. |
| Incomplete outcome data (attrition bias) | High risk | 78‐92% of children were examined weekly by field workers and 87% of planned visits took place. However, malaria cases were defined as a temperature ≥ 37.5 °C and parasitaemia > 5000/µL, which may have precluded asymptomatic or lower density infections and resulted in an underestimate of parasitaemia incidence. |
| Selective reporting (reporting bias) | Low risk | All pre‐specified outcomes were reported. |
| Other bias | Low risk | No other bias detected. |
| Recruitment bias (cluster RCT) | Low risk | No recruitment following randomization. |
| Loss of clusters (cluster RCT) | Low risk | One cluster pair (Daro Rahman and Misira villages) was not analysed due to political and logistical problems, but sensitivity analysis indicated similar results. "Analyses which omitted these 2 villages yielded similar results as the analyses including the 2 villages." |
| Incorrect analysis (cluster RCT) | Low risk | Analysis adjusted for clustering using Poisson regression model adjusting for population size; however, in this review, we performed cluster adjustment of the raw data using an estimated ICC to calculate effective sample sizes. |
| Comparability with individually randomized trials (cluster RCT) | Low risk | MDA, by definition, is applied at the population level, so this criteria is irrelevant for the intervention evaluated in this review. |
| Study characteristics | ||
| Methods | Dates of study: 2013‐2015 Location of study: Binh Phuoc and Ninh Thuan provinces, Vietnam Malaria endemicity (prevalence): Plasmodium falciparum prevalence 3.9% in MDA villages and 4.1% in control villages at baseline by ultrasensitive polymerase chain reaction (uPCR); P vivax prevalence 6.3% in MDA villages and 7.3% in control villages at baseline by uPCR [Very low ‐ estimated P falciparum slide prevalence 0.9%] Transmission season: May to November Malaria species: P falciparum and P vivax Vector species: Not described Antimalarial drug resistance context: At the start of the study, no evidence of resistance to piperaquine and cure rates following dihydroartemisinin piperaquine (DHAp) were satisfactory. In 2016, multidrug resistance was first detected and treatment failures with DHAp have increased since then. Statistical power: For the multi‐country trial (Landier 2017 MMRa; Tripura 2018 KHM; Pongvongsa 2018 LAO; von Seidlein 2019 VNM), 80% power (alpha = 0.05) to detect a 95% reduction in parasite prevalence from a baseline prevalence of 10% For cluster‐RCTs Unit of randomization: Village Adjusted analyses for clustering: Yes; however, in this review, we performed cluster adjustment of the raw data using ICC values estimated from the study data to calculate effective sample sizes Adjustment method: Generalized estimating equations ICC: 0.002464 (P falciparum outcomes at baseline before MDA), 0 (P falciparum outcomes at post‐MDA 1‐3 months), 0.003616 (P falciparum outcomes at post‐MDA 4‐6 months), 0.006523 (P falciparum outcomes at post‐MDA 7‐12 months); 0.001502 (P vivax outcomes at baseline before MDA), 0.002539 (P vivax outcomes at post‐MDA 1‐3 months), 0 (P vivax outcomes at post‐MDA 4‐6 and 7‐12 months) Number of clusters randomized: 4 Number of clusters analysed: 4 Number of people: 2846 Average cluster size: 712 Features: Two village pairs (4 villages) were established by geographical proximity, population size and parasite prevalence. Within each pair, one village was randomly selected to receive early MDA, while the other village received deferred MDA | |
| Participants | Age groups included: All ages ≥ 6 months. All pregnant women in their first trimester were excluded from MDA and pregnant women in any trimester were excluded from primaquine. Population targeted Intervention: 1439 Comparison: 1407 | |
| Interventions | Intervention: Drug/dose: Dihydroartemisinin (7 mg/kg) plus piperaquine (55 mg/kg) administered once a day for 3 days with a single dose of primaquine (0.25 mg/kg). Number of rounds (timing/dates): 3 (November 2013, January and February 2014) Interval: Every 1 month Duration implemented: 3 months Coverage (%): 83% in round 1, 98% in round 2, and 99% in round 3 Co‐interventions: LLITNs, uninterrupted access to diagnosis and treatment in study villages Comparison: Type: Deferred MDA administered in control villages in December 2014, January 2015, and February 2015 Co‐interventions: LLITNs, uninterrupted access to diagnosis and treatment in study villages | |
| Outcomes | Parasitaemia prevalence (P falciparum and P vivax) Measurement: Cross‐sectional surveys in all ages every 3 months by uPCR; all individuals present at the time of the survey in the study villages were sampled. Time points: Pre‐MDA (November 2013, just prior to first MDA round) and at 1 (March 2014), 4 (June 2014), 7 (September 2014), and 10* (December 2014) months post‐MDA Sample size (range): 745 to 859 (intervention) and 618 to 802 (control) Adverse effects (AEs) 22 AEs were reported which included vomiting, nausea, diarrhoea, labyrinth disorder, leg fracture and urticaria. Seven serious AEs were reported within the first year of the study including death from suicide, sudden death, drowning, decline due to aging, and gastric cancer. | |
| Notes | One of four sites from a multi‐country trial in Southeast Asia (ClinicalTrials.gov: NCT01872702) Abbreviations: ICC = intracluster correlation coefficient, LLITN = long‐lasting insecticide‐treated bed net, MDA = mass drug administration, uPCR = ultrasensitive polymerase chain reaction * Data from this survey was analysed as post‐MDA 7‐12 month time point | |
| Risk of bias | ||
| Bias | Authors' judgement | Support for judgement |
| Random sequence generation (selection bias) | Low risk | "The randomisation was based on computer‐generated random numbers provided by the trial statistician" |
| Allocation concealment (selection bias) | Low risk | Allocation was conducted by an institution. |
| Baseline imbalance (selection bias) | Low risk | Small number of clusters (4 villages) randomized, but baseline malaria prevalence is balanced across arms. |
| Contamination protection | High risk | Intervention and control clusters were pair‐matched by geographical proximity, which likely led to a high risk of contamination due to population movement. |
| Blinding of participants and personnel (performance bias) | Unclear risk | Participants were not blinded to allocation. |
| Blinding of outcome assessment (detection bias) | Low risk | Laboratory staff performing PCR were unaware of the study arm allocation of samples. |
| Incomplete outcome data (attrition bias) | Low risk | Parasitaemia surveys were performed in all individuals aged six months or older residing in the study villages. |
| Selective reporting (reporting bias) | Low risk | All pre‐specified outcomes reported. |
| Other bias | Low risk | No other bias detected. |
| Recruitment bias (cluster RCT) | Low risk | No recruitment following randomization. |
| Loss of clusters (cluster RCT) | Low risk | No clusters were lost. |
| Incorrect analysis (cluster RCT) | Low risk | Although no adjustment for clustering was performed by investigators, in this review, we performed cluster adjustment of the raw data using a study‐provided ICC to calculate effective sample sizes |
| Comparability with individually randomized trials (cluster RCT) | Low risk | MDA, by definition, is applied at the population level, so this criteria is irrelevant for the intervention evaluated in this review. |
Characteristics of excluded studies [ordered by study ID]
| Study | Reason for exclusion |
| Considered for ITS analysis, but since LLINs were distributed at the time of the first round of MDA, it is not possible to evaluate the effect of MDA alone | |
| Insufficient pre‐ and/or post‐MDA coverage of data points for ITS analysis | |
| Insufficient pre‐ and/or post‐MDA coverage of data points for ITS analysis | |
| No control group | |
| Insufficient pre‐ and/or post‐MDA coverage of data points for ITS analysis due to timing of IRS implementation in relation to MDA rounds | |
| Insufficient pre‐ and/or post‐MDA coverage of data points for ITS analysis due to timing of IRS implementation in relation to MDA rounds | |
| Fewer than 2 sites or clusters per arm | |
| Fewer than 2 sites or clusters per arm | |
| Unbalanced co‐interventions across arms (Intervention: MDA+ITNs+larvivorous fish, Control: no MDA and delayed distribution of ITNs) | |
| Intervention targeted to hotspots of malaria infection (targeted MDA) | |
| Insufficient pre‐ and post‐MDA coverage of data points for ITS analysis | |
| Unbalanced co‐interventions across arms (Intervention: MDA+IRS, Control: no MDA and no IRS) | |
| Inadequate treatment dose |
LLIN = long‐lasting insecticide‐treated bed net, IRS = indoor residual spraying, ITS = interrupted time series, MDA = mass drug administration.
Characteristics of studies awaiting classification [ordered by study ID]
| Methods | Dates of study: 2006 Location of study: Sudan Malaria endemicity: 15% [Moderate] Transmission season: October to November Malaria species: Plasmodium falciparum Vector species: Not described Antimalarial drug resistance context: Not described Study design: Cluster‐randomized trial Statistical power: 90% power (alpha = 0.05) to detect a reduction in malaria prevalence from 15% to 5% among all ages, assuming a baseline malaria prevalence of 15% For cluster‐RCTs Unit of randomization: Village Adjusted analyses for clustering: No Adjustment method: Not applicable ICC: Not described Number of clusters randomized: 8 Number of clusters analysed: 8 Number of people: Not described Average cluster size: Not described |
| Participants | Age groups included: All persons ≥ 1 year old; pregnant women and persons with a history of allergy to sulfa drugs excluded. Population targeted Not described |
| Interventions | Intervention: Drug/dose: Sulfadoxine‐pyrimethamine (dose not described) plus artesunate (dose not described) given over three days Number of rounds (timing/dates): 1 (July 2006) Interval: Not applicable Duration implemented: Not described Coverage (%): Not described Co‐interventions: Not described Comparison: Type: Placebo Co‐interventions: None If placebo: Number of rounds (timing/dates): 1 (July 2006) Interval: Not applicable Duration implemented: Not described Coverage (%): Not described Co‐interventions: Not described |
| Outcomes | Parasitaemia prevalence Measurement: Cross‐sectional survey of P falciparum prevalence by microscopy in all ages Time points: at 4 months' post‐MDA (November 2006) Sample size: 200 participants per village; approximately 800 participants per study arm Adverse events |
| Notes | Placebo tablet similar to active drug in shape and size. Unclear if a pre‐MDA parasitaemia survey was conducted. According to author communication: data collection complete and results from trial will be published. Characteristics of study completed using information from clinicaltrials.gov (NCT00646126) and communications with author |
| Methods | Dates of study: Not described Location of study: Est‐Mono in the Plateaux region, Togo Malaria endemicity (prevalence): Not described Transmission season: Not described Malaria species: Not described Vector species: Not described Antimalarial drug resistance context: Not described Study design: Interrupted time series or controlled before‐and‐after study Statistical power: Not described |
| Participants | Age groups included: All persons ≥ 6 months old; pregnant women in their first trimester and persons with serious illness or allergies to drug excluded. Population targeted: 125,611 |
| Interventions | Artemisinin‐piperaquine Drug/dose: Artemisinin‐piperaquine as a single tablet (62.5 mg artemisinin and 375 mg piperaquine) given for two days Number of rounds (timing/dates): 3 Interval: 1 month Duration implemented: 3 months Coverage (%): Not described Co‐interventions: Not described |
| Outcomes | Parasitaemia prevalence Parasitaemia incidence among children < 5 years Confirmed malaria illness incidence |
| Notes | ChiCTR‐POC‐16009019 After multiple attempts to contact investigators, the status of this trial is unknown. |
Data and analyses
| Outcome or subgroup title | No. of studies | No. of participants | Statistical method | Effect size |
| 1.1 Parasitaemia prevalence (P falciparum) Show forest plot | 2 | Risk Ratio (M‐H, Fixed, 95% CI) | Totals not selected | |
| Analysis 1.1  Comparison 1: MDA versus no MDA in moderate to high endemicity (cRCTs) on P falciparum outcomes, Outcome 1: Parasitaemia prevalence (P falciparum) | ||||
| 1.1.1 Baseline before MDA | 2 | Risk Ratio (M‐H, Fixed, 95% CI) | Totals not selected | |
| 1.1.2 During MDA | 1 | Risk Ratio (M‐H, Fixed, 95% CI) | Totals not selected | |
| 1.1.3 Post‐MDA 1‐3 months | 1 | Risk Ratio (M‐H, Fixed, 95% CI) | Totals not selected | |
| 1.1.4 Post‐MDA 4‐6 months | 1 | Risk Ratio (M‐H, Fixed, 95% CI) | Totals not selected | |
| 1.2 Parasitaemia incidence (P falciparum) Show forest plot | 2 | Rate Ratio (IV, Fixed, 95% CI) | Totals not selected | |
| Analysis 1.2  Comparison 1: MDA versus no MDA in moderate to high endemicity (cRCTs) on P falciparum outcomes, Outcome 2: Parasitaemia incidence (P falciparum) | ||||
| 1.2.1 Post‐MDA 1‐3 months | 1 | Rate Ratio (IV, Fixed, 95% CI) | Totals not selected | |
| 1.2.2 Post‐MDA 4‐6 months | 1 | Rate Ratio (IV, Fixed, 95% CI) | Totals not selected | |
| 1.3 Confirmed malaria illness incidence (P falciparum) Show forest plot | 1 | Rate Ratio (IV, Fixed, 95% CI) | Totals not selected | |
| Analysis 1.3  Comparison 1: MDA versus no MDA in moderate to high endemicity (cRCTs) on P falciparum outcomes, Outcome 3: Confirmed malaria illness incidence (P falciparum) | ||||
| 1.3.1 Baseline before MDA | 1 | Rate Ratio (IV, Fixed, 95% CI) | Totals not selected | |
| 1.3.2 Post‐MDA 1‐3 months | 1 | Rate Ratio (IV, Fixed, 95% CI) | Totals not selected | |
| 1.4 Gametocytaemia prevalence (P falciparum) Show forest plot | 1 | Risk Ratio (M‐H, Fixed, 95% CI) | Totals not selected | |
| Analysis 1.4  Comparison 1: MDA versus no MDA in moderate to high endemicity (cRCTs) on P falciparum outcomes, Outcome 4: Gametocytaemia prevalence (P falciparum) | ||||
| 1.4.1 Baseline before MDA | 1 | Risk Ratio (M‐H, Fixed, 95% CI) | Totals not selected | |
| 1.4.2 Post‐MDA 4‐6 months | 1 | Risk Ratio (M‐H, Fixed, 95% CI) | Totals not selected | |
| 1.5 Malaria‐specific mortality Show forest plot | 1 | Risk Ratio (IV, Fixed, 95% CI) | Totals not selected | |
| Analysis 1.5  Comparison 1: MDA versus no MDA in moderate to high endemicity (cRCTs) on P falciparum outcomes, Outcome 5: Malaria‐specific mortality | ||||
| 1.5.1 Post‐MDA 4‐6 months | 1 | Risk Ratio (IV, Fixed, 95% CI) | Totals not selected | |
| Outcome or subgroup title | No. of studies | No. of participants | Statistical method | Effect size |
| 2.1 Parasitaemia prevalence (P falciparum) Show forest plot | 7 | Risk Ratio (M‐H, Fixed, 95% CI) | Subtotals only | |
| Analysis 2.1  Comparison 2: MDA versus no MDA in very low to low endemicity (cRCTs) on P falciparum outcomes, Outcome 1: Parasitaemia prevalence (P falciparum) | ||||
| 2.1.1 Baseline before MDA | 6 | 2093 | Risk Ratio (M‐H, Fixed, 95% CI) | 0.89 [0.62, 1.26] |
| 2.1.2 During‐MDA | 2 | 991 | Risk Ratio (M‐H, Fixed, 95% CI) | 0.26 [0.07, 0.94] |
| 2.1.3 Post‐MDA <1 month | 1 | 234 | Risk Ratio (M‐H, Fixed, 95% CI) | 0.12 [0.03, 0.52] |
| 2.1.4 Post‐MDA 1‐3 months | 7 | 5718 | Risk Ratio (M‐H, Fixed, 95% CI) | 0.25 [0.15, 0.41] |
| 2.1.5 Post‐MDA 4‐6 months | 4 | 3129 | Risk Ratio (M‐H, Fixed, 95% CI) | 0.63 [0.36, 1.12] |
| 2.1.6 Post‐MDA 7‐12 months | 5 | 3704 | Risk Ratio (M‐H, Fixed, 95% CI) | 0.86 [0.55, 1.36] |
| 2.1.7 Post‐MDA 13‐18 months | 1 | 243 | Risk Ratio (M‐H, Fixed, 95% CI) | 0.82 [0.20, 3.34] |
| 2.1.8 Post‐MDA 19‐24 months | 1 | 239 | Risk Ratio (M‐H, Fixed, 95% CI) | 0.34 [0.06, 1.97] |
| 2.1.9 Post‐MDA 25‐30 months | 1 | 242 | Risk Ratio (M‐H, Fixed, 95% CI) | 0.89 [0.22, 3.62] |
| 2.1.10 Post‐MDA 31‐36 months | 1 | 246 | Risk Ratio (M‐H, Fixed, 95% CI) | 1.25 [0.25, 6.31] |
| 2.2 Parasitaemia incidence (P falciparum) Show forest plot | 1 | Rate Ratio (IV, Fixed, 95% CI) | Totals not selected | |
| Analysis 2.2  Comparison 2: MDA versus no MDA in very low to low endemicity (cRCTs) on P falciparum outcomes, Outcome 2: Parasitaemia incidence (P falciparum) | ||||
| 2.2.1 Post‐MDA 1‐3 months | 1 | Rate Ratio (IV, Fixed, 95% CI) | Totals not selected | |
| 2.3 Confirmed malaria illness incidence (P falciparum) Show forest plot | 4 | Rate Ratio (IV, Fixed, 95% CI) | Subtotals only | |
| Analysis 2.3  Comparison 2: MDA versus no MDA in very low to low endemicity (cRCTs) on P falciparum outcomes, Outcome 3: Confirmed malaria illness incidence (P falciparum) | ||||
| 2.3.1 Baseline before MDA | 3 | Rate Ratio (IV, Fixed, 95% CI) | 0.87 [0.45, 1.69] | |
| 2.3.2 Post‐MDA 1‐3 months | 2 | Rate Ratio (IV, Fixed, 95% CI) | 0.58 [0.12, 2.73] | |
| 2.3.3 Post‐MDA 4‐6 months | 1 | Rate Ratio (IV, Fixed, 95% CI) | 0.93 [0.07, 12.43] | |
| 2.3.4 Post‐MDA 7‐12 months | 3 | Rate Ratio (IV, Fixed, 95% CI) | 0.47 [0.21, 1.03] | |
| 2.3.5 Post‐MDA 13‐18 months | 1 | Rate Ratio (IV, Fixed, 95% CI) | 0.77 [0.20, 3.03] | |
| Outcome or subgroup title | No. of studies | No. of participants | Statistical method | Effect size |
| 3.1 Parasitaemia prevalence (P vivax) Show forest plot | 5 | Risk Ratio (M‐H, Fixed, 95% CI) | Subtotals only | |
| Analysis 3.1  Comparison 3: MDA versus no MDA in very low to low endemicity (cRCTs) on P vivax outcomes, Outcome 1: Parasitaemia prevalence (P vivax) | ||||
| 3.1.1 Baseline before MDA | 5 | 3187 | Risk Ratio (M‐H, Fixed, 95% CI) | 1.02 [0.86, 1.21] |
| 3.1.2 Post‐MDA <1 month | 1 | 234 | Risk Ratio (M‐H, Fixed, 95% CI) | 0.18 [0.08, 0.40] |
| 3.1.3 Post‐MDA 1‐3 months | 5 | 2673 | Risk Ratio (M‐H, Fixed, 95% CI) | 0.15 [0.10, 0.24] |
| 3.1.4 Post‐MDA 4‐6 months | 4 | 3299 | Risk Ratio (M‐H, Fixed, 95% CI) | 0.78 [0.63, 0.95] |
| 3.1.5 Post‐MDA 7‐12 months | 5 | 4406 | Risk Ratio (M‐H, Fixed, 95% CI) | 1.12 [0.94, 1.34] |
| 3.1.6 Post‐MDA 13‐18 months | 1 | 243 | Risk Ratio (M‐H, Fixed, 95% CI) | 0.81 [0.44, 1.48] |
| 3.1.7 Post‐MDA 19‐24 months | 1 | 239 | Risk Ratio (M‐H, Fixed, 95% CI) | 0.84 [0.38, 1.83] |
| 3.1.8 Post‐MDA 25‐30 months | 1 | 242 | Risk Ratio (M‐H, Fixed, 95% CI) | 0.89 [0.41, 1.94] |
| 3.1.9 Post‐MDA 31‐36 months | 1 | 246 | Risk Ratio (M‐H, Fixed, 95% CI) | 1.20 [0.44, 3.29] |
| 3.2 Confirmed malaria illness incidence (P vivax) Show forest plot | 2 | Rate Ratio (IV, Fixed, 95% CI) | Subtotals only | |
| Analysis 3.2  Comparison 3: MDA versus no MDA in very low to low endemicity (cRCTs) on P vivax outcomes, Outcome 2: Confirmed malaria illness incidence (P vivax) | ||||
| 3.2.1 Baseline before MDA | 1 | Rate Ratio (IV, Fixed, 95% CI) | 1.74 [0.67, 4.53] | |
| 3.2.2 Post‐MDA 7‐12 months | 2 | Rate Ratio (IV, Fixed, 95% CI) | 1.38 [0.97, 1.95] | |
| Outcome or subgroup title | No. of studies | No. of participants | Statistical method | Effect size |
| 4.1 Plasmodium falciparum parasitaemia prevalence post‐MDA 1‐3 months Show forest plot | 7 | 5718 | Risk Ratio (M‐H, Fixed, 95% CI) | 0.25 [0.15, 0.41] |
| Analysis 4.1  Comparison 4: Supplemental analysis: post‐hoc subgroup analysis by continent, Outcome 1: Plasmodium falciparum parasitaemia prevalence post‐MDA 1‐3 months | ||||
| 4.1.1 Africa | 2 | 1033 | Risk Ratio (M‐H, Fixed, 95% CI) | 0.97 [0.32, 2.98] |
| 4.1.2 Asia | 5 | 4685 | Risk Ratio (M‐H, Fixed, 95% CI) | 0.19 [0.11, 0.33] |
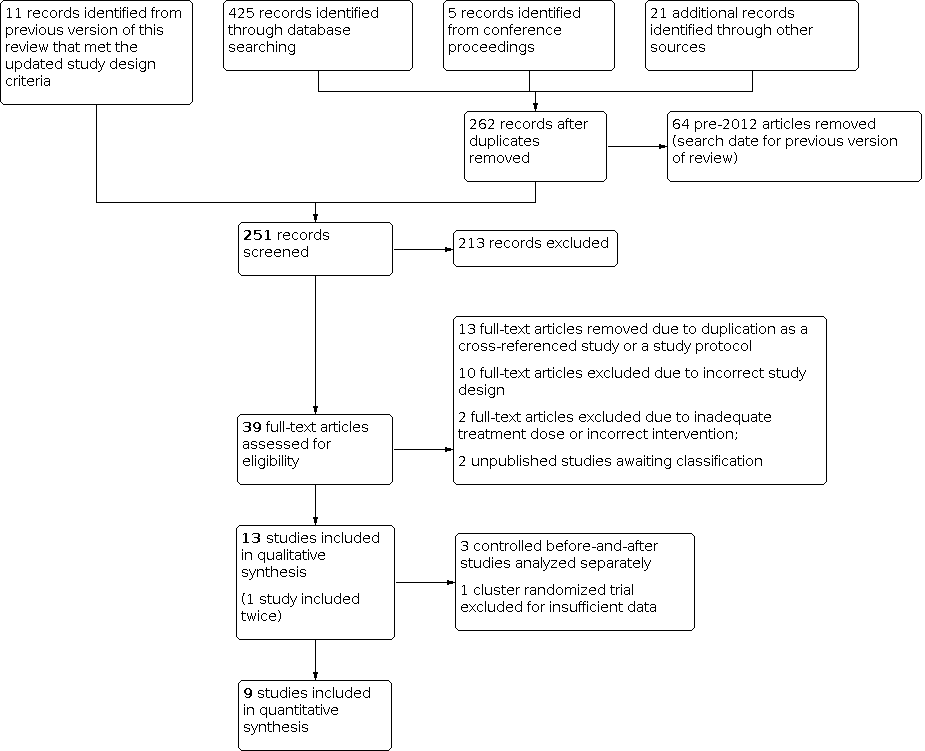
Study flow diagram

Risk of bias summary: review authors' judgements about each risk of bias item for each included study

Risk of bias graph: review authors' judgements about each risk of bias item presented as percentages across all included studies

Comparison 1: MDA versus no MDA in moderate to high endemicity (cRCTs) on P falciparum outcomes, Outcome 1: Parasitaemia prevalence (P falciparum)

Comparison 1: MDA versus no MDA in moderate to high endemicity (cRCTs) on P falciparum outcomes, Outcome 2: Parasitaemia incidence (P falciparum)

Comparison 1: MDA versus no MDA in moderate to high endemicity (cRCTs) on P falciparum outcomes, Outcome 3: Confirmed malaria illness incidence (P falciparum)

Comparison 1: MDA versus no MDA in moderate to high endemicity (cRCTs) on P falciparum outcomes, Outcome 4: Gametocytaemia prevalence (P falciparum)

Comparison 1: MDA versus no MDA in moderate to high endemicity (cRCTs) on P falciparum outcomes, Outcome 5: Malaria‐specific mortality

Comparison 2: MDA versus no MDA in very low to low endemicity (cRCTs) on P falciparum outcomes, Outcome 1: Parasitaemia prevalence (P falciparum)

Comparison 2: MDA versus no MDA in very low to low endemicity (cRCTs) on P falciparum outcomes, Outcome 2: Parasitaemia incidence (P falciparum)

Comparison 2: MDA versus no MDA in very low to low endemicity (cRCTs) on P falciparum outcomes, Outcome 3: Confirmed malaria illness incidence (P falciparum)

Comparison 3: MDA versus no MDA in very low to low endemicity (cRCTs) on P vivax outcomes, Outcome 1: Parasitaemia prevalence (P vivax)

Comparison 3: MDA versus no MDA in very low to low endemicity (cRCTs) on P vivax outcomes, Outcome 2: Confirmed malaria illness incidence (P vivax)

Comparison 4: Supplemental analysis: post‐hoc subgroup analysis by continent, Outcome 1: Plasmodium falciparum parasitaemia prevalence post‐MDA 1‐3 months
| Patient or population: People of all ages living in an area with moderate to high endemicity of P falciparum malaria (≥ 10% prevalence) | ||||||
| Outcomes | Anticipated absolute effects* (95% CI) | Relative effect | № of participants | Certainty of the evidence | Comments | |
|---|---|---|---|---|---|---|
| Risk with no MDA | Risk with MDA | |||||
| Follow‐up: 1 to 3 months | ||||||
| Parasitaemia prevalence | 5 per 100 | 9 per 100 | RR 1.76 | 786 | ⊕⊕⊝⊝ Due to imprecision | At 1‐3 months post‐MDA, parasite prevalence may increase in MDA compared no MDA. However, the effects vary and it is possible that MDA makes little or no difference on parasitaemia prevalence. |
| Parasitaemia incidence | 68 events per 100 person‐years | 42 events per 100 person‐years | Rate ratio 0.61 | 739 | ⊕⊕⊕⊝ Due to imprecision | At 1‐3 months post‐MDA, there is probably a reduction in parasitaemia incidence in MDA compared to no MDA. |
| Confirmed malaria illness incidence | 28 per 1000 population | 11 per 1000 population | Rate ratio 0.41 | 144,422 | ⊕⊕⊝⊝ Due to imprecision | At 1‐3 months post‐MDA, there may be a reduction in confirmed malaria illness incidence in MDA compared to no MDA. |
| Follow‐up: 4 to 6 months | ||||||
| Parasitaemia prevalence | 55 per 100 | 65 per 100 | RR 1.18 | 1414 | ⊕⊕⊕⊝ Due to imprecision | At 4‐6 months post‐MDA, there is probably little or no effect on parasitaemia prevalence in MDA compared to no MDA |
| Parasitaemia incidence | 129 events per 100 person‐years | 118 events per 100 person‐years | Rate ratio 0.91 | 1376 | ⊕⊝⊝⊝ Due to risk of bias and imprecision | We do not know if MDA has an effect on parasitaemia incidence at 4‐6 months post‐MDA |
| *The risk in the intervention group (and its 95% confidence interval) is based on the assumed risk in the comparison group and the relative effect of the intervention (and its 95% CI). | ||||||
| GRADE Working Group grades of evidence | ||||||
| aNot downgraded for inconsistency; the comparison presented is reported from a single study. | ||||||
| Patient or population: People of all ages living in an area with very low to low endemicity of P falciparum malaria (< 10% prevalence) | ||||||
| Outcomes | Anticipated absolute effects* (95% CI) | Relative effect | № of participants | Certainty of the evidence | Comments | |
|---|---|---|---|---|---|---|
| Risk with Control | Risk with MDA | |||||
| Follow‐up: < 1 month | ||||||
| Parasitaemia prevalence | 12 per 100 | 1 per 100 | RR 0.12 | 1232 | ⊕⊕⊝⊝ Due to risk of bias and imprecision | At < 1 month post‐MDA, there may a reduction in parasitaemia prevalence in MDA compared to no MDA. |
| Follow‐up: 1 to 3 months | ||||||
| Parasitaemia prevalence | 3 per 100 | 1 per 100 (0 to 1) | RR: 0.25 (0.15 to 0.41) | 17,454 | ⊕⊕⊝⊝ Due to risk of bias | At 1‐3 months post‐MDA, there may a reduction in parasitaemia prevalence in MDA compared to no MDA. |
| Parasitaemia incidence | 15 events per 100 person‐years | 5 events per 100 person‐years | Rate ratio 0.37 | 736 | ⊕⊕⊕⊝ Due to imprecision | At 1‐3 months post‐MDA, there is probably a reduction in parasitaemia incidence in MDA compared to no MDA. |
| Confirmed malaria illness incidence | 6 per 1000 population | 4 per 1000 population | Rate ratio: 0.58 (0.12 to 2.73) | 130,651 | ⊕⊝⊝⊝ Due to risk of bias and imprecision | We do not know if MDA has an effect on confirmed malaria illness incidence at 1‐3 months post‐MDA compared to no MDA. |
| Follow‐up: 4 to 6 months | ||||||
| Parasitaemia prevalence | 5 per 100 | 3 per 100 (2 to 6) | RR: 0.63 (0.36 to 1.12) | 5670 (4 RCTs) | ⊕⊝⊝⊝ Due to risk of bias and imprecision | We do not know if MDA has an effect on parasitaemia prevalence at 4‐6 months post‐MDA compared to no MDA.
|
| Confirmed malaria illness incidence | 4 per 1000 population | 4 per 1000 population | Rate ratio 0.93 | 23,251 | ⊕⊝⊝⊝ Due to risk of bias and imprecision | We do not know if MDA has an effect on confirmed malaria illness incidence at 4‐6 months post‐MDA compared to no MDA. |
| Follow‐up: 7 to 12 months | ||||||
| Parasitaemia prevalence | 5 per 100 | 4 per 100 (3 to 6) | RR: 0.86 (0.55 to 1.36) | 7760 (5 RCTs) | ⊕⊝⊝⊝ Due to risk of bias and imprecision | We do not know if MDA has an effect on parasitaemia prevalence at 7‐12 months post‐MDA compared to no MDA. |
| Confirmed malaria illness incidence | 11 per 1000 population | 5 per 1000 population (2 to 12) | Rate ratio 0.47 (0.21 to 1.03) | 26,576 | ⊕⊝⊝⊝ Due to risk of bias and imprecision | We do not know if MDA has an effect on confirmed malaria illness incidence at 7‐12 months post‐MDA compared to no MDA. |
| *The risk in the intervention group (and its 95% confidence interval) is based on the assumed risk in the comparison group and the relative effect of the intervention (and its 95% CI). | ||||||
| GRADE Working Group grades of evidence | ||||||
| aDowngraded 1 level for risk of bias due to several criteria scored as high or unclear risk of bias. | ||||||
| Patient or population: People of all ages living in an area with very low to low endemicity of P falciparum malaria ( < 10% prevalence) | ||||||
| Outcomes | Anticipated absolute effects* (95% CI) | Relative effect | № of participants | Certainty of the evidence | Comments | |
|---|---|---|---|---|---|---|
| Risk with Control | Risk with MDA | |||||
| Follow‐up: 13 to 18 months | ||||||
| Parasitaemia prevalence | 4 per 100 | 4 per 100 | RR 0.82 | 1537 | ⊕⊝⊝⊝ Due to risk of bias and imprecision | We do not know if MDA has an effect on parasitaemia prevalence at 13‐18 months post‐MDA compared to no MDA. |
| Confirmed malaria illness incidence | 17 per 1000 population | 13 per 1000 population | Rate ratio 0.77 | 23,251 | ⊕⊝⊝⊝ Due to risk of bias and imprecision | We do not know if MDA has an effect on confirmed malaria illness incidence at 13‐18 months post‐MDA compared to no MDA. |
| Follow‐up: 19 to 24 months | ||||||
| Parasitaemia prevalence | 3 per 100 | 1 per 100 | RR 0.34 | 1393 | ⊕⊝⊝⊝ Due to risk of bias and imprecision | We do not know if MDA has an effect on parasitaemia prevalence at 19‐24 months post‐MDA compared to no MDA. |
| Follow‐up: 25 months and above | ||||||
| Parasitaemia prevalence | 3 per 100 | 3 per 100 | RR 0.89 | 1521 | ⊕⊝⊝⊝ Due to risk of bias and imprecision | We do not know if MDA has an effect on parasitaemia prevalence at 25‐30 months post‐MDA compared to no MDA. |
| Parasitaemia prevalence | 3 per 100 | 4 per 100 | RR 1.25 | 1679 | ⊕⊝⊝⊝ Due to risk of bias and imprecision | We do not know if MDA has an effect on parasitaemia prevalence at 31‐36 months post‐MDA compared to no MDA. |
| *The risk in the intervention group (and its 95% confidence interval) is based on the assumed risk in the comparison group and the relative effect of the intervention (and its 95% CI). | ||||||
| GRADE Working Group grades of evidence | ||||||
| aDowngraded 2 levels for risk of bias due to several criteria scored as high or unclear risk of bias, including baseline imbalance, high risk of contamination, and a large unexplained increase in sampled population in the MDA group at this time point. | ||||||
| Patient or population: People of all ages living in an area with very low to low endemicity of P vivax malaria (< 10% prevalence) | ||||||
| Outcomes | Anticipated absolute effects* (95% CI) | Relative effect | № of participants | Certainty of the evidence | Comments | |
|---|---|---|---|---|---|---|
| Risk with Control | Risk with MDA | |||||
| Follow‐up: < 1 month | ||||||
| Parasitaemia prevalence | 27 per 100 | 5 per 100 | RR 0.18 | 1232 | ⊕⊕⊝⊝ Due to risk of bias and imprecision | At < 1 month post‐MDA, there may a reduction in parasitaemia prevalence in MDA compared to no MDA. |
| Follow‐up: 1 to 3 months | ||||||
| Parasitaemia prevalence | 12 per 100 | 2 per 100 (1 to 3) | RR: 0.15 (0.10 to 0.24) | 6896 (5 RCTs) | ⊕⊕⊝⊝ Due to risk of bias | At 1‐3 months post‐MDA, there may a reduction in parasitaemia prevalence in MDA compared to no MDA. |
| Follow‐up: 4 to 6 months | ||||||
| Parasitaemia prevalence | 11 per 100 | 9 per 100 (7 to 10) | RR: 0.78 (0.63 to 0.95)
| 5670 (4 RCTs) | ⊕⊝⊝⊝ Due to risk of bias and imprecision | We do not know if MDA reduces parasitaemia prevalence at 4‐6 months post‐MDA compared to no MDA. |
| Follow‐up: 7 to 12 months | ||||||
| Parasitaemia prevalence | 9 per 100 | 11 per 100 (9 to 13) | RR: 1.12 (0.94 to 1.34) | 7760 (5 RCTs) | ⊕⊝⊝⊝ Due to risk of bias and imprecision | We do not know if MDA has an effect on parasitaemia prevalence at 7‐12 months post‐MDA compared to no MDA. |
| Confirmed malaria illness incidence | 41 per 1000 population | 57 per 1000 population (40 to 80) | Rate ratio: 1.38 (0.97 to 1.95) | 3325 (2 RCTs) | ⊕⊝⊝⊝ Due to risk of bias and imprecision | We do not know if MDA has an effect on confirmed malaria illness incidence at 7‐12 months post‐MDA compared to no MDA. |
| *The risk in the intervention group (and its 95% confidence interval) is based on the assumed risk in the comparison group and the relative effect of the intervention (and its 95% CI). | ||||||
| GRADE Working Group grades of evidence | ||||||
| aDowngraded 1 level for risk of bias due to several criteria scored as high or unclear risk of bias. | ||||||
| Patient or population: People of all ages living in an area with very low to low endemicity of P vivax malaria (< 10% prevalence) | ||||||
| Outcomes | Anticipated absolute effects* (95% CI) | Relative effect | № of participants | Certainty of the evidence | Comments | |
|---|---|---|---|---|---|---|
| Risk with Control | Risk with MDA | |||||
| Follow‐up: 13 to 18 months | ||||||
| Parasitaemia prevalence | 17 per 100 | 14 per 100 | RR 0.81 | 1537 | ⊕⊝⊝⊝ Due to risk of bias and imprecision | We do not know if MDA reduces parasitaemia prevalence at 13‐18 months post‐MDA compared to no MDA. |
| Follow‐up: 19 to 24 months | ||||||
| Parasitaemia prevalence | 11 per 100 | 9 per 100 | RR 0.84 | 1393 | ⊕⊝⊝⊝ Due to risk of bias and imprecision | We do not know if MDA reduces parasitaemia prevalence at 19‐24 months post‐MDA compared to no MDA. |
| Follow‐up: 25 months and above | ||||||
| Parasitaemia prevalence | 11 per 100 | 9 per 100 | RR 0.89 | 1521 | ⊕⊝⊝⊝ Due to risk of bias and imprecision | We do not know if MDA reduces parasitaemia prevalence at 25‐30 months post‐MDA compared to no MDA. |
| Parasitaemia prevalence | 6 per 100 | 7 per 100 | RR 1.20 | 1679 | ⊕⊝⊝⊝ Due to risk of bias and imprecision | We do not know if MDA reduces parasitaemia prevalence at 31‐36 months post‐MDA compared to no MDA. |
| *The risk in the intervention group (and its 95% confidence interval) is based on the assumed risk in the comparison group and the relative effect of the intervention (and its 95% CI). | ||||||
| GRADE Working Group grades of evidence | ||||||
| aDowngraded 2 levels for risk of bias due to several criteria scored as high or unclear risk of bias, including a large unexplained increase in sampled population in the MDA group at this time point. | ||||||
| Study ID (Design) | Year(s) of study | Malaria endemicitya | Plasmodium species | Antimalarial drug resistance | MDA group | Control group | Co‐intervention(s)b | Outcomes reported (months of follow‐up post‐MDAc) | ||
|---|---|---|---|---|---|---|---|---|---|---|
| Drug | Rounds, interval, and duration implemented | Population targeted (coverage) | ||||||||
| Eisele 2020 ZMBa (cRCT) | 2014‐2017 | Low | P falciparum | Widespread resistance to CQ and SP, but no evidence of resistance to artemisinin | DHAp | 4 rounds administered at start of rainy season, during rainy season, during dry season, and at start of rainy season over 15 months | 37,694 (79% in round 1; 63% in round 2; 76% in round 3; 66% in round 4) | No drug and no placebo | IRS, ITNs, and enhanced standard of care |
|
| Eisele 2020 ZMBb (cRCT) | 2014‐2017 | High | P falciparum | Widespread resistance to CQ and SP, but no evidence of resistance to artemisinin | DHAp | 4 rounds administered at start of rainy season, during rainy season, during dry season, and at start of rainy season over 15 months | 45,442 (79% in round 1; 63% in round 2; 76% in round 3; 66% in round 4) | No drug and no placebo | IRS, ITNs, and enhanced standard of care |
|
| Escudie 1962 BFA (CBA) | 1960‐1961 | High | P falciparum, P ovale, P malariae | ND | AQ‐PQ or CQ‐PQ | (Low frequency MDA) 7 rounds administered 28 days apart over 7 months | 1890 (75% to 91% per round) | No drug and no placebo | None (IRS arms excluded) |
|
| (High frequency MDA) 15 rounds administered 14 days apart over 7 months | 2560 (84% to 97% per round) |
| ||||||||
| Landier 2017 MMRa (cRCT) | 2013‐2015 | Low | P falciparum, P vivax | Artemisinin resistance firmly established | DHAp with PQ | 3 rounds administered 1 month apart over 3 months | 1434 (66% in round 1, 56% in round 2, and 65% in round 3) | Delayed MDA | ITNs, uninterrupted access to case management |
|
| McLean 2021 MMR (cRCT) | 2014‐2017 | Very low | P falciparum, P vivax | Artemisinin resistance: Kelch 13 mutation in 57% of samples at baseline | DHAp with PQ | 3 rounds administered 1 month apart over 3 months | 4622 (86% in round 1, 86% in round 2, 88% in round 3) | No drug and no placebo | ITNs, routine malaria control by village health workers |
|
| Molineaux 1980 NGA (CBA) | 1970‐1975 | High | P falciparum, P malariae, P ovale | ND | SP | (Low frequency MDA) 9 rounds administered 10 weeks apart over 18 months | 14,129 (73% to 92% per round) | No drug and no placebo | IRS |
|
| (High frequency MDA) 23 rounds administered 2 weeks apart during the wet seasons and 10 weeks apart during the dry seasons over 18 months | 1810 (72% to 91% per round) | |||||||||
| Morris 2018 TZA (cRCT) | 2016‐2017 | Very low | P falciparum, P malariae, P ovale, and P vivax | No evidence of resistance to first line treatment AS‐AQ | DHAp with PQ | 2 rounds administered 4 weeks apart over 6 weeks | 10,944 (91% in round 1, 88% in round 2) | No drug and no placebo | IRS and ITNs |
|
| Pongvongsa 2018 LAO (cRCT) | 2016‐2017 | Low | P falciparum, P vivax | ND | DHAp with PQ | 3 rounds administered 1 month apart over 3 months | 1006 (81% in round 1, 80% in round 2, and 82% in round 3) | Delayed MDA | ITNs, uninterrupted access to case management |
|
| Roberts 1964 KEN (CBA) | 1953‐1954 | Moderate | P falciparum | ND | Pyrimethamine | 2 rounds administered 1 year apart over 13 months | 101,000 (95% in round 1, 93% in round 2) | No drug and no placebo | None |
|
| Shekalaghe 2011 TZA (cRCT) | 2008 | Very low | P falciparum | ND | SP+AS with PQ | 1 round over 16 days | 1110 (95%) | Placebo | ITNs, single treatment campaign for trachoma with azithromycin |
|
| Tripura 2018 KHM (cRCT) | 2014‐2016 | Very low | P falciparum, P vivax | Reduced susceptibility to artemisinins and ACT partner drug resistance | DHAp | 3 rounds administered 1 month apart over 3 months | 858 (74% in round 1, 60% in round 2, and 71% in round 3) | Delayed MDA | ITNs, uninterrupted access to case management |
|
| von Seidlein 2003 GMB (cRCT) | 1999 | High | P falciparum | ND | SP+AS | 1 round over 1 month | 12,331 (89%) | Placebo | None |
|
| von Seidlein 2019 VNM (cRCT) | 2013‐2015 | Very low | P falciparum, P vivax | No evidence of resistance to DHAp at the start of study, but treatment failure to DHAp has increased following study | DHAp with PQ | 3 rounds administered 1 month apart over 3 months | 1439 (83% in round 1, 98% in round 2, and 99% in round 3) | Delayed MDA | ITNs, uninterrupted access to case management |
|
| ACT = artemisinin‐based combination therapy, AQ = amodiaquine, AS = artesunate, CBA = controlled before‐and‐after study, CQ = chloroquine, cRCT = cluster‐randomized controlled trial, DHAp = dihydroartemisinin piperaquine, ITNs = insecticide‐treated bed nets, IRS = indoor residual spraying, MDA = mass drug administration, PQ = primaquine, SP = sulfadoxine‐ (or sulfalene‐) pyrimethamine, NA = not applicable, ND = not described. aMalaria endemicity classified as very low (> 0% to < 1%), low (1% to < 10%), moderate (10% to < 35%) or high (≥ 35%) (WHO 2017). | ||||||||||
| Study ID (design) | Parasitaemia prevalence | Parasitaemia incidence | Confirmed malaria illness incidence | All‐cause or malaria‐specific mortality | Gametocytaemia prevalence | Adverse effects |
|---|---|---|---|---|---|---|
| Eisele 2020 ZMBa (cRCT) | Yes | Yes | Yes | No | No | Yes |
| Eisele 2020 ZMBb (cRCT) | Yes | Yes | Yes | No | No | Yes |
| Escudie 1962 BFA (CBA) | Yes | No | No | No | Yes | No |
| Landier 2017 MMRa (cRCT) | Yes | No | Yes | No | No | Yes |
| McLean 2021 MMR (cRCT) | Yes | No | No | No | No | Yes |
| Molineaux 1980 NGA (CBA) | Yes | No | No | No | Yes | No |
| Morris 2018 TZA (cRCT) | Yes | No | Yes | No | No | Yes |
| Pongvongsa 2018 LAO (cRCT) | Yes | No | No | No | No | Yes |
| Roberts 1964 KEN (CBA) | Yes | No | No | No | No | No |
| Shekalaghe 2011 TZA (cRCT) | Yes | No | Yes | No | Yes | Yes |
| Tripura 2018 KHM (cRCT) | Yes | No | Yes | No | No | Yes |
| von Seidlein 2003 GMB (cRCT) | Yes | Yes | Yes | Yes | Yes | Yes |
| von Seidlein 2019 VNM (cRCT) | Yes | No | No | No | No | Yes |
| CBA = controlled before‐and‐after study, cRCT = cluster‐randomized controlled trial | ||||||
| Study | Intervention, % (n) | Control % (n) | Difference‐in‐differences, percentage pointsa | |||||||||||
|---|---|---|---|---|---|---|---|---|---|---|---|---|---|---|
| Pre‐MDA | During MDA | Post‐MDA | Pre‐MDA | During MDA | Post‐MDA | During MDA | Post‐MDA | |||||||
| 1 to 3 months | 4 to 6 months | 7 to 12 months | 1 to 3 months | 4 to 6 months | 7 to 12 months | 1 to 3 months | 4 to 6 months | 7 to 12 months | ||||||
| Low frequency MDA with AQ‐PQ or CQ‐PQ | 67.6 (190) | 21.6 (75) | 38.3 (105) | ND | ND | 59.4 (129) | 74.8 (517) | 386 (72.3) | ND | ND | ‐61.4 | ‐42.1 | ND | ND |
| High frequency MDA with AQ‐PQ or CQ‐PQ | 33.6 (131) | 12.6 (59) | 61.4 (286) | ND | ND | 59.4 (129) | 74.8 (517) | 386 (72.3) | ND | ND | ‐36.3 | 14.9 | ND | ND |
| Low frequency MDA with SP | 41.8 (525) | 1.9 (40) | ND | ND | ND | 49.1 (493) | 32.5 (380) | ND | ND | ND | ‐23.2 | ND | ND | ND |
| High frequency MDA with SP | 44.9 (754) | 7.3 (109) | ND | ND | ND | 49.1 (493) | 32.5 (380) | ND | ND | ND | ‐20.9 | ND | ND | ND |
| MDA with pyrimethamine | 8.3 (25) | 9 (188) | 2.9 (26) | (27) (4.5) | (15) (5) | 18 (154) | 34.4 (723) | 40.7 (366) | 37 (222) | 26 (78) | ‐15.8 | ‐28.1 | ‐22.8 | ‐11.3 |
| AQ = amodiaquine, CQ = chloroquine, MDA = mass drug administration, ND = no data, PQ = primaquine, SP = sulfalene‐pyrimethamine aCalculated as difference in proportion at the time period of during MDA or post‐MDA minus the proportion at pre‐MDA in the intervention and control separately and the difference in these two proportion differences between the intervention and control groups. | ||||||||||||||
| Study | Intervention, % (n) | Control, % (n) | Difference‐in‐differences percentage pointa | |||||
|---|---|---|---|---|---|---|---|---|
| Pre‐MDA | During MDA | Post‐MDA 1 to 3 months | Pre‐MDA | During MDA | Post‐MDA 1 to 3 months | During MDA | Post‐MDA 1 to 3 months | |
| Low frequency MDA with AQ‐PQ or CQ‐PQ | 20.3 (57) | 0.9 (3) | 38.3 (35) | 19.4 (42) | 14 (97) | 19.1 (102) | ‐14.1 | 18.3 |
| High frequency MDA with AQ‐PQ or CQ‐PQ | 8.2 (32) | 1.9 (9) | 61.4 (107) | 19.4 (42) | 14 (97) | 19.1 (102) | ‐1.0 | 53.4 |
| Low frequency MDA with SP | 10.1 (127) | 0.6 (12) | ND | 12.4 (124) | 7.9 (92) | ND | ‐5.0 | ND |
| High frequency MDA with SP | 12.4 (208) | 3.2 (48) | ND | 12.4 (124) | 7.9 (92) | ND | ‐4.7 | ND |
| AQ = amodiaquine, CQ = chloroquine, MDA = mass drug administration, ND = no data, SP = sulfalene‐pyrimethamine aCalculated as difference in proportion at the time period of during MDA or post‐MDA minus the proportion at pre‐MDA in the intervention and control separately and the difference in these two proportion differences between the intervention and control groups. | ||||||||
| Outcome or subgroup title | No. of studies | No. of participants | Statistical method | Effect size |
| 1.1 Parasitaemia prevalence (P falciparum) Show forest plot | 2 | Risk Ratio (M‐H, Fixed, 95% CI) | Totals not selected | |
| 1.1.1 Baseline before MDA | 2 | Risk Ratio (M‐H, Fixed, 95% CI) | Totals not selected | |
| 1.1.2 During MDA | 1 | Risk Ratio (M‐H, Fixed, 95% CI) | Totals not selected | |
| 1.1.3 Post‐MDA 1‐3 months | 1 | Risk Ratio (M‐H, Fixed, 95% CI) | Totals not selected | |
| 1.1.4 Post‐MDA 4‐6 months | 1 | Risk Ratio (M‐H, Fixed, 95% CI) | Totals not selected | |
| 1.2 Parasitaemia incidence (P falciparum) Show forest plot | 2 | Rate Ratio (IV, Fixed, 95% CI) | Totals not selected | |
| 1.2.1 Post‐MDA 1‐3 months | 1 | Rate Ratio (IV, Fixed, 95% CI) | Totals not selected | |
| 1.2.2 Post‐MDA 4‐6 months | 1 | Rate Ratio (IV, Fixed, 95% CI) | Totals not selected | |
| 1.3 Confirmed malaria illness incidence (P falciparum) Show forest plot | 1 | Rate Ratio (IV, Fixed, 95% CI) | Totals not selected | |
| 1.3.1 Baseline before MDA | 1 | Rate Ratio (IV, Fixed, 95% CI) | Totals not selected | |
| 1.3.2 Post‐MDA 1‐3 months | 1 | Rate Ratio (IV, Fixed, 95% CI) | Totals not selected | |
| 1.4 Gametocytaemia prevalence (P falciparum) Show forest plot | 1 | Risk Ratio (M‐H, Fixed, 95% CI) | Totals not selected | |
| 1.4.1 Baseline before MDA | 1 | Risk Ratio (M‐H, Fixed, 95% CI) | Totals not selected | |
| 1.4.2 Post‐MDA 4‐6 months | 1 | Risk Ratio (M‐H, Fixed, 95% CI) | Totals not selected | |
| 1.5 Malaria‐specific mortality Show forest plot | 1 | Risk Ratio (IV, Fixed, 95% CI) | Totals not selected | |
| 1.5.1 Post‐MDA 4‐6 months | 1 | Risk Ratio (IV, Fixed, 95% CI) | Totals not selected | |
| Outcome or subgroup title | No. of studies | No. of participants | Statistical method | Effect size |
| 2.1 Parasitaemia prevalence (P falciparum) Show forest plot | 7 | Risk Ratio (M‐H, Fixed, 95% CI) | Subtotals only | |
| 2.1.1 Baseline before MDA | 6 | 2093 | Risk Ratio (M‐H, Fixed, 95% CI) | 0.89 [0.62, 1.26] |
| 2.1.2 During‐MDA | 2 | 991 | Risk Ratio (M‐H, Fixed, 95% CI) | 0.26 [0.07, 0.94] |
| 2.1.3 Post‐MDA <1 month | 1 | 234 | Risk Ratio (M‐H, Fixed, 95% CI) | 0.12 [0.03, 0.52] |
| 2.1.4 Post‐MDA 1‐3 months | 7 | 5718 | Risk Ratio (M‐H, Fixed, 95% CI) | 0.25 [0.15, 0.41] |
| 2.1.5 Post‐MDA 4‐6 months | 4 | 3129 | Risk Ratio (M‐H, Fixed, 95% CI) | 0.63 [0.36, 1.12] |
| 2.1.6 Post‐MDA 7‐12 months | 5 | 3704 | Risk Ratio (M‐H, Fixed, 95% CI) | 0.86 [0.55, 1.36] |
| 2.1.7 Post‐MDA 13‐18 months | 1 | 243 | Risk Ratio (M‐H, Fixed, 95% CI) | 0.82 [0.20, 3.34] |
| 2.1.8 Post‐MDA 19‐24 months | 1 | 239 | Risk Ratio (M‐H, Fixed, 95% CI) | 0.34 [0.06, 1.97] |
| 2.1.9 Post‐MDA 25‐30 months | 1 | 242 | Risk Ratio (M‐H, Fixed, 95% CI) | 0.89 [0.22, 3.62] |
| 2.1.10 Post‐MDA 31‐36 months | 1 | 246 | Risk Ratio (M‐H, Fixed, 95% CI) | 1.25 [0.25, 6.31] |
| 2.2 Parasitaemia incidence (P falciparum) Show forest plot | 1 | Rate Ratio (IV, Fixed, 95% CI) | Totals not selected | |
| 2.2.1 Post‐MDA 1‐3 months | 1 | Rate Ratio (IV, Fixed, 95% CI) | Totals not selected | |
| 2.3 Confirmed malaria illness incidence (P falciparum) Show forest plot | 4 | Rate Ratio (IV, Fixed, 95% CI) | Subtotals only | |
| 2.3.1 Baseline before MDA | 3 | Rate Ratio (IV, Fixed, 95% CI) | 0.87 [0.45, 1.69] | |
| 2.3.2 Post‐MDA 1‐3 months | 2 | Rate Ratio (IV, Fixed, 95% CI) | 0.58 [0.12, 2.73] | |
| 2.3.3 Post‐MDA 4‐6 months | 1 | Rate Ratio (IV, Fixed, 95% CI) | 0.93 [0.07, 12.43] | |
| 2.3.4 Post‐MDA 7‐12 months | 3 | Rate Ratio (IV, Fixed, 95% CI) | 0.47 [0.21, 1.03] | |
| 2.3.5 Post‐MDA 13‐18 months | 1 | Rate Ratio (IV, Fixed, 95% CI) | 0.77 [0.20, 3.03] | |
| Outcome or subgroup title | No. of studies | No. of participants | Statistical method | Effect size |
| 3.1 Parasitaemia prevalence (P vivax) Show forest plot | 5 | Risk Ratio (M‐H, Fixed, 95% CI) | Subtotals only | |
| 3.1.1 Baseline before MDA | 5 | 3187 | Risk Ratio (M‐H, Fixed, 95% CI) | 1.02 [0.86, 1.21] |
| 3.1.2 Post‐MDA <1 month | 1 | 234 | Risk Ratio (M‐H, Fixed, 95% CI) | 0.18 [0.08, 0.40] |
| 3.1.3 Post‐MDA 1‐3 months | 5 | 2673 | Risk Ratio (M‐H, Fixed, 95% CI) | 0.15 [0.10, 0.24] |
| 3.1.4 Post‐MDA 4‐6 months | 4 | 3299 | Risk Ratio (M‐H, Fixed, 95% CI) | 0.78 [0.63, 0.95] |
| 3.1.5 Post‐MDA 7‐12 months | 5 | 4406 | Risk Ratio (M‐H, Fixed, 95% CI) | 1.12 [0.94, 1.34] |
| 3.1.6 Post‐MDA 13‐18 months | 1 | 243 | Risk Ratio (M‐H, Fixed, 95% CI) | 0.81 [0.44, 1.48] |
| 3.1.7 Post‐MDA 19‐24 months | 1 | 239 | Risk Ratio (M‐H, Fixed, 95% CI) | 0.84 [0.38, 1.83] |
| 3.1.8 Post‐MDA 25‐30 months | 1 | 242 | Risk Ratio (M‐H, Fixed, 95% CI) | 0.89 [0.41, 1.94] |
| 3.1.9 Post‐MDA 31‐36 months | 1 | 246 | Risk Ratio (M‐H, Fixed, 95% CI) | 1.20 [0.44, 3.29] |
| 3.2 Confirmed malaria illness incidence (P vivax) Show forest plot | 2 | Rate Ratio (IV, Fixed, 95% CI) | Subtotals only | |
| 3.2.1 Baseline before MDA | 1 | Rate Ratio (IV, Fixed, 95% CI) | 1.74 [0.67, 4.53] | |
| 3.2.2 Post‐MDA 7‐12 months | 2 | Rate Ratio (IV, Fixed, 95% CI) | 1.38 [0.97, 1.95] | |
| Outcome or subgroup title | No. of studies | No. of participants | Statistical method | Effect size |
| 4.1 Plasmodium falciparum parasitaemia prevalence post‐MDA 1‐3 months Show forest plot | 7 | 5718 | Risk Ratio (M‐H, Fixed, 95% CI) | 0.25 [0.15, 0.41] |
| 4.1.1 Africa | 2 | 1033 | Risk Ratio (M‐H, Fixed, 95% CI) | 0.97 [0.32, 2.98] |
| 4.1.2 Asia | 5 | 4685 | Risk Ratio (M‐H, Fixed, 95% CI) | 0.19 [0.11, 0.33] |