| Biologics for any condition except HIV/AIDS: standard drug dose* and control event rate |
| Intervention | Comparison intervention | Illustrative comparative risks | Relative effect (95% CI) | Number of participants (studies) | Quality of the evidence (GRADE) | NNTH (95% CI) |
| Assumed risk with comparator | Corresponding risk with intervention (95% CI) |
| Control | Biologic |
| Serious adverse events |
| Abatacept | control | 118 per 1000 | 116 per 1000 ( 76 to 144) | OR 0.89 (0.61 to 1.26) | 2052 (5 studies) | ⊕⊕⊕⊕ high | Not statistically significant |
| Adalimumab | control | 118 per 1000 | 114 per 1000 ( 90 to 145) | OR 0.96 (0.74 to 1.27) | 4662 (15 studies) | ⊕⊕⊕⊝ moderate1 | Not statistically significant |
| Anakinra | control | 118 per 1000 | 122 per 1000 (82 to 180) | OR 1.04 (0.67 to 1.64) | 1900 (3 studies) | ⊕⊕⊕⊕ high | Not statistically significant |
| Certolizumab pegol | control | 118 per 1000 | 174 per 1000 (124 to 237) | OR 1.57 (1.06 to 2.32) | 2421 (6 studies) | ⊕⊕⊕⊝ moderate1 | 18 (9 to 162) |
| Etanercept | control | 118 per 1000 | 142 per 1000 (111 to 184) | OR 1.24 (0.93 to 1.69) | 3931 (21 studies) | ⊕⊕⊕⊝ moderate1 | Not statistically significant |
| Golimumab | control | 118 per 1000 | 123 per 1000 (82 to 184) | OR 1.05 (0.67 to 1.69) | 1564 (8 studies) | ⊕⊕⊕⊝ moderate1 | Not statistically significant |
| Infliximab | control | 118 per 1000 | 133 per 1000 (102 to 174) | OR 1.15 (0.85 to 1.57) | 3403 (14 studies) | ⊕⊕⊕⊝ moderate1 | Not statistically significant |
| Rituximab | control | 118 per 1000 | 186 per 1000 (85 to 375) | OR 1.71 (0.69 to 4.49) | 377 (2 studies) | ⊕⊕⊕⊝ moderate1 | Not statistically significant |
| Tocilizumab | control | 118 per 1000 | 93 per 1000 (52 to 163) | OR 0.77 (0.41 to 1.45) | 842 (3 studies) | ⊕⊕⊕⊝ moderate1 | Not statistically significant |
| All nine biologics | control | 118 per 1000 | 127 per 1000 (115 to 142) | OR 1.09 (0.97 to 1.24) | 21,152 (76 studies) | ⊕⊕⊕⊝ moderate1 | Not statistically significant |
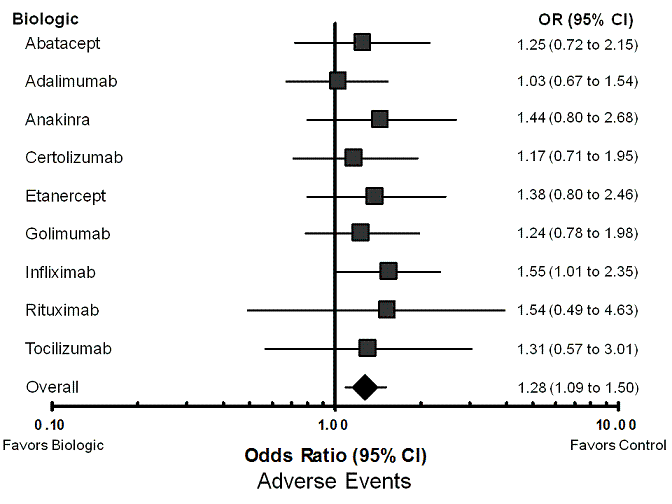
| Total adverse events |
| Abatacept | control | 724 per 1000 | 766 per 1000 (654 to 849) | OR 1.25 (0.72 to 2.15) | 1818 (4 studies) | ⊕⊕⊕⊕ high | Not statistically significant |
| Adalimumab | control | 724 per 1000 | 730 per 1000 (637 to 802) | OR 1.03 (0.67 to 1.54) | 3266 (10 studies) | ⊕⊕⊕⊕ high | Not statistically significant |
| Anakinra | control | 724 per 1000 | 791 per 1000 (677 to 876) | OR 1.44 (0.80 to 2.68) | 2033 (4 studies) | ⊕⊕⊕⊕ high | Not statistically significant |
| Certolizumab pegol | control | 724 per 1000 | 754 per 1000 (651 to 837) | OR 1.17 (0.71 to 1.95) | 1829 (5 studies) | ⊕⊕⊕⊕ high | Not statistically significant |
| Etanercept | control | 724 per 1000 | 784 per 1000 (677 to 866) | OR 1.38 (0.80 to 2.46) | 1600 (7 studies) | ⊕⊕⊕⊕ high | Not statistically significant |
| Golimumab | control | 724 per 1000 | 765 per 1000 (672 to 839) | OR 1.24 (0.78 to 1.98) | 1187 (6 studies) | ⊕⊕⊕⊕ high | Not statistically significant |
| Infliximab | control | 724 per 1000 | 803 per 1000 (726 to 860) | OR 1.55 (1.01 to 2.35) | 2330 (9 studies) | ⊕⊕⊕⊕ high | 13 (8 to 505) |
| Rituximab | control | 724 per 1000 | 802 per 1000 (562 to 924) | OR 1.54 (0.49 to 4.63) | 377 (2 studies) | ⊕⊕⊕⊝ moderate1 | Not statistically significant |
| Tocilizumab | control | 724 per 1000 | 775 per 1000 (599 to 888) | OR 1.31 (0.57 to 3.01) | 519 (2 studies) | ⊕⊕⊕⊕ high | Not statistically significant |
| All nine biologics | control | 724 per 1000 | 770 per 1000 (741 to 797) | OR 1.28 (1.09 to 1.50) | 14,959 (48 studies) | ⊕⊕⊕⊕ high | 22 (14 to 60) |
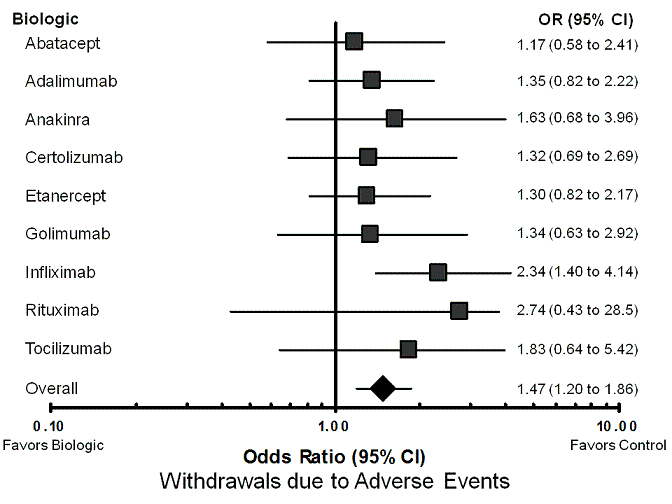
| Withdrawals due to adverse events |
| Abatacept | control | 98 per 1000 | 113 per 1000 (59 to 208) | OR 1.17 (0.58 to 2.41) | 2054 (5 studies) | ⊕⊕⊕⊝ moderate1 | Not statistically significant |
| Adalimumab | control | 98 per 1000 | 128 per 1000 (81 to 194) | OR 1.35 (0.82 to 2.22) | 5268 (18 studies) | ⊕⊕⊕⊝ moderate1 | Not statistically significant |
| Anakinra | control | 98 per 1000 | 150 per 1000 (69 to 301) | OR 1.63 (0.68 to 3.96) | 1963 (3 studies) | ⊕⊕⊕⊝ moderate1 | Not statistically significant |
| Certolizumab pegol | control | 98 per 1000 | 125 per 1000 (70 to 226) | OR 1.32 (0.69 to 2.69) | 2421 (6 studies) | ⊕⊕⊕⊝ moderate1 | Not statistically significant |
| Etanercept | control | 98 per 1000 | 124 per 1000 (82 to 191) | OR 1.30 (0.82 to 2.17) | 5189 (25 studies) | ⊕⊕⊕⊝ moderate1 | Not statistically significant |
| Golimumab | control | 98 per 1000 | 127 per 1000 (64 to 241) | OR 1.34 (0.63 to 2.92) | 1549 (7 studies) | ⊕⊕⊕⊝ moderate1 | Not statistically significant |
| Infliximab | control | 98 per 1000 | 203 per 1000 (132 to 310) | OR 2.34 (1.40 to 4.14) | 2973 (15 studies) | ⊕⊕⊕⊝ moderate1 | 10 (5 to 30) |
| Rituximab | control | 98 per 1000 | 229 per 1000 (45 to 756) | OR 2.74 (0.43 to 28.48) | 377 (2 studies) | ⊕⊕⊝⊝
low1,3 | Not statistically significant |
| Tocilizumab | control | 98 per 1000 | 166 per 1000 (65 to 371) | OR 1.83 (0.64 to 5.42) | 842 (3 studies) | ⊕⊕⊕⊝ moderate1 | Not statistically significant |
| All nine biologics | control | 98 per 1000 | 137 per 1000 (115 to 168) | OR 1.47 (1.20 to 1.86) | 22,636 (83 studies) | ⊕⊕⊕⊝ moderate1 | 26 (15 to 58) |
| Serious infection |
| Abatacept | control | 26 per 1000 | 25 per 1000 (11 to 58) | OR 0.97 (0.40 to 2.31) | 2052 (5 studies) | ⊕⊕⊕⊕ high | Not statistically significant |
| Adalimumab | control | 26 per 1000 | 32 per 1000 (17 to 60) | OR 1.23 (0.65 to 2.40) | 4847 (15 studies) | ⊕⊕⊕⊝ moderate1 | Not statistically significant |
| Anakinra | control | 26 per 1000 | 98 per 1000 (32 to 310) | OR 4.05 (1.22 to 16.84) | 3436 (4 studies) | ⊕⊕⊕⊝ moderate1 | 14 (4 to 181) |
| Certolizumab pegol | control | 26 per 1000 | 113 per 1000 (39 to 330) | OR 4.75 (1.52 to 18.45) | 1683 (4 studies) | ⊕⊕⊕⊕ high | 12 (4 to 79) |
| Etanercept | control | 26 per 1000 | 33 per 1000 (19 to 61) | OR 1.29 (0.72 to 2.45) | 4630 (19 studies) | ⊕⊕⊕⊝ moderate1 | Not statistically significant |
| Golimumab | control | 26 per 1000 | 29 per 1000 (12 to 65) | OR 1.11 (0.45 to 2.59) | 1334 (6 studies) | ⊕⊕⊕⊝ moderate1 | Not statistically significant |
| Infliximab | control | 26 per 1000 | 36 per 1000 (20 to 65) | OR 1.41 (0.75 to 2.62) | 2652 (13 studies) | ⊕⊕⊕⊝ moderate1 | Not statistically significant |
| Rituximab | control | 26 per 1000 | 7 per 1000 (1 to 55) | OR 0.26 (0.03 to 2.16) | 377 (2 studies) | ⊕⊕⊝⊝
low1,2 | Not statistically significant |
| Tocilizumab | control | 26 per 1000 | 22 per 1000 (5 to 87) | OR 0.84 (0.20 to 3.56) | 842 (3 studies) | ⊕⊕⊕⊝ moderate1 | Not statistically significant |
| All nine biologics | control | 26 per 1000 | 35 per 1000 (27 to 46) | OR 1.37 (1.04 to 1.82) | 21,853 (70 studies) | ⊕⊕⊕⊝ moderate1 | 108 (50 to 989) |
| Tuberculosis reactivation |
| All nine biologics | control | 4 per 10,000 | 20 per 10,000 | OR 4.68 (1.18 to 18.60) | 30,671 (71 studies) | ⊕⊕⊝⊝
low4 | 681 (143 to 14706) |
| Lymphoma |
| All nine biologics | control | 9 per 10000 | 1 per 1000 | OR 0.53 (0.17 to 1.66) | 21,260 (52 studies) | ⊕⊕⊝⊝
low4 | Not statistically significant |
| Congestive heart failure |
| All nine biologics | control | 8 per 1000 | 6 per 1000 (1 to 21) | OR 0.69 (0.18 to 2.69) | 8847 (24 studies) | ⊕⊕⊝⊝
low4 | Not statistically significant |