| 1 Participant‐ or parent‐reported specific symptoms of eczema ‐ SCORAD part C by route of immunotherapy Show forest plot | 2 | | Mean Difference (IV, Random, 95% CI) | Totals not selected |
|
| 1.1 Subcutaneous immunotherapy | 1 | | Mean Difference (IV, Random, 95% CI) | 0.0 [0.0, 0.0] |
| 1.2 Sublingual immunotherapy | 1 | | Mean Difference (IV, Random, 95% CI) | 0.0 [0.0, 0.0] |
| 2 Participant‐ or parent‐reported specific symptoms of eczema ‐ severity of sleep disturbance by route of immunotherapy Show forest plot | 2 | | Mean Difference (IV, Random, 95% CI) | Totals not selected |
|
| 2.1 Subcutaneous immunotherapy | 1 | | Mean Difference (IV, Random, 95% CI) | 0.0 [0.0, 0.0] |
| 2.2 Sublingual immunotherapy | 1 | | Mean Difference (IV, Random, 95% CI) | 0.0 [0.0, 0.0] |
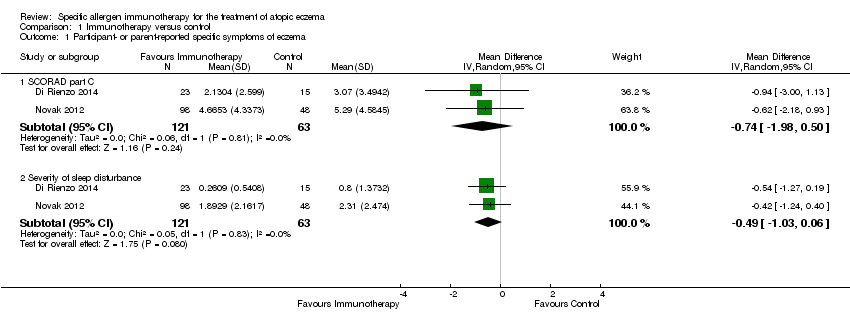
| 3 Participant‐ or parent‐reported specific symptoms of eczema ‐ SCORAD part C by allergen type Show forest plot | 2 | | Mean Difference (IV, Random, 95% CI) | Subtotals only |
|
| 3.1 Perennial inhalant | 2 | 184 | Mean Difference (IV, Random, 95% CI) | ‐0.74 [‐1.98, 0.50] |
| 4 Participant‐ or parent‐reported specific symptoms of eczema ‐ severity of sleep disturbance by allergen type Show forest plot | 2 | | Mean Difference (IV, Random, 95% CI) | Subtotals only |
|
| 4.1 Perennial inhalant | 2 | 184 | Mean Difference (IV, Random, 95% CI) | ‐0.49 [‐1.03, 0.06] |
| 5 Participant‐ or parent‐reported specific symptoms of eczema ‐ SCORAD part C by participant age Show forest plot | 1 | | Mean Difference (IV, Random, 95% CI) | Totals not selected |
|
| 5.1 18 years or over | 1 | | Mean Difference (IV, Random, 95% CI) | 0.0 [0.0, 0.0] |
| 6 Participant‐ or parent‐reported specific symptoms of eczema ‐ itch severity by participant age Show forest plot | 1 | | Mean Difference (IV, Random, 95% CI) | Totals not selected |
|
| 6.1 18 years or over | 1 | | Mean Difference (IV, Random, 95% CI) | 0.0 [0.0, 0.0] |
| 7 Participant‐ or parent‐reported specific symptoms of eczema ‐ severity of sleep disturbance by participant age Show forest plot | 1 | | Mean Difference (IV, Random, 95% CI) | Totals not selected |
|
| 7.1 18 years or over | 1 | | Mean Difference (IV, Random, 95% CI) | 0.0 [0.0, 0.0] |
| 8 Participant‐ or parent‐reported specific symptoms of eczema ‐ itch severity by severity at randomisation Show forest plot | 1 | | Mean Difference (IV, Fixed, 95% CI) | Totals not selected |
|
| 8.1 Moderate (SCORAD mean objective score 16 to 40) | 1 | | Mean Difference (IV, Fixed, 95% CI) | 0.0 [0.0, 0.0] |
| 8.2 Severe (SCORAD mean objective score > 40) | 1 | | Mean Difference (IV, Fixed, 95% CI) | 0.0 [0.0, 0.0] |
| 9 Participant‐ or parent‐reported specific symptoms of eczema ‐ severity of sleep disturbance by severity at randomisation Show forest plot | 1 | | Mean Difference (IV, Fixed, 95% CI) | Totals not selected |
|
| 9.1 Moderate (SCORAD mean objective score 16 to 40) | 1 | | Mean Difference (IV, Fixed, 95% CI) | 0.0 [0.0, 0.0] |
| 9.2 Severe (SCORAD mean objective score > 40) | 1 | | Mean Difference (IV, Fixed, 95% CI) | 0.0 [0.0, 0.0] |
| 10 Adverse events: any local reaction by route of immunotherapy Show forest plot | 7 | | Risk Ratio (M‐H, Random, 95% CI) | Subtotals only |
|
| 10.1 Subcutaneous | 5 | 320 | Risk Ratio (M‐H, Random, 95% CI) | 1.18 [0.90, 1.55] |
| 10.2 Sublingual | 2 | 164 | Risk Ratio (M‐H, Random, 95% CI) | 9.76 [1.28, 74.26] |
| 11 Adverse events: any systemic reaction by route of immunotherapy Show forest plot | 7 | | Risk Ratio (M‐H, Random, 95% CI) | Subtotals only |
|
| 11.1 Subcutaneous | 5 | 328 | Risk Ratio (M‐H, Random, 95% CI) | 0.82 [0.34, 2.00] |
| 11.2 Sublingual | 2 | 164 | Risk Ratio (M‐H, Random, 95% CI) | 0.74 [0.29, 1.89] |
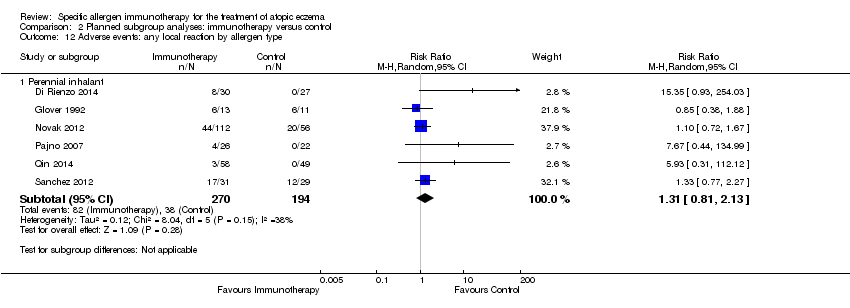
| 12 Adverse events: any local reaction by allergen type Show forest plot | 6 | | Risk Ratio (M‐H, Random, 95% CI) | Subtotals only |
|
| 12.1 Perennial inhalant | 6 | 464 | Risk Ratio (M‐H, Random, 95% CI) | 1.31 [0.81, 2.13] |
| 13 Adverse events: any systemic reaction by allergen type Show forest plot | 6 | | Risk Ratio (M‐H, Random, 95% CI) | Subtotals only |
|
| 13.1 Perennial inhalant | 6 | 472 | Risk Ratio (M‐H, Random, 95% CI) | 0.78 [0.41, 1.49] |
| 14 Adverse events: any local reaction by participant age Show forest plot | 2 | | Risk Ratio (M‐H, Random, 95% CI) | Subtotals only |
|
| 14.1 18 years or over | 2 | 275 | Risk Ratio (M‐H, Random, 95% CI) | 1.37 [0.44, 4.23] |
| 15 Adverse events: any systemic reaction by participant age Show forest plot | 2 | | Risk Ratio (M‐H, Random, 95% CI) | Subtotals only |
|
| 15.1 18 years or over | 2 | 275 | Risk Ratio (M‐H, Random, 95% CI) | 0.74 [0.38, 1.47] |