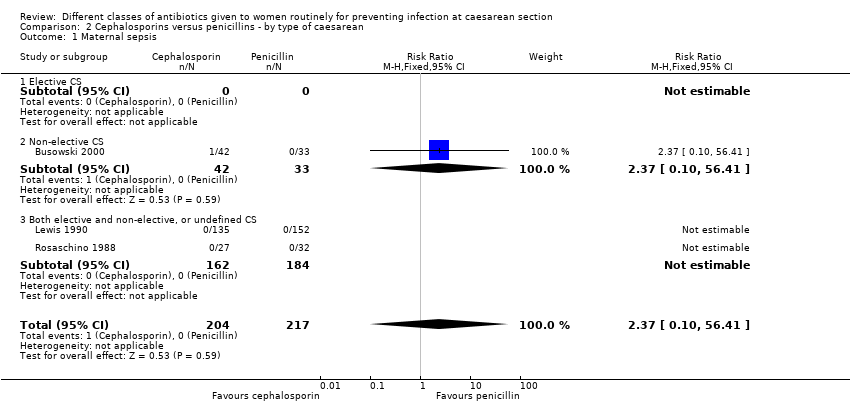
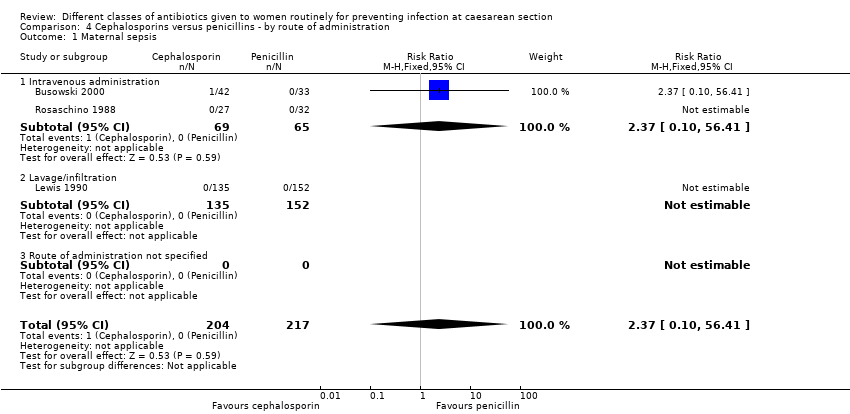
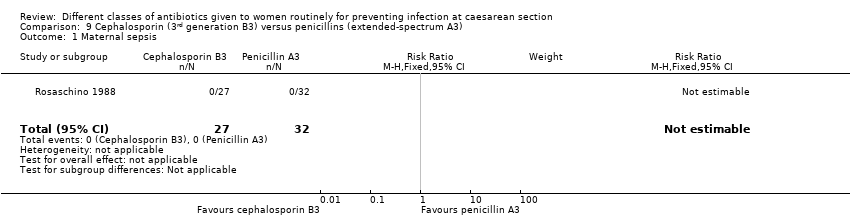
| 1 Maternal sepsis Show forest plot | 3 | 421 | Risk Ratio (M‐H, Fixed, 95% CI) | 2.37 [0.10, 56.41] |
|
| 1.1 Single cephalosporin vs single penicillin | 2 | 346 | Risk Ratio (M‐H, Fixed, 95% CI) | 0.0 [0.0, 0.0] |
| 1.2 Single cephalosporin vs penicillin drug combination | 1 | 75 | Risk Ratio (M‐H, Fixed, 95% CI) | 2.37 [0.10, 56.41] |
| 1.3 Cephalosporin drug combination vs single penicillin | 0 | 0 | Risk Ratio (M‐H, Fixed, 95% CI) | 0.0 [0.0, 0.0] |
| 1.4 Cephalosporin drug combination vs penicillin drug combination | 0 | 0 | Risk Ratio (M‐H, Fixed, 95% CI) | 0.0 [0.0, 0.0] |
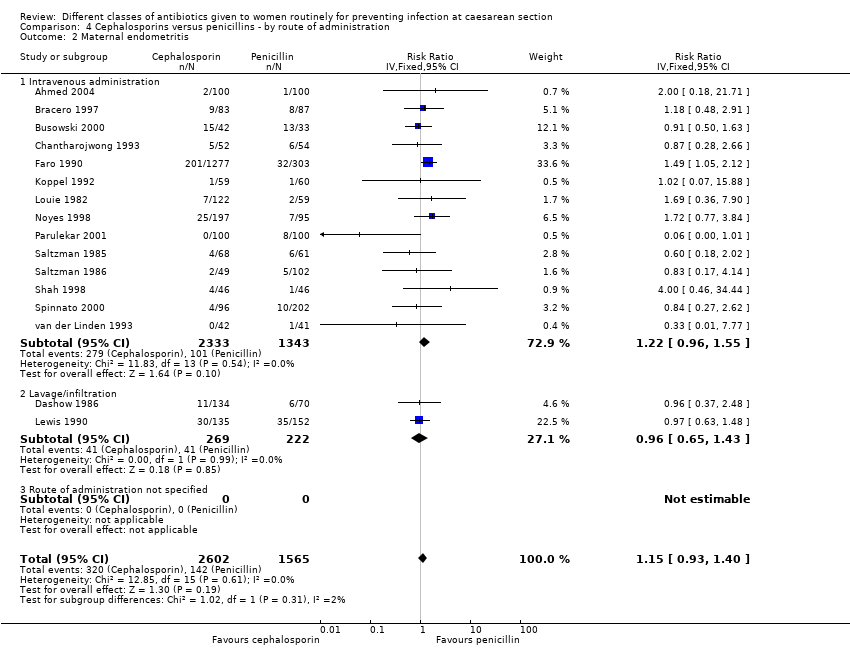
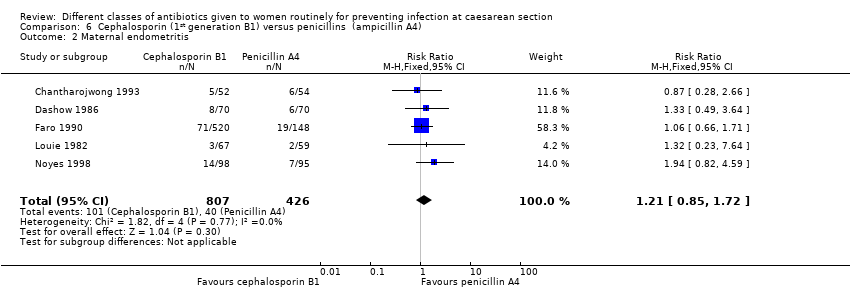
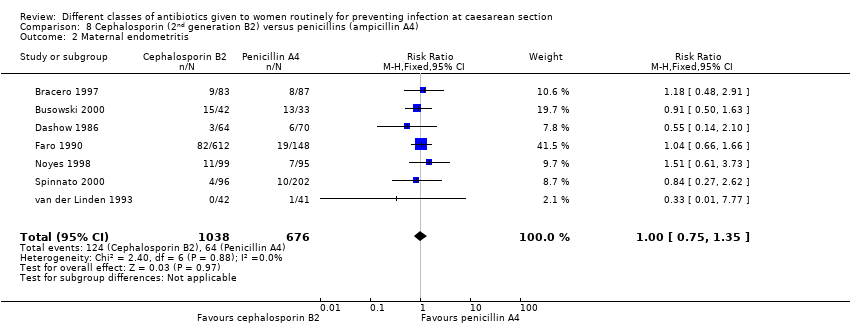
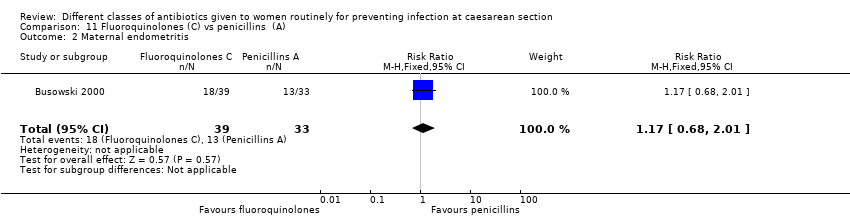
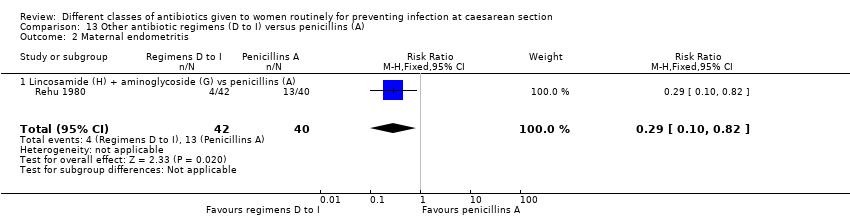
| 2 Maternal endometritis Show forest plot | 16 | 4263 | Risk Ratio (M‐H, Fixed, 95% CI) | 1.13 [0.93, 1.38] |
|
| 2.1 Single cephalosporin vs single penicillin | 8 | 2998 | Risk Ratio (M‐H, Fixed, 95% CI) | 1.25 [0.99, 1.57] |
| 2.2 Single cephalosporin vs penicillin drug combination | 7 | 1090 | Risk Ratio (M‐H, Fixed, 95% CI) | 0.78 [0.52, 1.18] |
| 2.3 Cephalosporin drug combination vs single penicillin | 1 | 92 | Risk Ratio (M‐H, Fixed, 95% CI) | 4.0 [0.46, 34.44] |
| 2.4 Cephalosporin drug combination vs penicillin drug combination | 1 | 83 | Risk Ratio (M‐H, Fixed, 95% CI) | 0.33 [0.01, 7.77] |
| 3 Infant sepsis | 0 | 0 | Risk Ratio (M‐H, Fixed, 95% CI) | 0.0 [0.0, 0.0] |
| 3.1 Single cephalosporin vs single penicillin | 0 | 0 | Risk Ratio (M‐H, Fixed, 95% CI) | 0.0 [0.0, 0.0] |
| 3.2 Single cephalosporin vs penicillin drug combination | 0 | 0 | Risk Ratio (M‐H, Fixed, 95% CI) | 0.0 [0.0, 0.0] |
| 3.3 Cephalosporin drug combination vs single penicillin | 0 | 0 | Risk Ratio (M‐H, Fixed, 95% CI) | 0.0 [0.0, 0.0] |
| 3.4 Cephalosporin drug combination vs penicillin drug combination | 0 | 0 | Risk Ratio (M‐H, Fixed, 95% CI) | 0.0 [0.0, 0.0] |
| 4 Infant oral thrush | 0 | 0 | Risk Ratio (M‐H, Fixed, 95% CI) | 0.0 [0.0, 0.0] |
| 4.1 Single cephalosporin vs single penicillin | 0 | 0 | Risk Ratio (M‐H, Fixed, 95% CI) | 0.0 [0.0, 0.0] |
| 4.2 Single cephalosporin vs penicillin drug combination | 0 | 0 | Risk Ratio (M‐H, Fixed, 95% CI) | 0.0 [0.0, 0.0] |
| 4.3 Cephalosporin drug combination vs single penicillin | 0 | 0 | Risk Ratio (M‐H, Fixed, 95% CI) | 0.0 [0.0, 0.0] |
| 4.4 Cephalosporin drug combination vs penicillin drug combination | 0 | 0 | Risk Ratio (M‐H, Fixed, 95% CI) | 0.0 [0.0, 0.0] |
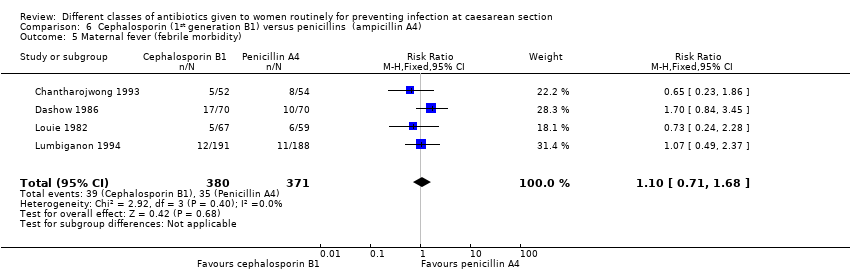
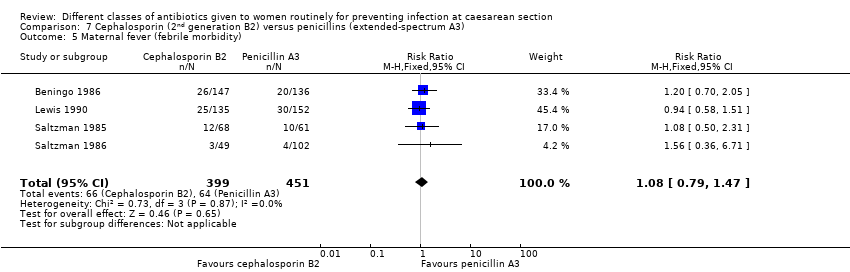
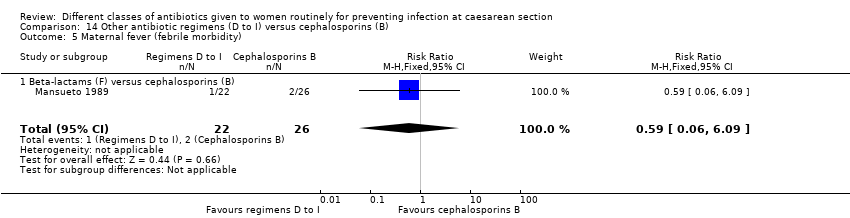
| 5 Maternal fever (febrile morbidity) Show forest plot | 13 | 2465 | Risk Ratio (M‐H, Fixed, 95% CI) | 1.02 [0.82, 1.28] |
|
| 5.1 Single cephalosporin vs single penicillin | 6 | 1212 | Risk Ratio (M‐H, Fixed, 95% CI) | 1.04 [0.79, 1.38] |
| 5.2 Single cephalosporin vs penicillin drug combination | 5 | 1078 | Risk Ratio (M‐H, Fixed, 95% CI) | 0.83 [0.57, 1.21] |
| 5.3 Cephalosporin drug combination vs single penicillin | 1 | 92 | Risk Ratio (M‐H, Fixed, 95% CI) | 3.5 [0.77, 15.96] |
| 5.4 Cephalosporin drug combination vs penicillin drug combination | 1 | 83 | Risk Ratio (M‐H, Fixed, 95% CI) | 2.93 [0.63, 13.68] |
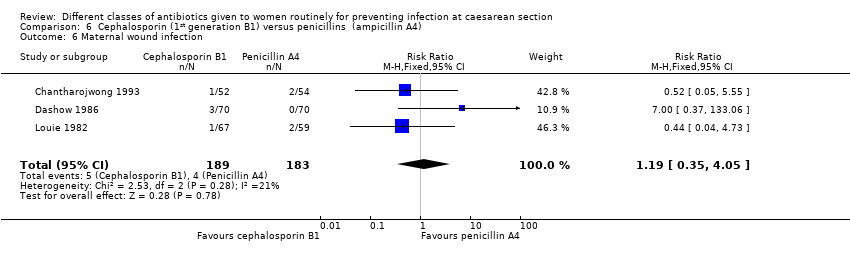
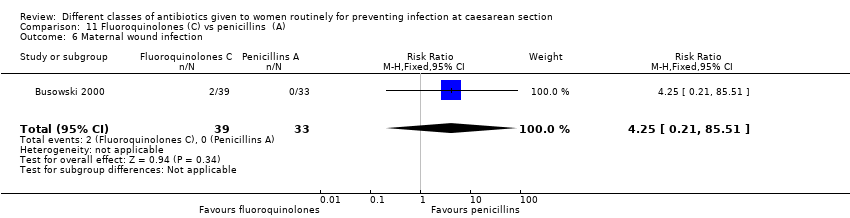
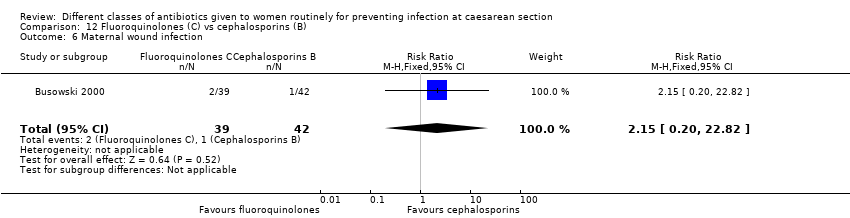
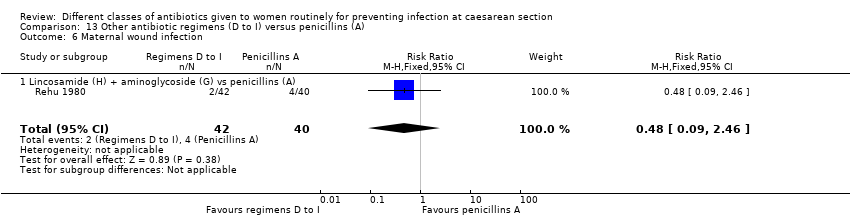
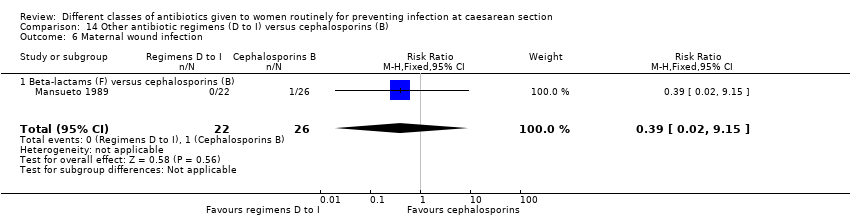
| 6 Maternal wound infection Show forest plot | 14 | 2104 | Risk Ratio (M‐H, Fixed, 95% CI) | 0.85 [0.51, 1.43] |
|
| 6.1 Single cephalosporin vs single penicillin | 8 | 1365 | Risk Ratio (M‐H, Fixed, 95% CI) | 0.84 [0.46, 1.56] |
| 6.2 Single cephalosporin vs penicillin drug combination | 4 | 564 | Risk Ratio (M‐H, Fixed, 95% CI) | 0.55 [0.16, 1.90] |
| 6.3 Cephalosporin drug combination vs single penicillin | 1 | 92 | Risk Ratio (M‐H, Fixed, 95% CI) | 3.0 [0.32, 27.79] |
| 6.4 Cephalosporin drug combination vs penicillin drug combination | 1 | 83 | Risk Ratio (M‐H, Fixed, 95% CI) | 0.98 [0.06, 15.09] |
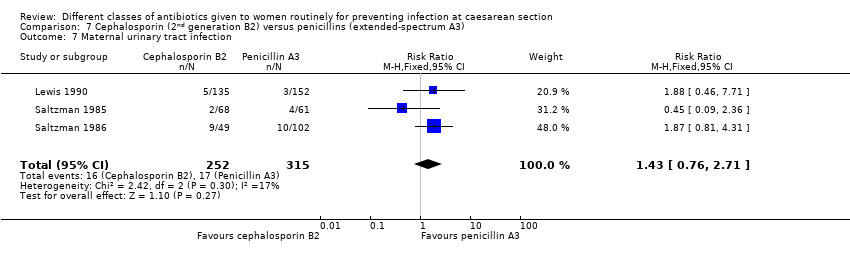
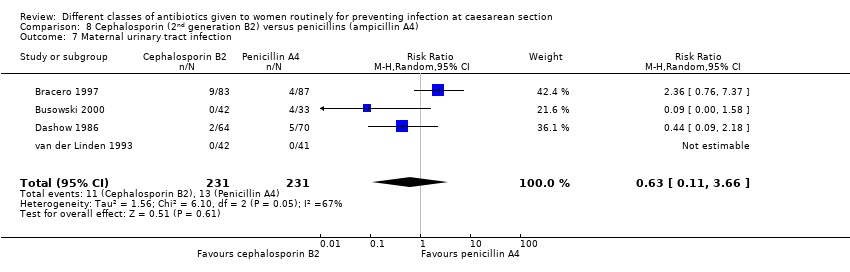
| 7 Maternal urinary tract infection Show forest plot | 11 | 1564 | Risk Ratio (M‐H, Fixed, 95% CI) | 1.27 [0.84, 1.93] |
|
| 7.1 Single cephalosporin vs single penicillin | 6 | 988 | Risk Ratio (M‐H, Fixed, 95% CI) | 1.59 [0.95, 2.69] |
| 7.2 Single cephalosporin vs penicillin drug combination | 4 | 493 | Risk Ratio (M‐H, Fixed, 95% CI) | 0.83 [0.40, 1.70] |
| 7.3 Cephalosporin drug combination vs single penicillin | 0 | 0 | Risk Ratio (M‐H, Fixed, 95% CI) | 0.0 [0.0, 0.0] |
| 7.4 Cephalosporin drug combination vs penicillin drug combination | 1 | 83 | Risk Ratio (M‐H, Fixed, 95% CI) | 0.0 [0.0, 0.0] |
| 8 Maternal thrush | 0 | 0 | Risk Ratio (M‐H, Fixed, 95% CI) | 0.0 [0.0, 0.0] |
| 8.1 Single cephalosporin vs single penicillin | 0 | 0 | Risk Ratio (M‐H, Fixed, 95% CI) | 0.0 [0.0, 0.0] |
| 8.2 Single cephalosporin vs penicillin drug combination | 0 | 0 | Risk Ratio (M‐H, Fixed, 95% CI) | 0.0 [0.0, 0.0] |
| 8.3 Cephalosporin drug combination vs single penicillin | 0 | 0 | Risk Ratio (M‐H, Fixed, 95% CI) | 0.0 [0.0, 0.0] |
| 8.4 Cephalosporin drug combination vs penicillin drug combination | 0 | 0 | Risk Ratio (M‐H, Fixed, 95% CI) | 0.0 [0.0, 0.0] |
| 9 Maternal composite serious infectious complication Show forest plot | 1 | 59 | Risk Ratio (M‐H, Fixed, 95% CI) | 0.0 [0.0, 0.0] |
|
| 9.1 Single cephalosporin vs single penicillin | 1 | 59 | Risk Ratio (M‐H, Fixed, 95% CI) | 0.0 [0.0, 0.0] |
| 9.2 Single cephalosporin vs penicillin drug combination | 0 | 0 | Risk Ratio (M‐H, Fixed, 95% CI) | 0.0 [0.0, 0.0] |
| 9.3 Cephalosporin drug combination vs single penicillin | 0 | 0 | Risk Ratio (M‐H, Fixed, 95% CI) | 0.0 [0.0, 0.0] |
| 9.4 Cephalosporin drug combination vs penicillin drug combination | 0 | 0 | Risk Ratio (M‐H, Fixed, 95% CI) | 0.0 [0.0, 0.0] |
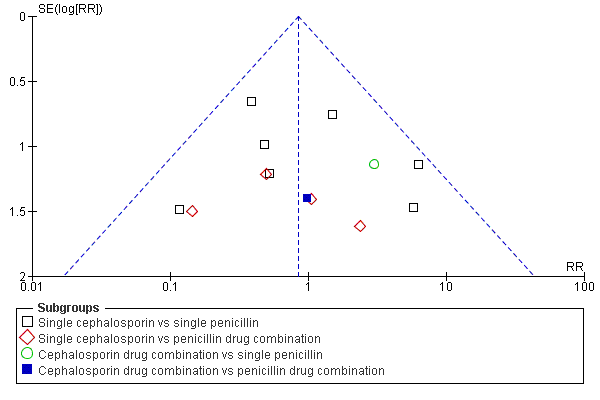
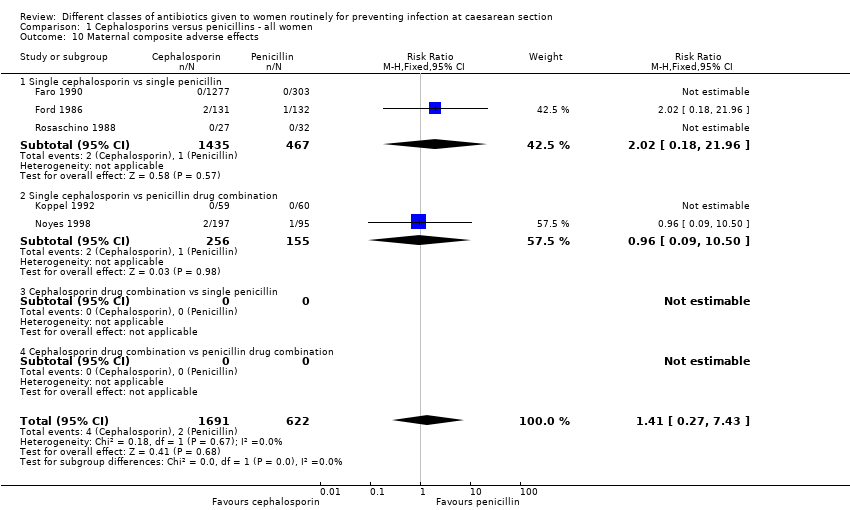
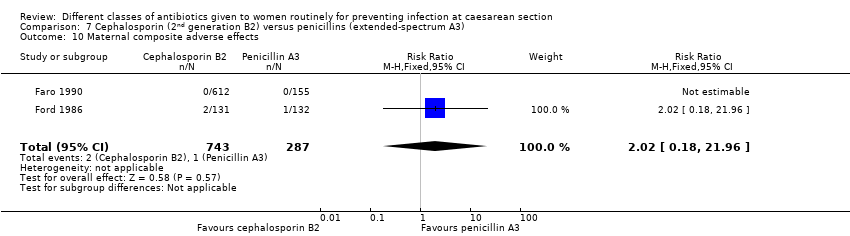
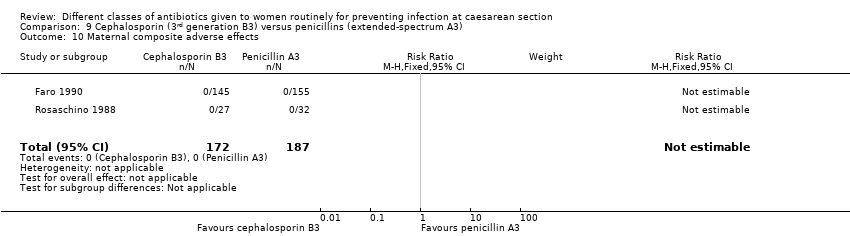
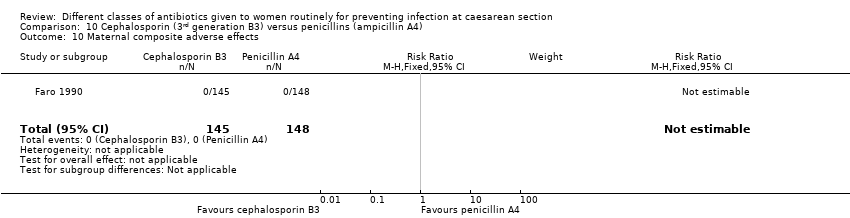
| 10 Maternal composite adverse effects Show forest plot | 5 | 2313 | Risk Ratio (M‐H, Fixed, 95% CI) | 1.41 [0.27, 7.43] |
|
| 10.1 Single cephalosporin vs single penicillin | 3 | 1902 | Risk Ratio (M‐H, Fixed, 95% CI) | 2.02 [0.18, 21.96] |
| 10.2 Single cephalosporin vs penicillin drug combination | 2 | 411 | Risk Ratio (M‐H, Fixed, 95% CI) | 0.96 [0.09, 10.50] |
| 10.3 Cephalosporin drug combination vs single penicillin | 0 | 0 | Risk Ratio (M‐H, Fixed, 95% CI) | 0.0 [0.0, 0.0] |
| 10.4 Cephalosporin drug combination vs penicillin drug combination | 0 | 0 | Risk Ratio (M‐H, Fixed, 95% CI) | 0.0 [0.0, 0.0] |
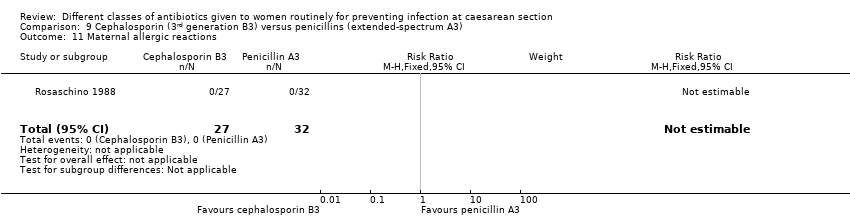
| 11 Maternal allergic reactions Show forest plot | 2 | 178 | Risk Ratio (M‐H, Fixed, 95% CI) | 0.0 [0.0, 0.0] |
|
| 11.1 Single cephalosporin vs single penicillin | 1 | 59 | Risk Ratio (M‐H, Fixed, 95% CI) | 0.0 [0.0, 0.0] |
| 11.2 Single cephalosporin vs penicillin drug combination | 1 | 119 | Risk Ratio (M‐H, Fixed, 95% CI) | 0.0 [0.0, 0.0] |
| 11.3 Cephalosporin drug combination vs single penicillin | 0 | 0 | Risk Ratio (M‐H, Fixed, 95% CI) | 0.0 [0.0, 0.0] |
| 11.4 Cephalosporin drug combination vs penicillin drug combination | 0 | 0 | Risk Ratio (M‐H, Fixed, 95% CI) | 0.0 [0.0, 0.0] |
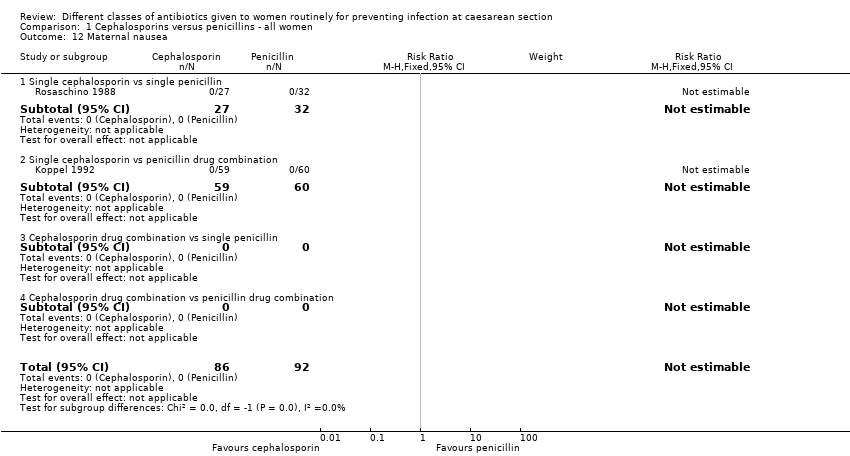
| 12 Maternal nausea Show forest plot | 2 | 178 | Risk Ratio (M‐H, Fixed, 95% CI) | 0.0 [0.0, 0.0] |
|
| 12.1 Single cephalosporin vs single penicillin | 1 | 59 | Risk Ratio (M‐H, Fixed, 95% CI) | 0.0 [0.0, 0.0] |
| 12.2 Single cephalosporin vs penicillin drug combination | 1 | 119 | Risk Ratio (M‐H, Fixed, 95% CI) | 0.0 [0.0, 0.0] |
| 12.3 Cephalosporin drug combination vs single penicillin | 0 | 0 | Risk Ratio (M‐H, Fixed, 95% CI) | 0.0 [0.0, 0.0] |
| 12.4 Cephalosporin drug combination vs penicillin drug combination | 0 | 0 | Risk Ratio (M‐H, Fixed, 95% CI) | 0.0 [0.0, 0.0] |
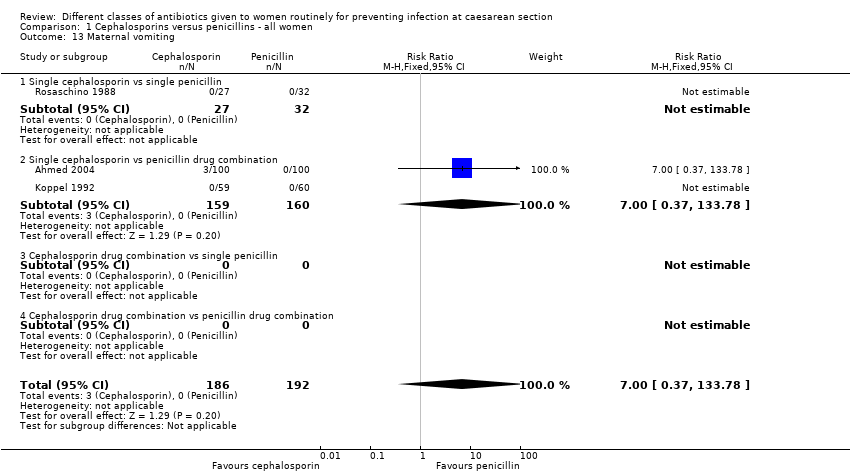
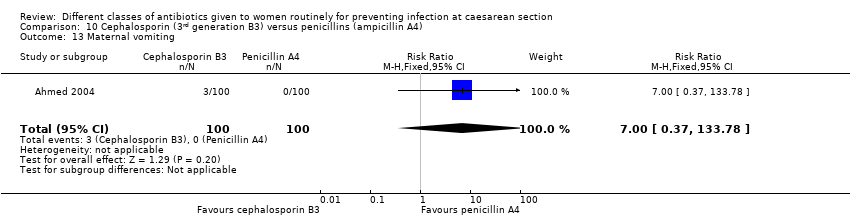
| 13 Maternal vomiting Show forest plot | 3 | 378 | Risk Ratio (M‐H, Fixed, 95% CI) | 7.0 [0.37, 133.78] |
|
| 13.1 Single cephalosporin vs single penicillin | 1 | 59 | Risk Ratio (M‐H, Fixed, 95% CI) | 0.0 [0.0, 0.0] |
| 13.2 Single cephalosporin vs penicillin drug combination | 2 | 319 | Risk Ratio (M‐H, Fixed, 95% CI) | 7.0 [0.37, 133.78] |
| 13.3 Cephalosporin drug combination vs single penicillin | 0 | 0 | Risk Ratio (M‐H, Fixed, 95% CI) | 0.0 [0.0, 0.0] |
| 13.4 Cephalosporin drug combination vs penicillin drug combination | 0 | 0 | Risk Ratio (M‐H, Fixed, 95% CI) | 0.0 [0.0, 0.0] |
| 14 Maternal diarrhoea Show forest plot | 2 | 178 | Risk Ratio (M‐H, Fixed, 95% CI) | 0.0 [0.0, 0.0] |
|
| 14.1 Single cephalosporin vs single penicillin | 1 | 59 | Risk Ratio (M‐H, Fixed, 95% CI) | 0.0 [0.0, 0.0] |
| 14.2 Single cephalosporin vs penicillin drug combination | 1 | 119 | Risk Ratio (M‐H, Fixed, 95% CI) | 0.0 [0.0, 0.0] |
| 14.3 Cephalosporin drug combination vs single penicillin | 0 | 0 | Risk Ratio (M‐H, Fixed, 95% CI) | 0.0 [0.0, 0.0] |
| 14.4 Cephalosporin drug combination vs penicillin drug combination | 0 | 0 | Risk Ratio (M‐H, Fixed, 95% CI) | 0.0 [0.0, 0.0] |
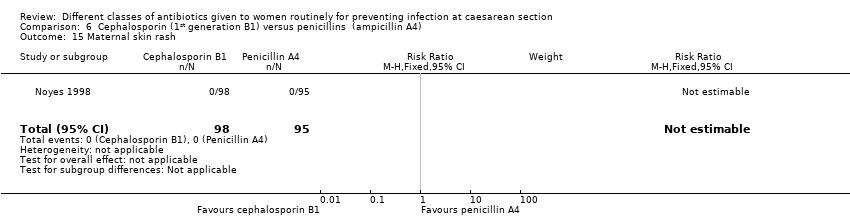
| 15 Maternal skin rash Show forest plot | 6 | 969 | Risk Ratio (M‐H, Fixed, 95% CI) | 1.28 [0.38, 4.32] |
|
| 15.1 Single cephalosporin vs single penicillin | 2 | 351 | Risk Ratio (M‐H, Fixed, 95% CI) | 1.45 [0.06, 35.38] |
| 15.2 Single cephalosporin vs penicillin drug combination | 4 | 618 | Risk Ratio (M‐H, Fixed, 95% CI) | 1.26 [0.34, 4.67] |
| 15.3 Cephalosporin drug combination vs single penicillin | 0 | 0 | Risk Ratio (M‐H, Fixed, 95% CI) | 0.0 [0.0, 0.0] |
| 15.4 Cephalosporin drug combination vs penicillin drug combination | 0 | 0 | Risk Ratio (M‐H, Fixed, 95% CI) | 0.0 [0.0, 0.0] |
| 16 Immediate infant adverse effects | 0 | 0 | Risk Ratio (M‐H, Fixed, 95% CI) | 0.0 [0.0, 0.0] |
| 16.1 Single cephalosporin vs single penicillin | 0 | 0 | Risk Ratio (M‐H, Fixed, 95% CI) | 0.0 [0.0, 0.0] |
| 16.2 Single cephalosporin vs penicillin drug combination | 0 | 0 | Risk Ratio (M‐H, Fixed, 95% CI) | 0.0 [0.0, 0.0] |
| 16.3 Cephalosporin drug combination vs single penicillin | 0 | 0 | Risk Ratio (M‐H, Fixed, 95% CI) | 0.0 [0.0, 0.0] |
| 16.4 Cephalosporin drug combination vs penicillin drug combination | 0 | 0 | Risk Ratio (M‐H, Fixed, 95% CI) | 0.0 [0.0, 0.0] |
| 17 Infant unsettled | 0 | 0 | Risk Ratio (M‐H, Fixed, 95% CI) | 0.0 [0.0, 0.0] |
| 17.1 Single cephalosporin vs single penicillin | 0 | 0 | Risk Ratio (M‐H, Fixed, 95% CI) | 0.0 [0.0, 0.0] |
| 17.2 Single cephalosporin vs penicillin drug combination | 0 | 0 | Risk Ratio (M‐H, Fixed, 95% CI) | 0.0 [0.0, 0.0] |
| 17.3 Cephalosporin drug combination vs single penicillin | 0 | 0 | Risk Ratio (M‐H, Fixed, 95% CI) | 0.0 [0.0, 0.0] |
| 17.4 Cephalosporin drug combination vs penicillin drug combination | 0 | 0 | Risk Ratio (M‐H, Fixed, 95% CI) | 0.0 [0.0, 0.0] |
| 18 Infant diarrhoea | 0 | 0 | Risk Ratio (M‐H, Fixed, 95% CI) | 0.0 [0.0, 0.0] |
| 18.1 Single cephalosporin vs single penicillin | 0 | 0 | Risk Ratio (M‐H, Fixed, 95% CI) | 0.0 [0.0, 0.0] |
| 18.2 Single cephalosporin vs penicillin drug combination | 0 | 0 | Risk Ratio (M‐H, Fixed, 95% CI) | 0.0 [0.0, 0.0] |
| 18.3 Cephalosporin drug combination vs single penicillin | 0 | 0 | Risk Ratio (M‐H, Fixed, 95% CI) | 0.0 [0.0, 0.0] |
| 18.4 Cephalosporin drug combination vs penicillin drug combination | 0 | 0 | Risk Ratio (M‐H, Fixed, 95% CI) | 0.0 [0.0, 0.0] |
| 19 Infant skin rash | 0 | 0 | Risk Ratio (M‐H, Fixed, 95% CI) | 0.0 [0.0, 0.0] |
| 19.1 Single cephalosporin vs single penicillin | 0 | 0 | Risk Ratio (M‐H, Fixed, 95% CI) | 0.0 [0.0, 0.0] |
| 19.2 Single cephalosporin vs penicillin drug combination | 0 | 0 | Risk Ratio (M‐H, Fixed, 95% CI) | 0.0 [0.0, 0.0] |
| 19.3 Cephalosporin drug combination vs single penicillin | 0 | 0 | Risk Ratio (M‐H, Fixed, 95% CI) | 0.0 [0.0, 0.0] |
| 19.4 Cephalosporin drug combination vs penicillin drug combination | 0 | 0 | Risk Ratio (M‐H, Fixed, 95% CI) | 0.0 [0.0, 0.0] |
| 20 Development of bacterial resistance | 0 | 0 | Risk Ratio (M‐H, Fixed, 95% CI) | 0.0 [0.0, 0.0] |
| 20.1 Single cephalosporin vs single penicillin | 0 | 0 | Risk Ratio (M‐H, Fixed, 95% CI) | 0.0 [0.0, 0.0] |
| 20.2 Single cephalosporin vs penicillin drug combination | 0 | 0 | Risk Ratio (M‐H, Fixed, 95% CI) | 0.0 [0.0, 0.0] |
| 20.3 Cephalosporin drug combination vs single penicillin | 0 | 0 | Risk Ratio (M‐H, Fixed, 95% CI) | 0.0 [0.0, 0.0] |
| 20.4 Cephalosporin drug combination vs penicillin drug combination | 0 | 0 | Risk Ratio (M‐H, Fixed, 95% CI) | 0.0 [0.0, 0.0] |
| 21 Maternal length of hospital stay | 0 | 0 | Mean Difference (IV, Fixed, 95% CI) | 0.0 [0.0, 0.0] |
| 21.1 Single cephalosporin vs single penicillin | 0 | 0 | Mean Difference (IV, Fixed, 95% CI) | 0.0 [0.0, 0.0] |
| 21.2 Single cephalosporin vs penicillin drug combination | 0 | 0 | Mean Difference (IV, Fixed, 95% CI) | 0.0 [0.0, 0.0] |
| 21.3 Cephalosporin drug combination vs single penicillin | 0 | 0 | Mean Difference (IV, Fixed, 95% CI) | 0.0 [0.0, 0.0] |
| 21.4 Cephalosporin drug combination vs penicillin drug combination | 0 | 0 | Mean Difference (IV, Fixed, 95% CI) | 0.0 [0.0, 0.0] |
| 22 Infant length of hospital stay | 0 | 0 | Mean Difference (IV, Fixed, 95% CI) | 0.0 [0.0, 0.0] |
| 22.1 Single cephalosporin vs single penicillin | 0 | 0 | Mean Difference (IV, Fixed, 95% CI) | 0.0 [0.0, 0.0] |
| 22.2 Single cephalosporin vs penicillin drug combination | 0 | 0 | Mean Difference (IV, Fixed, 95% CI) | 0.0 [0.0, 0.0] |
| 22.3 Cephalosporin drug combination vs single penicillin | 0 | 0 | Mean Difference (IV, Fixed, 95% CI) | 0.0 [0.0, 0.0] |
| 22.4 Cephalosporin drug combination vs penicillin drug combination | 0 | 0 | Mean Difference (IV, Fixed, 95% CI) | 0.0 [0.0, 0.0] |
| 23 Infant's immune system development | 0 | 0 | Mean Difference (IV, Fixed, 95% CI) | 0.0 [0.0, 0.0] |
| 23.1 Single cephalosporin vs single penicillin | 0 | 0 | Mean Difference (IV, Fixed, 95% CI) | 0.0 [0.0, 0.0] |
| 23.2 Single cephalosporin vs penicillin drug combination | 0 | 0 | Mean Difference (IV, Fixed, 95% CI) | 0.0 [0.0, 0.0] |
| 23.3 Cephalosporin drug combination vs single penicillin | 0 | 0 | Mean Difference (IV, Fixed, 95% CI) | 0.0 [0.0, 0.0] |
| 23.4 Cephalosporin drug combination vs penicillin drug combination | 0 | 0 | Mean Difference (IV, Fixed, 95% CI) | 0.0 [0.0, 0.0] |
| 24 Infant general health | 0 | 0 | Std. Mean Difference (IV, Fixed, 95% CI) | 0.0 [0.0, 0.0] |
| 24.1 Single cephalosporin vs single penicillin | 0 | 0 | Std. Mean Difference (IV, Fixed, 95% CI) | 0.0 [0.0, 0.0] |
| 24.2 Single cephalosporin vs penicillin drug combination | 0 | 0 | Std. Mean Difference (IV, Fixed, 95% CI) | 0.0 [0.0, 0.0] |
| 24.3 Cephalosporin drug combination vs single penicillin | 0 | 0 | Std. Mean Difference (IV, Fixed, 95% CI) | 0.0 [0.0, 0.0] |
| 24.4 Cephalosporin drug combination vs penicillin drug combination | 0 | 0 | Std. Mean Difference (IV, Fixed, 95% CI) | 0.0 [0.0, 0.0] |
| 25 Infant frequency of hospital visits | 0 | 0 | Mean Difference (IV, Fixed, 95% CI) | 0.0 [0.0, 0.0] |
| 25.1 Single cephalosporin vs single penicillin | 0 | 0 | Mean Difference (IV, Fixed, 95% CI) | 0.0 [0.0, 0.0] |
| 25.2 Single cephalosporin vs penicillin drug combination | 0 | 0 | Mean Difference (IV, Fixed, 95% CI) | 0.0 [0.0, 0.0] |
| 25.3 Cephalosporin drug combination vs single penicillin | 0 | 0 | Mean Difference (IV, Fixed, 95% CI) | 0.0 [0.0, 0.0] |
| 25.4 Cephalosporin drug combination vs penicillin drug combination | 0 | 0 | Mean Difference (IV, Fixed, 95% CI) | 0.0 [0.0, 0.0] |
| 26 Costs | 0 | 0 | Mean Difference (IV, Fixed, 95% CI) | 0.0 [0.0, 0.0] |
| 26.1 Single cephalosporin vs single penicillin | 0 | 0 | Mean Difference (IV, Fixed, 95% CI) | 0.0 [0.0, 0.0] |
| 26.2 Single cephalosporin vs penicillin drug combination | 0 | 0 | Mean Difference (IV, Fixed, 95% CI) | 0.0 [0.0, 0.0] |
| 26.3 Cephalosporin drug combination vs single penicillin | 0 | 0 | Mean Difference (IV, Fixed, 95% CI) | 0.0 [0.0, 0.0] |
| 26.4 Cephalosporin drug combination vs penicillin drug combination | 0 | 0 | Mean Difference (IV, Fixed, 95% CI) | 0.0 [0.0, 0.0] |
| 27 Post‐discharge infections ‐ up to 30 days (not pre‐specified) | 0 | 0 | Risk Ratio (M‐H, Fixed, 95% CI) | 0.0 [0.0, 0.0] |
| 27.1 Single cephalosporin vs single penicillin | 0 | 0 | Risk Ratio (M‐H, Fixed, 95% CI) | 0.0 [0.0, 0.0] |
| 27.2 Single cephalosporin vs penicillin drug combination | 0 | 0 | Risk Ratio (M‐H, Fixed, 95% CI) | 0.0 [0.0, 0.0] |
| 27.3 Cephalosporin drug combination vs single penicillin | 0 | 0 | Risk Ratio (M‐H, Fixed, 95% CI) | 0.0 [0.0, 0.0] |
| 27.4 Cephalosporin drug combination vs penicillin drug combination | 0 | 0 | Risk Ratio (M‐H, Fixed, 95% CI) | 0.0 [0.0, 0.0] |
| 28 Maternal readmissions to hospital | 0 | 0 | Risk Ratio (M‐H, Fixed, 95% CI) | 0.0 [0.0, 0.0] |
| 28.1 Single cephalosporin vs single penicillin | 0 | 0 | Risk Ratio (M‐H, Fixed, 95% CI) | 0.0 [0.0, 0.0] |
| 28.2 Single cephalosporin vs penicillin drug combination | 0 | 0 | Risk Ratio (M‐H, Fixed, 95% CI) | 0.0 [0.0, 0.0] |
| 28.3 Cephalosporin drug combination vs single penicillin | 0 | 0 | Risk Ratio (M‐H, Fixed, 95% CI) | 0.0 [0.0, 0.0] |
| 28.4 Cephalosporin drug combination vs penicillin drug combination | 0 | 0 | Risk Ratio (M‐H, Fixed, 95% CI) | 0.0 [0.0, 0.0] |