| Test | Description | Advantages | Disadvantages | Type of result | Presence of cut‐off values |
| Screening tests |
| MPS Stress
Exercise
dipyridamole
dobutamine Radionucleotide
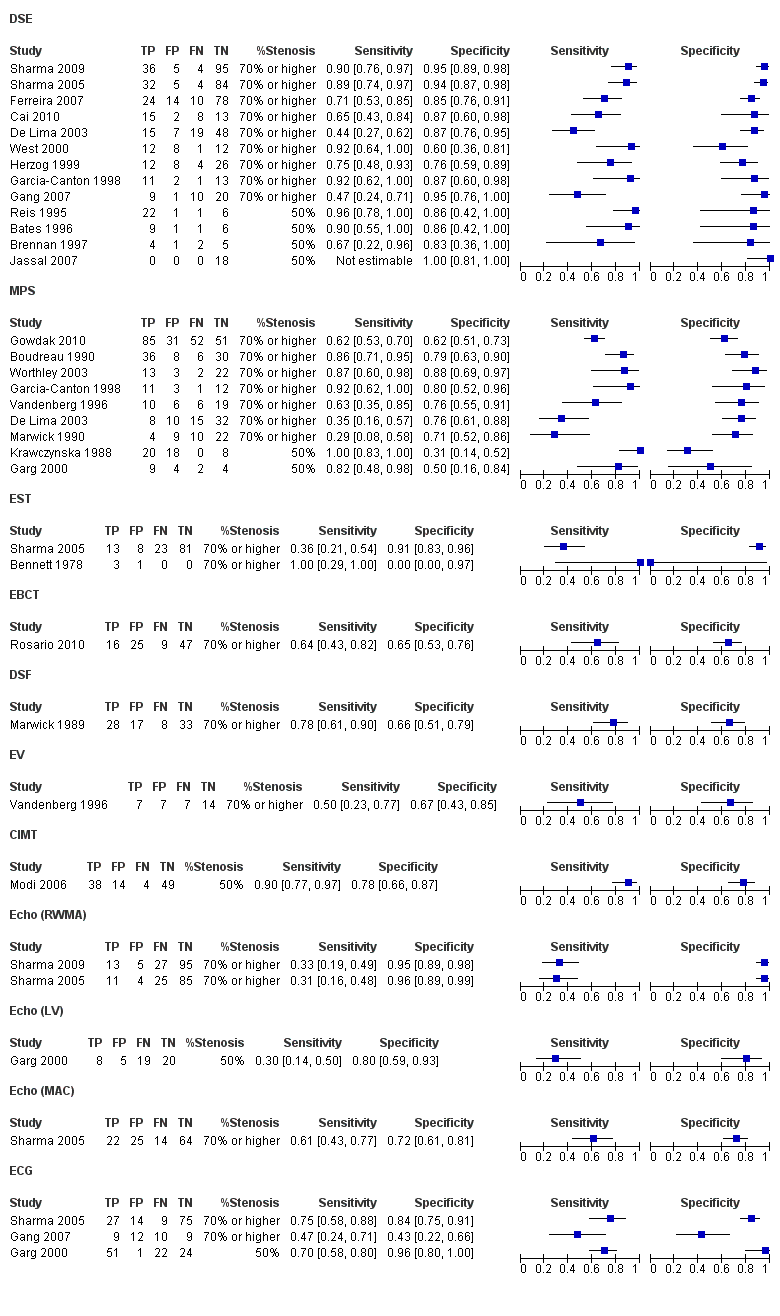
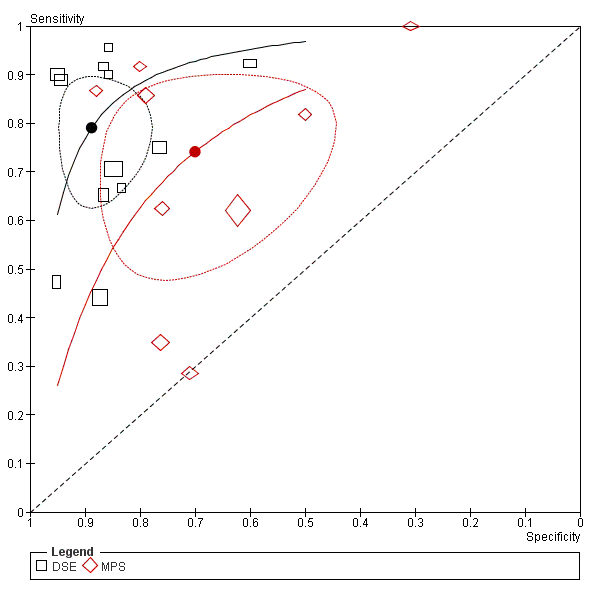
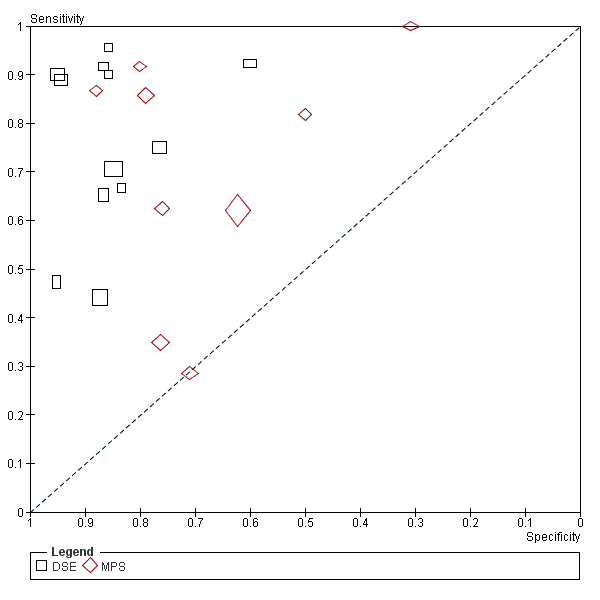
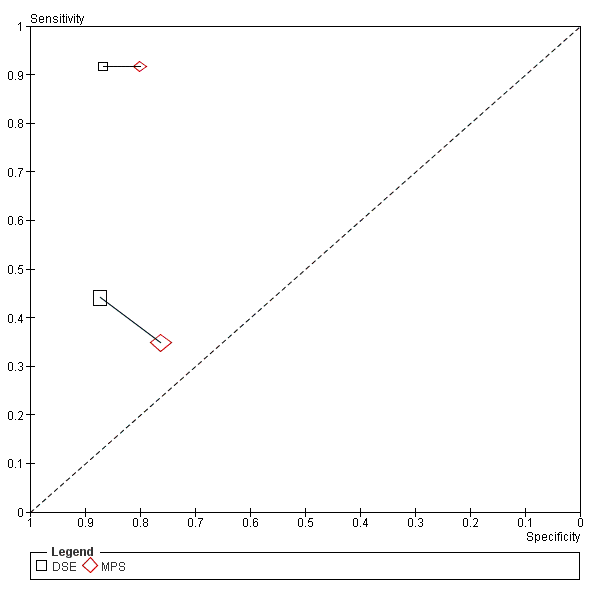
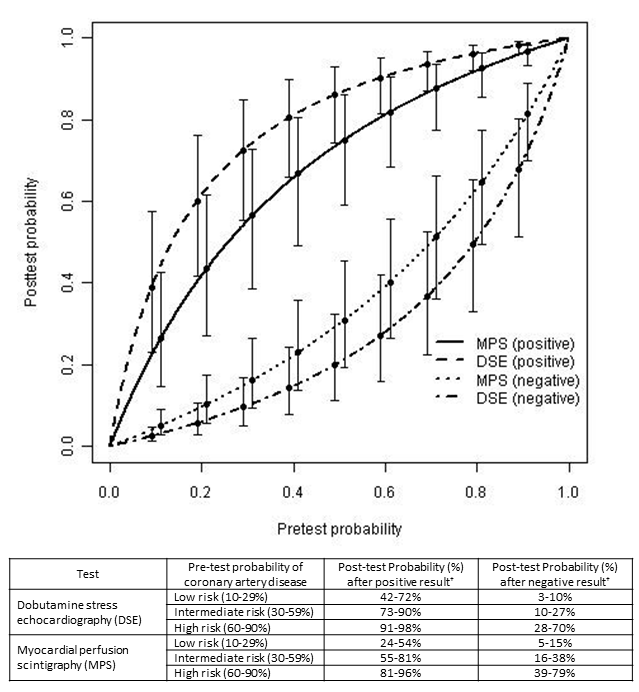
thallium‐201 or Tc‐99m sestamibi radionucleotide agents | This compares perfusion of myocardium at rest and after a ‘stress’ such as exercise or drugs (e.g. dipyridamole).
When coronary arteries are normal, ‘stress’ results in vasodilatation and increased coronary blood flow. However, diseased coronary arteries cannot dilate because they are already maximally dilated and there is no increase in blood flow after a stress. MPS reveals these areas as regions of decreased perfusion. A reversible perfusion defect is a sign of ischaemia. A fixed defect (when there is decreased perfusion before, during and after the stress) is an indicator of infarction. Pharmacological agents overcome limitations of exercise testing in patients with kidney disease | Non‐invasive Provides information regarding functional status of myocardium under stress conditions | Neither 100% sensitive nor specific Radiation dose Results subject to interpretation and reader bias False positives due to increase in attenuation artefacts caused by left ventricular hypertrophy False negatives due to balanced ischaemia (e.g. triple vessel disease) More expensive than exercise ECG | Dichotomous (i.e. stress test positive or stress test negative) | None. However, whether a stress test is interpreted as positive or negative depends largely on observer interpretation |
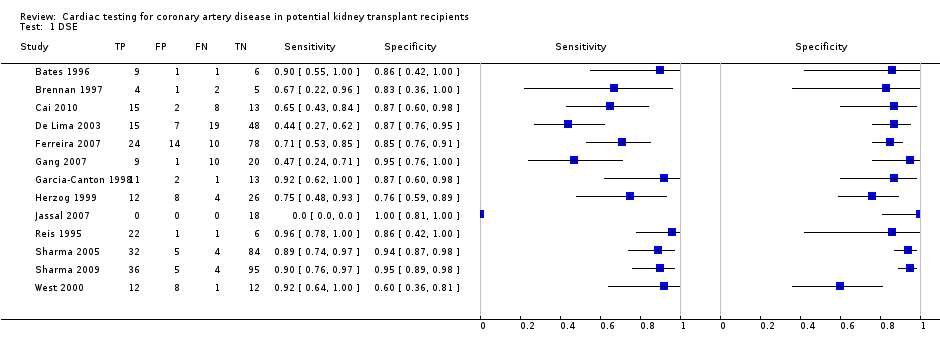
| DSE Stress
Exercise
dobutamine | Stress echocardiography compares the regional wall motion and thickness of myocardium both at rest and after stress. Regional systolic dysfunction is usually caused by CAD. Pharmacological stress agent overcomes limitations of exercise testing in patients with kidney disease | Non‐invasive No radiation dose Provides information regarding functional status of myocardium under stress conditions Provides assessment of ventricular size and function | Neither 100% sensitive nor specific Results subject to interpretation and reader bias Operator dependent Acoustic windows not possible in up to 20% of subjects Hypertensive response to stress agent possible Cardiomyopathies may also show regional variation in function | Dichotomous (i.e. stress test positive or stress test negative) | None. However, whether a stress test is interpreted as positive or negative depends largely on observer interpretation |
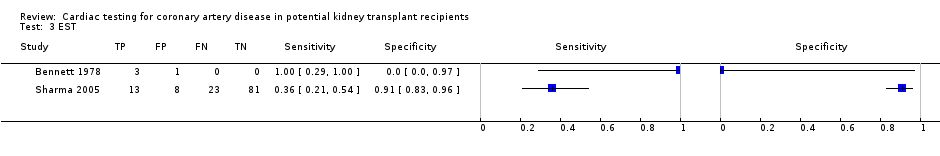
| Exercise ECG Bruce protocol stress ECG | Patient exercises on a treadmill while connected to an ECG. The level of exercise is increased in progressive stages. The patient's symptoms and blood pressure response are checked repeatedly. Ischaemic ECG changes or angina symptoms brought on by exercise are highly suggestive of underlying CAD | Non‐invasive Provides information regarding functional status of myocardium under stress conditions | Neither 100% sensitive nor specific Results subject to interpretation and reader bias Often limited by the inability of CKD patients to achieve an adequate peak exercise workload, development of exercise‐induced hypotension High proportion have abnormal baseline ECG (left ventricular hypertrophy) | Dichotomous (i.e. stress test positive or stress test negative) | No. However, whether a stress test is interpreted as positive or negative depends largely on observer interpretation |
| Coronary artery calcium score EBCT
Multidetector computed tomography | Cardiac calcium scoring is a non‐invasive test that uses computed tomography to detect the presence of calcium in plaque on the walls of the arteries of the heart (coronary arteries). A calcium score is then derived, calculated as a summation of all calcified lesions in the coronary arteries. The calcium score is then compared with a reference range appropriate to a patient's age and sex. High calcium scores are associated with higher risks of cardiovascular events | Non‐invasive | Neither 100% sensitive nor specific Radiation dose | Continuous | There is no uniformly agreed cut‐off value at which patients are considered at high risk of CAD. We planned to analyse results by combining data from studies which share identical cut‐off values |
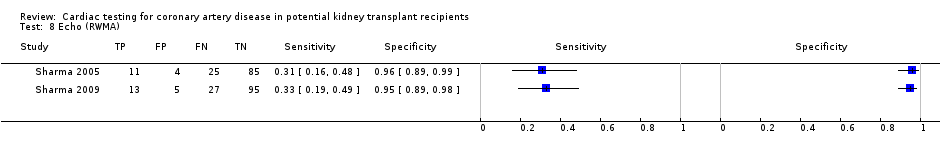
| Echocardiography Trans‐thoracic
Trans‐oesophageal | An ultrasound of the heart that enables assessment of structure and function. Impairment in systolic function can result from pre‐existing CAD | Provides information regarding myocardial function and regional wall abnormalities, which may suggest pre‐existing ischaemia or MI Enables assessment of structure | Neither highly sensitive nor specific Does not provide any information of reversible ischaemia Results subject to interpretation and reader bias | Dichotomous (e.g. presence or absence of resting wall motion abnormality) | None |
| CT coronary angiography | Specialised form of CT that enables imaging of the heart and computerised reconstruction of coronary arteries, permitting assessment of the lumen and vessel walls | Non‐invasive Enables diagnosis of precise location and severity of each lesion as opposed to vascular territory affected, as is the case for most functional tests. Assesses not only the lumen of the vessel but also the wall. It can also demonstrate soft atheromatous plaques, which cannot be demonstrated on conventional coronary angiography | Radiation dose Contrast nephropathy Inability to provide opportunity for immediate intervention (as opposed to coronary angiography) | Dichotomous (i.e. presence or absence of significant CAD) | Yes (i.e. ≥ 50% stenosis or ≥ 70% stenosis) We planned to manage the issue of different cut points by involving an analysis that included: |
| Cardiac magnetic resonance imaging | MRI of the heart that enables evaluation of its structure and function | Non‐invasive No radiation dose Enables assessment of structure of myocardium High spatial resolution means low inter‐observer variability | Neither highly sensitive nor specific | Dichotomous (e.g. presence or absence of left ventricular systolic dysfunction) | None |
| Resting ECG | Transthoracic interpretation of the electrical activity of the heart over time captured and externally recorded by skin electrodes | Provides information regarding the electrical function of the myocardium, which may suggest pre‐existing ischaemia, left ventricular hypertrophy or arrhythmias | Neither sensitive nor specific Does not provide any information of reversible ischaemia | Dichotomous (i.e. presence or absence of certain ECG features) | None |
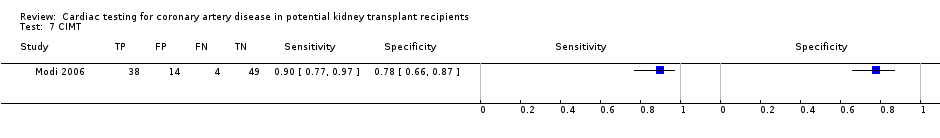
| CIMT | Measurement of the thickness of artery walls, usually by external ultrasound, to detect both the presence and to track the progression of atherosclerotic disease in humans. Used as a surrogate marker for atherosclerosis | Non‐invasive | Neither highly sensitive nor specific Does not provide any information on cardiac function | Continuous | Yes. This will vary depending on the institution (e.g. 0.75 mm) |
| Cardiopulmonary exercise testing | Evaluates both cardiac and pulmonary function. Cardiac function is evaluated in terms of aerobic capacity and respiratory function. The subject is exercised on a bicycle ergometer or treadmill. The test enables calculation of maximal aerobic capacity and the point during exercise where anaerobic metabolism is used to supplement aerobic metabolism as a source of energy. These can be measured via gas exchange data | Non‐invasive measurement of ventricular function, respiratory function and cellular function via measurement of gas exchange, as well as detection of myocardial ischaemia Excellent method of evaluating fitness and operative fitness | Not commonly performed | Dichotomous (e.g. stress ECG positive or stress ECG negative; presence or absence of cardiac failure) and Continuous (e.g. measurement of the maximum aerobic capacity and anaerobic threshold) | Yes, although these will vary for different variables and for different institutions |
| DSF | Used to detect coronary artery calcification. Digital subtraction improves resolution of conventional fluoroscopic methods | Non‐invasive Non exercise | Not commonly used Radiation dose | Dichotomous (i.e. presence or absence of calcification) | None |
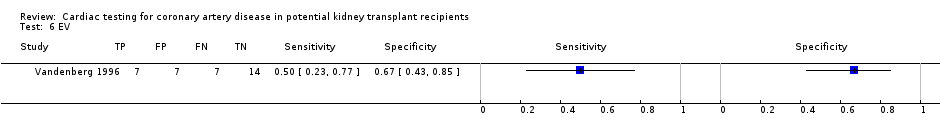
| Exercise radionucleotide ventriculography | Technique for a combined assessment of exercise capacity and an evaluation of ventricular size and performance | | Not commonly used Radiation dose | Dichotomous (i.e. stress test positive or stress test negative) | None. However, whether a stress test is interpreted as positive or negative depends largely on observer interpretation |
| Reference standard |
| Coronary angiography | Coronary catheterisation is an invasive procedure to access the coronary circulation and blood filled chambers of the heart using a catheter. It can be performed for both diagnostic and interventional (treatment) purposes. It assesses the diameter of coronary artery lumens, heart chamber size and heart muscle contraction performance | Gold standard for detecting CAD. Enables diagnosis of precise location and severity of each lesion Intervention (PTCA) possible during procedure | High cost Lack of sensitivity to intramural coronary atherosclerosis Risk of complications Intravenous contrast media may worsen kidney function Little information on function Radiation dose Results subject to interpretation and reader bias, although to a lesser extent than functional tests | Dichotomous (i.e. presence or absence of significant CAD) | Yes (i.e. ≥ 50% stenosis or ≥ 70% stenosis). We managed the issue of different cut points by involving an analysis which included: |