預防加護病房患者上消化道出血的干預措施
Abstract
Background
Upper gastrointestinal (GI) bleeding due to stress ulcers contributes to increased morbidity and mortality in people admitted to intensive care units (ICUs). Stress ulceration refers to GI mucosal injury related to the stress of being critically ill. ICU patients with major bleeding as a result of stress ulceration might have mortality rates approaching 48.5% to 65%. However, the incidence of stress‐induced GI bleeding in ICUs has decreased, and not all critically ill patients need prophylaxis. Stress ulcer prophylaxis can result in adverse events such as ventilator‐associated pneumonia; therefore, it is necessary to evaluate strategies that safely decrease the incidence of GI bleeding.
Objectives
To assess the effect and risk‐benefit profile of interventions for preventing upper GI bleeding in people admitted to ICUs.
Search methods
We searched the following databases up to 23 August 2017, using relevant search terms: MEDLINE; Embase; the Cochrane Central Register of Controlled Trials; Latin American Caribbean Health Sciences Literature; and the Cochrane Upper Gastrointestinal and Pancreatic Disease Group Specialised Register, as published in the Cochrane Library (2017, Issue 8). We searched the reference lists of all included studies and those from relevant systematic reviews and meta‐analyses to identify additional studies. We also searched the World Health Organization International Clinical Trials Registry Platform search portal and contacted individual researchers working in this field, as well as organisations and pharmaceutical companies, to identify unpublished and ongoing studies.
Selection criteria
We included randomised controlled trials (RCTs) and quasi‐RCTs with participants of any age and gender admitted to ICUs for longer than 48 hours. We excluded studies in which participants were admitted to ICUs primarily for the management of GI bleeding and studies that compared different doses, routes, and regimens of one drug in the same class because we were not interested in intraclass effects of drugs.
Data collection and analysis
We used standard methodological procedures as recommended by Cochrane.
Main results
We identified 2292 unique records.We included 129 records reporting on 121 studies, including 12 ongoing studies and two studies awaiting classification.
We judged the overall risk of bias of two studies as low. Selection bias was the most relevant risk of bias domain across the included studies, with 78 studies not clearly reporting the method used for random sequence generation. Reporting bias was the domain with least risk of bias, with 12 studies not reporting all outcomes that researchers intended to investigate.
Any intervention versus placebo or no prophylaxis
In comparison with placebo, any intervention seems to have a beneficial effect on the occurrence of upper GI bleeding (risk ratio (RR) 0.47, 95% confidence interval (CI) 0.39 to 0.57; moderate certainty of evidence). The use of any intervention reduced the risk of upper GI bleeding by 10% (95% CI ‐12.0% to ‐7%). The effect estimate of any intervention versus placebo or no prophylaxis with respect to the occurrence of nosocomial pneumonia, all‐cause mortality in the ICU, duration of ICU stay, duration of intubation (all with low certainty of evidence), the number of participants requiring blood transfusions (moderate certainty of evidence), and the units of blood transfused was consistent with benefits and harms. None of the included studies explicitly reported on serious adverse events.
Individual interventions versus placebo or no prophylaxis
In comparison with placebo or no prophylaxis, antacids, H2 receptor antagonists, and sucralfate were effective in preventing upper GI bleeding in ICU patients. Researchers found that with H2 receptor antagonists compared with placebo or no prophylaxis, 11% less developed upper GI bleeding (95% CI ‐0.16 to ‐0.06; RR 0.50, 95% CI 0.36 to 0.70; 24 studies; 2149 participants; moderate certainty of evidence). Of ICU patients taking antacids versus placebo or no prophylaxis, 9% less developed upper GI bleeding (95% CI ‐0.17 to ‐0.00; RR 0.49, 95% CI 0.25 to 0.99; eight studies; 774 participants; low certainty of evidence). Among ICU patients taking sucralfate versus placebo or no prophylaxis, 5% less had upper GI bleeding (95% CI ‐0.10 to ‐0.01; RR 0.53, 95% CI 0.32 to 0.88; seven studies; 598 participants; moderate certainty of evidence). The remaining interventions including proton pump inhibitors did not show a significant effect in preventing upper GI bleeding in ICU patients when compared with placebo or no prophylaxis.
Regarding the occurrence of nosocomial pneumonia, the effects of H2 receptor antagonists (RR 1.12, 95% CI 0.85 to 1.48; eight studies; 945 participants; low certainty of evidence) and of sucralfate (RR 1.33, 95% CI 0.86 to 2.04; four studies; 450 participants; low certainty of evidence) were consistent with benefits and harms when compared with placebo or no prophylaxis. None of the studies comparing antacids versus placebo or no prophylaxis provided data regarding nosocomial pneumonia.
H2 receptor antagonists versus proton pump inhibitors
H2 receptor antagonists and proton pump inhibitors are most commonly used in practice to prevent upper GI bleeding in ICU patients. Proton pump inhibitors significantly more often prevented upper GI bleeding in ICU patients compared with H2 receptor antagonists (RR 2.90, 95% CI 1.83 to 4.58; 18 studies; 1636 participants; low certainty of evidence). When taking H2 receptor antagonists, 4.8% more patients might experience upper GI bleeding (95% CI 2.1% to 9%). Nosocomial pneumonia occurred in similar proportions of participants taking H2 receptor antagonists and participants taking proton pump inhibitors (RR 1.02, 95% CI 0.77 to 1.35; 10 studies; 1256 participants; low certainty of evidence).
Authors' conclusions
This review shows that antacids, sucralfate, and H2 receptor antagonists might be more effective in preventing upper GI bleeding in ICU patients compared with placebo or no prophylaxis. The effect estimates of any treatment versus no prophylaxis on nosocomial pneumonia were consistent with benefits and harms. Evidence of low certainty suggests that proton pump inhibitors might be more effective than H2 receptor antagonists. Therefore, patient‐relevant benefits and especially harms of H2 receptor antagonists compared with proton pump inhibitors need to be assessed by larger, high‐quality RCTs to confirm the results of previously conducted, smaller, and older studies.
PICO
Plain language summary
預防加護病房患者上消化道出血的干預措施
審閱問題
我們回顧有關預防加護病房(ICU)患者臨床上重要的上消化道 (胃腸) 出血干預措施的好處和危害的證據,。
背景
壓力性潰瘍被視為胃或腸道粘膜內的表面損傷, 可能是由於休克、敗血症或外傷所致。依據損傷的嚴重度, 受影響的區域可能會疼痛, 並可能開始有不同程度的流血。壓力性潰瘍導致的上消化道出血是ICU患者患病和死亡程度增高的主要因素。然而, 由於照護標準有所改善, ICU上消化道出血的發病率已有所下降。因此, 並非所有重症病人都需要預防性治療。
壓力性潰瘍預防藥物可導致負面作用, 例如呼吸器相關肺炎 (VAP)。VAP 是接受機械通氣患者的肺部受細菌感染所致。VAP的表現常為發燒, 咳嗽和膿痰。重症, 住院時間延長, 或使用壓力性潰瘍預防藥物的患者會增加VAP的風險。因此, 需要有一套如何安全地降低上消化道出血發生率的評估策略。
硏究特點
證據收集截至2017年8月。我們納入106篇研究, 不分年齡和性別共有15027位重症受試者。
主要結果
下列藥物相關作用發現:H2受體拮抗劑、制酸劑、sucralfate和質子幫浦抑制劑。
H2受體拮抗劑透過阻斷組胺受體抑制胃酸分泌, 但會導致血小板數量變少(血小板減少症)、腎臟發炎 (間質性腎炎) 和意識混亂。制酸劑會中和胃酸, 但可能引起腹瀉或便秘。質子幫浦抑制劑會抑制胃酸生產的最後階段, 並發現它們可能會增加困難梭狀桿菌(Clostridium difficile)腹瀉的風險。潰瘍保護劑, 如sucralfate, 在胃酸和胃粘膜之間會形成薄膜作為屏障。然而, 它們可能會引起便秘, 並干擾某些抗菌劑的吸收。
與安慰劑或無預防性治療相比, H2受體拮抗劑、制酸劑和sucralfate可有效預防 ICU患者臨床上重要的上消化道出血。與安慰劑或無預防性治療相比, ICU患者服用H2受體拮抗劑或sucralfate最有可能發生院內肺炎。
低確定性的證據表明, 質子幫浦抑制劑比H2受體拮抗劑更有效地預防ICU患者上消化道出血。使用質子幫浦抑制劑, 1000人中有25人可能會發展上消化道出血, 使用H2受體拮抗劑, 1000人中有73人 (95% 信賴區間46至115人) 可能會發展上消化道出血。H2受體拮抗劑與質子幫浦抑制劑對發展院內肺炎的好處和危害影響是一致的。
證據品質
我們的證據確定性從低到中等。與安慰劑或無預防性相比, 不同干預措施的療效證據確定性是中等(H2受體拮抗劑)或低的(制酸劑和sucralfate)。與安慰劑或無預防性治療相比, H2受體拮抗劑對院內肺炎的影響, 證據的確定性是低的。與質子幫浦抑制劑相比, H2受體拮抗劑對院內肺炎的影響, 證據的確定性也很低。
Authors' conclusions
Summary of findings
| Any intervention compared with placebo or no prophylaxis for preventing upper gastrointestinal bleeding in people admitted to intensive care units | ||||||
| Patient or population: people admitted to intensive care units | ||||||
| Outcomes | Anticipated absolute effects* (95% CI) | Relative effect | № of participants | Certainty of the evidence | Comments | |
| Risk with placebo or no prophylaxis | Risk with Interventions | |||||
| Clinically important upper GI bleeding Follow‐up: 15 days† | Study population | RR 0.47 | 3207 | ⊕⊕⊕⊝ | ||
| 188 per 1000 | 88 per 1000 | |||||
| Nosocomial pneumonia Follow‐up: 48 hours after extubation‡ | Study population | RR 1.15 | 1331 | ⊕⊕⊝⊝ | ||
| 143 per 1000 | 164 per 1000 | |||||
| All‐cause mortality in ICU Follow‐up: 4 weeks§ | Study population | RR 1.10 | 2159 | ⊕⊕⊝⊝ | ||
| 152 per 1000 | 168 per 1000 | |||||
| Duration of ICU stay Follow‐up: not reported | Mean duration of ICU stay ranged from 8.6 to 11.1 days | MD 0.24 days higher | ‐ | 447 | ⊕⊕⊝⊝ | |
| Number of participants requiring blood transfusion Follow‐up: 48 hours after discharge‡ | Study population | RR 0.63 | 981 | ⊕⊕⊕⊝ | ||
| 96 per 1000 | 60 per 1000 | |||||
| Serious adverse events | Not reported | |||||
| *The risk in the intervention group (and its 95% confidence interval) is based on the assumed risk in the comparison group and the relative effect of the intervention (and its 95% CI). †Duration of follow‐up reported in four studies. §Duration of follow‐up reported in five studies. | ||||||
| GRADE Working Group grades of evidence. | ||||||
| aDowngraded by one level for risk of bias because of high risk of selection bias in one study, high risk of performance bias in nine studies, high risk of detection bias in five studies, high risk of attrition bias in four studies, high risk of reporting bias in five studies, and high risk of other biases in four studies. bDowngraded by one level for imprecision because effect estimate and 95% CI were compatible with benefit and harm. cDowngraded by one level for risk of bias because of high risk of performance bias in three studies, high risk of detection bias in one study, and high risk of attrition bias in two studies. dDowngraded by one level for risk of bias because of high risk of performance bias in seven studies and high risk of attrition bias in two studies. eDowngraded by one level for risk of bias because of high risk of performance bias in one study. fDowngraded by one level for risk of bias because of high risk of selection bias in one study, high risk of performance bias in two studies, high risk of attrition bias in one study, high risk of reporting bias in one study, and high risk of other biases in one study. | ||||||
| H2 receptor antagonists compared with placebo or no prophylaxis for preventing upper gastrointestinal bleeding in people admitted to intensive care units | ||||||
| Patient or population: people admitted to intensive care units | ||||||
| Outcomes | Anticipated absolute effects* (95% CI) | Relative effect | № of participants | Certainty of the evidence | Comments | |
| Risk with placebo or no prophylaxis | Risk with H2 receptor antagonists | |||||
| Clinically important upper GI bleeding Follow‐up: 15 days/weeks† | Study population | RR 0.50 | 2149 | ⊕⊕⊕⊝ | ||
| 182 per 1000 | 91 per 1000 | |||||
| Nosocomial pneumonia Follow‐up: 48 hours after extubation‡ | Study population | RR 1.12 | 945 | ⊕⊕⊝⊝ | ||
| 146 per 1000 | 164 per 1000 | |||||
| All‐cause mortality in ICU Follow‐up: 4 weeks§ | Study population | RR 1.12 | 1428 | ⊕⊕⊝⊝ | ||
| 145 per 1000 | 162 per 1000 | |||||
| Duration of ICU stay Follow‐up: not reported | Mean duration of ICU stay ranged from 8.6 to 11.1 days | MD 0.73 days higher | ‐ | 230 | ⊕⊕⊝⊝ | |
| Number of participants requiring blood transfusions Follow‐up: 48 hours after extubationǁ | Study population | RR 0.58 | 655 | ⊕⊕⊕⊝ | ||
| 112 per 1000 | 65 per 1000 | |||||
| Serious adverse events | Not reported | |||||
| *The risk in the intervention group (and its 95% confidence interval) is based on the assumed risk in the comparison group and the relative effect of the intervention (and its 95% CI). ‡Duration of follow‐up reported in two studies. §Duration of follow‐up reported in five studies. ǁDuration of follow‐up reported in one study. | ||||||
| GRADE Working Group grades of evidence. | ||||||
| aDowngraded by one level for risk of bias because of high risk of selection bias in one study, high risk of performance bias in eight studies, high risk of attrition bias in two studies, high risk of reporting bias in four studies, and high risk of other biases in three studies. bDowngraded by one level for imprecision because 95% CI was compatible with benefit and harm. cDowngraded by one level for risk of bias because of high risk performance bias in three studies and high risk of attrition bias in one study. dDowngraded by one level for risk of bias because of high risk of performance bias in three studies and high risk of attrition bias in one study. eDowngraded by one level for risk of bias because of high risk of performance bias in one study. fDowngraded by one level for risk of bias because of high risk of selection bias in one study, high risk of performance bias in two studies, high risk of attrition bias in one study, and high risk of other biases in one study. | ||||||
| Proton pump inhibitors compared with placebo or no prophylaxis for preventing upper gastrointestinal bleeding in people admitted to intensive care units | ||||||
| Patient or population: people admitted to intensive care units | ||||||
| Outcomes | Anticipated absolute effects* (95% CI) | Relative effect | № of participants | Certainty of the evidence | Comments | |
| Risk with placebo or no prophylaxis | Risk with proton pump inhibitors | |||||
| Clinically important upper GI bleeding Follow‐up: not reported | Study population | RR 0.63 | 237 | ⊕⊕⊝⊝ | ||
| 49 per 1000 | 31 per 1000 | |||||
| Nosocomial pneumonia Follow‐up: not reported | Study population | RR 1.24 | 227 | ⊕⊕⊝⊝ | ||
| 188 per 1000 | 233 per 1000 | |||||
| All‐cause mortality in ICU Follow‐up: not reported | Study population | RR 1.09 | 258 | ⊕⊕⊝⊝ | ||
| 134 per 1000 | 146 per 1000 | |||||
| Duration of ICU stay Follow‐up: not reported | Mean duration of ICU stay ranged from 8.6 to 11.1 days | MD 0.03 days lower | ‐ | 227 | ⊕⊕⊝⊝ | |
| Number of participants requiring blood transfusion | Not reported | |||||
| Serious adverse events | Not reported | |||||
| *The risk in the intervention group (and its 95% confidence interval) is based on the assumed risk in the comparison group and the relative effect of the intervention (and its 95% CI). | ||||||
| GRADE Working Group grades of evidence. | ||||||
| aDowngraded by one level for imprecision because 95% CI was compatible with benefit and harm. bDowngraded by one level for risk of bias because of high risk of performance bias in one study and high risk of attrition bias in one study. cDowngraded by one level for risk of bias because of high risk of performance bias in one study. | ||||||
| Antacids compared with placebo or no prophylaxis for preventing upper gastrointestinal bleeding in people admitted to intensive care units | ||||||
| Patient or population: people admitted to intensive care units | ||||||
| Outcomes | Anticipated absolute effects* (95% CI) | Relative effect | № of participants | Certainty of the evidence | Comments | |
| Risk with placebo or no prophylaxis | Risk with antacids | |||||
| Clinically important upper GI bleeding Follow‐up: not reported | Study population | RR 0.49 | 774 | ⊕⊕⊝⊝ | ||
| 170 per 1000 | 83 per 1000 | |||||
| Nosocomial pneumonia | Not reported | |||||
| All‐cause mortality in ICU Follow‐up: not reported | Study population | RR 1.01 | 300 | ⊕⊕⊝⊝ | ||
| 161 per 1000 | 163 per 1000 | |||||
| Duration of ICU stay | Not reported | |||||
| Number of participants requiring blood transfusions Follow‐up: not reported | Study population | RR 0.94 | 226 | ⊕⊕⊝⊝ | ||
| 45 per 1000 | 43 per 1000 | |||||
| Serious adverse events | Not reported | |||||
| *The risk in the intervention group (and its 95% confidence interval) is based on the assumed risk in the comparison group and the relative effect of the intervention (and its 95% CI). | ||||||
| GRADE Working Group grades of evidence. | ||||||
| aDowngraded by one level for inconsistency because of moderate heterogeneity; I² = 56%. bDowngraded by one level for risk of bias because of high risk of performance bias in five studies, high risk of detection bias in one study, high risk of reporting bias in two studies, and high risk of other biases in one study. cDowngraded by one level for imprecision because 95% CI was compatible with benefit and harm. dDowngraded by one level for risk of bias because of high risk of performance bias in two studies. eDowngraded by one level for risk of bias because of high risk of performance bias in one study. | ||||||
| Sucralfate compared with placebo or no prophylaxis for preventing upper gastrointestinal bleeding in people admitted to intensive care units | ||||||
| Patient or population: people admitted to intensive care units | ||||||
| Outcomes | Anticipated absolute effects* (95% CI) | Relative effect | № of participants | Certainty of the evidence | Comments | |
| Risk with placebo or no prophylaxis | Risk with sucralfate | |||||
| Clinically important upper GI bleeding Follow‐up: 15 days† | Study population | RR 0.53 | 598 | ⊕⊕⊕⊝ | ||
| 108 per 1000 | 57 per 1000 | |||||
| Nosocomial pneumonia Follow‐up: not reported | Study population | RR 1.33 | 450 | ⊕⊕⊝⊝ | ||
| 122 per 1000 | 163 per 1000 | |||||
| All‐cause mortality in ICU Follow‐up: 15 days† | Study population | RR 0.97 | 500 | ⊕⊕⊝⊝ | ||
| 165 per 1000 | 160 per 1000 | |||||
| Duration of ICU stay Follow‐up: not reported | Mean duration of ICU stay ranged from 8.6 to 11.1 days | MD 0.02 days lower | ‐ | 224 | ⊕⊕⊝⊝ | |
| Number of participants requiring blood transfusion Follow‐up: not reported | Study population | RR 0.60 | 200 | ⊕⊕⊝⊝ | ||
| 50 per 1000 | 30 per 1000 | |||||
| Serious adverse events | Not reported | |||||
| *The risk in the intervention group (and its 95% confidence interval) is based on the assumed risk in the comparison group and the relative effect of the intervention (and its 95% CI). | ||||||
| GRADE Working Group grades of evidence. | ||||||
| aDowngraded by one level for risk of bias because of high risk of performance bias in five studies, high risk of reporting bias in one study, and high risk of other biases in one study. bDowngraded by one level for imprecision because 95% CI was compatible with benefit and harm. cDowngraded by one level for risk of bias because of high risk of performance bias in two studies. dDowngraded by one level for risk of bias because of high risk of performance bias in three studies. eDowngraded by one level for risk of bias because of high risk of performance bias in one study. | ||||||
| H2 receptor antagonists compared with proton pump inhibitors for preventing upper gastrointestinal bleeding in people admitted to intensive care units | ||||||
| Patient or population: people admitted to intensive care units | ||||||
| Outcomes | Anticipated absolute effects* (95% CI) | Relative effect | № of participants | Certainty of the evidence | Comments | |
| Risk with proton pump inhibitors | Risk with H2 receptor antagonists | |||||
| Clinically important upper GI bleeding Follow‐up: not reported | Study population | RR 2.90 | 1636 | ⊕⊕⊝⊝ | ||
| 25 per 1000 | 73 per 1000 | |||||
| Nosocomial pneumonia Follow‐up: 30 days† | Study population | RR 1.02 | 1256 | ⊕⊕⊝⊝ | ||
| 123 per 1000 | 126 per 1000 | |||||
| All‐cause mortality in ICU Follow‐up: 30 days† | Study population | RR 0.96 | 1564 | ⊕⊕⊝⊝ | ||
| 158 per 1000 | 152 per 1000 | |||||
| Duration of ICU stay Follow‐up: not reported | Mean duration of ICU stay ranged from 7.7 to 23.6 days | MD 0.14 days higher | ‐ | 482 | ⊕⊕⊝⊝ | |
| Number of participants requiring blood transfusion Follow‐up: not reported | Study population | RR 1.98 | 575 | ⊕⊕⊕⊝ | ||
| 17 per 1000 | 35 per 1000 | |||||
| Serious adverse events | Not reported | |||||
| *The risk in the intervention group (and its 95% confidence interval) is based on the assumed risk in the comparison group and the relative effect of the intervention (and its 95% CI). | ||||||
| GRADE Working Group grades of evidence. | ||||||
| aDowngraded by one level for inconsistency because of substantial heterogeneity; I² = 59%. bDowngraded by one level for risk of bias because of high risk of selection bias in one study, high risk of performance bias in five studies, high risk of detection bias in two studies, and high risk of other biases in one study. cDowngraded by one level for imprecision because 95% CI was compatible with benefit and harm. dDowngraded by one level for risk of bias because of high risk of performance bias in four studies, high risk of detection bias in two studies, and high risk of other biases in one study. eDowngraded by one level for risk of bias because of high risk of performance bias in five studies, high risk of attrition bias in one study, and high risk of other biases in one study. fDowngraded by one level for risk of bias because of high risk of performance bias in three studies, high risk of attrition bias in one study, and high risk of other biases in one study. | ||||||
| H2 receptor antagonists compared with antacids for preventing upper gastrointestinal bleeding in people admitted to intensive care units | ||||||
| Patient or population: people admitted to intensive care units | ||||||
| Outcomes | Anticipated absolute effects* (95% CI) | Relative effect | № of participants | Certainty of the evidence | Comments | |
| Risk with antacids | Risk with H2 receptor antagonists | |||||
| Clinically important upper GI bleeding Follow‐up: 25 days† | Study population | RR 0.96 | 1700 | ⊕⊕⊝⊝ | ||
| 86 per 1000 | 82 per 1000 | |||||
| Nosocomial pneumonia Follow‐up: 25 days‡ | Study population | RR 1.05 | 581 | ⊕⊕⊝⊝ | ||
| 280 per 1000 | 294 per 1000 | |||||
| All‐cause mortality in ICU Follow‐up: 25 days§ | Study population | RR 1.01 | 1321 | ⊕⊝⊝⊝ | ||
| 163 per 1000 | 165 per 1000 | |||||
| Duration of ICU stay | Not reported | |||||
| Number of participants requiring blood transfusion Follow‐up: not reported | Study population | RR 2.49 | 744 | ⊕⊕⊕⊝ | ||
| 30 per 1000 | 75 per 1000 | |||||
| Serious adverse events | Not reported | |||||
| *The risk in the intervention group (and its 95% confidence interval) is based on the assumed risk in the comparison group and the relative effect of the intervention (and its 95% CI). ‡Duration of follow‐up reported in one study. §Duration of follow‐up reported in three studies. | ||||||
| GRADE Working Group grades of evidence. | ||||||
| aDowngraded by one level for imprecision because 95% CI was compatible with benefit and harm. bDowngraded by one level for risk of bias because of high risk of selection bias in two studies, high risk of performance bias in 12 studies, high risk of detection bias in two studies, and high risk of reporting bias in two studies. cDowngraded by one level for risk of bias because of high risk of selection bias in one study, high risk of performance bias in four studies, high risk of detection bias in one study, and high risk of reporting bias in one study. dDowngraded by one level for inconsistency because of moderate heterogeneity; I² = 53%. eDowngraded by one level for risk of bias because of high risk of selection bias in two studies, high risk of performance bias in nine studies, and high risk of reporting bias in one study. fDowngraded by one level for risk of bias because of high risk of selection bias in one study and high risk of performance bias in four studies. | ||||||
| H2 receptor antagonists compared with sucralfate for preventing upper gastrointestinal bleeding in people admitted to intensive care units | ||||||
| Patient or population: people admitted to intensive care units | ||||||
| Outcomes | Anticipated absolute effects* (95% CI) | Relative effect | № of participants | Certainty of the evidence | Comments | |
| Risk with sucralfate | Risk with H2 receptor antagonists | |||||
| Clinically important upper GI bleeding Follow‐up: 15 days† | Study population | RR 1.10 | 3316 | ⊕⊕⊝⊝ | ||
| 66 per 1000 | 73 per 1000 | |||||
| Nosocomial pneumonia Follow‐up: 25 days‡ | Study population | RR 1.22 | 3041 | ⊕⊕⊕⊝ | ||
| 189 per 1000 | 230 per 1000 | |||||
| All‐cause mortality in ICU Follow‐up: 25 days§ | Study population | RR 1.09 | 3178 | ⊕⊕⊝⊝ | ||
| 204 per 1000 | 222 per 1000 | |||||
| Duration of ICU stay Follow‐up: 2 weeks | Mean duration of ICU stay ranged from 7.9 to 13.7 days | MD 0.01 days higher | ‐ | 1791 | ⊕⊝⊝⊝ | |
| Number of participants requiring blood transfusion Follow‐up: until death or dischargeǁ | Study population | RR 1.25 | 1095 | ⊕⊕⊝⊝ | ||
| 35 per 1000 | 43 per 1000 | |||||
| Serious adverse events | Not reported | |||||
| *The risk in the intervention group (and its 95% confidence interval) is based on the assumed risk in the comparison group and the relative effect of the intervention (and its 95% CI). †Duration of follow‐up reported in five studies. ‡Duration of follow‐up reported in three studies. §Duration of follow‐up reported in six studies. ǁDuration of follow‐up reported in one study. | ||||||
| GRADE Working Group grades of evidence. | ||||||
| aDowngraded by one level for imprecision because 95% CI was compatible with benefit and harm. bDowngraded by one level for risk of bias because of high risk of selection bias in one study, high risk of performance bias in 20 studies, high risk of detection bias in two studies, high risk of attrition bias in two studies, high risk of reporting bias in four studies, and high risk of other biases in two studies. cDowngraded by one level for risk of bias because of high risk of selection bias in two studies, high risk of performance bias in 12 studies, high risk of detection bias in one study, high risk of attrition bias in one study, and high risk of reporting bias in two studies. dDowngraded by one level for risk of bias because of high risk of selection bias in two studies, high risk of performance bias in 16 studies, high risk of detection bias in one study, high risk of attrition bias in two studies, high risk of reporting bias in three studies, and high risk of other biases in one study. eDowngraded by one level for inconsistency because of considerable heterogeneity; I² = 82%. fDowngraded by one level for risk of bias because of high risk of performance bias in four studies and high risk of attrition bias in one study. gDowngraded by one level for risk of bias because of high risk of performance bias in eight studies, high risk of attrition bias in one study, high risk of reporting bias in one study, and high risk of other biases in one study. | ||||||
| Antacids compared with sucralfate for preventing upper gastrointestinal bleeding in people admitted to intensive care units | ||||||
| Patient or population: people admitted to intensive care units | ||||||
| Outcomes | Anticipated absolute effects* (95% CI) | Relative effect | № of participants | Certainty of the evidence | Comments | |
| Risk with sucralfate | Risk with antacids | |||||
| Clinically important upper GI bleeding Follow‐up: 21 days† | Study population | RR 1.00 | 1772 | ⊕⊕⊝⊝ | ||
| 66 per 1000 | 66 per 1000 | |||||
| Nosocomial pneumonia Follow‐up: 25 days‡ | Study population | RR 1.04 | 996 | ⊕⊕⊝⊝ | ||
| 232 per 1000 | 242 per 1000 | |||||
| All‐cause mortality in ICU Follow‐up: 25 days† | Study population | RR 1.15 | 1249 | ⊕⊕⊝⊝ | ||
| 206 per 1000 | 237 per 1000 | |||||
| Duration of ICU stay Follow‐up: not reported | Mean duration of ICU stay ranged from 10.4 to 16.8 days | MD 2.5 days lower | ‐ | 227 | ⊕⊕⊝⊝ | |
| Number of participants requiring blood transfusion Follow‐up: until discharge or onset of GI bleeding§ | Study population | RR 0.73 | 667 | ⊕⊕⊝⊝ | ||
| 52 per 1000 | 38 per 1000 | |||||
| Serious adverse events | Not reported | |||||
| *The risk in the intervention group (and its 95% confidence interval) is based on the assumed risk in the comparison group and the relative effect of the intervention (and its 95% CI). ‡Duration of follow‐up reported in two studies. §Duration of follow‐up reported in one study. | ||||||
| GRADE Working Group grades of evidence. | ||||||
| aDowngraded by one level for imprecision because 95% CI was compatible with benefit and harm. bDowngraded by one level for risk of bias because of high risk of selection bias in three studies, high risk of performance bias in 12 studies, high risk of detection bias in one study, high risk of attrition bias in one study, high risk of reporting bias in two studies, and high risk of other biases in two studies. cDowngraded by one level for risk of bias because of high risk of performance bias in four studies, high risk of detection bias in one study, high risk of reporting bias in one study, and high risk of other biases in one study. dDowngraded by one level for risk of bias because of high risk of selection bias in three studies, high risk of performance bias in eight studies, high risk of attrition bias in one study, high risk of reporting bias in one study, and high risk of other biases in one study. eDowngraded by one level for risk of bias because of high risk of attrition bias in one study. fDowngraded by one level for risk of bias because of high risk of selection bias in one study, high risk of performance bias in six studies, and high risk of other biases in one study. | ||||||
Background
A glossary of the medical terms used in this review can be found in Appendix 1.
Description of the condition
Upper gastrointestinal (GI) bleeding due to stress ulcers is a major contributor to increased morbidity and mortality in people admitted to intensive care units (ICUs). Stress ulceration refers to GI mucosal injury related to the stress of being critically ill. The injury may vary from diffuse superficial ulcers to deep, bleeding lesions (Neligan 2006). The incidence of bleeding related to stress ulcers in critically ill people on mechanical ventilators ranges from less than 1% to 6% of patients admitted to ICU (Alhazzani 2013; Bardou 2015; Krag 2015). A study using the HEmorrhage MEasurement Tool (HEME) to assess GI bleeding in ICU patients observed that 5.2% of those with stress ulcers had major bleeds (Arnold 2007). ICU patients with major bleeding as a result of stress ulceration had mortality rates approaching 40% to 50% (Bardou 2015). Over the past few decades, however, with improved standards of care, the incidence of stress‐induced GI bleeding in ICUs and related mortality has decreased (Krag 2015). Hence, not all critically ill patients need prophylaxis (Penner 2005). Gastric bleeding can be diagnosed from a drop in blood pressure necessitating blood transfusion and a rapid heart rate (haemodynamic instability), 'coffee ground' aspiration, vomiting of blood (haematemesis), or passage of dark stools (melena) (Dorland 1995).
Bleeding from stress ulcers
Bleeding from stress ulcers may be trivial or profuse. Trivial bleeds may be detected only through laboratory tests, and profuse bleeding results in overt manifestations. Cook 1998a defined a clinically important bleed as overt bleeding with one of four features reflecting haemodynamic instability and blood loss. These include the following.
-
Drop in systolic or diastolic blood pressure (blood pressure during heart contractions or between two heartbeats) of 20 mmHg or more within 24 hours after upper GI bleeding.
-
Postural decrease in systolic blood pressure of 10 mmHg and accelerated pulse rate of 20 beats per minute; or evidence of significant blood loss (this may be difficult to demonstrate in intubated patients).
-
A drop in haemoglobin concentration of at least 2 g/dL needing two units of packed cell transfusion within 24 hours of the bleed.
-
Failure of a rise in haemoglobin concentration (in g/dL) of at least the number of units of blood transfused minus two.
Risk factors
Prophylaxis is often recommended for patients with major risk factors. These include:
-
patients who have a coagulopathy (a disorder of blood clotting); and
-
patients who require mechanical ventilation for longer than 48 hours.
In addition, prophylaxis is often recommended for patients who have two or more of the following risk factors for stress ulcers (AHSP 1999; Pfeffer 2007).
-
ICU stay longer than one week.
-
Sepsis or abnormally low blood pressure (hypotension).
-
Failure of the liver or kidneys.
-
History of peptic ulcer disease.
-
Use of high‐dose steroids (> 250 mg/d of hydrocortisone or equivalent).
-
Burns over > 35% of total body surface area.
-
Immediately after organ transplantation.
-
Head trauma with Glasgow Coma Scale score < 10.
-
Multiple trauma.
-
Occult bleeding for six days or longer.
Pathophysiology of stress ulcers
The aetiology ‐ cause or set of causes for a disease ‐ and pathophysiology of stress ulcers in ICU patients appear to be multi‐factorial. Normally, the splanchnic microcirculation and the gastric mucosa protect the mucosal epithelium ‐ the tissue lining the outer surface of organs ‐ from gastric acids, wherein bicarbonate ions secreted by the mucosa neutralise hydrogen ions. Reduced blood flow due to splanchnic hypoperfusion in critically ill patients, with resultant ischaemia and impaired cell oxygenation, releases nitric oxide (by increased levels of enzyme nitric oxide synthase) and oxygen free radicals and reduces prostaglandin synthesis. These mechanisms result in inflammation and cell death. Reperfusion hyperaemia due to elevated nitric oxide levels contributes to further cell death. Slowed upper gastric mobility and reduced secretion of bicarbonate by the gastric mucosa with resultant prolonged exposure of the damaged mucosa to gastric acids, as well as a decrease in mucosal repair mechanisms, also contribute to ulceration (Dorland 1995; Spirt 2006).
Consequences of upper GI bleeding
Major GI bleeding can be life‐threatening and can result in death. Minor bleeding can result in an increased need for blood transfusion and its attendant risks. It is therefore necessary to evaluate strategies that decrease the incidence of GI bleeding.
Complications of stress ulcer prophylaxis: ventilator‐associated pneumonia
Ventilator‐associated pneumonia is a common complication in mechanically ventilated patients. The reported incidence of ventilator‐associated pneumonia ranges from 1% to 28% (Chastre 2002; Rahbar 2006). A systematic review of observational studies and randomised studies revealed that the incidence of ventilator‐associated pneumonia ranged from 10% to 20% in people undergoing mechanical ventilation for longer than 48 hours (Safdar 2005).
Risk factors for ventilator‐associated pneumonia
The risk of ventilator‐associated pneumonia increases with the duration of mechanical ventilation continuing over 48 hours, but the risk is additionally elevated in people with contributory medical conditions. Additional sources of infection from tubes passing the trachea (endotracheal) or ventilator circuits and other feeding tubes, or from improper measures to prevent nosocomial infection in ICU staff, increase the risk of ventilator‐associated pneumonia (Augustyn 2007; CDC 2003; Masterton 2008).
The disadvantage of stress ulcer prophylaxis is that many of the interventions used for suppression of gastric acid raise the pH of gastric contents, alter gastric flora, and promote tracheobronchial colonisation and gastric colonisation of pathogenic bacteria ‐ the aspiration of which causes nosocomial pneumonia or ventilator‐associated pneumonia (Atherton 1978; Cook 1998b; Craven 1986). In addition to increasing mortality in critically ill patients, the afore mentioned effects can prolong length of hospital stay and increase costs (Safdar 2005). The elevated risk of developing ventilator‐associated pneumonia associated with stress ulcer prophylaxis may therefore offset the potential benefits of such therapy.
Diagnosis of ventilator‐associated pneumonia
The criteria used to establish the diagnosis of ventilator‐associated pneumonia vary. Traditionally, clinical features (fever, cough, and purulent sputum) combined with radiological evidence for pneumonia (new lung infiltrates or progression of infiltrates) and elevated white blood cell count in a patient on mechanical ventilation provide suggestive evidence. Confirmatory cultures from sputum or aspirates from the trachea or pleural fluid in such individuals increase the sensitivity of the diagnosis of bacterial causes of pneumonia. However, these traditional methods are not specific in ventilator‐associated pneumonia, and blood cultures are reported to have low sensitivity. Standardised techniques used in clinical research studies have included quantitative culture of specimens obtained from endotracheal aspirates and use of protected specimen brush (PSB) specimens after bronchoalveolar lavage ‐ a medical procedure to examine the lungs for lung disease ‐ or via blind catheterisation (non‐bronchoscopic protected bronchoalveolar lavage or protected specimen brush specimens). These techniques have improved the sensitivity and specificity of the diagnosis of ventilator‐associated pneumonia (CDC 2003; Masterton 2008).
Criteria commonly used to diagnose ventilator‐associated pneumonia include the clinical pulmonary infection score (CPIS), which has evolved from the original four criteria (fever, leucocytosis, positive sputum culture, and worsening chest X‐ray changes) to six criteria (plus increased oxygen requirement and semi‐quantitative cultures of tracheal aspirates with or without Gram stain). Criteria added to the CPIS help practitioners in selecting, modifying, and monitoring therapy, although their diagnostic accuracy is similar to that of traditional criteria (Masterton 2008).
Mortality from ventilator‐associated pneumonia
Individuals who contract ventilator‐associated pneumonia are already critically ill; therefore the death rate from ventilator‐associated pneumonia is high. Reported mortality rates range from 24% to 76%, with higher mortality attributed to specific situations (such as underlying disease and organ failure) or types of causative organisms (such as Pseudomonas or Acinetobacter) (CDC 2003; Chastre 2002). Mortality is doubled in critically ill patients with ventilator‐associated pneumonia when compared with those without ventilator‐associated pneumonia (Safdar 2005).
It is considered prognostically important to distinguish early‐onset from late‐onset ventilator‐associated pneumonia. The Working Party on Hospital Acquired Pneumonia of the British Society of Antimicrobial Chemotherapy defined the former as occurring during the first four days, and the latter as occurring five or more days after the start of mechanical ventilation. Early‐onset ventilator‐associated pneumonia is usually less severe and carries a better prognosis than late‐onset ventilator‐associated pneumonia (Chastre 2002; Masterton 2008).
Description of the intervention
Several pharmacological interventions are used for treatment and prevention of gastric ulcers, such as those that block histamine‐2 receptors (H2 receptor antagonists) (ranitidine, cimetidine, famotidine, etc.), proton pump inhibitors (esomeprazole, rabeprazole, omeprazole, lansoprazole, etc.), prostaglandin analogues (misoprostol), anticholinergics (pirenzepine, propantheline, etc.), antacids (sodium bicarbonate, magnesium hydroxide, etc.), and ulcer protectives (sucralfate, bismuth, etc.). Non‐pharmacological interventions such as enteral nutrition and early removal of tubes can also be used.
How the intervention might work
The interventions used in stress ulcer prophylaxis differ with respect to their mechanism of action, additional protective effects on the gastric mucosa, and effects on increasing gastric luminal pH and resultant potential to increase gastric bacterial colonisation, as well as their side effect profile (Mutlu 2001).
Antacids neutralise gastric acid in a dose‐dependent manner and raise the gastric pH. They have other beneficial cytoprotective effects but may cause an increase in magnesium and diarrhoea (magnesium‐based antacids) or may reduce phosphates and cause constipation (aluminium‐based antacids). Nursing costs are also increased owing to the need to administer antacids at frequent intervals (often hourly).
H2 receptor antagonists are believed to inhibit gastric acid secretion by blocking histamine receptors but have no additional cytoprotective effects and can cause thrombocytopaenia, interstitial nephritis, and confusion (especially in the elderly). Rapid intravenous infusions can cause bradycardia ‐ a slow heart rate ‐ and abnormally low blood pressure (hypotension), and many cytochrome P‐450‐mediated drug interactions and effects may occur (particularly with cimetidine).
Proton pump inhibitors act by inhibiting the final stage of gastric acid production but provide no additional cytoprotective effects on the gastric mucosa and do confer cytochrome P‐450‐mediated effects. However, it has been found that proton pump inhibitors may be associated with increased risk of Clostridium difficile diarrhoea (Arriola 2016; Cunningham 2003; Kwok 2012; Mutlu 2001). Yet, randomised controlled trials (RCTs) have reported very few data on this adverse event (Alhazzani 2017).
Prostaglandin analogues inhibit acid secretion and promote mucus and bicarbonate secretion that makes gastric contents alkaline, meaning that the pH is greater than 7, but they can cause diarrhoea and abdominal pain. However, they need to be administered four times daily.
Ulcer protective agents, such as sucralfate and colloidal bismuth subcitrate, create a barrier between gastric acid and the gastric mucosa by coating the mucosa. These agents have additional cytoprotective effects and do not effectively alter gastric pH, but they may cause constipation and may interfere with the absorption of certain antibacterial agents, such as tetracyclines and quinolones (Mutlu 2001).
Enteral nutrition may be delivered orally or through a feeding tube and helps to maintain gut integrity, modulate stress and the systemic immune response, and attenuate disease severity. Enteral nutrition might also reduce bacterial translocation and infective complications by maintaining the structural integrity of the gut. In addition, enteral nutrition is considered an effective means of providing stress ulcer prophylaxis, although it may raise gastric pH and theoretically increase rates of nosocomial infection or neutralise the effects of ulcer protective agents (Hinds 1999; McClave 2009).
Why it is important to do this review
ICU patients are at risk of developing stress ulcers. A proportion of these patients will develop clinically important bleeding, and the mortality rate in such patients is high (48.5% to 65%). Several RCTs, non‐randomised studies, and cohort studies have studied the role of different stress ulcer prophylactic drugs and strategies for prevention of stress ulcers and thereby upper GI bleeding. Stress ulcer prophylaxis is, however, a risk factor for the development of ventilator‐associated pneumonia. Thus the benefits of stress ulcer prophylaxis need to be balanced against this risk.
Previous systematic reviews and meta‐analyses were narrowed to comparisons of two interventions, were inconclusive, or generated conflicting results (Cook 1994b; Cook 1995b; Cook 1996; Lin 2010; Messori 2000). These systematic reviews did not include commonly used proton pump inhibitors. Several more recent systematic reviews investigated the risk‐benefit profile of bleeding prophylaxis in ICU patients (Alquraini 2017; Alshamsi 2016; Krag 2014; Pilkington 2012). They most often investigated the effects of a single drug class versus another drug class.
Guidelines for the management of hospital‐acquired pneumonia in the United Kingdom have been produced by the working party on hospital‐acquired pneumonia of the British Society for Antimicrobial Chemotherapy (Masterton 2008). This group considered the results of a systematic review ‐ Collard 2003 ‐ and a narrative synthesis of seven meta‐analyses (Cook 1991; Cook 1995; Cook 1996; Messori 2000; Tryba 1991; Tryba 1991b; Tryba 1995). Analyses yielded discordant results but overall suggested that risk of developing ventilator‐associated pneumonia was reduced when patients were given sucralfate compared with H2 receptor antagonists (although not when compared with placebo), and evidence from one study suggested that risk of clinically significant bleeding was increased when sucralfate was given to prevent upper GI bleeding compared with H2 receptor antagonists. Guidelines recommended that stress ulcer prophylaxis should be avoided in people on mechanical ventilation to preserve gastric function and reduce ventilator‐associated pneumonia. If stress ulcer prophylaxis is indicated, then the advantage of sucralfate in reducing the incidence of ventilator‐associated pneumonia needs to be balanced with its increased risk of clinically significant upper GI bleeding (Masterton 2008).
A guideline for stress ulcer prophylaxis in the intensive care unit provided by the Danish Society of Anesthesiology and Intensive Care Medicine recommended, first, that stress ulcer prophylaxis should not be used as a routine measure in all critically ill patients and, second, that proton pump inhibitors should be used over H2 receptor antagonists (Rorbaek Madsen 2014).
A guideline from 1999 released by the American Society of Health‐System Pharmacists recommended that antacids, H2 receptor antagonists, or sucralfate should be administered to prevent stress ulcers in adults (Armstrong 1999). An updated version of the guideline is expected in 2018. The Eastern Association for the Surgery of Trauma released a guideline in 2008 that recommended use of H2 receptor antagonists, cytoprotective agents, and some proton pump inhibitors as prophylactic treatment against stress ulcers and recommended against use of antacids (Guillamondegui 2008).
Still, a review of current evidence on different pharmacological and non‐pharmacological interventions for prophylaxis of upper GI bleeding comparing them versus no active treatment or other active treatments is needed to provide a comprehensive and systematic overview of the research evidence and the benefits and harms of bleeding prophylaxis in patients admitted to the ICU.
Objectives
To assess the effect and the risk‐benefit profile of interventions used to prevent upper GI bleeding in people admitted to level two and level three ICUs. These levels include all sick patients requiring support for organ failure/dysfunction in the ICU (Goldhil 2002).
-
Level two ICUs are for patients requiring detailed observation or intervention including support for a single failing organ system or postoperative care and patients stepping down from higher levels of care.
-
Level three ICUs are for patients requiring advanced respiratory support alone or basic respiratory support together with support for at least two organ systems.
Methods
Criteria for considering studies for this review
Types of studies
We followed methods as described in the review protocol (George 2010). We included randomised controlled trials (RCTs) and quasi‐randomised controlled studies.
Types of participants
People (any age and gender) admitted to level two or level three ICUs for longer than 48 hours. We excluded studies in which participants were admitted to the ICU primarily for management of upper GI bleeding.
Types of interventions
We compared the following interventions administered by any route and at any dose.
Drugs that reduce gastric acid secretion
-
H2 receptor antagonists: ranitidine, cimetidine, famotidine, roxatidine, nizatidine, loxatidine, etc.
-
Proton pump inhibitors: esomeprazole, rabeprazole, omeprazole, lansoprazole, pantoprazole, dexlansoprazole, etc.
-
Prostaglandin analogues: misoprostol, enprostil, rioprostil, etc.
-
Anticholinergics: pirenzepine, propantheline, oxyphenonium, doxepin, trimipramine, etc.
-
Potassium‐competitive acid blockers
Drugs that neutralise gastric acid (antacids)
-
Systemic: sodium bicarbonate, sodium citrate
-
Non‐systemic: magnesium hydroxide, magnesium trisilicate, aluminium hydroxide gel, magaldrate, calcium carbonate
Ulcer protectives
-
Sucralfate
-
Colloidal bismuth subcitrate
Ulcer healing drugs
-
Carbenoxolone sodium, deglycyrrhizinated liquorice
Others
-
Enteral and parenteral nutrition
-
Any other intervention used to reduce upper GI bleeding
-
Combinations of interventions (e.g. omeprazole‐bicarbonate combinations)
-
No prophylaxis
-
Placebo
We compared each class of drugs versus placebo or no prophylaxis (e.g. H2 receptor antagonists vs placebo or no prophylaxis), and we compared all classes of drugs against one another (e.g. H2 receptor antagonists vs proton pump inhibitors). We did not compare different drugs within a single class versus one another (e.g. ranitidine vs cimetidine) because this type of comparison did not fall within the focus of this review.
Types of outcome measures
Primary outcomes
Clinically important GI bleeding
-
For the purposes of this review, we used the definition used by study authors to define clinically important upper GI bleeding. We recorded details of the definition used
Secondary outcomes
Nosocomial pneumonia
-
Nosocomial pneumonia including ventilator‐associated pneumonia is defined as pneumonia contracted in a hospital (nosocomial) by a patient on mechanical ventilatory support (by endotracheal tube or tracheostomy) for longer than 48 hours (Masterton 2008; Mayhall 2001)
-
Criteria used in the review for the diagnosis of ventilator‐associated pneumonia will be those used by study authors. This outcome also includes incidence of nosocomial pneumonia because definitions used varied across study reports
Mortality
-
All‐cause mortality in ICU
-
All‐cause mortality in hospital
Duration of ICU stay
Duration of intubation
-
This also includes duration of mechanical ventilation because definitions varied across study reports.
Blood transfusion
-
Number of participants requiring transfusion
-
Number of units of blood transfused
Adverse events of interventions
-
Serious adverse events leading to discontinuation of treatment, prolongation of ICU stay, or disability
-
Any other adverse event (e.g. thrombocytopaenia related to H2 receptor antagonists, any other adverse event).
Search methods for identification of studies
We attempted to identify all relevant RCTs and quasi‐randomised studies (in which allocation to interventions was attempted but could be predicted) for inclusion, regardless of date or language of publication or publication status (published, unpublished, or in press) We also looked for ongoing studies.
We excluded non‐randomised studies.
Electronic searches
With the help of the Cochrane Information Specialist, we searched the following databases up to 23 August 2017, using the search terms listed in Appendix 2: MEDLINE; Embase; the Cochrane Central Register of Controlled Trials (CENTRAL), published in the Cochrane Library (2017, Issue 8); the Cochrane Upper Gastrointestinal and Pancreatic Disease Group Specialised Register; and Latin American Caribbean Health Sciences Literature (LILACS).
Searching other resources
We searched the reference lists of all included studies and of relevant systematic reviews and meta‐analyses to identify relevant studies. We also searched the World Health Organization (WHO) International Clinical Trials Registry Platform search portal (http://apps.who.int/trialsearch/) for ongoing clinical studies up to 23 August 2017. In addition, we searched all available conference proceedings until 2012 for relevant RCTs from the World Federation of Societies of Intensive and Critical Medicine (http://www.world‐critical‐care.org/) and the World Gastroenterology Organisation (http://www.worldgastroenterology.org/about‐wgo.html) websites. We contacted individual researchers working in this field, as well as organisations and pharmaceutical companies, to identify unpublished and ongoing studies.
Data collection and analysis
Selection of studies
Two review authors from a pool of four (ATG, IT, LEF, and RK) independently screened each citation and abstract yielded by the search strategy to identify potentially eligible studies. Two review authors from a pool of four (IT, LEF, PT, and JVP) independently checked the list of excluded studies to verify the appropriateness of reasons for their exclusion. We obtained and assessed full reports of potentially eligible studies for inclusion in the review based on the inclusion and exclusion criteria. If eligibility was unclear because information was inadequate or unclear, we attempted to contact study authors for clarification. Two review authors (IT, JJM) arranged for abstracts of articles written in non‐English languages to be translated for assessment against inclusion. We resolved disagreements through discussion and scrutinised each study report to ensure that RCTs with multiple publications were included only once by linking additional reports to the original study report included in the reference list of included studies. We documented reasons for exclusion of studies in the Characteristics of excluded studies tables.
Data extraction and management
Two review authors from a pool of four (IT, LEF, ATG, and RK) independently extracted data from studies using pre‐tested data extraction forms. We resolved disagreements related to data extraction by referring to the study report and by having discussions. When available, we extracted data on the following.
Population characteristics
Type of ICU care (level two or three); inclusion and exclusion criteria for participants, as well as their age and gender and the number of participants randomised to each group and included in the study overall.
Interventions
Details of interventions given (dose, route, duration); additional interventions used in each arm (e.g. enteral feeds, antibiotics).
Outcomes
Definitions or criteria used for the diagnosis of clinically significant upper GI bleeding (and the source of bleeding), pneumonia (and types of pathogens and sensitivity patterns, if available) and ventilator‐associated pneumonia; number of participants experiencing each outcome; and numbers of dropouts and withdrawals with reasons. When data were insufficient or missing, we attempted to contact the study authors.
For continuous outcomes, we extracted arithmetic mean values, standard deviations, and number of participants in each study arm for whom the outcome was assessed. We noted whether numbers assessed in the study were the numbers of participants who completed the study or the numbers randomised. If medians were reported, we attempted to extract ranges or interquartile ranges.
Assessment of risk of bias in included studies
Two review authors from a pool of six (IT, LEF, ATG, RK, PT, and JVP) independently assessed the risk of bias of each included study. We resolved disagreements by referring to the study report, by corresponding with the authors of the report, and by having discussions. We assessed each study on the domains of sequence generation; allocation concealment; blinding of participants, personnel, and outcome assessors; incomplete outcome data; selective reporting; and other sources of bias. We judged the risk of bias as 'high', 'low', or 'unclear', using guidelines (Higgins 2011) to make these judgements. We recorded this information for each included study in a 'Risk of bias' table in Review Manager (RevMan) 5.2 and summarised the risk of bias for each study in a summary figure and graph. We classified a study's overall risk of bias as high if the study had high risk of bias in any domain. Likewise, we classified the risk of bias as unclear if the study had no high risk of bias and had unclear risk of bias in any domain. Last, we classified a study's overall risk of bias as low if the study had low risk of bias in all domains.
We judged all included studies as being at low risk for detection bias for objectively determined outcomes of 'clinically important GI bleeding' and 'nosocomial pneumonia' if detected through a clear definition mentioned in the study, or if blinding of outcome assessors was clearly described. For other outcomes of interest, we judged the studies as having low risk of detection bias if these outcomes were mainly objective in nature. We judged studies as having unclear risk of detection bias on an outcome basis if they did not address upper GI bleeding or nosocomial pneumonia.
We classified studies that did not include a placebo arm and used different modes of administering study interventions as having high risk of performance bias, as it would not have been possible to blind study personnel and participants.
Measures of treatment effect
We used risk ratios for dichotomous outcomes and mean differences for continuous outcomes, with their respective 95% confidence intervals.
Unit of analysis issues
When outcomes were reported both at baseline and at follow‐up or at study endpoints, we used endpoint data preferentially over scores of the mean change from baseline because the standard deviation of this mean change for each treatment group often was not reported. Had only change scores been available from any study, we would have combined endpoint and change scores.
If studies had reported count data, we would have extracted the total number of events in each group, the total extent of person‐time at risk in each group, and the total number of participants in each group. If this information had not been available, we would have attempted to extract alternative summary statistics such as rate ratios and confidence intervals, if available. If count data had been presented as dichotomous outcomes, we would have extracted the number of participants in each intervention group and the number of participants in each intervention group who experienced at least one event. If count data were presented as continuous outcomes or as time‐to‐event outcomes, we would have attempted to extract the same information as outlined for continuous and time‐to‐event outcomes.
In case we would have identified any cluster‐randomised studies, and if their results had been adjusted for clustering, we would have combined the adjusted measures of effects. If results were not adjusted for clustering, we would have attempted to adjust the results by multiplying standard errors of the estimates by the square root of the design effect when the design effect was calculated as DEff = 1 + (M ‐ 1) ICC, where M is the average cluster size and ICC is the intracluster coefficient. If this was not possible, we would not have combined them in a meta‐analysis but would have presented these results in an additional table.
Dealing with missing data
We attempted to obtain missing data from study authors. When possible, we extracted data to allow an intention‐to‐treat analysis in which all randomised participants would be analysed in the groups to which they were originally assigned. Our primary analysis was a complete case analysis. If we noted a discrepancy in the numbers randomised and the numbers analysed for each treatment group, we calculated the percentage lost to follow‐up in each group and reported this information. If dropouts exceeded 10% for any study, we assigned the worst outcome to those lost to follow‐up for dichotomous outcomes and assessed the impact of this by performing sensitivity analyses.
For continuous data that were missing standard deviations, we calculated these from other available data such as standard errors, or we imputed them using the methods suggested in Deeks 2011. We did not make any assumptions about loss to follow‐up for continuous data, and we will analyse results for those who complete the study.
Assessment of heterogeneity
We assessed heterogeneity between studies by visually examining the forest plot to check for overlapping confidence intervals and by using the Chi² test for homogeneity with a 10% level of significance and the I² statistic. Although we acknowledge that this cutoff is arbitrary, we interpreted I² values from 0% to 40% as possibly not important, from 30% to 60% as moderate heterogeneity, from 50% to 90% as substantial heterogeneity, and from 75% to 100% as considerable heterogeneity, depending on whether inconsistency in results was due to differences in the direction of effect estimates between studies rather than to differences in the magnitude of effect estimates favouring an intervention, as well as the strength of evidence for heterogeneity seen in the P value for the Chi² test for heterogeneity (Deeks 2011).
Assessment of reporting biases
Apart from assessing the risk of selective outcome reporting considered under Assessment of risk of bias in included studies, we assessed the likelihood of potential publication bias by using funnel plots, provided that at least 10 studies were included in a meta‐analysis.
Data synthesis
We first compared interventions used to prevent upper GI bleeding versus placebo or no intervention in people admitted to intensive care units. We stratified analyses according to drug class of the active intervention used versus placebo or no treatment. We included three‐armed studies in these comparisons by splitting the comparison arm in two, as suggested in the Cochrane Handbook for Systematic Reviews of Interventions (Higgins 2011a). We then compared specific interventions or combinations of interventions grouped under drug classes. For three‐armed studies, we considered only the two relevant arms in comparisons of drug classes.
We synthesised comparable data using the Mantel‐Haenszel method to derive pooled, weighted risk ratios in fixed‐effect meta‐analyses. We combined continuous data summarised by arithmetic means and standard deviations using the weighted mean difference. We used the random‐effects model for data synthesis when we identified heterogeneity as significant (see above) and found that it could not be explained by subgroup analyses (see below).
Had continuous data been summarised using geometric means, we would have combined them on the log scale using the generic inverse variance method and would have reported them on the natural scale. We would have compared count data using rate ratios when the total number of events in each group and the total extent of person‐time at risk in each group were available, or by using relative risks or weighted mean differences when data were presented in dichotomous or continuous form, respectively. We would have combined hazard ratios from survival data on the log scale by using the inverse variance method and would have presented them on the natural scale.
Subgroup analysis and investigation of heterogeneity
If data permitted, we intended to carry out the following subgroup analyses for each comparison.
-
Presence or absence of bleeding disorders (e.g. coagulopathies, defined as thrombocyte count < 50/nL, partial thromboplastin time (PTT) > 2 times the upper limit of the normal range, international normalised ratio (INR) > 1.5).
-
Pneumonia at the time of ICU admission.
-
Adults (≥ 18 years to 65 years) versus older adults (≥ 65 years) versus children and adolescents (< 18 years).
-
Use of co‐interventions that may affect outcomes (e.g. enteral feeds, prophylactic antibiotics, other measures used for selective decontamination of the digestive tract (SDD)).
For the outcome of nosocomial pneumonia, we planned to further subgroup data by development of early‐onset nosocomial pneumonia (within four days on ventilation) or late‐onset nosocomial pneumonia (five or more days on ventilation), or by rating data as unclear (if this subgrouping is not possible by using information in the report or by contacting study authors). We identified no studies within the same comparison that distinguished between early and late onset of pneumonia and determined that a subgroup analysis was not feasible.
Sensitivity analysis
We conducted sensitivity analyses to investigate robustness of results for the primary outcome by evaluating outcomes in studies with low risk of bias versus outcomes in studies with high or unclear risk of bias. We also undertook sensitivity analyses if studies reported dropout rates of 10% or greater, to ascertain differences in outcomes of intention‐to‐treat (ITT) analysis and analysis of completers. We assessed robustness of results using published and validated criteria to diagnose clinically important bleeding and nosocomial pneumonia.
Summarising results
We imported data for the following outcomes from Review Manager (RevMan) 5.2 into the Guideline Development Tool (GRADEpro 2015) and used this information to construct 'Summary of findings' (SoF) tables and to guide the conclusions of this review. We considered the following outcomes as critically important or important for clinical decisions for inclusion in these summary tables.
-
Clinically important upper GI bleeding.
-
Nosocomial pneumonia.
-
All‐cause mortality in ICU.
-
Duration of ICU stay.
-
Number of participants requiring blood transfusions.
-
Serious adverse events.
Results
Description of studies
See Characteristics of included studies,Characteristics of excluded studies,Characteristics of ongoing studies, and Characteristics of studies awaiting classification.
Results of the search
We retrieved 2802 records through database searching between July 2010 and August 2017. We identified 43 additional records from other sources, which included review of our personal files and records, correspondence with experts in the field, and review of bibliographies of review articles. After resolving duplicates, the final list included 2292 records. After discarding reports that clearly were not relevant, we identified 199 records as potentially eligible for inclusion. In the end, we included in the review 129 records reporting on 121 studies, of which 12 were ongoing studies and two were awaiting classification. We excluded 71 records. The process of study selection is described in Figure 1.

PRISMA flow chart of included studies.
Included studies
We have described in the Characteristics of included studies tables the 107 competed studies that met the inclusion criteria for this review and have summarised them below. All studies took place in an ICU setting and included critically ill adults or children or both.
Participants, interventions, and comparisons
The 107 studies randomised a total of 15,057 participants to 27 comparisons involving 14 different treatment modalities. Most studies specifically mentioned that they randomised individuals who had no history of GI haemorrhage or peptic ulcer or gastritis or were not undergoing treatments for any of these conditions. The included studies included participants admitted to intensive care units, although the level of ICU into which participants were admitted was not clearly mentioned. Neither was a duration of ICU admission ≥ 48 hours ‐ a necessary inclusion criterion across studies. Among the included studies were five exclusively paediatric studies (Behrens 1994; Kuusela 1997; Lacroix 1986; Lopez‐Herce 1992; Yildizdas 2002); six quasi‐randomised studies (Borrero 1984; Borrero 1985; Borrero 1986; Brophy 2010; Martin 1980; Weigelt 1981); and seven studies reported as conference abstracts only (Fink 2003; Fogas 2013; Larson 1989; Luk 1982; Phillips 1998; Selvanderan 2016; Wee 2013).
Interventions versus placebo or no prophylaxis
We included a total of 32 studies involving 2151 individuals in any interventional arm (H2 receptor antagonists, antacids, sucralfate, proton pump inhibitors, prostaglandin analogues, or anticholinergics) (n = 1249) or in the placebo or no prophylaxis arms (n = 902).
H2 receptor antagonists versus placebo or no prophylaxis
We included a total of 26 studies involving 2210 individuals in the H2 receptor antagonist (ranitidine, cimetidine, or famotidine) arm (n = 1123) or in the placebo or no prophylaxis arm (n = 1087) (Apte 1992; Basso 1981; Ben‐Menachem 1994; Burgess 1995; Chan 1995; Darlong 2003; Friedman 1982; Groll 1986; Halloran 1980; Hanisch 1998; Kantorova 2004; Karlstadt 1990; Kaushal 2000; Lacroix 1986; Larson 1989; Lopez‐Herce 1992; Luk 1982; Martin 1993; Metz 1993; Peura 1985; Powell 1993; Reusser 1990; Rohde 1980; van den Berg 1985; Yildizdas 2002; Zinner 1981). Enteral feeding/nasogastric feeding/parenteral feeding was administered to many participants in the following studies: Apte 1992; Ben‐Menachem 1994; Darlong 2003; Halloran 1980; Kantorova 2004; Karlstadt 1990; Martin 1993; Peura 1985; and van den Berg 1985.
Proton pump inhibitors versus placebo or no prophylaxis
We included a total of five studies randomising 482 individuals to a proton pump inhibitor (omeprazole or pantoprazole) (n = 141) or to placebo or no prophylaxis (n = 133) (Ali 2016; Kantorova 2004; Powell 1993; Selvanderan 2016; Yildizdas 2002). Enteral feeds were administered alone in Kantorova 2004. Selvanderan 2016 did not report how many participants were randomised to each arm, so we were unable to add a total of 214 participants to the total numbers of participants in respective study arms.
Proton pump inhibitors plus sucralfate versus no prophylaxis
One study randomised 80 participants to receive proton pump inhibitors (omeprazole or lansoprazole) plus sucralfate (n = 40) or no prophylaxis (n = 40). Participants who did not receive prophylaxis did receive enteral nutrition (Fang 2014).
Prostaglandin analogues versus placebo or no prophylaxis
One study randomised 58 individuals to receive either a prostaglandin analogue (n = 29) or placebo (n = 29) (van Essen 1985).
Anticholinergics versus placebo or no prophylaxis
A total of two studies involving 131 individuals who received an anticholinergic (n = 59) or a placebo or no prophylaxis (n = 72) were included in the analysis (Hanisch 1998; Krakamp 1989). Ranitidine was administered to both arms in one study (Krakamp 1989).
Antacids versus placebo or no prophylaxis
A total of eight studies involving a total of 774 individuals in the antacid arm (n = 386) or placebo or no prophylaxis arm (n = 388) were included in the analysis (Basso 1981; Friedman 1982; Hastings 1978; Lopez‐Herce 1992; Luk 1982; Macdougall 1977; Pinilla 1985; Zinner 1981).
Sucralfate versus placebo or no prophylaxis
A total of seven studies involving a total of 598 individuals in the sucralfate arm (n = 302) and in the placebo or no prophylaxis arm (n = 296) were included in the analysis (Ben‐Menachem 1994; Darlong 2003; Eddleston 1994; Kantorova 2004; Kaushal 2000; Lopez‐Herce 1992; Yildizdas 2002). Enteral feeds/nasogastric feeding/parenteral feeds were administered to many participants in the following studies: Ben‐Menachem 1994 and Kantorova 2004.
Interventions compared with one another
H2 receptor antagonists versus proton pump inhibitors
We included a total of 20 studies involving 2370 individuals given H2 receptor antagonists (ranitidine, cimetidine, or famotidine) (n = 1037) or proton pump inhibitors (esomeprazole, omeprazole, rabeprazole, or pantoprazole) (n = 1333) (De Azevedo 2000; Bashar 2013; Brophy 2010; Conrad 2005; Fink 2003; Fogas 2013; Hata 2005; Kantorova 2004; Lee 2014; Levy 1997; Maasoumi 2016; Ng 2012; Phillips 1998; Powell 1993; Solouki 2009; Somberg 2008; Tabeefar 2012; Terzi 2009; Wee 2013; Yildizdas 2002). Enteral feeds/nasogastric feeding/parenteral feeds were administered to many participants in the following studies: Brophy 2010,Conrad 2005,Kantorova 2004,Solouki 2009, and Somberg 2008. Somberg 2008 randomised participants to four different intermittent dosing regimens of pantoprazole. These arms were combined to form a common interventional arm versus the H2 receptor antagonist, as the review did not aim to investigate efficacy of the same drug based on dose or mode of administration. Fogas 2013 did not report details on the H2 receptor antagonist and proton pump inhibitor used. One study did not report any outcomes of relevance for this review (Tabeefar 2012).
H2 receptor antagonists versus antacids
We included a total of 18 studies involving 1795 individuals in H2 receptor antagonist (ranitidine, cimetidine, or famotidine) (n = 957) or antacid interventional arms (n = 835) (Basso 1981; Cannon 1987; Friedman 1982; Kingsley 1985; Lamothe 1991; Lopez‐Herce 1992; Luk 1982; Martin 1980; Noseworthy 1987; Poleski 1986; Priebe 1980; Prod'hom 1994; Simms 1991; Stothert 1980; Thomason 1996; Tryba 1985; Weigelt 1981; Zinner 1981). Tryba 1985 administered 50 mg of pirenzipine daily to all randomised participants. Enteral feeds were administered to many participants (Cannon 1987; Simms 1991; Tryba 1985). Lamothe 1991 included four arms (ranitidine, cimetidine, famotidine, and antacids); H2 receptor antagonists were combined to form a common interventional arm versus antacids, as the review did not aim to investigate intraclass efficacy among included interventions.
H2 receptor antagonists versus sucralfate
We included a total of 26 studies involving 3352 individuals given H2 receptor antagonists (ranitidine, cimetidine, or famotidine) (n = 1772) or sucralfate (n = 1647) (Ben‐Menachem 1994; Cannon 1987; Cook 1998; Darlong 2003; De Azevedo 2000; Eddleston 1991; Fabian 1993; Kantorova 2004; Kappstein 1991; Kaushal 2000; Laggner 1988; Laggner 1989; Lopez‐Herce 1992; Maier 1994; Mustafa 1994; Ortiz 1998; Pickworth 1993; Prakash 2008; Prod'hom 1994; Ruiz‐Santana 1991; Ryan 1993; Simms 1991; Stoehr 2006; Thomason 1996; Tryba 1985; Yildizdas 2002). Tryba 1985 administered 50 mg of pirenzipine daily to all randomised participants. Enteral feeds/nasogastric feeding/parenteral feeds were administered to many participants in the following studies: Ben‐Menachem 1994,Cannon 1987,Cook 1998,Kantorova 2004,Mustafa 1994,Prod'hom 1994,Ruiz‐Santana 1991,Simms 1991, and Tryba 1985. Two studies randomised participants to more than one arm of H2 receptor antagonists (cimetidine bolus and continuous infusion) (Fabian 1993; Ortiz 1998). These arms were combined to form a common interventional arm versus sucralfate, as the review did not aim to investigate efficacy of the same drug based on dose or mode of administration.
H2 receptor antagonists versus anticholinergics
A total of four studies involved 599 individuals given H2 receptor antagonists (ranitidine or famotidine) (n = 307) or anticholinergics (n = 292) (Barandun 1985; Behrens 1994; Hanisch 1998; Tryba 1988). Parenteral nutrition was given at the time of endoscopy to participants in the second study alone.
H2 receptor antagonists versus prostaglandin analogues
One study randomised 127 individuals to receive H2 receptor antagonists (cimetidine) (n = 64) or a prostaglandin analogue (misoprostol) (n = 63) (Martin 1992).
H2 receptor antagonists versus teprenone
One study randomised 140 individuals to receive ranitidine (n = 70) or teprenone (n = 70) (Hata 2005).
H2 receptor antagonist + antacids versus sucralfate
A total of three studies involving 281 individuals in an interventional arm that combined H2 receptor antagonists with antacids (n = 144) or in the sucralfate arm (n = 137) were included in the analysis (Cioffi 1994; Driks 1987; Sirvent 1994). Enteral feeding/ parenteral nutrition was administered in Cioffi 1994 and Sirvent 1994. Conventional therapy with antacids, H2 receptor antagonists (cimetidine or ranitidine), or both was administered in Driks 1987; cimetidine was given in the first study and ranitidine in the third study.
Proton pump inhibitors versus teprenone
Hata 2005 randomised 140 individuals to receive rabeprazole (n = 70) or teprenone (n = 70).
Proton pump inhibitors plus naloxone versus naloxone
He 2017 randomised 120 participants to receive pantoprazole plus naloxone (n = 60) or naloxone alone (n = 60).
Proton pump inhibitors versus other medication
Lin 2016 randomised 120 individuals to receive lansoprazole (n = 60) or another medication not further specified (n = 60).
Antacids versus prostaglandin analogues
Skillman 1984 and Zinner 1989, which included 417 individuals in the antacid arm (n = 206) or the prostaglandin analogue arm (n = 211), were included in the analysis.
Antacids versus sucralfate
We included a total of 16 studies involving 1772 individuals given antacids (n = 884) or sucralfate (n = 888) (Bonten 1995; Borrero 1984; Borrero 1985; Borrero 1986; Bresalier 1987; Cannon 1987; Ephgrave 1998; Israsena 1987, Kitler 1990; Lopez‐Herce 1992; Mahul 1992; Prod'hom 1994; Simms 1991; Thomason 1996; Tryba 1987; Tryba 1985). Tryba 1985 administered 50 mg of pirenzipine daily to all randomised participants. Enteral feeds/nasogastric feeding/parenteral feeds were administered to many participants in the following studies: Bonten 1995,Cannon 1987,Ephgrave 1998,Mahul 1992,Prod'hom 1994,Simms 1991, and Tryba 1985.
Antacids versus bioflavonoids
Kitler 1990 randomised 198 individuals to receive an antacid (n = 113) or a bioflavonoid ('Maciadanol') (n = 85).
Sucralfate versus proton pump Inhibitors
We included a total of four studies involving a total of 424 individuals given sucralfate (n = 205) and a proton pump inhibitor (omeprazole, pantoprazole) (n = 219) (De Azevedo 2000; Kantorova 2004; Khorvash 2014; Yildizdas 2002). Enteral feeds/nasogastric feeding/parenteral feeds were administered to many participants in one study (Kantorova 2004).
Sucralfate versus bioflavonoids
Kitler 1990 randomised 198 individuals to receive sucralfate (n = 113) or a bioflavonoid ('Maciadanol') (n = 85).
Non‐pharmacological interventions
Total parenteral nutrition versus any other interventions plus total parenteral nutrition
Ruiz‐Santana 1991 randomised 73 individuals to receive total parenteral nutrition (n = 30), total parenteral nutrition plus ranitidine (n = 24), or total parenteral nutrition plus sucralfate (n = 19).
Bowel stimulation protocol versus no prophylaxis
Wang 2015 randomised 100 individuals to receive treatment through a bowel stimulation protocol including abdominal massage, rectal digital stimulation, and enema (n = 50) or no prophylaxis (n = 50).
Nasojejunal nutrition versus nasogastric nutrition
Davies 2012 randomised 180 individuals to nasojejunal (n = 91) or nasogastric nutrition (n = 89).
Enteral plus parenteral nutrition versus other nutrition regimens
Fan 2016 randomised 120 evenly to receive enteral plus parenteral nutrition or enteral nutrition alone or parenteral nutrition alone.
Funding sources
Most study reports that included information about funding sources mentioned that researchers had received funding from pharmaceutical companies that were involved in production of the tested interventions (23 studies). A total of 17 studies reported institutional funding from, for example, the hospitals involved in the study. Sixty studies provided no information about funding.
Excluded studies
We excluded 71 records from the review mainly for these reasons: 30 studies assessed the efficacy of drugs within the same class, 15 studies were not RCTs, participants in 15 studies were not admitted to the ICU or had an indication that did not fit our inclusion criteria, six studies assessed no health outcomes that were of relevance for the review, and five studies did not take place in an ICU setting. We have mentioned the reasons for exclusion more elaborately under Characteristics of excluded studies.
Ongoing studies
We retrieved 12 ongoing studies that might be relevant to this review and will be included in the next update.
Studies awaiting classification
We were unable to obtain the full text of two studies and classified them as studies awaiting classification (Labattut 1992; Morris 2001).
We retrieved from study registries 12 studies that were ongoing or finished with no publication identified (ACTRN12616000481471; EUCTR2015‐000318‐24‐DK; EudraCT 2007‐006102‐19; IRCT201104134578N2; ISRCTN12845429; Krag 2016; NCT00590928; NCT00702871; NCT02157376; NCT02290327; NCT02718261; NCT03098537).
Risk of bias in included studies
Assessments regarding risk of bias for all included studies are depicted in Figure 2 and Figure 3.

Risk of bias graph: review authors' judgements about each risk of bias item presented as percentages across all included studies.

Risk of bias summary: review authors' judgements about each risk of bias item for each included study.
Allocation
A total of 33 studies clearly mentioned the method employed for generating a random sequence (Bashar 2013; Ben‐Menachem 1994; Burgess 1995; Cannon 1987; Cook 1998; Davies 2012; Eddleston 1991; Eddleston 1994; Ephgrave 1998; Fabian 1993; Fang 2014; Hanisch 1998; Hastings 1978; Israsena 1987; Kantorova 2004; Kitler 1990; Kuusela 1997; Metz 1993; Ng 2012; Noseworthy 1987; Ortiz 1998; Prakash 2008; Priebe 1980; Prod'hom 1994; Rohde 1980; Ryan 1993; Skillman 1984; Solouki 2009; Somberg 2008; Stothert 1980; Tabeefar 2012; Thomason 1996; Yildizdas 2002). Thirteen studies mentioned the method employed to conceal the allocation, ensuring that they were clearly free from any selection bias (Ben‐Menachem 1994; Cook 1998; Davies 2012; Ephgrave 1998; Halloran 1980; Hanisch 1998; Kantorova 2004; Kuusela 1997; Martin 1993; Ng 2012; Noseworthy 1987; Prod'hom 1994; Somberg 2008).
Seven studies were quasi‐randomised studies and therefore were judged to have higher risk of selection bias compared with the other studies, which had unclear risk for the domains of 'sequence generation' and 'allocation concealment' (Borrero 1984; Borrero 1985; Borrero 1986; Brophy 2010; Martin 1980; Pickworth 1993; Weigelt 1981).
Blinding
Performance bias
Thirty‐seven studies clearly mentioned the methods employed for blinding participants and personnel across all outcomes, and so review authors judged their risk of performance bias as low (Barandun 1985; Bashar 2013; Bonten 1995; Burgess 1995; Chan 1995; Conrad 2005; Cook 1998; Ephgrave 1998; Fogas 2013; Friedman 1982; Groll 1986; Halloran 1980; Hanisch 1998; Kappstein 1991; Khorvash 2014; Krakamp 1989; Kuusela 1997; Lacroix 1986; Larson 1989; Lee 2014; Luk 1982; Martin 1992; Martin 1993; Metz 1993; Ng 2012; Pan 2004; Peura 1985; Pickworth 1993; Powell 1993; Selvanderan 2015; Selvanderan 2016; Stothert 1980; Tabeefar 2012; van den Berg 1985; van Essen 1985; Wee 2013; Zinner 1989).
Detection bias
Eighty studies reported that researchers used a clear definition for detection of upper GI bleeding, and review authors judged these studies as having low risk of detection bias for this outcome (Ali 2016; Apte 1992; Basso 1981; Ben‐Menachem 1994; Borrero 1984; Borrero 1985; Borrero 1986; Bresalier 1987; Brophy 2010; Burgess 1995; Cannon 1987; Chan 1995; Cioffi 1994; Conrad 2005; Cook 1998; Darlong 2003; Davies 2012; Driks 1987; Eddleston 1991; Eddleston 1994; Ephgrave 1998; Fabian 1993; Fink 2003; Friedman 1982; Groll 1986; Halloran 1980; Hanisch 1998; Kantorova 2004; Kappstein 1991; Karlstadt 1990; Kaushal 2000; Kingsley 1985; Kitler 1990; Krakamp 1989; Kuusela 1997; Lacroix 1986; Laggner 1988; Lamothe 1991; Larson 1989; Lee 2014; Levy 1997; Lin 2016; Lopez‐Herce 1992; Luk 1982; Macdougall 1977; Maier 1994; Martin 1980; Martin 1992; Martin 1993; Metz 1993; Ng 2012; Ortiz 1998; Peura 1985; Pickworth 1993; Pinilla 1985; Poleski 1986; Prakash 2008; Priebe 1980; Prod'hom 1994; Reusser 1990; Rohde 1980; Ruiz‐Santana 1991; Ryan 1993; Selvanderan 2015; Selvanderan 2016; Skillman 1984; Solouki 2009; Somberg 2008; Stothert 1980; Terzi 2009; Thomason 1996; Tryba 1985; Tryba 1987; Tryba 1988; van den Berg 1985; van Essen 1985; Wang 2015; Weigelt 1981; Zinner 1981; Zinner 1989). Thirty‐eight studies reported that researchers used a clear definition for detection of nosocomial pneumonia, and review authors judged their risk of detection bias as low (Apte 1992; Bashar 2013; Ben‐Menachem 1994; Bonten 1995; Cioffi 1994; Conrad 2005; Cook 1998; Davies 2012; Driks 1987; Eddleston 1991; Eddleston 1994; Ephgrave 1998; Fabian 1993; Fogas 2013; Hanisch 1998; Israsena 1987; Kantorova 2004; Kappstein 1991; Khorvash 2014; Laggner 1989; Lee 2014; Lin 2016; Mahul 1992; Maier 1994; Martin 1993; Metz 1993; Mustafa 1994; Pickworth 1993; Prakash 2008; Prod'hom 1994; Ryan 1993; Sirvent 1994; Solouki 2009; Somberg 2008; Thomason 1996; Tryba 1987; Tryba 1988; Yildizdas 2002).
Incomplete outcome data
High risk of attrition bias was suspected in eight studies (Barandun 1985; Fabian 1993; Hanisch 1998; Israsena 1987; Khorvash 2014; Rohde 1980; Ruiz‐Santana 1991; Terzi 2009). Although two studies conducted per‐protocol analyses for outcomes of interest and excluded participants, reports show an imbalance between interventional arms with respect to final numbers of participants (Fabian 1993; Ruiz‐Santana 1991). Therefore, review authors judged the likelihood of attrition bias as high. Only one strata of the study was available for analysis (Rohde 1980), and 16% of participants were not accounted for in two studies, respectively (Barandun 1985; Terzi 2009).
Fourteen studies, which reported that researchers conducted a per‐protocol analysis for outcomes of interest and excluded participants, showed no imbalance between interventional arms with respect to final numbers of participants (Bresalier 1987; Hanisch 1998; Kantorova 2004; Lopez‐Herce 1992; Poleski 1986; Prod'hom 1994; Reusser 1990; Skillman 1984; Stothert 1980; Thomason 1996; van den Berg 1985; van Essen 1985; Yildizdas 2002; Zinner 1989). Therefore review authors judged the likelihood of bias due to attrition as low.
The following studies were unclear on the numbers of participants initially randomised to the interventional arms: Fink 2003,Groll 1986,Kitler 1990,Phillips 1998, and Prakash 2008. Therefore review authors determined that they had unclear risk of attrition bias.
Selective reporting
All studies analysed and reported intended outcomes except the following.
-
Barandun 1985 and Laggner 1988 were unclear on reporting of adverse events of interventions.
-
Ortiz 1998 and Chan 1995 showed selective or unclear reporting on secondary outcomes of interest.
-
Rohde 1980 reported outcomes for only one strata of the study (participants with polytrauma); all other strata were excluded from analysis.
-
Thomason 1996 conducted an intention‐to‐treat analysis for the outcomes of pneumonia and all‐cause mortality only.
-
Sirvent 1994, van den Berg 1985, Lopez‐Herce 1992, and Macdougall 1977 did not report all‐cause mortality separately for each intervention arm.
-
Zinner 1989 was unclear on the total number of participants in each arm when reporting adverse events due to interventions.
-
Chan 1995 reported more outcomes than initially proposed in the Methods section.
We evaluated risk of reporting bias for clinical upper GI bleeding for the following comparisons: any intervention versus no prophylaxis or placebo, H2 receptor antagonists versus no prophylaxis or placebo, H2 receptor antagonists versus proton pump inhibitors, H2 receptor antagonists versus antacids, H2 receptor antagonists versus sucralfate, and antacids versus sucralfate. These were the only comparisons that involved at least 10 studies. Visual inspection of funnel plots revealed no evidence of reporting bias (Figure 4; Figure 5; Figure 6; Figure 7; Figure 8; Figure 9).

Funnel plot of comparison: 1 Interventions versus placebo or no prophylaxis, outcome: 1.1 Clinically important upper GI bleeding.
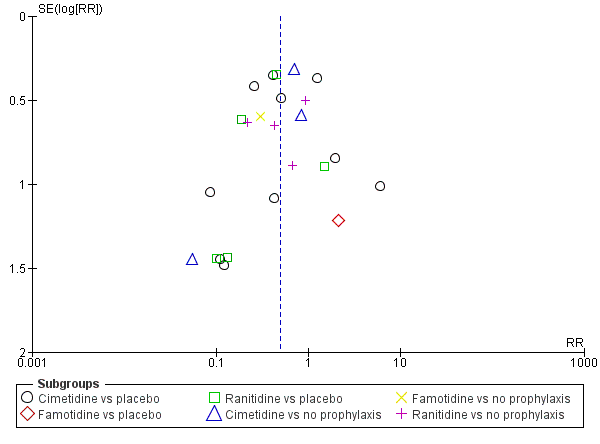
Funnel plot of comparison: 2 H2 receptor antagonists versus placebo or no prophylaxis, outcome: 2.1 Clinically important upper GI bleeding.
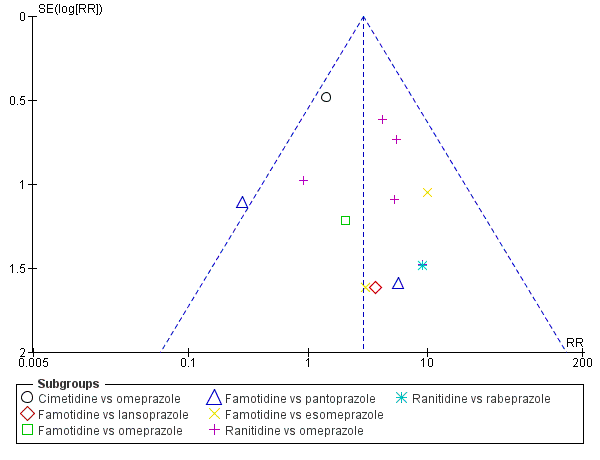
Funnel plot of comparison: 9 H2 receptor antagonists versus proton pump inhibitors, outcome: 9.1 Clinically important upper GI bleeding.

Funnel plot of comparison: 10 H2 receptor antagonists versus antacids, outcome: 10.1 Clinically important upper GI bleeding.

Funnel plot of comparison: 11 H2 receptor antagonists versus sucralfate, outcome: 11.1 Clinically important upper GI bleeding.

Funnel plot of comparison: 19 Antacids versus sucralfate, outcome: 19.1 Clinically important upper GI bleeding.
Other potential sources of bias
Review authors classified 20 studies as having unclear or high risk of bias, as reports were unclear on the baseline characteristics of randomised participants (Ali 2016; Basso 1981; Behrens 1994; Bresalier 1987; Conrad 2005; Darlong 2003; Fogas 2013; He 2017; Lacroix 1986; Larson 1989; Levy 1997; Maasoumi 2016; Macdougall 1977; Mahul 1992; Ortiz 1998; Ruiz‐Santana 1991; Selvanderan 2015; Selvanderan 2016; Wang 2015; Wee 2013). Three studies were published only as conference abstracts and did not report enough data for assessment of other biases (Fogas 2013; Selvanderan 2016; Wee 2013). These reasons are elaborately described in the risk of bias tables for these respective studies.
Effects of interventions
See: Summary of findings for the main comparison Interventions compared with placebo or no prophylaxis for preventing upper gastrointestinal bleeding in people admitted to intensive care units; Summary of findings 2 H2 receptor antagonists compared with placebo or no prophylaxis for preventing upper gastrointestinal bleeding in people admitted to intensive care units; Summary of findings 3 Proton pump inhibitors compared with placebo or no prophylaxis for preventing upper gastrointestinal bleeding in people admitted to intensive care units; Summary of findings 4 Antacids compared with placebo or no prophylaxis for preventing upper gastrointestinal bleeding in people admitted to intensive care units; Summary of findings 5 Sucralfate compared with placebo or no prophylaxis for preventing upper gastrointestinal bleeding in people admitted to intensive care units; Summary of findings 6 H2 receptor antagonists compared with proton pump inhibitors for preventing upper gastrointestinal bleeding in people admitted to intensive care units; Summary of findings 7 H2 receptor antagonists compared with antacids for preventing upper gastrointestinal bleeding in people admitted to intensive care units; Summary of findings 8 H2 receptor antagonists compared with sucralfate for preventing upper gastrointestinal bleeding in people admitted to intensive care units; Summary of findings 9 Antacids compared with sucralfate for preventing upper gastrointestinal bleeding in people admitted to intensive care units
Interventions versus placebo or no prophylaxis
For this comparison, data on eight of our pre‐defined outcomes were available.
Clinically important upper GI bleeding
Clinically important upper GI bleeding was analysed (Analysis 1.1) for the comparison of any intervention (H2 receptor antagonists, proton pump inhibitors, prostaglandin analogues, anticholinergics, and sucralfate) versus placebo or no prophylaxis. We identified 31 studies that contributed data to this outcome, which we categorised according to drug class. There seems to be a beneficial effect of any intervention versus placebo or no prophylaxis on the occurrence of clinically important upper GI bleeding (risk ratio (RR) 0.47, 95% confidence interval (CI) 0.39 to 0.57; moderate certainty of evidence). We have elaborately mentioned further results below under each respective comparison.
Nosocomial pneumonia
Nosocomial pneumonia (which included ventilator‐associated pneumonia) was analysed (Analysis 1.2) for the comparison of any interventions (H2 receptor antagonists, proton pump inhibitors, anticholinergics, and sucralfate vs placebo or no prophylaxis). We identified nine studies that contributed data to this outcome and categorised these data according to drug class. With respect to the occurrence of differences in nosocomial pneumonia between study groups (RR 1.15, 95% CI 0.90 to 1.48; low certainty of evidence), the use of any intervention versus no intervention or prophylaxis was consistent with benefits and harms. We have elaborately mentioned these results below under each respective comparison.
All‐cause mortality in ICU
All‐cause mortality in the ICU was analysed (Analysis 1.3) for the comparison of any interventions (H2 receptor antagonists, proton pump inhibitors, prostaglandin analogues, anticholinergics, antacids, and sucralfate vs placebo or no prophylaxis). We identified 18 studies that contributed data to this outcome and organised the data from these studies according to drug class. With respect to all‐cause mortality in the ICU, the effect estimate of any intervention versus no intervention or prophylaxis was consistent with benefit and harm (RR 1.10, 95% CI 0.90 to 1.34; low certainty of evidence). We have elaborately mentioned these results below under each respective comparison.
All‐cause mortality in hospital
All‐cause mortality in the hospital was analysed (Analysis 1.4) for the comparison of any interventions (H2 receptor antagonists, proton pump inhibitors, antacids, and sucralfate vs placebo or no prophylaxis). We identified five studies that contributed data to this outcome and categorised the data from these studies according to drug class. The effect estimate of any intervention versus no intervention or prophylaxis was consistent with benefits and harms with respect to all‐cause mortality in the hospital (RR 1.15, 95% CI 0.85 to 1.55). We have elaborately mentioned these results below under each respective comparison.
Duration of ICU stay
Duration of ICU stay was analysed (Analysis 1.5) for the comparison of any interventions (H2 receptor antagonists, proton pump inhibitors, and sucralfate vs placebo or no prophylaxis). We identified two studies that contributed data to this outcome and categorised the data from these studies according to drug class. The effect estimate of any intervention versus no intervention or prophylaxis was consistent with benefits and harms with respect to duration of ICU stay (mean difference (MD) 0.24 days, 95% CI ‐1.13 to 1.61; low certainty of evidence). We have elaborately mentioned these results below under each respective comparison.
Duration of intubation
Duration of intubation was analysed (Analysis 1.6) for the comparison of any interventions (H2 receptor antagonists, proton pump inhibitors, and sucralfate vs placebo or no prophylaxis). We identified two studies that contributed data to this outcome and categorised the data from these studies according to drug class. The effect estimate of any intervention versus no intervention or prophylaxis was consistent with benefits and harms with respect to duration of intubation (MD 0.87 days, 95% CI ‐0.58 to 2.31; low certainty of evidence). We have elaborately mentioned these results below under each respective comparison.
Number of participants requiring blood transfusions
The number of participants requiring blood transfusions was analysed (Analysis 1.7) for the comparison of any interventions (H2 receptor antagonists, antacids, and sucralfate vs placebo or no prophylaxis). We identified nine studies that contributed data to this outcome and categorised the data from these studies according to drug class. Data seem to show a reduction in the number of participants in the intervention group requiring blood transfusion (RR 0.63, 95% CI 0.41 to 0.97; moderate certainty of evidence). We have elaborately mentioned these results below under each respective comparison.
Units of blood transfused
The number of units of blood transfused was analysed (Analysis 1.8) for the comparison of any interventions (H2 receptor antagonists and sucralfate vs placebo or no prophylaxis). We identified two studies that contributed data to this outcome and categorised the data from these studies according to drug class. The effect estimate of any intervention versus no intervention or prophylaxis was consistent with benefits and harms with respect to the number of units of blood transfused (MD 0.09 units, 95% CI ‐0.99 to 1.17). We have elaborately mentioned these results below under each respective comparison.
H2 receptor antagonists versus placebo or no prophylaxis
For this comparison, data on nine of our pre‐defined outcomes were available.
Clinically important upper GI bleeding
We identified 24 studies relevant to this outcome (N = 2149) and stratified data into six groups according to drug class members of H2 receptor antagonists. For this outcome, we found evidence suggesting that H2 receptor antagonists reduced the risk of clinically important upper GI bleeding compared with placebo or no prophylaxis (8.3% vs 17.7%; RR 0.50, 95% CI 0.36 to 0.70; Analysis 2.1). We judged the certainty of the evidence as moderate. This outcome had moderate levels of heterogeneity (Chi² = 38.78, df = 23.0 (P = 0.02), I² = 40%).
Cimetidine versus placebo
We found 10 studies that were relevant to this comparison (N = 772). For this comparison, the effect was consistent with benefits and harms (RR 0.53, 95% CI 0.28 to 1.02). For this outcome, heterogeneity was substantial (Chi² = 22.25, df = 9.0 (P = 0.008), I² = 60%; Analysis 2.1).
Famotidine versus placebo
For this comparison, we identified a single relevant study (N = 146). The effect was consistent with benefits and harms (RR 2.11, 95% CI 0.20 to 22.79; Analysis 2.1).
Ranitidine versus placebo
We found five relevant studies for this comparison (N = 446). Evidence suggested a beneficial effect of H2 receptor antagonists compared with placebo within this comparison (RR 0.36, 95% CI 0.17 to 0.77; Analysis 2.1).
Cimetidine versus no prophylaxis
For this comparison, we identified three relevant studies (N = 516). In this subgroup, the effect was consistent with benefits and harms (RR 0.59, 95% CI 0.23 to 1.48). For this comparison, heterogeneity was moderate (Chi² = 3.53, df = 2.0 (P = 0.17), I² = 43%) (Analysis 2.1).
Famotidine versus no prophylaxis
We identified a single study for this comparison (N = 50). We found evidence of benefit of H2 receptor antagonists compared with no prophylaxis (RR 0.30, 95% CI 0.09 to 0.96; Analysis 2.1).
Ranitidine versus no prophylaxis
We found four studies that were relevant to this comparison (N = 219). The effect of H2 receptor antagonists versus no prophylaxis was consistent with benefits and harms (RR 0.51, 95% CI 0.26 to 1.00; Analysis 2.1). One study with 19 participants in the ranitidine group and 21 participants in the no prophylaxis group reported no events of clinically important upper GI bleeding (Reusser 1990).
Nosocomial pneumonia
We identified eight studies that were relevant to this outcome (N = 945) and divided the data into five subcategories in accordance with our protocol. The effect of H2 receptor antagonists versus no prophylaxis on nosocomial pneumonia was consistent with benefits and harms (15.8% vs 14.6%; RR 1.12, 95% CI 0.85 to 1.48; Analysis 2.2). We judged the certainty of this evidence as low.
Cimetidine versus placebo
We identified two relevant studies for this comparison (N = 204). The effect of cimetidine versus placebo on nosocomial pneumonia was consistent with benefits and harms (RR 0.34, 95% CI 0.06 to 2.00). This comparison showed moderate heterogeneity (Chi² = 1.59, df = 1.0 (P = 0.21), I² = 37%; Analysis 2.2).
Famotidine versus placebo
We included a single study for this comparison (N = 146). The effect of famotidine versus placebo was consistent with benefits and harms (RR 1.48, 95% CI 0.49 to 4.45; Analysis 2.2).
Ranitidine versus placebo
We found two studies that were relevant to this comparison (N = 277). The effect was consistent with benefits and harms (RR 0.79, 95% CI 0.47 to 1.31; Analysis 2.2).
Cimetidine versus no prophylaxis
We included a single study in this comparison (N = 200). The effect was consistent with benefits and harms (RR 2.17, 95% CI 0.86 to 5.47; Analysis 2.2).
Ranitidine versus no prophylaxis
We found two studies that were relevant to this comparison (N = 118). Within this comparison, the effect was consistent with benefits and harms (RR 1.33, 95% CI 0.93 to 1.90; Analysis 2.2).
All‐cause mortality in ICU
We identified 14 studies that contributed data to this outcome (N = 1428). With respect to all‐cause mortality in the ICU, the effect of H2 receptor antagonists versus no prophylaxis on nosocomial pneumonia was consistent with benefits and harms (15.8% vs 14.3%; RR 1.12, 95% CI 0.88 to 1.42; Analysis 2.3). We judged the certainty of this evidence as low.
Cimetidine versus placebo
We found four studies that were relevant to this comparison (N = 478). Data showed no clear difference between H2 receptor antagonists and placebo (RR 1.05, 95% CI 0.66 to 1.68; Analysis 2.3).
Famotidine versus placebo
We identified a single study for this comparison (N = 146). Data show no clear difference between H2 receptor antagonists and placebo (RR 1.32, 95% CI 0.55 to 3.16; Analysis 2.3).
Ranitidine versus placebo
We found two relevant studies for this comparison (N = 148). We found no evidence showing a clear difference between the two groups (RR 0.69, 95% CI 0.31 to 1.54; Analysis 2.3). One study (N = 21) reported no events of all‐cause mortality in both groups on the ICU (Powell 1993).
Cimetidine versus no prophylaxis
We found two relevant studies for this comparison (N = 400). Data show no clear difference between H2 receptor antagonists and no prophylaxis within this comparison (RR 1.00, 95% CI 0.61 to 1.63). For this outcome, heterogeneity was considerable (Chi² = 5.12, df = 1.0 (P = 0.02), I² = 80%; Analysis 2.3).
Famotidine versus no prophylaxis
We found one study that was relevant to this comparison (N = 50). For this comparison, we found no evidence showing a clear difference between the two groups (RR 1.25, 95% CI 0.59 to 2.64; Analysis 2.3).
Ranitidine versus no prophylaxis
We found four studies that were relevant to this comparison (N = 206). Data show no clear difference between H2 receptor antagonists and no prophylaxis (RR 1.58, 95% CI 0.97 to 2.58; Analysis 2.3).
All‐cause mortality in hospital
For this outcome, we found four relevant studies (N = 487). Data seemed to show no difference between H2 receptor antagonists and placebo or no prophylaxis with respect to all‐cause mortality in the hospital (18.4% vs 15.7%; RR 1.16, 95% CI 0.79 to 1.70; Analysis 2.4).
Famotidine versus placebo
We found one study that was relevant to this comparison (N = 146). For this comparison, we found no evidence of a clear difference between the two groups (RR 0.89, 95% CI 0.43 to 1.86; Analysis 2.4).
Ranitidine versus placebo
We found one study that was relevant to this comparison (N = 101). For this comparison, we did not find evidence of a clear difference between the two groups (RR 0.35, 95% CI 0.01 to 8.47; Analysis 2.4).
Cimetidine versus no prophylaxis
We identified a single study for this comparison (N = 200). We found no evidence of a clear difference between the two groups (RR 1.47, 95% CI 0.88 to 2.46; Analysis 2.4).
Ranitidine versus no prophylaxis
We found one study that was relevant to this comparison (N = 40). Data show no clear difference between H2 receptor antagonists and no prophylaxis (RR 0.92, 95% CI 0.33 to 2.53; Analysis 2.4).
Duration of ICU stay
We identified two studies relevant to this outcome (N = 230). Data seemed to show no difference between H2 receptor antagonists and placebo or no prophylaxis with respect to duration of ICU stay (MD 0.73 days, 95% CI ‐0.92 to 2.38; Analysis 2.5). We judged the certainty of this evidence as low.
Famotidine versus placebo
We identified a single study for this comparison (N = 146). We found no evidence of a clear difference between the two groups (MD 1.50 days, 95% CI ‐1.93 to 4.93; Analysis 2.5).
Ranitidine versus no prophylaxis
We found one study that was relevant to this comparison (N = 84). We found no evidence of a clear difference between the two groups (MD 0.50 days, 95% CI ‐1.38 to 2.38; Analysis 2.5). An additional study reported insufficient data for inclusion in a formal meta‐analysis (Reusser 1990). Researchers randomised 19 participants to the ranitidine arm and 21 to the control arm. The mean duration of ICU stay was 13 days (range 6 to 40 days) in the ranitidine group and 17 days (range 5 to 30 days) in the control group.
Ranitidine versus placebo
We identified two studies that looked at this outcome but did not report enough data to be included in formal meta‐analyses (N = 154) (Hanisch 1998; Reusser 1990). In the included studies, 76 participants received ranitidine and 78 received placebo. The mean duration of ICU stay was 9.7 days (2 to 95) and 12.6 days (2 to 58) in Hanisch 1998, and 13 days (16 to 40) and 17 days (5 to 30) in Reusser 1990.
Cimetidine versus no prophylaxis
We identified one study that did not report sufficient information for inclusion in the meta‐analysis (N = 200) (Ben‐Menachem 1994). The duration of ICU stay was 4 days (2 to 9 days) in the cimetidine group (n = 100) and 3 days (2 to 6 days) in the group that received no prophylaxis (n = 100).
Duration of intubation
For this outcome, we found two relevant studies and categorised data into two comparisons (N = 230). Data seemed to show no difference between H2 receptor antagonists and placebo or no prophylaxis with respect to duration of intubation (MD 0.79 days, 95% CI ‐0.95 to 2.54; Analysis 2.6). Apte 1992 assessed the duration of intubation but did not report enough data for inclusion in meta‐analyses.
Famotidine versus placebo
We found one study that was relevant to this comparison (N = 146). We found no evidence of a clear difference between the two groups (MD 1.20 days, 95% CI ‐1.86 to 4.26; Analysis 2.6).
Ranitidine versus no prophylaxis
We identified a single study for this comparison (N = 84). Data show no clear difference between H2 receptor antagonists and no prophylaxis (MD 0.60 days, 95% CI ‐1.52 to 2.72; Analysis 2.6).
Ranitidine versus placebo
We identified two studies that looked at this outcome but did not report enough data for inclusion in formal meta‐analyses (N = 148) (Apte 1992; Hanisch 1998). In the included studies, 73 participants received ranitidine and 75 received placebo. The mean duration of intubation was 8.2 days (2 to 93) and 10.2 days (2 to 55) in Hanisch 1998, and 7.5 days (3 to 28) and 12.5 days (3 to 63) in Apte 1992.
Number of participants requiring blood transfusions
Data seemed to show a beneficial effect of H2 receptor antagonists compared with placebo or no prophylaxis with respect to the number of participants requiring blood transfusions (6.4% vs 11.2%; RR 0.58, 95% CI 0.36 to 0.95; seven studies; 655 participants; Analysis 2.7). We judged the certainty of this evidence as moderate.
Cimetidine versus placebo
We found three studies that were relevant to this comparison (N = 107). For this outcome, within this comparison, we found evidence suggesting that H2 receptor antagonists were different in their effect compared with placebo (RR 0.39, 95% CI 0.19 to 0.79; Analysis 2.7). Results favoured cimetidine over placebo.
Ranitidine versus placebo
We identified two relevant studies for this comparison (N = 148). We found no evidence of a clear difference between the two groups (RR 1.05, 95% CI 0.24 to 4.60). This comparison had substantial heterogeneity (Chi² = 1.89, df = 1.0 (P = 0.17), I² = 47%; Analysis 2.7).
Cimetidine versus no prophylaxis
We found two studies that were relevant to this comparison (N = 400). Data show no clear difference between H2 receptor antagonists and no prophylaxis (RR 0.77, 95% CI 0.35 to 1.71; Analysis 2.7).
Ranitidine versus no prophylaxis
We found two studies that were relevant to this comparison (N = 74) (Apte 1992; Reusser 1990). For this outcome, within this comparison, we found no evidence suggesting that H2 receptor antagonists were different in their effects compared with no prophylaxis. Researchers reported no events in either treatment group, and we could not include these studies in the meta‐analysis.
Units of blood transfused
For this outcome, we found two relevant studies and categorised data into two comparisons (N = 209). Data seemed to show no difference between H2 receptor antagonists and placebo or no prophylaxis with respect to the number of units of blood transfused (MD 0.33 units, 95% CI ‐0.04 to 0.70; Analysis 2.8). This outcome had considerable heterogeneity (Chi² = 9.49, df = 1.0 (P = 0.0), I² = 89%).
Cimetidine versus placebo
We found one study that was relevant to this comparison (N = 9). Evidence suggested a difference between H2 receptor antagonists and placebo (MD ‐4.35 units, 95% CI ‐7.35 to ‐1.35; Analysis 2.8). One study reported 11 blood transfusions in the cimetidine group (n = 26) and 41 in the placebo group (n = 24) and reported no standard deviation (Halloran 1980). Another study reported that the mean volume of blood transfused was 600 mL (0 to 900 mL) in the cimetidine group (n = 114) and 550 mL (0 to 1200 mL) in the placebo group (n = 107) (Groll 1986).
Cimetidine versus no prophylaxis
We included a single study in this comparison (N = 200). We found evidence suggesting a difference between H2 receptor antagonists and no prophylaxis favouring no prophylaxis (MD 0.40 units, 95% CI 0.03 to 0.77; Analysis 2.8).
Ranitidine vs placebo
We identified one study that looked at this outcome but did not report enough data for inclusion in formal meta‐analyses (Hanisch 1998). In the included study, 57 participants received ranitidine and 57 received placebo. A mean of two units of blood was transfused in each of the three participants with GI bleeding in the ranitidine group, and 12 units was transfused in the single surviving participant with GI bleeding in the placebo group.
Adverse events of interventions
For this outcome we found eight relevant studies and divided the data into 12 comparisons according to type of adverse event.
Diarrhoea
We found two studies that were relevant to this comparison (N = 225). We found no evidence of a clear difference between the two groups (RR 1.30, 95% CI 0.57 to 2.96; Analysis 2.9).
Thrombocytopaenia
We found one study that was relevant to this comparison (N = 200). We found no evidence of a clear difference between the two groups (RR 3.0, 95% CI 0.12 to 72.77; Analysis 2.9).
Hypophosphataemia
We identified a single study in this comparison (N = 25). We found no evidence of a clear difference between the two groups (RR 3.75, 95% CI 0.17 to 84.02; Analysis 2.9).
Mental confusion
We identified five relevant studies for this comparison (N = 657). We found evidence that H2 receptor antagonists increased the risk for mental confusion compared with placebo or no prophylaxis (RR 2.01, 95% CI 1.10 to 3.65; Analysis 2.9).
Nausea and vomiting
We found two studies that were relevant to this comparison (N = 287). We found no evidence of a clear difference between the two groups (RR 0.46, 95% CI 0.09 to 2.35; Analysis 2.9).
Increased creatinine levels
We included a single study in this comparison (N = 2000. Evidence showed no clear difference between H2 receptor antagonists and placebo or no prophylaxis (RR 1.04, 95% CI 0.64 to 1.69; Analysis 2.9).
Erythema (superficial reddening of the skin)
We found one study that was relevant to this comparison (N = 70). Data showed no clear difference between H2 receptor antagonists and placebo or no prophylaxis (RR 3.00, 95% CI 0.13 to 71.22; Analysis 2.9).
Pancreatitis
We found one study that was relevant to this comparison (N = 39). We found no evidence of a clear difference between the two groups (RR 0.29, 95% CI 0.01 to 6.66; Analysis 2.9). .
Chest infection
We found one study that was relevant to this comparison (N = 101). Data showed no clear difference between H2 receptor antagonists and placebo or no prophylaxis (RR 1.74, 95% CI 0.92 to 3.30; Analysis 2.9).
Delirium
We found one study that was relevant to this comparison (N = 39. Data showed no clear difference between H2 receptor antagonists and placebo or no prophylaxis (RR 2.59, 95% CI 0.11 to 59.93; Analysis 2.9).
Hallucinations
We included a single study in this comparison (N = 39). We found no evidence of a clear difference between the two groups (RR 2.59, 95% CI 0.11 to 59.93; Analysis 2.9).
Severe bleeding
We included a single study in this comparison (N = 101). Data showed no clear difference between H2 receptor antagonists and placebo or no prophylaxis (RR 0.35, 95% CI 0.01 to 8.47; Analysis 2.9).
Proton pump inhibitors versus placebo or no prophylaxis
For this comparison, data on six of our pre‐defined outcomes were available. Omeprazole was administered in all three studies providing data for this comparison. Placebo was administered in two studies as comparator, and in one study no prophylaxis was given as comparator.
Clinically important upper GI bleeding
We classified studies on the basis of their intervention and comparison arms (as shown in Analysis 3.1). In the three included studies that contributed data to the analyses, 114 participants received proton pump inhibitors and 123 participants received either placebo or no prophylaxis. The event occurred in 2.6% and 4.9% of participants in the two groups. Data seemed to show no difference between proton pump inhibitors and placebo or no prophylaxis with respect to the occurrence of clinically important upper GI bleeding (RR 0.63, 95% CI 0.18 to 2.22). We judged the certainty of the evidence as low.
We identified two additional studies. Selvanderan 2016 included 214 participants and did not report how many participants were randomised to the two interventions. Powell 1993 included 21 participants in the proton pump inhibitor arm and 10 in the placebo arm. Both trials reported no events of clinically important upper GI bleeding in either group.
Omeprazole versus placebo
We found one relevant study for this comparison (N = 147. We found no evidence of a clear difference between the two groups (RR 1.04, 95% CI 0.07 to 16.34; Analysis 3.1).
Omeprazole versus no prophylaxis
We identified a single study for this comparison (N = 80). We found no evidence of a clear difference between the two groups (RR 0.74, 95% CI 0.13 to 4.18; Analysis 3.1).
Pantoprazole versus placebo
We included a single study for this comparison (N = 10). We found no evidence of a clear difference between the two groups (RR 0.28, 95% CI 0.02 to 4.66; Analysis 3.1).
Nosocomial pneumonia
We classified studies on the basis of their intervention and comparison arms (as shown in Analysis 3.2). In the two included studies, 110 participants received proton pump inhibitors and 117 received placebo. Nosocomial pneumonia occurred in 22.8% of the group that received proton pump inhibitors and 18.7% of the group that received placebo or no prophylaxis. Data seemed to show no difference between proton pump inhibitors and placebo or no prophylaxis with respect to the occurrence of nosocomial pneumonia (RR 1.24, 95% CI 0.77 to 1.98). We judged the certainty of the evidence as low.
We identified an additional study that was published as a conference abstract and did not report enough data for formal meta‐analysis (Selvanderan 2016). Researchers randomised a total of 214 participants to receive pantoprazole or placebo. One participant in the placebo group and two in the pantoprazole group developed ventilator‐associated complications including pneumonia. Data showed eight and 12 cases of clinician‐adjudicated nosocomial pneumonia in pantoprazole and control groups, respectively.
Omeprazole versus placebo
We identified a single study for this comparison (N = 147). Data show no clear difference between proton pump inhibitors and placebo within this comparison (RR 1.67, 95% CI 0.57 to 4.86; Analysis 3.2).
Omeprazole versus no prophylaxis
We included a single study in this comparison (N = 80). We found no evidence of a clear difference between the two groups. Nosocomial pneumonia occurred in 44.7% and 40.5% of participants in the groups that received omeprazole or no prophylaxis, respectively (RR 1.11, 95% CI 0.66 to 1.84; Analysis 3.2).
All‐cause mortality in ICU
We classified studies on the basis of their intervention and comparison arms (as shown in Analysis 3.3). In the three included studies, 131 participants received proton pump inhibitors and 127 received either placebo or no prophylaxis. The event occurred in 13.3% and 13.4% of participants in the two groups. Data seemed to show no difference between proton pump inhibitors and placebo or no prophylaxis with respect to all‐cause mortality in the ICU (RR 1.09, 95% CI 0.60 to 1.99). We judged the certainty of this evidence as low.
We identified an additional study that was published as a conference abstract and did not provide enough data for formal meta‐analysis (Selvanderan 2016). Researchers randomised a total of 214 participants to receive pantoprazole or placebo. The study reported an adjusted hazard ratio for mortality with pantoprazole of 1.68 (95% CI 0.97 to 2.90).
Omeprazole versus placebo
We found two relevant studies for this comparison (N = 178). We found no evidence of a clear difference between the two groups (RR 1.20, 95% CI 0.51 to 2.83; Analysis 3.3).
Omeprazole versus no prophylaxis
We included a single study in this comparison (N = 80). Data show no clear difference between proton pump inhibitors and no prophylaxis within this comparison with respect to all‐cause mortality in the ICU (RR 0.98, 95% CI 0.42 to 2.29; Analysis 3.3).
All‐cause mortality in hospital
We classified studies on the basis of their intervention and comparison arms (as shown in Analysis 3.4). In the included study, 75 participants received proton pump inhibitors and 75 received placebo. All‐cause mortality occurred in 18.7% of the group that received proton pump inhibitors and 17.3% of the group that received placebo. Data seemed to show no difference between proton pump inhibitors and placebo or no prophylaxis with respect to all‐cause mortality in hospital (RR 1.08, 95% CI 0.54 to 2.13).
Duration of ICU stay
We classified studies on the basis of their intervention and comparison arms (as shown in Analysis 3.5). In the two included studies, 110 participants received proton pump inhibitors and 117 received either placebo or no prophylaxis. Data seemed to show no difference between proton pump inhibitors and placebo or no prophylaxis with respect to length of ICU stay (MD ‐0.03 days, 95% CI ‐1.63 to 1.58; two studies; 227 participants; Analysis 3.5). We judged the certainty of this evidence as low.
Omeprazole versus placebo
We included a single study in this comparison (N = 147). We found no evidence of a clear difference between the two groups (MD ‐0.90 days, 95% CI ‐3.96 to 2.16; Analysis 3.5).
Omeprazole versus no prophylaxis
We included a single study in this comparison (N = 80). Data show no clear difference between proton pump inhibitors and no prophylaxis (MD 0.30 days, 95% CI ‐1.58 to 2.18; Analysis 3.5).
Duration of intubation
We classified studies on the basis of their intervention and comparison arms (as shown in Analysis 3.6). In the two included studies, 110 participants received sucralfate and 107 received either placebo or no prophylaxis. Data seemed to show no difference between proton pump inhibitors and placebo or no prophylaxis with respect to duration of intubation (MD 0.36 days, 95% CI ‐1.43 to 2.15).
Omeprazole versus placebo
We included a single study in this comparison (N = 147). Data show no difference between proton pump inhibitors and placebo with respect to duration of intubation (MD 0.50 days, 95% CI ‐2.72 to 3.72; Analysis 3.6).
Omeprazole versus no prophylaxis
We found one study that was relevant to this comparison (N = 800). We found no evidence of a clear difference between the two groups (MD 0.30 days, 95% CI ‐1.85 to 2.45; Analysis 3.6).
Pirenzepine versus placebo
We identified one study that looked at this outcome but did not report enough data for inclusion in formal meta‐analyses (Hanisch 1998). In the included study, 44 participants received pirenzepine and 57 received placebo. The mean duration of intubation was 8.2 days (2 to 32) and 10.2 days (2 to 55) in the two groups, respectively.
Adverse events
One study including 214 participants compared pantoprazole versus placebo (Selvanderan 2015). Researchers tested 30 participants assigned to pantoprazole and 40 assigned to placebo for Clostridium difficile infection. One participant in the pantoprazole group was infected with C difficile.
Proton pump inhibitors plus sucralfate versus placebo or no prophylaxis
For this comparison, data on one of our pre‐defined outcomes were available. One study compared early and late administration of omeprazole plus lansoprazole plus sucralfate versus no prophylaxis. For this comparison, we included only participants with late start of therapy (48 to 72 hours) to fit the inclusion criteria of this review. We did not include in the analysis the group with early start of therapy (12 to 24 hours). The only outcome measured that was of relevance to this review was the occurrence of clinically important upper GI bleeding.
Clinically important upper GI bleeding
Data seemed to show no difference between proton pump inhibitors plus sucralfate and placebo or no prophylaxis with respect to the occurrence of clinically important upper GI bleeding (20.0% vs 37.5%; RR 0.53, 95% CI 0.26 to 1.12; one study; 80 participants who contributed data to this comparison (Analysis 4.1). We judged the certainty of this evidence as moderate.
Prostaglandin analogues versus placebo or no prophylaxis
For this comparison, data on two of our pre‐defined outcomes were available. Only one study provided data for this comparison. It included 58 people, of whom 29 received prostaglandin analogues and 29 received placebo.
Clinically important upper GI bleeding
Data seemed to show no difference between prostaglandin analogues and placebo with regard to the occurrence of clinically important upper GI bleeding (10.3% in both groups; RR 1.00, 95% CI 0.22 to 4.55; one study; 58 participants; Analysis 5.1). We judged the certainty of this evidence as moderate.
All‐cause mortality in ICU
Data seemed to show no difference between prostaglandin analogues and placebo with regard to all‐cause mortality in the ICU (27.6% and 24.1%; RR 1.14, 95% CI 0.48 to 2.74; one study; 58 participants; Analysis 5.2). We judged the certainty of this evidence as moderate.
Anticholinergics versus placebo or no prophylaxis
For this comparison, data on three of our pre‐defined outcomes were available. Two studies provided data for this comparison. Both studies administered pirenzepine to a total of 59 participants and placebo or placebo plus ranitidine to 72 participants. In Krakamp 1989, ranitidine was the co‐intervention given to both arms.
Clinically important upper GI bleeding
We classified studies on the basis of their intervention and comparison arms (as shown in Analysis 6.1). In the two studies that contributed data towards this outcome, the event occurred in 10.2% and 9.7% of participants. Data seemed to show no difference between anticholinergics and placebo or no prophylaxis with respect to the occurrence of clinically important upper GI bleeding (RR 0.95, 95% CI 0.36 to 2.51). We judged the certainty of this evidence as low.
Pirenzepine versus placebo
We found one study that was relevant to this comparison (N = 101). We found no evidence of a clear difference between the two groups (RR 1.94, 95% CI 0.34 to 11.13; Analysis 6.1).that
Pirenzepin plus ranitidine versus placebo plus ranitidine
We found one study that was relevant to this comparison (N = 30). Data show no clear difference between the two groups (RR 0.60, 95% CI 0.17 to 2.07; Analysis 6.1).
Nosocomial pneumonia
We classified the study on the basis of its intervention and comparison arms (as shown in Analysis 6.2). In the single included study, 44 participants received anticholinergics and 57 received placebo. The event occurred in 22.7% and 21.1% of participants in both groups. Data seemed to show no difference between anticholinergics and placebo with respect to the occurrence of nosocomial pneumonia (RR 1.08, 95% CI 0.51 to 2.27; one study; 101 participants). We judged the certainty of this evidence as low.
All‐cause mortality in ICU
We classified studies on the basis of their intervention and comparison arms (as shown in Analysis 6.3). In the two included studies, 59 participants received anticholinergics and 72 received placebo alone or placebo with ranitidine. The event occurred in 25.4% and 20.8% of participants in both groups. Data seemed to show no difference between anticholinergics and placebo with respect to all‐cause mortality in the ICU (RR 1.23, 95% CI 0.66 to 2.30). We judged the certainty of this evidence as low.
Pirenzepine versus placebo
We included a single study in this comparison (N = 101). We found no evidence of a clear difference between the two groups (RR 1.30, 95% CI 0.65 to 2.60; Analysis 6.3).
Pirenzepin plus ranitidine versus placebo plus ranitidine
We found one study that was relevant to this comparison (N = 30. We found no evidence of a clear difference between the two groups (RR 1.0, 95% CI 0.24 to 4.18; Analysis 6.3).
Duration of ICU stay
We identified one study that looked at this outcome but did not report enough data for inclusion in formal meta‐analyses (Hanisch 1998). In the included study, 44 participants received pirenzepine and 57 received placebo. The mean duration of ICU stay was 9.9 days (2 to 39) and 12.6 days (2 to 58), respectively.
Duration of intubation
We identified one study that looked at this outcome but did not report enough data for inclusion in formal meta‐analyses (Hanisch 1998). In the included study, 44 participants received pirenzepine and 57 received placebo. The mean duration of intubation was 8.0 days (2 to 32) and 10.2 days (2 to 55), respectively.
Units of blood transfused
We identified one study that looked at this outcome but did not report enough data for inclusion in formal meta‐analyses (Hanisch 1998). In the included study, 44 participants received pirenzepine and 57 received placebo. The mean number of units of blood transfused was four units in each of the three patients with GI bleeding in the pirenzepine group and 12 units in the single surviving participant with GI bleeding in the placebo group.
Antacids versus placebo or no prophylaxis
For this comparison, data on five of our pre‐defined outcomes were available. Among the eight studies that provided data for this comparison, two studies administered placebo and five studies provided no prophylaxis.
Clinically important upper GI bleeding
Data seemed to show a beneficial effect of antacids compared with placebo or no prophylaxis with respect to the occurrence of clinically important upper GI bleeding. The outcome occurred in 7.2% of the antacids group and in 17.7% of the placebo group (RR 0.49, 95% CI 0.25 to 0.99; eight studies; 774 participants; Analysis 7.1). We judged the certainty of this evidence as low. This outcome had substantial heterogeneity (Chi² = 15.92, df = 7.0 (P = 0.03), I² = 56%).
Antacids versus placebo
We found two studies that were relevant to this comparison (N = 145). Data show no clear difference between antacids and placebo (RR 2.04, 95% CI 0.72 to 5.79; Analysis 7.1).
Antacids versus no prophylaxis
We found six studies that were relevant to this comparison (N = 629). For this outcome, within this comparison, we found evidence suggesting that antacids had a beneficial effect compared with no prophylaxis (RR 0.35, 95% CI 0.20 to 0.60; Analysis 7.1).
All‐cause mortality in ICU
Data seemed to show no difference between anticholinergics and no prophylaxis with respect to all‐cause mortality in the ICU. The event occurred in 15.9% of the antacids group and in 16.1% of the group that received no prophylaxis (RR 1.01, 95% CI 0.53 to 1.96; two studies; 300 participants; Analysis 7.2). We judged the certainty of the evidence as low.
All‐cause mortality in the hospital
Data seemed to show no difference between anticholinergics and no prophylaxis with respect to all‐cause mortality in the hospital. The event occurred in 30.7% of the intervention group and in 21.3% of the control group (RR 1.44, 95% CI 0.79 to 2.64; one study; 126 participants; Analysis 7.3).
Duration of intubation
We identified one study that did not report enough data for inclusion in formal meta‐analysis (Pinilla 1985). Study participants received either antacids (n = 65) or no specific prophylaxis (n = 61). The mean duration of ventilation in the antacids group was 136.4 hours (range 0 to 360) and in the control group 173.6 hours (range 12 to 552).
Number of participants requiring blood transfusions
Data seemed to show no difference between antacids and no prophylaxis with respect to the number of participants requiring blood transfusion. In the intervention group, 4.3% of participants required blood transfusion, and in the control group, 4.5% required blood transfusion (RR 0.94, 95% CI 0.30 to 2.96; two studies; 226 participants; Analysis 7.4). We judged the certainty of the evidence as low.
Adverse events of interventions
We identified four studies relevant to this outcome and categorised data according to seven adverse events.
Diarrhoea
We included four relevant studies in this comparison (N = 395). For this outcome, within this comparison, we found evidence suggesting that antacids increased the risk of diarrhoea compared with placebo or no prophylaxis. Diarrhoea occurred in 16.4% of the intervention group and 4.5% of the control group (RR 3.56, 95% CI 1.83 to 6.94; Analysis 7.5). For this comparison, heterogeneity was moderate (Chi² = 4.99, df = 3.0 (P = 0.17), I² = 39%).
Hypomagnesaemia
We included a single study in this comparison (N = 25). We found no evidence of a clear difference between the two groups (RR 3.75, 95% CI 0.17 to 84.02; Analysis 7.5). Researchers reported one event in the intervention group and none in the control group.
Hypophosphataemia
We found two studies that were relevant to this comparison (N = 225). For this outcome, we found evidence suggesting that antacids increased the risk of hypophosphataemia compared with placebo or no prophylaxis (16.2% and 2.6%; RR 5.48, 95% CI 1.81 to 16.61; Analysis 7.5). Data showed 18 events in the intervention group and three in the control group.
Hypermagnesaemia
We included a single study in this comparison (N = 100). Data show no clear difference between antacids and placebo or no prophylaxis (RR 6.73, 95% CI 0.36 to 127.02; Analysis 7.5). Researchers reported three events in the intervention group and none in the control group.
Nausea and vomiting
We found three studies that were relevant to this subgroup (N = 370). Data show no clear difference between antacids and placebo or no prophylaxis (RR 2.39, 95% CI 0.86 to 6.64; Analysis 7.5). Researchers reported 11 events in the intervention group and four in the control group.
Mental confusion
We included a single study in this comparison (N = 200). Data show no clear difference between antacids and placebo or no prophylaxis (RR 1.27, 95% CI 0.61 to 2.67; Analysis 7.5). Fourteen events occurred in the intervention group and 11 in the control group.
Creatinine increase
We found one relevant study (N = 200). We found no evidence of a clear difference between the two groups (RR 1.17, 95% CI 0.73 to 1.87; Analysis 7.5). The event occurred in 28 and 24 participants in the two groups, respectively.
Sucralfate versus placebo or no prophylaxis
For this comparison, data on nine of our pre‐defined outcomes were available. Among the seven studies that provided data for this comparison, placebo was administered in two studies and no prophylaxis was given in five studies.
Clinically important upper GI bleeding
We classified studies on the basis of their intervention and comparison arms (as shown in Analysis 8.1). Data seemed to show a beneficial effect of sucralfate compared with placebo or no prophylaxis with respect to the occurrence of clinically important upper GI bleeding. The event occurred in 6.3% of participants in the intervention group and in 10.8% of participants of the control group (RR 0.53, 95% CI 0.32 to 0.88; seven studies; 598 participants; Analysis 8.1). We judged the certainty of this evidence as moderate.
Sucralfate versus placebo
We identified two relevant studies (N = 170). Data show no clear difference between sucralfate and placebo (RR 1.40, 95% CI 0.30 to 6.62; Analysis 8.1). For this comparison, heterogeneity was moderate (Chi² = 1.53, df = 1.0 (P = 0.22), I² = 35%).
Sucralfate versus no prophylaxis
We identified five relevant studies for this comparison (N = 428). We found evidence for a beneficial effect of sucralfate compared with no prophylaxis (RR 0.46, 95% CI 0.26 to 0.80; Analysis 8.1).
Nosocomial pneumonia
We classified studies on the basis of their intervention and comparison arms (as shown in Analysis 8.2). We identified four studies relevant to this outcome (N = 450). Data seemed to show no difference between sucralfate and placebo or no prophylaxis with respect to the occurrence of ventilator‐associated pneumonia. The event occurred in 15.9% and 12.2% of the two groups, respectively (RR 1.33, 95% CI 0.86 to 2.04; Analysis 8.2). We judged the certainty of this evidence as low.
Sucralfate versus placebo
We identified two relevant studies (N = 170). Data show no clear difference between sucralfate and placebo (RR 1.43, 95% CI 0.49 to 4.16; Analysis 8.2).
Sucralfate versus no prophylaxis
We found two relevant studies (N = 280). We found no evidence of a clear difference between the two groups (RR 1.30, 95% CI 0.82 to 2.07; Analysis 8.2). This comparison had moderate heterogeneity (Chi² = 1.51, df = 1.0 (P = 0.22), I² = 34%).
All‐cause mortality in ICU
We classified studies on the basis of their intervention and comparison arms (as shown in Analysis 8.3). Data seemed to show no difference between sucralfate and placebo or no prophylaxis with respect to all‐cause mortality in the ICU. The event occurred in 16.3% and 16.5% in the two groups, respectively (RR 0.97, 95% CI 0.66 to 1.43; five studies; 500 participants). We judged the certainty of this evidence as low.
Sucralfate versus placebo
We identified two relevant studies (N = 170). Data show no clear difference between sucralfate and placebo (RR 0.92, 95% CI 0.48 to 1.80; Analysis 8.3).
Sucralfate versus no prophylaxis
We found three studies that were relevant to this review (N = 330). We found no evidence of a clear difference between the two groups (RR 0.99, 95% CI 0.62 to 1.60; Analysis 8.3).
All‐cause mortality in hospital
We classified studies on the basis of their intervention and comparison arms (as shown in Analysis 8.4). Data seemed to who no difference between sucralfate and placebo or no prophylaxis with respect to all‐cause mortality in the hospital. The event occurred in 17.8% and 18.3% in the two groups, respectively (RR 0.97, 95% CI 0.62 to 1.52; two studies; 344 participants).
Sucralfate versus placebo
We included a single study in this comparison (N = 144). Data show no clear difference between sucralfate and placebo (RR 1.09, 95% CI 0.54 to 2.18; Analysis 8.4).
Sucralfate versus no prophylaxis
We included a single study in this comparison (N = 200). We found no evidence of a clear difference between the two groups (RR 0.89, 95% CI 0.49 to 1.62; Analysis 8.4).
Duration of ICU stay
We classified studies on the basis of their intervention and comparison arms (as shown in Analysis 8.5). Data seemed to show no difference between sucralfate and placebo or no prophylaxis with respect to duration of ICU stay (MD ‐0.02 days, 95% CI ‐1.70 to 1.65; two studies; 224 participants). We judged the certainty of this evidence as low.
Sucralfate versus placebo
We found one study that was relevant to this comparison (N = 144). We found no evidence of a clear difference between the two groups (MD ‐0.70 days, 95% CI ‐4.07 to 2.67; Analysis 8.5).
Sucralfate versus no prophylaxis
We found one study that was relevant to this comparison (N = 80). We found no evidence of a clear difference between the two groups (MD 0.20 days, 95% CI ‐1.73 to 2.13; Analysis 8.5). We identified one study that did not report sufficient information for inclusion in the meta‐analysis (Ben‐Menachem 1994). In this study, the duration of ICU stay was 3 days (2 to 8.5 days) in the sucralfate group (n = 100) and 3 days (2 to 6 days) in the group that received no prophylaxis (n = 100).
Duration of intubation
We classified studies on the basis of their intervention and comparison arms (as shown in Analysis 8.6). Data seemed to show no difference between sucralfate and placebo or no prophylaxis with respect to duration of intubation (MD 1.42, 95% CI ‐0.27 to 3.10; two studies; 224 participants).
Sucralfate versus placebo
We included a single study in this comparison (N = 144). Data show no clear difference between sucralfate and placebo (MD 0.80 days, 95% CI ‐2.20 to 3.80; Analysis 8.6).
Sucralfate versus no prophylaxis
We found one study that was relevant to this comparison (N = 80). Data show no clear difference between sucralfate and no prophylaxis (MD 1.70 days, 95% CI ‐0.34 to 3.74; Analysis 8.6).
Number of participants requiring blood transfusion
We classified studies on the basis of their intervention and comparison arms (as shown in Analysis 8.7). Data seemed to show no difference between sucralfate and no prophylaxis with respect to the number of participants requiring blood transfusion. Blood transfusion was required by 3% and 5% of the two groups, respectively (RR 0.60, 95% CI 0.15 to 2.44; one study; 200 participants). We judged the certainty of this evidence as low.
Units of blood transfused
We classified studies on the basis of their intervention and comparison arms (as shown in Analysis 8.8). Data seemed to show an unfavourable effect of sucralfate with respect to the number of units of blood transfused (MD 0.80, 95% CI 0.32 to 1.28; one study; 200 participants).
Adverse events of interventions
We classified studies on the basis of their intervention and comparison arms (as shown in Analysis 8.9). For this outcome, we found a single study that measured nausea and vomiting as an adverse event. Data seemed to show no difference between sucralfate and placebo or no prophylaxis with respect to the occurrence of adverse events. The sucralfate group included four participants with nausea and vomiting and the placebo group included none (RR 9.00, 95% CI 0.50 to 161.13; one study; 70 participants).
H2 receptor antagonists versus proton pump inhibitors
For this comparison, data on eight of our pre‐defined outcomes were available. Among the 18 studies that provided data for this comparison, ranitidine was administered in nine studies, cimetidine in two, and famotidine in six. Two studies combined the pantoprazole arms (Fink 2003; Somberg 2008), and one study combined the omeprazole arms to form a common interventional arm for comparison with H2 receptor antagonists (Powell 1993), as the review did not aim to investigate intraclass efficacy among included interventions. Tabeefar 2012 compared pantoprazole (n = 11) and ranitidine (n = 8), but reported no outcomes that were of relevance for this review.
Clinically important upper GI bleeding
We classified studies on the basis of their intervention and comparison arms (as shown in Analysis 9.1). Data seemed to show increased risk of clinically important upper GI bleeding under H2 receptor antagonists when compared with proton pump inhibitors. The event occurred in 6.9% and 1.7% of participants in the two groups, respectively (RR 2.90, 95% CI 1.83 to 4.58; 13 studies; 1636 participants). Five studies with 525 participants reported that no events occurred in either group. We judged the certainty of this evidence as low.
Cimetidine versus omeprazole
We found one study that was relevant to this comparison (N = 359). We found no evidence of a clear difference between the two groups (RR 1.4, 95% CI 0.55 to 3.61; Analysis 9.1).
Cimetidine versus pantoprazole
We found one study that was relevant to this comparison (N = 202) (Somberg 2008). We found no evidence of a difference between the two groups, but no events were reported in either group.
Famotidine versus lansoprazole
We included a single study in this comparison (N = 51). We found no evidence of a clear difference between the two groups (RR 3.63, 95% CI 0.15 to 84.98; Analysis 9.1).
Famotidine versus omeprazole
We included a single study in this comparison (N = 143). Data show no clear difference between famotidine and omeprazole (RR 2.03, 95% CI 0.19 to 21.87; Analysis 9.1).
Famotidine versus pantoprazole
We found two studies that were relevant to this comparison (N = 159). Data show no clear difference between famotidine and pantoprazole (RR 0.73, 95% CI 0.18 to 3.04). This comparison had substantial heterogeneity (Chi² = 2.44, df = 1.0 (P = 0.12), I² = 59%; Analysis 9.1).
Famotidine versus esomeprazole
We identified two relevant studies for this comparison (N = 371). For this outcome, we found evidence suggesting that famotidine seemed to increase the risk for upper GI bleeding compared with esomeprazole (RR 7.53, 95% CI 1.39 to 40.85; Analysis 9.1).
Ranitidine versus omeprazole
Five studies contributed data to this comparison (N = 413). We found evidence of increased risk of GI bleeding with ranitidine compared with omeprazole (RR 4.08, 95% CI 1.99 to 8.36; Analysis 9.1). Powell 1993 (N = 31) reported no events in either of the two study arms.
Ranitidine versus pantoprazole
We found two studies that were relevant to this comparison (N = 213). We found no evidence of a clear difference between ranitidine and pantoprazole, and no events were reported in either treatment group (Analysis 9.1).
Ranitidine versus rabeprazole
We found one study that was relevant to this comparison (N = 140). Data show no clear difference between ranitidine and rabeprazole (RR 9.00, 95% CI 0.49 to 164.09; Analysis 9.1).
H2 receptor antagonists (not defined) versus proton pump inhibitors (not defined)
We included a single study in this comparison (N = 79) (Fogas 2013). We found no evidence of a clear difference between the two groups, and no events were reported in either treatment group (Analysis 9.1).
Nosocomial pneumonia
We classified studies on the basis of their intervention and comparison arms (as shown in Analysis 9.2). Data seemed to show no difference between H2 receptor antagonists and proton pump inhibitors with respect to the occurrence of nosocomial pneumonia. The event occurred in 13.3% and 12.1% of participants in the two groups, respectively (RR 1.02, 95% CI 0.77 to 1.35; eight studies; 1256 participants). We judged the certainty of this evidence as low.
Cimetidine versus omeprazole
We found one study that was relevant to this comparison (N = 359). Data show no clear difference between cimetidine and omeprazole (RR 0.84, 95% CI 0.45 to 1.54; Analysis 9.2).
Cimetidine versus pantoprazole
We identified a single study for this comparison (N = 202). Data show no clear difference between cimetidine and pantoprazole (RR 0.89, 95% CI 0.28 to 2.91; Analysis 9.2).
Famotidine versus esomeprazole
We included a single study in this comparison (N = 60). Data show no clear difference between famotidine and esomeprazole (RR 1.00, 95% CI 0.07 to 15.26; Analysis 9.2).
Famotidine versus omeprazole
We included a single study in this comparison (N = 143). Data show no clear difference between famotidine and omeprazole (RR 0.89, 95% CI 0.34 to 2.32; Analysis 9.2).
Ranitidine versus omeprazole
We identified five relevant studies for this comparison (N = 413). Data show no clear difference between ranitidine and omeprazole (RR 1.19, 95% CI 0.80 to 1.75; Analysis 9.2). This comparison had moderate heterogeneity (Chi² = 6.07, df = 4.0 (P = 0.19), I² = 34%).
H2 receptor antagonists (not defined) versus proton pump inhibitors (not defined)
We found one study that was relevant to this comparison (N = 79). Data show no clear difference between H2 receptor antagonists and proton pump inhibitors (RR 1.03, 95% CI 0.47 to 2.26; Analysis 9.2).
All‐cause mortality in ICU
We classified studies on the basis of their intervention and comparison arms (as shown in Analysis 9.3). Data seemed to show no difference between H2 receptor antagonists and proton pump inhibitors with respect to all‐cause mortality in the ICU. The event occurred in 19.3% and 16.3% of participants in the two groups, respectively (RR 0.96, 95% CI 0.78 to 1.19; 12 studies; 1564 participants). We judged the certainty of this evidence as low.
Cimetidine versus omeprazole
We found one study that was relevant to this comparison (N = 359). We found no evidence of a clear difference between the two groups (RR 0.76, 95% CI 0.45 to 1.30; Analysis 9.3).
Cimetidine versus pantoprazole
We found one study that was relevant to this comparison (N = 202). We found no evidence of a clear difference between the two groups (RR 0.80, 95% CI 0.25 to 2.55; Analysis 9.3).
Famotidine versus omeprazole
We found one study that was relevant to this comparison (N = 143). We found no evidence of a clear difference between the two groups (RR 1.13, 95% CI 0.49 to 2.61; Analysis 9.3).
Ranitidine versus omeprazole
We identified five relevant studies for this comparison (N = 387). We found no evidence of a clear difference between the two groups (RR 1.10, 95% CI 0.86 to 1.40; Analysis 9.3).
Ranitidine versus pantoprazole
We found three studies that were relevant to this comparison (N = 333). Data show no clear difference between the two groups (RR 0.66, 95% CI 0.31 to 1.43; Analysis 9.3).
Ranitidine versus rabeprazole
We found one study that was relevant to this comparison (N = 140). We found no evidence of a clear difference between the two groups (RR 3.00, 95% CI 0.12 to 72.40; Analysis 9.3).
All‐cause mortality in the hospital
We classified studies on the basis of their intervention and comparison arms (as shown in Analysis 9.4). Data seemed to show no difference between H2 receptor antagonists and proton pump inhibitors with respect to all‐cause mortality in the hospital. The event occurred in 5.5% and 7.2% of participants, respectively (RR 0.72, 95% CI 0.37 to 1.43; two studies; 454 participants).
Famotidine versus esomeprazole
We found one study that was relevant to this comparison (N = 311). We found no evidence of a clear difference between the two groups (RR 0.37, 95% CI 0.04 to 3.49; Analysis 9.4).
Famotidine versus omeprazole
We included a single study in this comparison (N = 143). Data show no clear difference between famotidine and omeprazole (RR 0.80, 95% CI 0.39 to 1.63; Analysis 9.4).
Duration of ICU stay
We classified studies on the basis of their intervention and comparison arms (as shown in Analysis 9.5). Data seemed to show no difference between H2 receptor antagonists and proton pump inhibitors with respect to duration of ICU stay (MD 0.14 days, 95% CI ‐1.14 to 1.41; five studies; 482 participants). We judged the certainty of this evidence as low.
Famotidine versus esomeprazole
We included a single study in this comparison (N = 60). We found no evidence of a clear difference between the two groups (MD ‐0.30 days, 95% CI ‐6.51 to 5.91; Analysis 9.5).
Famotidine versus omeprazole
We found one study that was relevant to this comparison (N = 143). Data show no clear difference between the two groups (MD 2.40 days, 95% CI ‐0.44 to 5.24; Analysis 9.5).
Famotidine versus pantoprazole
We included a single study in this comparison (N = 129). We found no evidence that famotidine was clearly different in its effects compared with pantoprazole, for no standard deviation was reported in the study (Wee 2013).
Ranitidine versus omeprazole
We found three studies that were relevant to this comparison (N = 279). We found no evidence of a clear difference between the two groups (MD ‐0.44 days, 95% CI ‐1.90 to 1.02; Analysis 9.5).
Ranitidine versus pirenzepine
We identified one study that looked at this outcome but did not report enough data for inclusion in formal meta‐analyses (Hanisch 1998). In the included study, 44 participants received pirenzepine and 57 received ranitidine. The mean duration of ICU stay was 9.9 (2 to 39) days and 9.7 (2 to 95) days in the two groups, respectively.
Duration of intubation
We classified studies on the basis of their intervention and comparison arms (as shown in Analysis 9.6). We identified six studies relevant to this outcome (N = 671). However, only five studies contributed data to our meta‐analysis. We found no difference between H2 receptor antagonists and proton pump inhibitors with respect to duration of intubation (MD ‐0.35 days, 95% CI ‐1.48 to 0.78; five studies; 542 participants).
Famotidine versus omeprazole
We included a single study in this comparison (N = 143). We found no evidence of a clear difference between the two groups (MD 0.70 days, 95% CI ‐2.24 to 3.64; Analysis 9.6)
Famotidine versus pantoprazole
We found one study that was relevant to this comparison (N = 129). For this outcome, data seemed to show no difference in effect between famotidine (6.3 days; n = 61) and pantoprazole (6.5 days; n = 68). However, data (no SD/SE) reported were insufficient for inclusion in study meta‐analyses (Analysis 9.6). We identified an additional study that was published as a conference abstract and did not report enough data for formal meta‐analysis (Wee 2013). Researchers included 61 participants in the famotidine group and 68 in the pantoprazole group. The mean duration of intubation was 6.3 days in the famotidine group and 6.5 days in the pantoprazole group.
Ranitidine versus omeprazole
We identified three relevant studies for this comparison (N = 279). We found no evidence of a clear difference between the two groups (MD ‐0.78 days, 95% CI ‐2.24 to 0.67; Analysis 9.6).
Ranitidine versus pantoprazole
We found one study that was relevant for this comparison (N = 120). Data show no clear difference between ranitidine and pantoprazole (MD 0.07 days, 95% CI ‐2.18 to 2.32; Analysis 9.6).
Ranitidine versus pirenzepine
We identified one study that looked at this outcome but did not report enough data for inclusion in formal meta‐analyses (Hanisch 1998). In the included study, 44 participants received pirenzepine and 57 received ranitidine. The mean duration of intubation was 8.2 (2 to 32) days and 8.2 (2 to 93) days in the two groups, respectively.
Number of participants requiring blood transfusion
Data seemed to show no difference between H2 receptor antagonists and proton pump inhibitors with respect to the number of participants requiring blood transfusion (3.8% and 1.7%; RR 1.98, 95% CI 0.75 to 5.21; three studies; 575 participants; Analysis 9.7). We judged the certainty of this evidence as low.
Cimetidine versus omeprazole
We included a single study in this comparison (N = 359). Data show no clear difference between cimetidine and omeprazole (RR 0.98, 95% CI 0.29 to 3.34; Analysis 9.7).
Ranitidine versus omeprazole
We found one study that was relevant to this comparison (N = 76). We found no evidence of a clear difference between the two groups (RR 5.00, 95% CI 0.25 to 100.80; Analysis 9.7).
Ranitidine versus rabeprazole
We included a single study in this comparison (N = 140). Data show no clear difference between ranitidine and rabeprazole (RR 9.00, 95% CI 0.49 to 164.09; Analysis 9.7).
Adverse events of interventions
For this outcome, we found five relevant studies and categorised data according to 12 adverse events.
Pyrexia
We identified a single study that reported on this adverse event (N = 202). Data show no clear difference between H2 receptor antagonists and proton pump inhibitors (RR 0.93, 95% CI 0.05 to 19.03; Analysis 9.8).
Thrombocytopaenia
Two relevant studies reported on this adverse event (N = 253). Data show no clear difference between H2 receptor antagonists and proton pump inhibitors for thrombocytopaenia (RR 3.64, 95% CI 0.65 to 20.46; Analysis 9.8).
Neuroleptic malignant syndrome
We identified a single study that reported on this adverse event (N = 202). We found no evidence of a clear difference between the two groups (RR 1.56, 95% CI 0.06 to 37.42; Analysis 9.8).
Cholestatic jaundice
We found one study that reported on this adverse event (N = 202). We found no evidence of a clear difference between the two groups (RR 1.56, 95% CI 0.06 to 37.42; Analysis 9.8).
Abnormal liver function test
A single study reported on this adverse event (N = 202). Data show no clear difference between H2 receptor antagonists and proton pump inhibitors (RR 1.56, 95% CI 0.06 to 37.42; Analysis 9.8).
Pruritus
We found one study that reported on this adverse event (N = 202). Data show no clear difference between H2 receptor antagonists and proton pump inhibitors (RR 1.56, 95% CI 0.06 to 37.42; Analysis 9.8).
Phlebitis
A single study reported on this adverse event (N = 202). Data show no clear difference between H2 receptor antagonists and proton pump inhibitors (RR 1.56, 95% CI 0.06 to 37.42; Analysis 9.8).
Major cardiovascular events
We found a single study that reported on this adverse event (N = 311). We found no evidence of a clear difference between the two groups (RR 0.79, 95% CI 0.26 to 2.43; Analysis 9.8).
Abdominal distension and vomiting
We included a single study in this comparison (N = 90). We found no evidence of a clear difference between the two groups (RR 1.15, 95% CI 0.62 to 2.14; Analysis 9.8).
Hypomagnesaemia
We included a single study in this comparison (N = 129). We found no evidence of a clear difference between the two groups (RR 0.43, 95% CI 0.16 to 1.13; Analysis 9.8).
Nausea and vomiting
We included a single study in this comparison (N = 129). We found no evidence of a clear difference between the two groups (RR 0.48, 95% CI 0.13 to 1.77; Analysis 9.8).
C difficile‐related diarrhoea
We included a single study in this comparison (N = 129). We found no evidence of a clear difference between the two groups (RR 1.11, 95% CI 0.16 to 7.67; Analysis 9.8).
H2 receptor antagonists versusantacids
For this comparison, data on seven of our pre‐defined outcomes were available. Among the 18 studies that provided data for this comparison, ranitidine was administered in four studies and cimetidine in 13; one study included four arms (ranitidine, cimetidine, famotidine, and antacids) (Lamothe 1991). H2 receptor antagonists were combined to form a common interventional arm versus antacids, as the review did not aim to investigate intraclass efficacy among included interventions. Tryba 1985 administered pirenzepine as a concomitant medication to both cimetidine and antacid arms.
Clinically important upper GI bleeding
We classified studies on the basis of their intervention and comparison arms (as shown in Analysis 10.1). In the 16 included studies, 884 participants received ranitidine, cimetidine, or famotidine, and 816 received antacids. Clinically important upper GI bleeding occurred in 8.4% and 8.6% of participants in both groups. Data seemed to show no difference between the two groups with respect to the occurrence of clinically important upper GI bleeding (RR 0.96, 95% CI 0.67 to 1.36; 16 studies; 1700 participants). We judged the certainty of this evidence as low.
Nosocomial pneumonia
We classified studies on the basis of their intervention and comparison arms (as shown in Analysis 10.2). In the four included studies, 288 participants received ranitidine or cimetidine, and 293 received antacids. Nosocomial pneumonia occurred in 29.2% and 28.0% of participants in the two groups, respectively. Data seemed to show no difference between the two groups with respect to the occurrence of the outcome of interest (RR 1.05, 95% CI 0.81 to 1.36). We judged the certainty of this evidence as low.
Cimetidine versus antacids
We identified two relevant studies for this comparison (N = 136). Data show no clear difference between cimetidine and antacids (RR 1.24, 95% CI 0.70 to 2.19; Analysis 10.2).
Ranitidine versus antacids
We included two relevant studies in this comparison (N = 445). Data show no clear difference between ranitidine and antacids (RR 1.00, 95% CI 0.75 to 1.34; Analysis 10.2).
All‐cause mortality in ICU
We classified studies on the basis of their intervention and comparison arms (as shown in Analysis 10.3). In the 11 included studies, 472 participants received cimetidine, 33 received cimetidine plus pirenzepine, and 178 received ranitidine. Overall, 638 participants received antacids. Tryba 1985 administered pirenzepine as a concomitant medication to both cimetidine and antacid arms. All‐cause mortality occurred in 16.1% and 16.3% of the participants in both groups. Data seemed to show no difference between the two groups with respect to all‐cause mortality (RR 1.01, 95% CI 0.66 to 1.55). We judged the certainty of this evidence as very low.
Cimetidine versus antacids
We found eight studies that were relevant to this comparison (N = 885). We found no evidence of a clear difference between the two groups (RR 1.05, 95% CI 0.69 to 1.59). Heterogeneity was moderate (Chi² = 10.02, df = 7.0 (P = 0.19), I² = 30%; Analysis 10.3).
Cimetidine plus pirenzepine versus antacid plus pirenzepine
We included a single study in this comparison (N = 66). We found no evidence of a clear difference between the two groups (RR 1.25, 95% CI 0.37 to 4.25; Analysis 10.3).
Ranitidine versus antacids
We found two studies that were relevant to this comparison (N = 370). We found no evidence of a clear difference between the two groups (RR 1.13, 95% CI 0.14 to 8.97). This comparison had considerable heterogeneity (Chi² = 6.71, df = 1.0 (P = 0.01), I² = 85%; Analysis 10.3).
All‐cause mortality in hospital
We classified the study on the basis of its intervention and comparison arms (as shown in Analysis 10.4). In the single included study, 80 participants received ranitidine and 81 received antacids. The event occurred in 33.8% and 39.5% of participants in the two groups. Data seemed to show no difference between the two groups with respect to all‐cause mortality in the hospital (RR 0.85, 95% CI 0.57 to 1.29).
Duration of intubation
We classified studies on the basis of their intervention and comparison arms (as shown in Analysis 10.5). In the three included studies, 64 participants received cimetidine and 57 received antacids. Data seemed to show no difference between the two groups with respect to duration of intubation (MD ‐0.81 days, 95% CI ‐3.85 to 2.23).
Number of participants requiring blood transfusions
We classified studies on the basis of their intervention and comparison arms (as shown in Analysis 10.6). In the six included studies, 379 participants received cimetidine or ranitidine and 365 received antacids. The event occurred in 8.2% and 3.0% of participants in both groups. Data seemed to show increased risk of blood transfusion in the H2 receptor antagonists arm compared with the antacids arm (RR 2.49, 95% CI 1.35 to 4.62). We judged the certainty of this evidence as moderate.
Cimetidine versus antacids
We found five studies that were relevant to this comparison (N = 583). We found evidence of a difference between cimetidine and antacids (RR 2.47, 95% CI 1.32 to 4.63; Analysis 10.6). Results favour the antacids arm.
Ranitidine versus antacids
We included a single study in this comparison (N = 161). We found no evidence of a clear difference between the two groups (RR 3.04, 95% CI 0.13 to 73.46; Analysis 10.6).
Number of units of blood transfused
We identified one study that addressed this outcome but did not report enough data for inclusion in a formal meta‐analysis (Priebe 1980). The study included 38 participants who received cimetidine and 37 who received antacids. Blood transfusions were required only for participants with GI bleeding, all of whom were included in the cimetidine group. It was reported that one participant received two units of blood and three participants received a total of four units of blood.
Adverse events of interventions
We identified 12 studies relevant to this outcome and divided the data into 12 groups according to adverse events.
Diarrhoea
We found seven studies that were relevant to this comparison (N = 863). We found evidence of a difference between H2 receptor antagonists and antacids. Darrhoea occurred in 2.1% and 10.4% of participants in the two groups, respectively (RR 0.23, 95% CI 0.13 to 0.43; six studies; 777 participants; Analysis 10.7). Results favour the H2 receptor antagonist arm. This comparison had moderate heterogeneity (Chi² = 11.3, df = 5.0 (P = 0.05), I² = 56%).
Thrombocytopaenia
We found four studies that were relevant to this comparison (N = 452). We found no evidence of a clear difference between the two groups (RR 1.40, 95% CI 0.93 to 2.09; Analysis 10.7). This comparison had moderate heterogeneity (Chi² = 5.88, df = 3.0 (P = 0.12), I² = 49%).
Nausea and vomiting
We included four relevant studies in this comparison (N = 380). We found no evidence of a clear difference between the two groups (RR 0.46, 95% CI 0.19 to 1.1; Analysis 10.7).
Hypophosphataemia
We included two relevant studies in this comparison (N = 108). Data show no clear difference between H2 receptor antagonists and antacids (RR 0.24, 95% CI 0.04 to 1.3; Analysis 10.7).
Hypomagnesaemia
We included a single study in this comparison (N = 22). We found no evidence of a clear difference between the two groups (RR 0.33, 95% CI 0.02 to 7.39; Analysis 10.7).
Increase in creatinine
We found two studies that were relevant to this comparison (N = 286). Data show no clear difference between H2 receptor antagonists and antacids (RR 0.85, 95% CI 0.56 to 1.28; Analysis 10.7).
Mental confusion
We found four studies that were relevant to this comparison (N = 476). We found no evidence of a clear difference between the two groups (RR 1.26, 95% CI 0.77 to 2.07; Analysis 10.7).
Hypermagnesaemia
We included two relevant studies in this comparison (N = 115). Data show no clear difference between H2 receptor antagonists and antacids (RR 0.58, 95% CI 0.17 to 2.03; Analysis 10.7).
Rash/Erythema
We found two studies that were relevant to this comparison (N = 231). We found no evidence of a clear difference between the two groups (RR 3.02, 95% CI 0.32 to 28.53; Analysis 10.7).
Alkalosis
Alkalosis is a primary rise in the plasma bicarbonate concentration. We included a single study in this comparison (N = 75). We found no evidence of a clear difference between the two groups (RR 0.32, 95% CI 0.01 to 7.73; Analysis 10.7).
Dryness of mouth
We included a single study in this comparison (N = 67). We found no evidence of a clear difference between the two groups (RR 5.15, 95% CI 0.26 to 103.33; Analysis 10.7).
Leucopaenia
We included a single study in this comparison (N = 161). We found no evidence of a clear difference between the two groups (RR 3.04, 95% CI 0.13 to 73.46; Analysis 10.7).
H2 receptor antagonists versus sucralfate
For this comparison, data on nine of our pre‐defined outcomes were available. Among the 25 studies that provided data for this comparison, ranitidine was administered in 15 studies, cimetidine in seven, and famotidine in two. Tryba 1985 administered pirenzepine as a concomitant medication to both cimetidine and sucralfate arms. Two studies randomised participants to more than one arm of H2 receptor antagonists (cimetidine bolus and continuous infusion) (Fabian 1993; Ortiz 1998). These arms were combined to form a common interventional arm versus sucralfate, as the review did not aim to investigate efficacy based on dose or mode of administration of the same drug. We included one study that compared ranitidine (n = 15) with sucralfate (n = 15) but did not provide data on any of the outcomes relevant to this review.
Clinically important upper GI bleeding
We classified studies on the basis of their intervention and comparison arms (as shown in Analysis 11.1). In the 24 included studies, 1761 participants received ranitidine, cimetidine, or famotidine, and 1638 received sucralfate. Clinically important upper GI bleeding occurred in 7.6% and 6.6% of participants in the two groups, respectively. Data seemed to show no difference between the two groups with respect to the occurrence of clinically important upper GI bleeding (RR 1.10, 95% CI 0.87 to 1.41; 24 studies; 3316 participants). An additional study with 83 participants reported no events of clinically important upper GI bleeding in either treatment group (Pickworth 1993). We judged the certainty of this evidence as low.
Cimetidine versus sucralfate
We included seven relevant studies in this comparison (N = 873). We found no evidence of a clear difference between the two groups (RR 1.37, 95% CI 0.87 to 2.14; Analysis 11.1).
Famotidine versus sucralfate
We included two relevant studies in this comparison (N = 190). Data show no clear difference between H2 receptor antagonists and sucralfate (RR 0.62, 95% CI 0.21 to 1.78; Analysis 11.1).
Ranitidine versus sucralfate
We found 14 studies that were relevant to this comparison (N = 2186). Data show no clear difference between H2 receptor antagonists and sucralfate (RR 1.03, 95% CI 0.76 to 1.39; Analysis 11.1). An additional study with 83 participants reported no events of clinically important upper GI bleeding in either treatment group (Pickworth 1993).
Cimetidine plus pirenzepine versus sucralfate plus pirenzepine
We included a single study in this comparison (N = 67). We found no evidence of a clear difference between the two groups (RR 5.15, 95% CI 0.26 to 103.33; Analysis 11.1).
Nosocomial pneumonia
We classified studies on the basis of their intervention and comparison arms (as shown in Analysis 11.2). In the 17 included studies, 1547 participants received ranitidine or cimetidine or famotidine, and 1460 received sucralfate. Nosocomial pneumonia occurred in 23.5% and 18.9% of participants in both groups. Data seemed to show increased risk of nosocomial pneumonia in the H2 receptor antagonist group compared with the sucralfate group (RR 1.22, 95% CI 1.07 to 1.40; 17 studies; 3041 participants). We judged the certainty of the evidence as moderate.
Cimetidine versus sucralfate
We included five relevant studies in this comparison (N = 758). Data show no clear difference between cimetidine and sucralfate (RR 1.13, 95% CI 0.87 to 1.47; Analysis 11.2).
Famotidine versus sucralfate
We found one study that was relevant to this comparison (N = 140). We found no evidence of a clear difference between the two groups (RR 1.13, 95% CI 0.40 to 3.20; Analysis 11.2).
Ranitidine versus sucralfate
We found 11 studies that contributed data to this comparison (N = 2143). For this outcome, within this comparison, we found evidence suggesting that ranitidine was clearly different in its effects compared with sucralfate (RR 1.26, 95% CI 1.07 to 1.48; Analysis 11.2). One study with 70 participants reported no events in either treatment arm (Lopez‐Herce 1992).
All‐cause mortality in ICU
We classified studies on the basis of their intervention and comparison arms (as shown in Analysis 11.3). In the 21 included studies (N = 3178), 1652 participants received cimetidine, ranitidine, or famotidine, and 1526 received sucralfate. All‐cause mortality occurred in 22.0% and 20.4% of participants in both groups. We found no difference between the two groups with respect to all‐cause mortality in the ICU (RR 1.09, 95% CI 0.95 to 1.24). We judged the certainty of this evidence as low.
Cimetidine versus sucralfate
We found six studies that were relevant to this comparison (N = 814). Data show no clear difference between H2 receptor antagonists and sucralfate (RR 1.18, 95% CI 0.91 to 1.54; Analysis 11.3).
Famotidine versus sucralfate
We found two studies that were relevant to this comparison (N = 190). We found no evidence of a clear difference between the two groups (RR 1.23, 95% CI 0.69 to 2.19; Analysis 11.3).
Ranitidine versus sucralfate
We included 12 relevant studies in this comparison (N = 2107). We found no evidence of a clear difference between the two groups (RR 1.04, 95% CI 0.88 to 1.22; Analysis 11.3).
Cimetidine plus pirenzepine versus sucralfate plus pirenzepine
We included a single study in this comparison (N = 67). We found no evidence of a clear difference between the two groups (RR 1.29, 95% CI 0.38 to 4.38; Analysis 11.3).
All‐cause mortality in hospital
We classified studies on the basis of their intervention and comparison arms (as shown in Analysis 11.4). In the four included studies (N = 717), 366 participants received cimetidine, ranitidine, or famotidine, and 351 received sucralfate. All‐cause mortality in the hospital occurred in 22.7% and 20.2% of participants in both groups. Data showed no significant differences between the two groups (RR 1.14, 95% CI 0.86 to 1.50).
Cimetidine versus sucralfate
We found two studies that were relevant to this comparison (N = 413). Data show no clear difference between H2 receptor antagonists and sucralfate (RR 1.28, 95% CI 0.86 to 1.92; Analysis 11.4). For this comparison, heterogeneity was moderate (Chi² = 1.9, df = 1.0 (P = 0.17), I² = 47%).
Ranitidine versus sucralfate
We included a single study in this comparison (N = 164). We found no evidence of a clear difference between the two groups (RR 1.11, 95% CI 0.71 to 1.74; Analysis 11.4).
Famotidine versus sucralfate
We included a single study in this comparison (N = 140). Data show no clear difference between H2 receptor antagonists and sucralfate (RR 0.82, 95% CI 0.40 to 1.71; Analysis 11.4).
Duration of intubation
We classified studies on the basis of their intervention and comparison arms (as shown in Analysis 11.5). In the 10 included studies (N = 1751), 864 participants received cimetidine, ranitidine, or famotidine, and 887 received sucralfate. Data seemed to show no difference between the two groups with respect to duration of intubation (MD 0.22 days, 95% CI ‐1.55 to 2.00). This outcome had considerable heterogeneity (Chi² = 50.79, df = 9.0 (P = 0.0), I² = 82%).
Cimetidine versus sucralfate
We identified two relevant studies for this comparison (N = 97). Data show no clear difference between H2 receptor antagonists and sucralfate (MD 0.58 days, 95% CI ‐1.71 to 2.87; Analysis 11.5). We identified an additional study that did not provide enough data for formal meta‐analysis (Kappstein 1991). Of the included participants, 55 received cimetidine and 49 received sucralfate. The mean duration of mechanical ventilation was 5.36 days in the cimetidine group and 5.02 days in the sucralfate group. We identified an additional study that did not report enough data on the duration of intubation for inclusion in a formal meta‐analysis (Ryan 1993). This study included 56 participants in the cimetidine group and 58 in the sucralfate group. The mean duration of intubation was 5.1 days in the cimetidine group and 5.6 days in the sucralfate group.
Famotidine versus sucralfate
We included a single study in this comparison (N = 140). Data show no clear difference between H2 receptor antagonists and sucralfate (MD 0.40 days, 95% CI ‐2.30 to 3.10; Analysis 11.5).
Ranitidine versus sucralfate
We included seven relevant studies in this comparison (N = 1514). Data show no clear difference between H2 receptor antagonists and sucralfate (MD 0.15 days, 95% CI ‐2.12 to 2.43; Analysis 11.5). For this outcome, heterogeneity was considerable (Chi² = 45.57, df = 6.0 (P = 0.0), I² = 86%). Cook 1998 reported insufficient data for inclusion in our meta‐analyses. The median duration of intubation was seven days and eight days, respectively, in the ranitidine group (n = 596) and the sucralfate group (n = 604).
Duration of ICU stay
We classified studies on the basis of their intervention and comparison arms (as shown in Analysis 11.6). In the six included studies (N = 1791), 904 participants received ranitidine or famotidine and 887 received sucralfate. Data seemed to show no difference between the two groups with respect to duration of ICU stay (MD 0.01 days, 95% CI ‐1.92 to 1.95). For this outcome, heterogeneity was considerable (Chi² = 28.48, df = 5.0 (P = 0.0), I² = 82%) and heterogeneity could not be explained by differences among the different subcomparisons. We judged the certainty of this evidence as very low.
Cimetidine versus sucralfate
We found one study that was relevant to this comparison (N = 213). We found no evidence of a clear difference between the two groups (MD 0.0 days, 95% CI ‐3.05 to 3.05; Analysis 11.6). Another study with 300 participants did not provide sufficient data for inclusion in our meta‐analyses, but data seemed to show no difference between cimetidine (median number of days = 4; n = 100) and sucralfate (median number of days = 3; n = 100) or control (median number of days = 3; n = 100) with respect to duration of ICU stay (Ben‐Menachem 1994).
Famotidine versus sucralfate
We found one study that was relevant to this comparison (N = 140). We found no evidence of a clear difference between the two groups (MD 2.2 days, 95% CI ‐0.96 to 5.36; Analysis 11.6).
Ranitidine versus sucralfate
We found four studies that were relevant to this comparison (N = 1438). We found no evidence of a clear difference between the two groups (MD ‐0.43 days, 95% CI ‐2.70 to 1.84; Analysis 11.6). This comparison had considerable heterogeneity (Chi² = 21.37, df = 3.0 (P = 0.0), I² = 85%). Cook 1998 reported insufficient data for inclusion in meta‐analyses. The median length of ICU stay in both groups was nine days (n = 596 and 604, respectively).
Number of participants requiring blood transfusion
We classified studies on the basis of their intervention and comparison arms (as shown in Analysis 11.7). In the nine included studies (N = 1095), 603 participants received cimetidine or ranitidine and 492 received sucralfate. Blood transfusions were required by 4.5% and 3.5% of participants in the two groups. Data seemed to show no difference between study arms with respect to the number of participants requiring blood transfusion (RR 1.25, 95% CI 0.70 to 2.23). We judged the certainty of this evidence as low.
Cimetidine versus sucralfate
We included five relevant studies in this comparison (N = 732). We found no evidence of a clear difference between the two groups (RR 1.00, 95% CI 0.47 to 2.16; Analysis 11.7).
Ranitidine versus sucralfate
We found four studies that were relevant to this comparison (N = 363). We found no evidence of a clear difference between the two groups (RR 1.77, 95% CI 0.71 to 4.39; Analysis 11.7).
Units of blood transfused
We classified the single study that contributed data for this outcome from its intervention and comparison arms (as shown in Analysis 11.8) (Ben‐Menachem 1994). In the included study (N = 200), 100 participants received cimetidine and 100 received sucralfate. The mean number of units of blood transfused was 1.6 (1.3) and 2.0 (2.0). Data seemed to show no difference between the two groups with respect to the mean number of units of blood transfused (MD ‐0.40, 95% CI ‐0.87 to 0.07). An additional study did not provide enough data (no SE or SD reported) for inclusion in formal meta‐analysis (Fabian 1993). This study reported that the mean number of required blood transfusions was 9.0 in the sucralfate group (n = 206) and 10.3 in the cimetidine group (n = 410).
Adverse events of interventions
We classified studies on the basis of their intervention and comparison arms (as shown in Analysis 11.9). We identified six studies relevant to this outcome and divided the data from these studies according to eight adverse events.
Thrombocytopaenia
We found two studies that were relevant to this adverse event (N = 240). We found no evidence of a clear difference between the two groups (RR 4.72, 95% CI 0.56 to 39.47; Analysis 11.9).
Nausea and vomiting
We found two studies that were relevant to this comparison (N = 137). Nausea and vomiting seemed to be reduced in the H2 receptor antagonists arm (RR 0.07, 95% CI 0.01 to 0.54; two studies; 137 participants; Analysis 11.9).
Hypermagnesaemia
We found one study that was relevant to this adverse event (N = 40). Data show no clear difference between H2 receptor antagonists and sucralfate (RR 2.71, 95% CI 0.31 to 23.93; Analysis 11.9).
Rash/Erythema
We found two relevant studies for this adverse event (N = 233). We found no evidence of a clear difference between the two groups (RR 3.06, 95% CI 0.32 to 28.87; Analysis 11.9).
Confusion
We identified three relevant studies for this adverse event (N = 382). We found no evidence of a clear difference between the two groups (RR 4.48, 95% CI 0.77 to 26.0; Analysis 11.9).
Neutropaenia
We found one study that was relevant to this adverse event (N = 114). We found no evidence of a clear difference between the two groups (RR 5.18, 95% CI 0.25 to 105.47; Analysis 11.9).
Dryness of mouth
We identified a single study for this adverse event (N = 67). Data show no clear difference between H2 receptor antagonists and sucralfate for this adverse event (RR 5.15, 95% CI 0.26 to 103.33; Analysis 11.9).
Leucopaenia
We found one study that was relevant to this adverse event (N = 163). We found no evidence of a clear difference between the two groups (RR 3.11, 95% CI 0.13 to 75.26; Analysis 11.9).
H2 receptor antagonists versus anticholinergics
For this comparison, data on five of our pre‐defined outcomes were available. Among the four studies that provided data for this comparison, ranitidine was administered in two studies, cimetidine in one, and famotidine in one.
Clinically important upper GI bleeding
We classified studies on the basis of their intervention and comparison arms (as shown in Analysis 12.1). In the three included studies (N = 556), 285 participants received either ranitidine or cimetidine, and 271 received pirenzepine. Clinically important upper GI bleeding occurred in 4.2% and 3.0% of participants in the two groups. Data seemed to show no difference between the two groups with respect to the occurrence of clinically important upper GI bleeding (RR 1.37, 95% CI 0.58 to 3.26). We rated the certainty of this evidence as low.
Cimetidine versus pirenzepine
We included a single study in this comparison (N = 55). Data show no clear difference between H2 receptor antagonists and anticholinergics (RR 1.45, 95% CI 0.26 to 7.99; Analysis 12.1).
Ranitidine versus pirenzepine
We included two relevant studies in this comparison (N = 501). For this comparison, we found no evidence of a clear difference between the two groups (RR 1.35, 95% CI 0.50 to 3.67; Analysis 12.1).
Nosocomial pneumonia
We classified studies on the basis of their intervention and comparison arms (as shown in Analysis 12.2). In the three included studies (N = 544), 279 participants received ranitidine or famotidine, and 265 received pirenzepine. Nosocomial pneumonia occurred in 6.5% and 5.3% of participants in both groups. Data seemed to show no difference between the two groups with respect to occurrence of the outcome of interest (RR 0.96, 95% CI 0.50 to 1.84). We judged the certainty of this evidence as low.
Famotidine versus pirenzepine
We found one study that was relevant to this comparison (N = 43). Data show no clear difference between H2 receptor antagonists and anticholinergics (RR 0.32, 95% CI 0.01 to 7.42; Analysis 12.2).
Ranitidine versus pirenzepine
We found two studies that were relevant to this comparison (N = 501). Data show no clear difference between H2 receptor antagonists and anticholinergics (RR 1.03, 95% CI 0.53 to 2.01). This comparison had moderate heterogeneity (Chi² = 1.42, df = 0.23 (P = 0.11), I² = 30%; Analysis 12.2).
All‐cause mortality in ICU
We classified studies on the basis of their intervention and comparison arms (as shown in Analysis 12.3). In the two included studies (N = 501), 257 participants received ranitidine and 244 received pirenzepine. All‐cause mortality occurred in 5.8% and 6.6% of participants in the two groups. Data seemed to show no difference between the two groups with respect to occurrence of the outcome of interest (RR 0.89, 95% CI 0.21 to 3.87). This outcome had substantial heterogeneity (Chi² = 4.08, df = 1.0 (P = 0.04), I² = 75%). We judged the certainty of this evidence as very low.
Duration of ICU stay
We identified one study that looked at this outcome but did not report sufficient data for inclusion in formal meta‐analyses (Hanisch 1998). In the included study, 57 participants received ranitidine and 44 received pirenzepine. The mean duration of ICU stay was 9.7 days (2 to 95) and 9.9 days (2 to 39), respectively.
Duration of intubation
We identified one study that looked at this outcome but did not report sufficient data for inclusion in formal meta‐analyses (Hanisch 1998). In the included study, 57 participants received ranitidine and 44 received pirenzepine. The mean duration of mechanical ventilation was 8.2 days (2 to 93) and 8.0 days (2 to 32), respectively.
Number of participants requiring blood transfusions
We classified the study on the basis of its intervention and comparison arms (as shown in Analysis 12.4). In the included study, 57 participants received ranitidine and 44 received pirenzepine. The event occurred in 5.3% and 6.8% of participants in the two groups. Data seemed to show no difference between the two groups with respect to the number of participants requiring blood transfusion (RR 0.77, 95% CI 0.16 to 3.64). We judged the certainty of this evidence as low.
Number of units of blood transfused
We identified one study that looked at this outcome but did not report sufficient data for inclusion in formal meta‐analyses (Hanisch 1998). In the included study, 57 participants received ranitidine and 44 received pirenzepine. The mean number of units of blood transfused was two units for each of the three participants with GI bleeding in the ranitidine group, and four units for each of the four participants with GI bleeding in the pirenzepine group.
Adverse events of interventions
We classified studies on the basis of their intervention and comparison arms and adverse events of interventions (as shown in Analysis 12.5). Researchers reported no adverse events other than tachycardia and high temperature.
Tachycardia
A single study looked at this adverse event (N = 55). Data show no clear difference between H2 receptor antagonists and anticholinergics for tachycardia (RR 0.11, 95% CI 0.01 to 1.90; Analysis 12.5).
High temperature
We found one study that looked at this adverse event (N = 43). For this adverse event, we found no evidence of a clear difference between the two groups (RR 0.53, 95% CI 0.21 to 1.32; Analysis 12.5).
H2 receptor antagonists versus prostaglandin analogues
For this comparison, data on two of our pre‐defined outcomes were available. One study provided data for this comparison. Study groups received ranitidine (n = 64) and misoprostol (n = 63), respectively. The only outcomes measured that were relevant for this review were clinically important upper GI bleeding and all‐cause mortality in the ICU.
Clinically important upper GI bleeding
We classified this study on the basis of intervention and comparison arms (as shown in Analysis 13.1). In the single included study, 64 participants received cimetidine and 63 received misoprostol. Clinically important upper GI bleeding occurred in 4.7% and 11.1% of participants in the two groups. Data seemed to show no difference between the two groups with respect to the occurrence of clinically important upper GI bleeding (RR 0.42, 95% CI 0.11 to 1.56). We judged the certainty of this evidence as low.
All‐cause mortality in ICU
We classified this study on the basis of intervention and comparison arms (as shown in Analysis 13.2). In the included study, 64 participants received cimetidine and 63 received misoprostol. All‐cause mortality occurred in 39.1% and 30.2% of participants in the two groups. Data seemed to show no difference between the two groups with respect to all‐cause mortality (RR 1.30, 95% CI 0.80 to 2.10). We judged the certainty of this evidence as moderate.
H2 receptor antagonists versus teprenone
For this comparison, data on three of our pre‐defined outcomes were available. One study provided data for this comparison. Study groups received ranitidine or teprenone, respectively. The only outcomes measured that were relevant for this review were clinically important upper GI bleeding, all‐cause mortality in the ICU, and number of participants requiring blood transfusion.
Clinically important upper GI bleeding
We classified this study on the basis of intervention and comparison arms (as shown in Analysis 14.1). In the included study, 70 participants received ranitidine and 70 received teprenone. Clinically important upper GI bleeding occurred in 5.7% and 5.7% of participants in the two groups. Data seemed to show no difference between the two groups with respect to the occurrence of clinically important upper GI bleeding (RR 1.00, 95% CI 0.26 to 3.84). We judged the certainty of this evidence as low.
All‐cause mortality in ICU
We classified this study on the basis of intervention and comparison arms (as shown in Analysis 14.2). In the included study, 70 participants received ranitidine and 70 received teprenone. All‐cause mortality in the ICU occurred in 1.4% and 1.4% of participants in the two groups. Data seemed to show no difference between the two groups with respect to all‐cause mortality (RR 1.00, 95% CI 0.06 to 15.67). We judged the certainty of this evidence as moderate.
Number of participants requiring blood transfusions
We classified this study on the basis of intervention and comparison arms (as shown in Analysis 14.3). In the included study, 70 participants received ranitidine and 70 received teprenone. Blood transfusions were required by 5.7% and 5.7% of participants in both groups. Data seemed to show no difference between the two groups with respect to the number that needed blood transfusion (RR 1.00, 95% CI 0.26 to 3.84). We judged the certainty of this evidence as moderate.
H2 receptor antagonists plus antacids versus sucralfate
For this comparison, data on six of our pre‐defined outcomes were available. Among the three studies that provided data for this comparison, cimetidine was administered in Cioffi 1994, ranitidine was administered in Sirvent 1994, and either ranitidine or cimetidine was administered in Driks 1987, along with antacids, and outcomes were compared with those following administration of sucralfate.
Clinically important upper GI bleeding
We classified studies on the basis of their intervention and comparison arms (as shown in Analysis 15.1). In the two included studies that contributed data to this outcome, 119 participants received ranitidine or cimetidine plus antacids, and 111 received sucralfate. Clinically important upper GI bleeding occurred in 1.7% and 8.1% of participants in the two groups. Data seemed to show a beneficial effect of H2 receptor antagonists plus antacids compared with sucralfate with respect to the occurrence of upper GI bleeding (RR 0.24, 95% CI 0.06 to 0.95). We judged the certainty of this evidence as moderate.
Cimetidine plus antacids versus sucralfate
We included a single study in this comparison (N = 100). We found no evidence of a clear difference between the two groups (RR 0.14, 95% CI 0.01 to 2.70).
Ranitidine plus antacids versus sucralfate
We included a single study in this comparison (N = 51) (Sirvent 1994). We found no evidence of a clear difference between the two groups, for no events were reported in either treatment group.
Cimetidine or ranitidine plus antacids versus sucralfate
We included a single study in this comparison (N = 130). We found no evidence of a clear difference between the two groups (RR 0.29, 95% CI 0.06 to 1.41).
Nosocomial pneumonia
We classified studies on the basis of their intervention and comparison arms (as shown in Analysis 15.2). In the three included studies, 144 participants received cimetidine or ranitidine plus antacids, and 137 received sucralfate. Nosocomial pneumonia occurred in 25.0% and 24.1% of participants in the two groups. For this outcome, heterogeneity was substantial (Chi² = 6.36, df = 2.0 (P = 0.04), I² = 69%), and data seemed to show no difference between the two groups with respect to the occurrence of nosocomial pneumonia (RR 1.09, 95% CI 0.51 to 2.32). We judged the certainty of this evidence as very low.
Cimetidine plus antacids versus sucralfate
We included a single study in this comparison (N = 100). We found no evidence of a clear difference between the two groups (RR 0.53, 95% CI 0.26 to 1.07).
Ranitidine plus antacids versus sucralfate
We included a single study in this comparison (N = 51). We found no evidence of a clear difference between the two groups (RR 1.27, 95% CI 0.64 to 2.53).
Cimetidine or ranitidine plus antacids versus sucralfate
We included a single study in this comparison (N = 130). We found no evidence of a clear difference between the two groups (RR 2.02, 95% CI 0.89 to 4.58).
All‐cause mortality in ICU
We classified studies on the basis of their intervention and comparison arms (as shown in Analysis 15.3). In the two included studies, 119 participants received cimetidine or ranitidine plus antacids, and 111 received sucralfate. All‐cause mortality occurred in 35.3% and 25.2% of participants in the two groups. Data seemed to show no difference between the two groups with respect to all‐cause mortality in the ICU (RR 1.38, 95% CI 0.92 to 2.05).
Cimetidine plus antacids versus sucralfate
We included a single study in this comparison (N = 100). We found no evidence of a clear difference between the two groups (RR 1.00, 95% CI 0.46 to 2.19).
Cimetidine or ranitidine plus antacids versus sucralfate
We included a single study in this comparison (N = 130). We found no evidence of a clear difference between the two groups (RR 1.57, 95% CI 0.99 to 2.50).
Duration of ICU stay
We classified this study on the basis of its intervention and comparison arms (as shown in Analysis 15.4). In the included study, 69 participants received cimetidine or ranitidine plus antacids, and 61 received sucralfate. Data seemed to show no difference between the two groups with respect to duration of ICU stay (MD 3.60 days, 95% CI ‐1.11 to 8.31). We judged the certainty of this evidence as low.
Duration of intubation
We classified studies on the basis of their intervention and comparison arms (as shown in Analysis 15.5). In the two included studies, 119 participants received cimetidine or ranitidine plus antacids, and 111 received sucralfate. Data seemed to show no difference in duration of intubation for both study groups (MD ‐1.24 days, 95% CI ‐13.82 to 11.33). Heterogeneity was substantial for this outcome (Chi² = 4.32, df = 1.0 (P = 0.04), I² = 77%).
Cimetidine plus antacids versus sucralfate
We included a single study in this comparison (N = 100). We found evidence showing a clear difference between the two groups (MD ‐8.80 days, 95% CI ‐20.11 to ‐2.51). Results favour the cimetidine plus antacids arm.
Cimetidine or ranitidine plus antacids versus sucralfate
We included a single study in this comparison (N = 130). We found no evidence of a clear difference between the two groups (MD 4.20 days, 95% CI ‐0.54 to 8.94).
Number of participants requiring blood transfusions
We classified this study on the basis of its intervention and comparison arms (as shown in Analysis 15.6). In the included study, 69 participants received cimetidine or ranitidine plus antacids, and 61 received sucralfate. Blood transfusions were required by 0% and 1.6% of participants in both groups. Data seemed to show no difference between the two groups with respect to the number of participants requiring blood transfusion (RR 0.30, 95% CI 0.01 to 7.12). We judged the certainty of this evidence as low.
Proton pump inhibitors versus teprenone
For this comparison, data on two of our pre‐defined outcomes were available, and only one study contributed data.
Clinically important upper GI bleeding
We classified this study on the basis of its intervention and comparison arms (as shown in Analysis 16.1). In the single included study, 70 participants received proton pump inhibitors and 70 received teprenone. Clinically important upper GI bleeding occurred in 0% and 5.7% of participants in both groups. We found no evidence of a clear difference between the two groups in this comparison (RR 0.11, 95% CI 0.01 to 2.03; Analysis 16.1). We judged the certainty of this evidence as low.
All‐cause mortality in ICU
We classified this study on the basis of its intervention and comparison arms (as shown in Analysis 16.2). In the single included study, 70 participants received proton pump inhibitors and 70 received teprenone. All‐cause mortality occurred in 0% and 0.7% of participants in both groups. Data show no clear difference between proton pump inhibitors and teprenone (RR 0.33, 95% CI 0.01 to 8.04). We judged the certainty of this evidence as moderate.
Number of participants requiring blood transfusion
We classified this study on the basis of its intervention and comparison arms (as shown in Analysis 16.3). In the single included study, 70 participants received proton pump inhibitors and 70 received teprenone. Data show no clear difference between proton pump inhibitors and teprenone with respect to the number of participants requiring blood transfusion (RR 0.11, 95% CI 0.01 to 2.03). We judged the certainty of this evidence as moderate.
Proton pump inhibitors plus naloxone versus naloxone
For this comparison, data on three of our pre‐defined outcomes were available. One study contributed data towards this comparison (He 2017). In the single included study, 60 participants received proton pump inhibitors (pantoprazole) plus naloxone, and 60 received naloxone alone.
Clinically important upper GI bleeding
We classified this study on the basis of its intervention and comparison arms (as shown in Analysis 17.1). Clinically important upper GI bleeding occurred in 1.6% and 8.33% of participants of the two groups, respectively. We found no evidence of a clear difference between the two groups in this comparison (RR 0.19, 95% CI 0.02 to 1.65; one study; 120 participants).
All‐cause mortality in the hospital
We classified this study on the basis of its intervention and comparison arms (as shown in Analysis 17.2). All‐cause mortality occurred in 5.0% and 21.7% of participants in the two groups, respectively. Data seemed to show a beneficial effect of pantoprazole plus naloxone on all‐cause mortality in the hospital (RR 0.23, 95% CI 0.06 to 0.89; one study; 120 participants).
Adverse events
We classified this study on the basis of its intervention and comparison arms (as shown in Analysis 17.3). Gastrointestinal discomfort, the only adverse event reported, occurred in 10.0% and 18.33% of participants in the two groups, respectively. We found no evidence of a clear difference between the two groups for this comparison (RR 0.40, 95% CI 0.14 to 1.14; one study; 120 participants).
Proton pump inhibitors versus other medication (not defined)
For this comparison, data on three of our pre‐defined outcomes were available. One study contributed data towards this comparison. In the single included study, 60 participants received proton pump inhibitors (lansoprazole), and 60 received other medication not further specified.
Clinically important upper GI bleeding
We classified this study on the basis of its intervention and comparison arms (as shown in Analysis 18.1). Clinically important upper GI bleeding occurred in 0% and 10.0% of participants in the two groups, respectively. We found no evidence of a clear difference between the two groups for this comparison (RR 0.08, 95% CI 0.00 to 1.34).
Nosocomial pneumonia
We classified this study on the basis of its intervention and comparison arms (as shown in Analysis 18.2). Nosocomial pneumonia occurred in 6.7% and 10% of participants in the two groups, respectively. We found no evidence of a clear difference between the two groups in this comparison (RR 0.67, 95% CI 0.20 to 2.24).
All‐cause mortality in hospital
For this outcome, we found a single study (N = 120). All‐cause mortality in the hospital occurred in 10% and 0% of participants in the two groups, respectively. Data seemed to show no clear difference between proton pump inhibitors and other medication (not defined) (RR 5.00, 95% CI 0.25 to 102.00).
Antacids versus sucralfate
For this comparison, data on eight of our pre‐defined outcomes were available. Among the 16 studies that provided data for this comparison, one study administered pirenzepine as a co‐intervention in both arms (Tryba 1985).
Clinically important upper GI bleeding
We classified studies on the basis of their intervention and comparison arms (as shown in Analysis 19.1). In the 16 included studies (N = 1772), 890 participants received antacids and 882 received sucralfate. The event occurred in 6.6% of participants in both groups. Data seemed to show no clear differences between the two groups with respect to the occurrence of clinically important upper GI bleeding (RR 1.00, 95% CI 0.72 to 1.39). We judged the certainty of this evidence as low.
Antacids versus sucralfate
We found 15 studies that were relevant to this comparison (N = 1705). We found no evidence of a clear difference between the two groups (RR 0.96, 95% CI 0.69 to 1.35; Analysis 19.1).
Antacid plus pirenzepine versus sucralfate plus pirenzepine
We found one study that was relevant to this comparison (N = 67). Data seemed to show no clear difference between antacids and sucralfate (RR 5.15, 95% CI 0.26 to 103.33; Analysis 19.1).
Nosocomial pneumonia
We classified studies on the basis of their intervention and comparison arms (as shown in Analysis 19.2). In the seven studies that contributed to this outcome, 501 participants received antacids and 495 received sucralfate. The event occurred in 24.4% and 23.2% of participants in the two groups. Data seemed to show no clear difference between the two groups with respect to the occurrence of nosocomial pneumonia (RR 1.04, 95% CI 0.84 to 1.30). We judged the certainty of this evidence as low.
All‐cause mortality in ICU
We classified studies on the basis of their intervention and comparison arms (as shown in Analysis 19.3). In the 11 studies that contributed to this outcome (N = 1249), 628 participants received antacids and 621 received sucralfate. The event occurred in 23.9% and 20.6% of participants in the two groups. Data seemed to show no clear difference between the two groups with respect to all‐cause mortality in the ICU (RR 1.15, 95% CI 0.93 to 1.40). We judged the certainty of this evidence as low.
Antacid versus sucralfate
We found 10 studies that were relevant to this comparison (N = 1182). Data seemed to show no clear difference between antacids and sucralfate (RR 1.15, 95% CI 0.94 to 1.41; Analysis 19.3).
Antacid plus pirenzepine versus sucralfate plus pirenzepine
We found one study that was relevant to this comparison (N = 67). Data seemed to show no clear difference between antacids plus pirenzepine and sucralfate plus pirenzepine (RR 1.03, 95% CI 0.28 to 3.78; Analysis 19.3).
All‐cause mortality in hospital
We classified studies on the basis of their intervention and comparison arms (as shown in Analysis 19.4). In the three studies that contributed to this outcome (N = 450), 227 participants received antacids and 223 received sucralfate. The event occurred in 33.0% and 33.2% of participants in both groups. Data seemed to show no clear difference between the two groups with respect to all‐cause mortality in the hospital (RR 0.98, 95% CI 0.69 to 1.39). This outcome had moderate heterogeneity (Chi² = 3.38, df = 2.0 (P = 0.18), I² = 41%).
Duration of ICU stay
We classified studies on the basis of their intervention and comparison arms (as shown in Analysis 19.5). In the two studies that contributed to this outcome, 120 participants received antacids and 107 received sucralfate. Data seemed to show no clear difference between the two groups with respect to duration of ICU stay (MD ‐2.50 days, 95% CI ‐6.61 to 1.61). We rated the certainty of this evidence as low.
Duration of intubation
We classified studies on the basis of their intervention and comparison arms (as shown in Analysis 19.6). In the four studies that contributed to this outcome (N = 281), 142 participants received antacids and 139 received sucralfate. Data seemed to show no clear difference between the two groups with respect to duration of intubation (standardised mean difference (SMD) ‐0.18, 95% CI ‐0.41 to 0.06).
Number of participants requiring blood transfusion
We classified studies on the basis of their intervention and comparison arms (as shown in Analysis 19.7). In the six studies that contributed to this outcome (N = 667), 338 participants received antacids and 329 received sucralfate. The event occurred in 3.6% and 5.2% of participants in the two groups. Data seemed to show no clear difference between the two groups with respect to the number of participants requiring blood transfusion (RR 0.73, 95% CI 0.40 to 1.34). We judged the certainty of this evidence as low.
Adverse events of interventions
We classified studies on the basis of their intervention and comparison arms and adverse events of the intervention (as shown in Analysis 19.8). We identified nine studies that were relevant to this outcome and categorised data into six adverse events as reported in these studies.
Diarrhoea
We identified six relevant studies for this outcome (N = 599). For this outcome, we found evidence suggesting that antacids were clearly different in their effects compared with sucralfate. This event occurred in 11.4% and 0% of the participants in both groups (RR 12.4, 95% CI 3.88 to 39.64; Analysis 19.8). Results favour the sucralfate arm.
Hypermagnesaemia
We found four studies that were relevant to this outcome (N = 317). For this outcome, we found evidence suggesting that antacids were clearly different in their effects compared with sucralfate (RR 4.72, 95% CI 1.24 to 17.95; Analysis 19.8). This event occurred in 6.5% and 0.6% of participants in the two groups. Results favour the sucralfate arm.
Nausea and vomiting
We included three relevant studies for this outcome (N = 223). For the occurrence of nausea and vomiting, we found no evidence of a clear difference between the two groups (RR 0.63, 95% CI 0.28 to 1.41; Analysis 19.8). This event occurred in 7.0% and 11.9% of participants in the two groups.
Thrombocytopaenia
We included a single study that looked at this outcome (N = 38). Data show no clear difference between antacids and sucralfate with respect to the occurrence of thrombocytopaenia (RR 5.00, 95% CI 0.26 to 97.70; Analysis 19.8). This event occurred in 10.5% and 0% of the participants in both groups.
Severe alkalosis
We found one study that was relevant to this outcome (N = 100). Data show no clear difference between antacids and sucralfate (RR 3.00, 95% CI 0.13 to 71.92; Analysis 19.8). This event occurred in 2.0% and 0% of the participants in both groups.
Allergic reactions
We found one study that was relevant to this outcome (N = 100). For this comparison, we found no evidence of a clear difference between the two groups (RR 0.20, 95% CI 0.01 to 4.06; Analysis 19.8). Allergic reactions occurred in 0% and 4.0% of participants in the two groups.
Antacids versus prostaglandin analogues
For this comparison, data on three of our pre‐defined outcomes were available. Two studies contributed data for this comparison.
Clinically important upper GI bleeding
We classified studies on the basis of their intervention and comparison arms (as shown in Analysis 20.1). In the two included studies (N = 329), 162 participants received antacids and 185 participants received prostaglandin analogues. This event occurred in 2.4% and 7.8% of participants in the two groups. Data seemed to show a beneficial effect of antacids compared with prostaglandin analogues on the occurrence of clinically important upper GI bleeding (RR 0.33, 95% CI 0.12 to 0.91). Results favour antacids. We judged the certainty of this evidence as moderate.
All‐cause mortality in ICU
We classified studies on the basis of their intervention and comparison arms (as shown in Analysis 20.2). In the two studies that contributed to this outcome (N = 417), 206 participants received antacids and 211 received prostaglandin analogues. This event occurred in 6.3% and 7.6% of participants in both groups. Data show no difference between the two groups with respect to all‐cause mortality in the ICU (RR 0.84, 95% CI 0.42 to 1.67). We judged the certainty of this evidence as low.
Adverse events of interventions
We classified this study on the basis of its intervention and comparison arms and adverse events of the intervention (as shown in Analysis 20.3).
Diarrhoea
We found only one study that was relevant to this comparison (N = 368). We found no evidence of a clear difference between the two groups (RR 0.92, 95% CI 0.64 to 1.33; Analysis 20.3).
Elevated serum bicarbonate
We found one study that was relevant to this comparison (N = 338). We found evidence of a clear difference between antacids and prostaglandin analogues with respect to the occurrence of elevated serum bicarbonate (RR 2.21, 95% CI 1.27 to 3.87; Analysis 20.3).
Phospate levels below 2.5 mg/dL
We found one study that was relevant to this outcome (N = 276). We found evidence of a clear difference between antacids and prostaglandin analogues for the occurrence of phosphate levels below 2.5 mg/dL (RR 1.66, 95% CI 1.01 to 2.73; Analysis 20.3). Results favour prostaglandin analogues.
Antacids versus bioflavonoids
For this comparison, data on two of our pre‐defined outcomes were available. Only one study contributed data towards this comparison. In the single included study, 113 participants received antacids and 85 received bioflavonoids.
Clinically important upper GI bleeding
We classified this study on the basis of its intervention and comparison arms (as shown in Analysis 21.1). Clinically important upper GI bleeding occurred in 5.3% of participants in the antacid arm and in 8.2% of participants in the bioflavonoid arm. Data show no difference between the two groups with respect to the occurrence of clinically important upper GI bleeding (RR 0.64, 95% CI 0.22 to 1.85; 198 participants; one study). We judged the certainty of this evidence as low.
Number of participants requiring blood transfusion
We classified this study on the basis of its intervention and comparison arms (as shown in Analysis 21.2). In the single included study, 113 participants received antacids and 85 received bioflavonoids. This event occurred in 2.4% of participants in the bioflavonoid arm and in no participants in the antacids arm. Data show no difference between the two groups with respect to the number of participants requiring blood transfusion (RR 0.15, 95% CI 0.01 to 3.10; 198 participants; one study). We judged the certainty of this evidence as low.
Sucralfate versus proton pump inhibitors
For this comparison, data on eight of our pre‐defined outcomes were available. Three studies contributed data for this comparison.
Clinically important upper GI bleeding
We classified studies on the basis of their intervention and comparison arms (as shown in Analysis 22.1). In the three included studies (N = 287), 139 participants received sucralfate and 148 received proton pump inhibitors (omeprazole). Clinically important upper GI bleeding occurred in 5.8% and 2% of participants in both groups. Data showed no difference between the two groups with respect to the occurrence of clinically important upper GI bleeding (RR 2.58, 95% CI 0.77 to 8.63). We judged the certainty of this evidence as low.
Ventilator‐associated pneumonia
We classified studies on the basis of their intervention and comparison arms (as shown in Analysis 22.2). In the four studies that contributed to this outcome (N = 424), 210 participants received sucralfate and 214 received proton pump inhibitors. Nosocomial pneumonia occurred in 16.6% and 25.2% of participants in the two groups. Data showed no difference between the two groups with respect to the occurrence of nosocomial pneumonia (RR 0.67, 95% CI 0.41 to 1.09). We judged the certainty of this evidence as low.
Sucralfate versus omeprazole
We found three studies that were relevant to this comparison (N = 287; n = 139 in the sucralfate arm and n = 148 in the proton pump inhibitor arm). We found no evidence of a difference between the two interventions (RR 0.88, 95% CI 0.57 to 1.36).
Sucralfate versus pantoprazole
We found one study that was relevant to this comparison (N = 137). We found evidence of a clear difference between sucralfate and proton pump inhibitors (RR 0.39, 95% CI 0.20 to 0.75). Results favour the sucralfate arm.
All‐cause mortality in ICU
We classified studies n the basis of their intervention and comparison arms (as shown in Analysis 22.3). In the four studies that contributed to this outcome (N = 424), 205 participants received sucralfate and 219 received proton pump inhibitors (omeprazole). All‐cause mortality in the ICU occurred in 15.6% and 14.6% of participants in both groups. Data show no significant differences between the two groups with respect to all‐cause mortality in the ICU (RR 1.07, 95% CI 0.68 to 1.68). We judged the certainty of this evidence as low.
Sucralfate versus omeprazole
We included three relevant studies in this comparison (N = 287). Data showed no clear difference between sucralfate and proton pump inhibitors (RR 1.26, 95% CI 0.75 to 2.11; Analysis 22.3).
Sucralfate versus pantoprazole
We included a single study in this comparison (N = 137). We found no evidence of a clear difference between the two groups (RR 0.65, 95% CI 0.25 to 1.68; Analysis 22.3).
All‐cause mortality in hospital
We classified studies on the basis of their intervention and comparison arms (as shown in Analysis 22.4). In the two studies that contributed to this outcome (N = 278), 140 participants received sucralfate and 138 received proton pump inhibitors. This event occurred in 13.5% and 17.4% of participants in the two groups. Data showed no significant difference between the two groups with respect to all‐cause mortality in the hospital (RR 0.79, 95% CI 0.46 to 1.37).
Sucralfate versus omeprazole
We included a single study in this comparison (N = 141). Data show no clear difference between sucralfate and proton pump inhibitors (RR 0.97, 95% CI 0.49 to 1.91; Analysis 22.4).
Sucralfate versus pantoprazole
We included a single study in this comparison (N = 137). Data show no clear difference between sucralfate and proton pump inhibitors (RR 0.56, 95% CI 0.21 to 1.45; Analysis 22.4).
Duration of ICU stay
We classified studies on the basis of their intervention and comparison arms (as shown in Analysis 22.5). In the two studies that contributed to this outcome (N = 217), 107 participants received sucralfate and 110 received proton pump inhibitors. Data seemed to show no difference between the two groups with respect to duration of ICU stay (MD 0.01 days, 95% CI ‐1.68 to 1.70). We judged the certainty of this evidence as low.
Duration of intubation
We classified studies on the basis of their intervention and comparison arms (as shown in Analysis 22.6). In the three studies that contributed to this outcome (N = 354), 173 participants received sucralfate and 181 received proton pump inhibitors. Data seemed to show no significant difference between the two groups with respect to duration of intubation (MD ‐0.16 days, 95% CI ‐1.61 to 1.28).
Number of participants requiring blood transfusion
We classified this studies on the basis of their intervention and comparison arms (as shown in Analysis 22.7). In the single study that contributed to this outcome (N = 70), 32 participants received sucralfate and 38 received proton pump inhibitors. Blood transfusions were required by 6.25% and 0% of participants in the two groups, respectively. Data seemed to show differences between the two groups with respect to the number of participants requiring blood transfusion (RR 5.91, 95% CI 0.29 to 118.78). We judged the certainty of this evidence as moderate.
Adverse events of interventions
For this outcome, we found a single study and categorised data according to eight adverse events (N = 1096).
Fever
For this outcome, we found evidence suggesting that sucralfate was clearly different in its effects compared with proton pump inhibitors (RR 0.81, 95% CI 0.70 to 0.94; Analysis 22.8). Researchers reported 54 and 62 events in both treatment arms, respectively. Results favour the sucralfate arm.
Leucocytosis
For this outcome, we found evidence suggesting that sucralfate was clearly different in its effects compared with proton pump inhibitors (RR 0.66, 95% CI 0.55 to 0.80; Analysis 22.8). Researchers reported 45 and 63 events in both treatment arms, respectively. Results favour the sucralfate arm.
Sudden purulent sputum
Data show no clear difference between sucralfate and proton pump inhibitors for this outcome (RR 0.85, 95% CI 0.38 to 1.86; Analysis 22.8). Researchers reported 10 and 11 events in the two treatment arms, respectively.
Sudden cough or aggravation of coughing
We found evidence of a clear difference between sucralfate and proton pump inhibitors within this outcome (RR 0.23, 95% CI 0.07 to 0.79; Analysis 22.8). Researchers reported 3 and 12 events in the two treatment arms, respectively. Results favour the sucralfate arm.
Dyspnoea (breathing discomfort)
We found evidence of a clear difference between sucralfate and proton pump inhibitors within this outcome (RR 0.68, 95% CI 0.54 to 0.87; Analysis 22.8). Researchers reported 39 and 53 events in the two treatment arms, respectively. Results favour the sucralfate arm.
Rales or bronchial sounds
We found evidence of a clear difference between sucralfate and proton pump inhibitors for this outcome (RR 0.31, 95% CI 0.19 to 0.51; Analysis 22.8). Researchers reported 14 and 42 events in the two treatment arms, respectively. Results favour the sucralfate arm.
Aggravation of blood gas exchange
For this comparison, we found no evidence of a clear difference between the two groups (RR 0.76, 95% CI 0.49 to 1.18; Analysis 22.8). Researchers reported 23 and 28 events in the two treatment arms, respectively.
Change in sputum quality
For this outcome, we found evidence suggesting that sucralfate was clearly different in its effects compared with proton pump inhibitors (RR 0.23, 95% CI 0.13 to 0.40; Analysis 22.8). Researchers reported 11 and 45 events in the two treatment arms, respectively. Results favour the sucralfate arm.
Sucralfate versus bioflavonoids
For this comparison, data on two of our pre‐defined outcomes were available. Only one study contributed data towards this comparison.
Clinically important upper GI bleeding
We classified this study on the basis of its intervention and comparison arms (as shown in Analysis 23.1). In the single included study (N = 185), 100 participants received sucralfate and 85 received bioflavonoids. Clinically important upper GI bleeding occurred in 9% of participants in the antacid arm and in 8.2% of participants in the bioflavonoid arm. Data showed no clear difference between the two groups with respect to the occurrence of clinically important upper GI bleeding (RR 1.09, 95% CI 0.43 to 2.81). We judged the certainty of this evidence as low.
Number of participants requiring blood transfusions
We classified this study on the basis of its intervention and comparison arms (as shown in Analysis 23.2). In the single included study (N = 185), 100 participants received antacids and 85 received bioflavonoids. Blood transfusions were required by 1% of participants in the sucralfate arm and by 2.4% of participants in the bioflavonoid arm. Data showed no clear difference between the two groups with respect to the number of participants requiring blood transfusion (RR 0.42, 95% CI 0.04 to 4.61). Results did not favour any intervention. We judged the certainty of this evidence as low.
Total parenteral nutrition versus any other intervention plus total parenteral nutrition
For this comparison, data on three of our pre‐defined outcomes were available. One study contributed data towards this comparison. In the single included study, 30 participants received total parenteral nutrition, 24 received H2 receptor antagonist plus total parenteral nutrition, and 19 received sucralfate plus total parenteral nutrition. We compared the effects of total parenteral nutrition versus H2 receptor antagonists plus total parenteral nutrition and total parenteral nutrition versus sucralfate plus total parenteral nutrition separately.
Clinically important upper GI bleeding
For this outcome, we found a single study and categorised data by two comparisons. We judged the certainty of this evidence as low.
Total parenteral nutrition versus H2 receptor antagonists plus total parenteral nutrition alone
We classified this study on the basis of its intervention and comparison arms (as shown in Analysis 24.1). This event occurred in 3.3% of participants in the total parenteral nutrition arm and in 4.2% of participants in the H2 receptor antagonist (ranitidine) plus total parenteral nutrition arm. Data showed no significant differences between the two groups with respect to the occurrence of clinically important upper GI bleeding (RR 0.80, 95% CI 0.05 to 12.14; 54 participants; one study).
Total parenteral nutrition versus sucralfate plus total parenteral nutrition
We classified this study on the basis of its intervention and comparison arms (as shown in Analysis 24.1). Clinically important upper GI bleeding occurred in 3.3% of participants in the total parenteral nutrition arm and in 10.5% of participants in the sucralfate plus total parenteral nutrition arm. Data seemed to show no difference between the two groups with respect to the occurrence of clinically important upper GI bleeding (RR 0.32, 95% CI 0.03 to 3.26; 49 participants; one study). Results did not favour any intervention.
All‐cause mortality in ICU
For this outcome, we found a single study and categorised data by two comparisons. We judged the certainty of this evidence as low.
Total parenteral nutrition versus H2 receptor antagonists plus total parenteral nutrition
We classified this study on the basis of its intervention and comparison arms (as shown in Analysis 24.2). All‐cause mortality in the ICU occurred in 2.3% of participants in the total parenteral nutrition arm and in 2.1% of participants in the H2 receptor antagonist plus total parenteral nutrition arm. Data seemed to show no difference between the two groups with respect to all‐cause mortality in the ICU (RR 1.12, 95% CI 0.41 to 3.09; 54 participants; one study). Results did not favour any intervention.
Total parenteral nutrition versus sucralfate plus total parenteral nutrition
We classified this study on the basis of its intervention and comparison arms (as shown in Analysis 24.2). All‐cause mortality in the ICU occurred in 23.3% of participants in the total parenteral nutrition arm and in 36.8% of participants in the sucralfate plus total parenteral nutrition arm. Data seemed to show no difference between the two groups with respect to all‐cause mortality in the ICU (RR 0.63, 95% CI 0.26 to 1.52; 49 participants; one study). Results did not favour any intervention.
Duration of intubation
For this outcome, we found a single study and categorised data by two comparisons. We judged the certainty of this evidence as low.
Total parenteral nutrition versus H2 receptor antagonists plus total parenteral nutrition
We classified this study on the basis of its intervention and comparison arms (as shown in Analysis 24.3). Data seemed to show no difference between the two groups with respect to duration of intubation (MD ‐2.00 days, 95% CI ‐9.53 to 5.53; 54 participants; one study).
Total parenteral nutrition versus sucralfate plus total parenteral nutrition
We classified this study on the basis of its intervention and comparison arms (as shown in Analysis 24.3). Data seemed to show no difference between the two groups with respect to duration of intubation (MD 3.00, 95% CI ‐1.50 to 7.50; 49 participants; one study).
Bowel stimulation versus no prophylaxis
One study contributed data towards this comparison. In the single included study, 50 participants received a bowel stimulation protocol and 50 participants received no prophylaxis. This comparison had a single outcome.
Clinically important upper GI bleeding
We classified this study on the basis of its intervention and comparison arms (as shown in Analysis 25.1). Clinically important upper GI bleeding occurred in 14.0% and 36.0% of participants in the two groups, respectively. We found evidence of a clear difference between bowel stimulation and no prophylaxis (RR 0.39, 95% CI 0.18 to 0.85). Results favour the bowel stimulation protocol arm.
Nasojejunal nutrition versus nasogastric nutrition
For this comparison, data on four of our pre‐defined outcomes were available. One study contributed data towards this comparison. In the single included study, 91 participants received nasojejunal nutrition and 89 received nasogastric nutrition.
Clinically important upper GI bleeding
We classified this study on the basis of its intervention and comparison arms (as shown in Analysis 26.1). Clinically important upper GI bleeding occurred in 15.4% and 5.6% of participants in the two groups, respectively. For this outcome, we found evidence suggesting that nasojejunal nutrition was clearly different in its effect compared with nasogastric nutrition (RR 2.74, 95% CI 1.03 to 7.28). Results favour nasogastric nutrition. We judged the certainty of this evidence as moderate.
Nosocomial pneumonia
We classified this study on the basis of its intervention and comparison arms (as shown in Analysis 26.2). Nosocomial pneumonia occurred in 19.8% and 21.3% of participants in the two groups. Data seemed to show no difference between nasojejunal nutrition and nasogastric nutrition (RR 0.93, 95% CI 0.52 to 1.65). We judged the certainty of this evidence as low.
All‐cause mortality in hospital
We classified this study on the basis of its intervention and comparison arms (as shown in Analysis 26.3). All‐cause mortality occurred in 14.3% and 13.5% of participants in the two groups. Data seemed to show no clear difference between nasojejunal nutrition and nasogastric nutrition (RR 1.06, 95% CI 0.51 to 2.19).
Duration of ICU stay
This study did not report enough data for inclusion in formal meta‐analyses. The median duration of the ICU stay was 11 days and 10 days in the nasogastric group (n = 89) and the nasojejunal group (n = 91), respectively.
Duration of mechanical ventilation
This study did not report enough data for inclusion in formal meta‐analyses. The median duration of mechanical ventilation was eight days in both the nasogastric group (n = 89) and the nasojejunal group (n = 91).
Adverse events of interventions
We classified this study on the basis of its intervention and comparison arms (as shown in Analysis 26.4). Researchers reported 77 and 76 adverse events, including vomiting, witnessed aspiration, abdominal distension, and diarrhoea, in the two groups, respectively. We found no evidence of a clear difference between the two groups in this comparison (RR 0.99, 95% CI 0.88 to 1.12).
Enteral plus parenteral nutrition versus other nutrition regimens
For this comparison, data on five of our pre‐defined outcomes were available. One study contributed data towards this comparison (Fan 2016). In the single included study with three treatment arms, 40 participants received enteral plus parenteral nutrition and 80 received other nutrition regimens, 40 received enteral nutrition, and 40 received parenteral nutrition.
Nosocomial pneumonia
We classified this study on the basis of its intervention and comparison arms (as shown in Analysis 27.1). Nosocomial pneumonia occurred in 27.5% and 35.0% of participants in the two groups, respectively. Data seemed to show no clear difference between enteral plus parenteral nutrition and interventions in the other study groups (RR 0.79, 95% CI 0.44 to 1.40; one study; 120 participants).
All‐cause mortality in the hospital
We classified this study on the basis of its intervention and comparison arms (as shown in Analysis 27.2). All‐cause mortality in the hospital occurred in 10.0% and 36.2% of participants in the two groups, respectively. All‐cause mortality seemed to be lower in the group receiving enteral plus parenteral nutrition than in the groups receiving other nutrition regimens (RR 0.20, 95% CI 0.06 to 0.60; one study; 120 participants).
Duration of ICU stay
We classified this study on the basis of its intervention and comparison arms (as shown in Analysis 27.3). Duration of ICU stay seemed to be shorter in the study group receiving enteral plus parenteral nutrition compared with groups receiving other nutrition regimens (MD ‐5.98 days, 95% CI ‐8.81 to ‐3.16; one study; 120 participants).
Duration of intubation
We classified this study on the basis of its intervention and comparison arms (as shown in Analysis 27.4). Duration of intubation seemed to be shorter in the study group receiving enteral plus parenteral nutrition compared with the groups receiving other nutrition regimens (MD ‐7.37 days, 95% CI ‐9.29 to ‐5.45; one study; 120 participants).
Adverse events of interventions
We classified this study on the basis of its intervention and comparison arms (as shown in Analysis 27.5 and following).
Occurence of stress ulcers
Data seemed to show no differences between study groups with respect to the occurrence of stress ulcers (RR 0.69, 95% CI 0.36 to 1.33; one study; 120 participants). Researchers reported nine events in the intervention group and 26 in the control groups.
Diarrhoea
Data seemed to show no difference between study groups with respect to the occurrence of diarrhoea (RR 0.42, 95% CI 0.17 to 1.02; one study; 120 participants). Researchers reported that the event occurred in eight participants in the intervention group and in 30 participants in control groups.
Pyaemia
Data seemed to show no difference between study groups with respect to the occurrence of pyaemia (RR 0.88, 95% CI 0.37 to 2.09; one study; 120 participants). Researchers reported 10 events in the intervention group and 22 events in the control groups.
Intracranial infection
Data seemed to show no difference between study groups with respect to the occurrence of intracranial infection (RR 0.43, 95% CI 0.15 to 1.25; one study; 120 participants). Researchers reported five events in the intervention group and 20 events in the control groups.
Hypoproteinaemia
Data seemed to show a beneficial effect of enteral plus parenteral nutrition on the occurrence of hypoproteinaemia (RR 0.11, 95% CI 0.04 to 0.27; one study; 120 participants). Researchers reported seven events in the intervention group and 54 events in the control groups.
Subgroup analyses
Presence of bleeding disorders
We identified three studies that explicitly reported including patients with bleeding disorders (Conrad 2005; Kantorova 2004; Martin 1992). Only two studies compared a common intervention and a comparator (H2 receptor antagonists vs proton pump inhibitors). Subgroup analyses provided no evidence of a difference between studies that explicitly included patients with bleeding disorders and those that did not include such patients (test for subgroup differences P value = 0.09). Further, there seemed to be no difference between groups with respect to the occurrence of nosocomial pneumonia (test for subgroup differences P value = 0.37) and all‐cause mortality in the ICU (test for subgroup differences P value = 0.52). Researchers provided no data on other outcomes and comparisons for this subgroup that could be formally included in meta‐analysis.
Pneumonia at time of admission
We identified four studies that explicitly reported including participants with pneumonia at the time of ICU admission (Ben‐Menachem 1994; Karlstadt 1990; Martin 1993; Metz 1993). The proportion of participants with pneumonia ranged from 2.33% to 21% in these studies, respectively. All studies compared the effects of H2 receptor antagonists (cimetidine or ranitidine) versus placebo or no prophylaxis. Subgroup analyses provided no evidence of a difference between studies that explicitly included patients with pneumonia at the time of admission and those that did not include such patients (test for subgroup differences P value = 0.28). Data showed no difference between groups with respect to the occurrence of nosocomial pneumonia (test for subgroup differences P value = 0.54) and all‐cause mortality in the ICU (test for subgroup differences P value = 0.20). Researchers provided no data on other outcomes and comparisons for this subgroup that could be formally analysed in meta‐analysis.
Infants and children
We identified five studies that explicitly reported including only children and adolescents (Behrens 1994; Kuusela 1997; Lacroix 1986; Lopez‐Herce 1992; Yildizdas 2002). All participants in these studies were aged from 0 to 20 years. Two studies compared effects of H2 receptor antagonists versus placebo, and three studies had multiple study arms including H2 receptor antagonists, anticholinergics (Behrens 1994), antacids (Lopez‐Herce 1992), sucralfate (Lopez‐Herce 1992;Yildizdas 2002), and proton pump inhibitors (Yildizdas 2002), as well as placebo or no prophylaxis. In infants and adolescents, data showed no difference between H2 receptor antagonists and placebo or no prophylaxis with respect to the occurrence of clinically important upper GI bleeding (test for subgroup differences P value = 0.10), nosocomial pneumonia (test for subgroup differences P value = 0.84), or all‐cause mortality in the ICU (test for subgroup differences P value = 0.52); duration of ICU stay (test for subgroup differences P value = 0.62); duration of intubation (test for subgroup differences P value = 0.75); or number of participants requiring blood transfusion (test for subgroup differences P value = 0.37). Researchers provided no data on other outcomes of this comparison for this subgroup that could be formally included in meta‐analysis.
We detected no differences between H2 receptor antagonists and sucralfate with respect to the occurrence of clinically important upper GI bleeding in infants (test for subgroup differences P value = 0.61), nosocomial pneumonia (test for subgroup differences P value = 0.75), all‐cause mortality in the ICU (test for subgroup differences P value = 0.92), duration of ICU stay (test for subgroup differences P value = 0.84), or duration of intubation (test for subgroup differences P value = 0.90). We found no data on other outcomes in this comparison for this subgroup that could be formally analysed in meta‐analysis. Moreover, researchers provided no data on other outcomes and comparisons for this subgroup that could be formally analysed in meta‐analysis.
The reporting quality of the included studies did not permit other subgroup analyses. No studies explicitly included only adults over the age of 65 years. Thus, insufficient data were available for analysis of the effect of bleeding prophylaxis in older adults only. Furthermore, use of co‐interventions and the level of detail of reporting about co‐interventions varied strongly among studies, so that meaningful subgroup analyses were not possible with respect to differences in effect due to co‐interventions.
Sensitivity analyses
Studies with low risk of bias versus studies with unclear or high risk of bias
Only two studies had an overall low risk of bias (Cook 1998; Ephgrave 1998), and one study had low risk of bias, when risk of performance and detection bias was assessed for upper GI bleeding only (Ng 2012).
Cook 1998 compared H2 receptor antagonists (ranitidine) (n = 596) versus sucralfate (n = 604). This study found lower risk of upper GI bleeding with H2 receptor antagonists (RR 0.44, 95% CI 0.21 to 0.92; one study; 1200 participants) compared with studies with unclear and high risk of bias (RR 1.28, 95% CI 0.98 to 1.66; 23 studies; 2199 participants). Data seemed to show no difference between study groups with respect to the occurrence of nosocomial pneumonia in the study with low risk of bias (RR 1.18, 95% CI 0.92 to 1.51; one study; 1200 participants), and studies with unclear or high risk of bias found increased risk of nosocomial pneumonia (RR 1.21, 95% CI 1.02 to 1.43; 14 studies; 1807 participants). The latter result favoured the sucralfate arm. Data show no differences between studies with low risk of bias and studies with unclear or high risk of bias in the comparison of H2 receptor antagonists versus sucralfate with respect to the outcome all‐cause mortality in the ICU, duration of intubation, and duration of ICU stay. No studies reported data on other outcomes pre‐defined in this review, so that no further sensitivity analyses were possible.
Ephgrave 1998 compared antacids (n = 70) versus sucralfate (n = 70) and reported no differences in effect between the study with low risk of bias and studies with unclear or high risk of bias with respect to the outcomes clinically important upper GI bleeding, nosocomial pneumonia, and all‐cause mortality in the ICU. No other outcomes of this comparison were available for sensitivity analysis.
Ng 2012 compared an H2 receptor antagonist (famotidine) (n = 149) versus a proton pump inhibitor (esomeprazole) (n = 164) and reported no differences in effect between the study with low risk of bias and studies with unclear or high risk of bias with respect to the outcomes clinically important upper GI bleeding and all‐cause mortality in the hospital. No studies reported data on other outcome pre‐defined in this review, so that no further sensitivity analyses were possible.
Studies with attrition greater than 10%
Six studies had an attrition rate greater than 10% (Barandun 1985;Fabian 1993;Hanisch 1998;Israsena 1987;Ruiz‐Santana 1991;Terzi 2009).
Barandun 1985 compared H2 receptor antagonists (n = 28) versus anticholinergics (n = 27) and noted no apparent differences in this comparison with respect to the occurrence of clinically important upper GI bleeding when excluding from analysis the study with an attrition rate of 10% or higher. No other outcomes of this comparison were available for sensitivity analysis.
Fabian 1993 compared H2 receptor antagonists (n = 410) versus sucralfate (n = 206) and noted no apparent differences in this comparison with respect to the occurrence of clinically important upper GI bleeding, nosocomial pneumonia, all‐cause mortality in the ICU or the hospital, duration of ICU stay, and the number of participants requiring blood transfusions when excluding from analysis the study with an attrition rate of 10% or higher. No other outcomes of this comparison were available for sensitivity analysis.
Hanisch 1998 compared an H2 receptor antagonist (ranitidine) (n = 57) versus an anticholinergic (pirenzepine) (n = 44) or placebo (n = 57) and noted no apparent difference in effect size and direction when excluding the study with an attrition rate of 10% from the comparison of H2 receptor antagonists versus anticholinergics or placebo. Neither did direction or strength of effect change when the study with an attrition rate of 10% was removed from the comparison of anticholinergics and placebo.
Israsena 1987 compared antacids (n = 47) versus sucralfate (n = 40) and noted no apparent difference in effect size and direction when excluding from analysis the study with an attrition rate of 10%.
Ruiz‐Santana 1991 was the only study comparing total parenteral nutrition with total parenteral nutrition plus other medications. So, no sensitivity analysis could be performed.
Terzi 2009 compared an H2 receptor antagonist (ranitidine) (n = 10) verus a proton pump inhibitor (pantoprazole) (n = 10) and noted no apparent difference in effect size and direction when excluding from analysis the study with an attrition rate of 10%.
Studies with published and validated criteria to diagnose clinically important upper GI bleeding and nosocomial pneumonia
Lack of detail regarding criteria used to diagnose the primary endpoints of the review did not allow sensitivity analysis.
Discussion
This review includes 107 randomised controlled trials that randomised 15,057 participants admitted to the intensive care unit (ICU) to receive interventions to prevent clinically important upper gastrointestinal (GI) bleeding. The various interventions yielded 27 sets of comparisons.
Summary of main results
Clinically important upper GI bleeding due to stress ulcers is a major contributor to increased morbidity and mortality among patients admitted to ICU. The main objective of this review was to assess whether interventions that are commonly used to prevent upper GI bleeding in patients admitted to the ICU are effective in preventing such bleeding, when used alone or in combination. Interventions most commonly used were H2 receptor antagonists, proton pump inhibitors, anticholinergics, antacids, sucralfate, and prostaglandin analogues. However, one of the most common adverse events associated with using these drugs, as discussed before, consists of raised pH of gastric contents, altered gastric flora, and promotion of tracheobronchial and gastric colonisation with pathogenic bacteria ‐ aspiration of which can cause nosocomial pneumonia or ventilator‐associated pneumonia. Some of the included studies investigated ventilator‐associated pneumonia as one of the outcomes, whereas other studies looked into this outcome in a more generic way and addressed it as 'nosocomial pneumonia'. Because ventilator‐associated pneumonia is considered a type of nosocomial pneumonia, we included results of studies that looked into either of these outcomes under the common term 'nosocomial pneumonia'.
Effect of any intervention versus placebo or no prophylaxis
In comparison with placebo, research findings suggest a beneficial effect of any prophylactic intervention on the occurrence of clinically important upper GI bleeding (risk ratio (RR) 0.47, 95% confidence interval (CI) 0.39 to 0.57; moderate certainty of evidence). Use of any intervention reduced the risk of clinically important upper GI bleeding by 9% (95% CI ‐11% to ‐7%). Data seemed to show no difference between any intervention and placebo or no prophylaxis with respect to the occurrence of any adverse events, including nosocomial pneumonia (low certainty of evidence), all‐cause mortality in the ICU (low certainty of evidence) or the hospital, duration of ICU stay (low certainty of evidence), duration of intubation (low certainty of evidence), number of participants requiring blood transfusions (moderate certainty of evidence), and units of blood transfused.
Effects of single drug classes versus placebo or no prophylaxis
Among the different interventions that were compared with placebo or no prophylaxis, researchers found that antacids, H2 receptor antagonists, antacids, and sucralfate seemed to be effective in preventing clinically important upper GI bleeding in ICU patients and produced significant results. Investigators found that H2 receptor antagonists reduced the risk of clinically important upper GI bleeding by 11% (95% CI ‐0.16 to ‐0.06) compared with placebo or no prophylaxis (RR 0.50, 95% CI 0.36 to 0.70; moderate certainty of evidence). Antacids reduced the risk of bleeding by 9% (95% CI ‐0.17 to ‐0.00) compared with placebo or no prophylaxis. Among ICU patients, sucralfate reduced the risk by 5% (95% CI ‐0.10 to ‐0.01) compared with placebo or no prophylaxis (RR 0.53, 95% CI 0.32 to 0.88; low certainty of evidence). Remaining interventions were not found to be significantly associated with lower rates of occurrence of upper GI bleeding in ICU patients when compared with placebo or no prophylaxis. This might be due to lack of sufficiently large randomised controlled trials (RCTs) in these comparisons.
Results of the review indicate that nosocomial pneumonia might occur more often in ICU patients taking H2 receptor antagonists or sucralfate when compared with ICU patients given placebo or no prophylaxis. Data seem to show no difference between H2 receptor antagonists and placebo or no prophylaxis in the occurrence of nosocomial pneumonia (RR 1.12, 95% CI 0.85 to 1.48; low certainty of evidence). Similarly, there seems to be no difference between sucralfate and placebo or no prophylaxis in the occurrence of nosocomial pneumonia (RR 1.33, 95% CI 0.86 to 2.04; low certainty of evidence).
Effects of one drug class versus another drug class
When H2 receptor antagonists were compared with proton pump inhibitors, evidence of low certainty suggested that proton pump inhibitors were significantly more effective in preventing upper GI bleeding in ICU patients (RR 2.90, 95% CI 1.83 to 4.58). Low‐certainty evidence also suggested no apparent difference in the incidence of nosocomial pneumonia with H2 receptor antagonists compared with proton pump inhibitors (RR 1.02, 95% CI 0.77 to 1.35). Results indicated that the usefulness of proton pump inhibitors over H2 receptor antagonists to prevent upper GI bleeding in ICU patients likely outweighs the possible adverse event of nosocomial pneumonia.
Evidence of low certainty suggested that H2 receptor antagonists compared with sucralfate were not significantly different in preventing upper GI bleeding in ICU patients (RR 1.10, 95% CI 0.87 to 1.41). However, evidence of moderate certainty shows that under H2 receptor antagonists, participants had increased risk of nosocomial pneumonia (RR 1.22, 95% CI 1.07 to 1.40). Evidence of low quality suggests that H2 receptor antagonists and antacids were comparable with respect to the outcomes of upper GI bleeding (RR 0.96, 95% CI 0.67 to 1.36) and nosocomial pneumonia in ICU patients (RR 1.05, 95% CI 0.81 to 1.36).
Evidence of moderate certainty showed that when H2 receptor antagonists plus antacids were compared with sucralfate, GI bleeding occurred in fewer participants taking H2 receptor antagonists plus antacid than those taking sucralfate (RR 0.24, 95% CI 0.06 to 0.95). However, use of H2 receptor antagonists plus antacids was comparable with use of sucralfate in the incidence of nosocomial pneumonia (RR 1.09, 95% CI 0.51 to 2.32; very low certainty of evidence).
This review found no other relevant differences between interventions and comparator interventions with regard to the occurrence of clinically important upper GI bleeding and nosocomial pneumonia.
Overall completeness and applicability of evidence
Completeness
We searched multiple sources for relevant randomised controlled studies and included and excluded studies on the basis of inclusion and exclusion criteria. We believe that we have identified all randomised controlled studies relevant to the objectives of this review. Still evidence gaps indicate that further research would be helpful in guiding decision‐making. One of these gaps reflects lack of evidence about the effects of bleeding prophylaxis on different population subgroups, including people with pneumonia at the time of ICU admission, as well as the effects of co‐interventions such as different feeding regimens, antibiotics, etc., on the effectiveness of bleeding prophylaxis. Furthermore, evidence from RCTs is needed on the effects of proton pump inhibitors on Clostridium difficile infection‐related diarrhoea. This adverse event has been observed in non‐randomised studies but rarely in RCTs. C difficile infection‐related diarrhoea was not included as an outcome of this review at the stage of formulating the review protocol. We identified only two studies that reported on this adverse event (Selvanderan 2015; Wee 2013).
Applicability
Upper GI bleeding occurs in ICU patients as the result of stress ulcers, and excessive blood loss further increases mortality and morbidity among ICU patients. The various interventions that are compared in this review are available worldwide and can prevent bleeding from stress ulcers in ICU patients. Furthermore, no compelling evidence suggests that any interventions clearly increase the risk of ventilator‐associated pneumonia or nosocomial pneumonia, which might further warrant their usage in ICU patients. Evidence from this review shows that among the different interventions, antacids, H2 receptor antagonists, sucralfate, and proton pump inhibitors confer the greatest benefit with respect to the occurrence of clinically important upper GI bleeding. We included studies that investigated the effects of bleeding prophylaxis in a broad spectrum of participants. Populations in these studies included different age groups, both genders, and different reasons for admission, such as burns, trauma, etc. In addition, we included studies that had been conducted in a variety of countries and ICU settings.
Quality of the evidence
We assessed the overall certainty of evidence using the GRADE approach (Schunemann 2008). This approach integrates evaluations regarding study limitations with judgements regarding inconsistency of results, indirectness, or deviations from accepted practice in the way interventions and comparisons were given, as well as populations studied, choice of outcomes, and methods of ascertainment used; imprecision in the estimates in terms of statistical and clinical importance; and the likelihood that publication bias affected the estimates. Overall, the main reasons for downgrading the certainty of evidence were risk of bias in the included studies and imprecision of the overall effect estimate.
Any intervention compared with placebo or no prophylaxis
Certainty of the evidence for any intervention versus placebo or no prophylaxis was moderate for the primary outcome of preventing clinically important upper GI bleeding in ICU patients, meaning that we are moderately confident in the effect estimate. The true effect is likely to be close to the estimate of the effect, but there is a possibility that it is substantially different (summary of findings Table for the main comparison) (Balshem 2011). Certainty of the evidence was judged as low for the outcomes of nosocomial pneumonia, all‐cause mortality in the ICU, duration of ICU stay, and duration of intubation. This means that our confidence in the effect estimate is limited. The true effect may be substantially different from the estimate of the effect. Certainty of evidence for the number of participants requiring blood transfusion was judged as moderate. However, usefulness of the interventions in preventing upper GI bleeding in ICU patients seems to outweigh their adverse effects, such as nosocomial pneumonia, when compared with placebo or no prophylaxis.
H2 receptor antagonists compared with placebo or no prophylaxis
Certainty of the evidence for H2 receptor antagonists versus placebo or no prophylaxis was moderate for the primary outcome of preventing clinically important upper GI bleeding in ICU patients (summary of findings Table 2). Overall certainty of the evidence was judged as low for the outcomes of nosocomial pneumonia, all‐cause mortality in the ICU, duration of ICU stay, and duration of intubation. Certainty for the number of participants requiring blood transfusions was judged as moderate. However, usefulness of the interventions in preventing upper GI bleeding in ICU patients seems to outweigh their adverse effects such as nosocomial pneumonia, when compared with placebo or no prophylaxis.
Antacids compared with placebo or no prophylaxis
Overall certainty of the evidence for antacids versus placebo or no prophylaxis was low for the primary outcome of preventing clinically important upper GI bleeding in ICU patients, as well as for the outcomes all‐cause mortality in the ICU and numbers of participants requiring blood transfusion. None of the included studies reported on nosocomial pneumonia. Given the fact that antacids are no longer the first choice for preventing clinically important upper GI bleeding in ICU patients, further research most probably is not needed for this comparison (summary of findings Table 4).
Sucralfate compared with placebo or no prophylaxis
Although evidence suggests that sucralfate might have a protective effect when compared with placebo or no prophylaxis, overall certainty of the evidence was moderate for the outcome of clinically important upper GI bleeding in ICU patients. Overall certainty of the evidence was judged as low for the outcomes of nosocomial pneumonia, all‐cause mortality in the ICU, duration of ICU stay, and numbers of participants requiring blood transfusion (summary of findings Table 5).
H2 receptor antagonists compared with proton pump inhibitors
Overall certainty of the evidence for H2 receptor antagonists versus proton pump inhibitors was low for the primary outcome of preventing clinically important upper GI bleeding in ICU patients, as well as for the outcomes of nosocomial pneumonia, all‐cause mortality in the ICU, and duration of ICU stay. Certainty of the evidence for the outcome of number of participants requiring blood transfusion was judged as moderate (summary of findings Table 6).
H2 receptor antagonists compared with antacids
Overall certainty of the evidence for H2 receptor antagonists versus antacids was low for clinically important upper GI bleeding and nosocomial pneumonia. Certainty was judged as very low for all‐cause mortality in the ICU and as moderate for the number of participants requiring blood transfusion. However, antacids are no longer the first line of choice for preventing GI bleeding in ICU patients, and further evidence probably is not needed for this comparison (summary of findings Table 7).
H2 receptor antagonists compared with sucralfate
Overall certainty of the evidence was low for H2 receptor antagonists versus sucralfate for the outcome clinically important upper GI bleeding in ICU patients. Overall certainty of the evidence was judged as moderate for the outcome of nosocomial pneumonia. Moreover, certainty of the evidence for the outcomes of all‐cause mortality in the hospital and number of participants requiring blood transfusion was low, and certainty was very low for the outcome duration of ICU stay (summary of findings Table 8). This means that we have very little confidence in the effect estimate. The true effect is likely to be substantially different from the estimate of effect.
Antacids compared with sucralfate
Overall certainty of the evidence for antacids versus sucralfate was low for clinically important upper GI bleeding, nosocomial pneumonia, all‐cause mortality in the ICU, duration of ICU stay, and number of participants requiring blood transfusion (summary of findings Table 9).
Potential biases in the review process
We used standard methods as described in the Cochrane Handbook for Systematic Reviews of Interventions (Higgins 2011). We chose critical and important outcomes for the 'Summary of findings' tables before extracting data from the included studies by using the GRADE approach through discussion.
Given the large numbers of comparisons and outcomes in this review, the review might be prone to false‐positive results. Therefore, all results must be interpreted with caution.
Temporal changes in clinical care and response to ICU patients at increased risk for upper GI bleeding could have contributed to heterogeneity and increased the uncertainty of findings. Exploratory sensitivity analyses by year of publication not reported in further detail did not alter the consistency of study results nor the direction of effect. Included trials included participants with different indications at baseline, which is very important to consider when one is interpreting the findings of this review. Furthermore, treatment regimens varied across the included studies.
Because of the small number of included studies, we did not perform the following subgroup analyses: studies that explicitly included only adults over the age of 65 years, and studies that used any co‐interventions. Additionally, we could not perform the following sensitivity analyses owing to lack of available data from the included trials: studies with published and validated criteria for diagnosis of clinically important upper GI bleeding and nosocomial pneumonia. Results from subgroup analyses must be interpreted with caution because the number of included studies is relatively small and the power to detect any statistical differences in effect is limited. Information from such subgroup and sensitivity analyses would be relevant for guiding decision‐making in practice.
Agreements and disagreements with other studies or reviews
In recent years, several non‐Cochrane reviews have investigated the risk‐benefit profile of bleeding prophylaxis in ICU patients and their findings have been published (Alhazzani 2017; Alquraini 2017; Alshamsi 2016; Barkun 2012; Krag 2014; Pilkington 2012). The most recent reviews confirmed the beneficial effect of stress ulcer prophylaxis on clinically important upper GI bleeding, as is supported by this Cochrane review.
Alhazzani 2017 conducted a network meta‐analysis of randomised controlled studies and found that proton pump inhibitors might be more effective than H2 receptor antagonists but might also increase the risk of ventilator‐associated pneumonia. Similar results were yielded when Barkun 2012 conducted a meta‐analysis. Review authors concluded that routine stress ulcer prophylaxis is not warranted, and that benefits and harms should be carefully considered in practice.
Alquraini 2017 compared sucralfate versus H2 receptor antagonists in ICU patients for prevention of upper GI bleeding and the incidence of pneumonia. This review found no difference between the two treatments in the occurrence of upper GI bleeding but found a lower incidence of nosocomial pneumonia in the sucralfate arm, which confirms the findings of this review.
Alshamsi 2016 compared proton pump inhibitors and H2 receptor antagonists and, among others, their effects on prevention of upper GI bleeding and nosocomial pneumonia. Results of their review confirm our results that proton pump inhibitors were more effective in preventing upper GI bleeding in critically ill patients when compared with H2 receptor antagonists, and that effects of both interventions on the incidence of pneumonia were similar.
Krag 2014 conducted a systematic review using Cochrane methods and compared the effects of H2 receptor antagonists or proton pump inhibitors versus placebo or no treatment. They reported lower risk of upper GI bleeding in the pooled effect of all studies with treatment versus placebo or no treatment. However, they emphasised that this result was not maintained in an analysis of low risk of bias studies only. Similar to our findings, risk of pneumonia was not significantly different between treatment and no prophylaxis or placebo.
Last, Pilkington 2012 compared H2 receptor antagonists versus proton pump inhibitors and found no difference between the two treatments with respect to the occurrence of upper GI bleeding and pneumonia. These findings cannot be confirmed by our review, possibly because we included newer studies.
Overall, existing and recent systematic reviews confirm the results of this review. However, their scope is limited to reporting the effects of two interventions compared with each other or of one or two interventions compared with placebo or no prophylaxis. Published reviews are of reasonable quality as assessed by Cochrane methods (Alshamsi 2016; Krag 2014). and two reviews used the GRADE approach to assess the certainty of evidence (Alhazzani 2017; Alquraini 2017). Therefore, our review constitutes the most comprehensive and most up‐to‐date piece of work on this important medical topic.

PRISMA flow chart of included studies.

Risk of bias graph: review authors' judgements about each risk of bias item presented as percentages across all included studies.

Risk of bias summary: review authors' judgements about each risk of bias item for each included study.
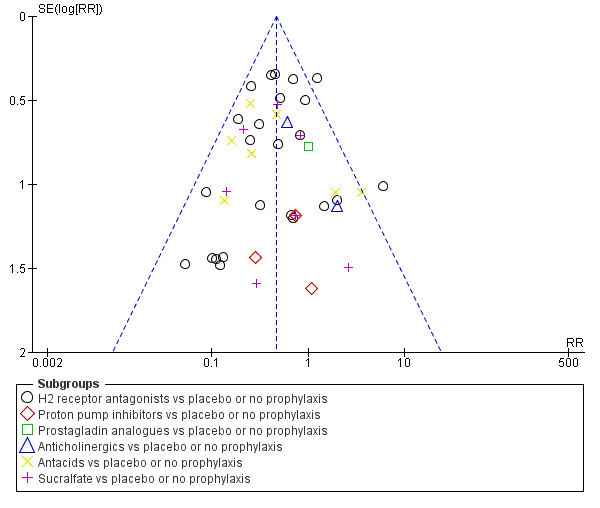
Funnel plot of comparison: 1 Interventions versus placebo or no prophylaxis, outcome: 1.1 Clinically important upper GI bleeding.

Funnel plot of comparison: 2 H2 receptor antagonists versus placebo or no prophylaxis, outcome: 2.1 Clinically important upper GI bleeding.

Funnel plot of comparison: 9 H2 receptor antagonists versus proton pump inhibitors, outcome: 9.1 Clinically important upper GI bleeding.
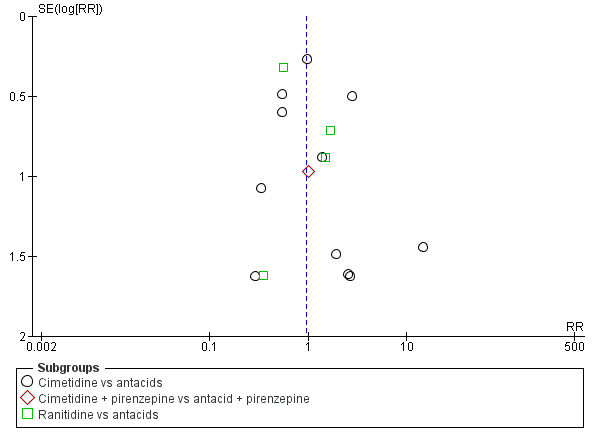
Funnel plot of comparison: 10 H2 receptor antagonists versus antacids, outcome: 10.1 Clinically important upper GI bleeding.
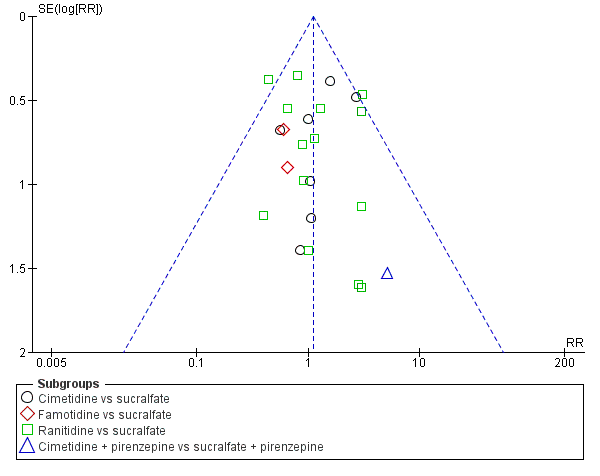
Funnel plot of comparison: 11 H2 receptor antagonists versus sucralfate, outcome: 11.1 Clinically important upper GI bleeding.

Funnel plot of comparison: 19 Antacids versus sucralfate, outcome: 19.1 Clinically important upper GI bleeding.

Comparison 1 Interventions versus placebo or no prophylaxis, Outcome 1 Clinically important upper GI bleeding.

Comparison 1 Interventions versus placebo or no prophylaxis, Outcome 2 Nosocomial pneumonia.

Comparison 1 Interventions versus placebo or no prophylaxis, Outcome 3 All‐cause mortality in ICU.

Comparison 1 Interventions versus placebo or no prophylaxis, Outcome 4 All‐cause mortality in hospital.

Comparison 1 Interventions versus placebo or no prophylaxis, Outcome 5 Duration of ICU stay.
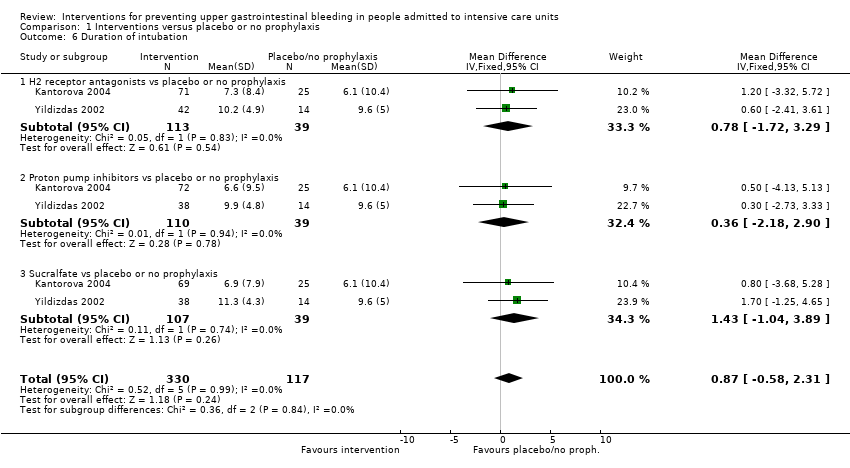
Comparison 1 Interventions versus placebo or no prophylaxis, Outcome 6 Duration of intubation.

Comparison 1 Interventions versus placebo or no prophylaxis, Outcome 7 Number of participants requiring blood transfusions.
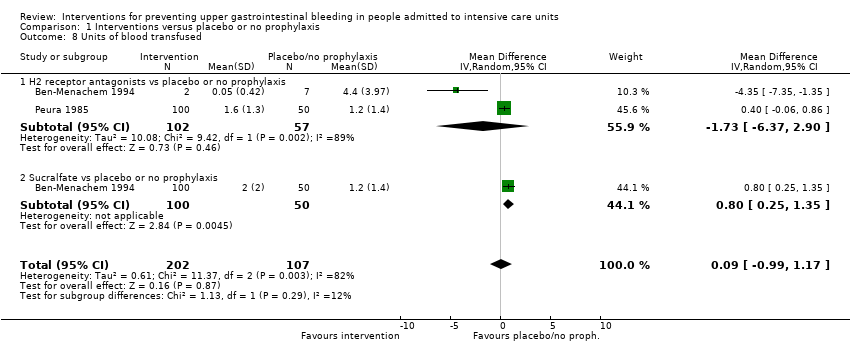
Comparison 1 Interventions versus placebo or no prophylaxis, Outcome 8 Units of blood transfused.

Comparison 2 H2 receptor antagonists versus placebo or no prophylaxis, Outcome 1 Clinically important upper GI bleeding.

Comparison 2 H2 receptor antagonists versus placebo or no prophylaxis, Outcome 2 Nosocomial pneumonia.
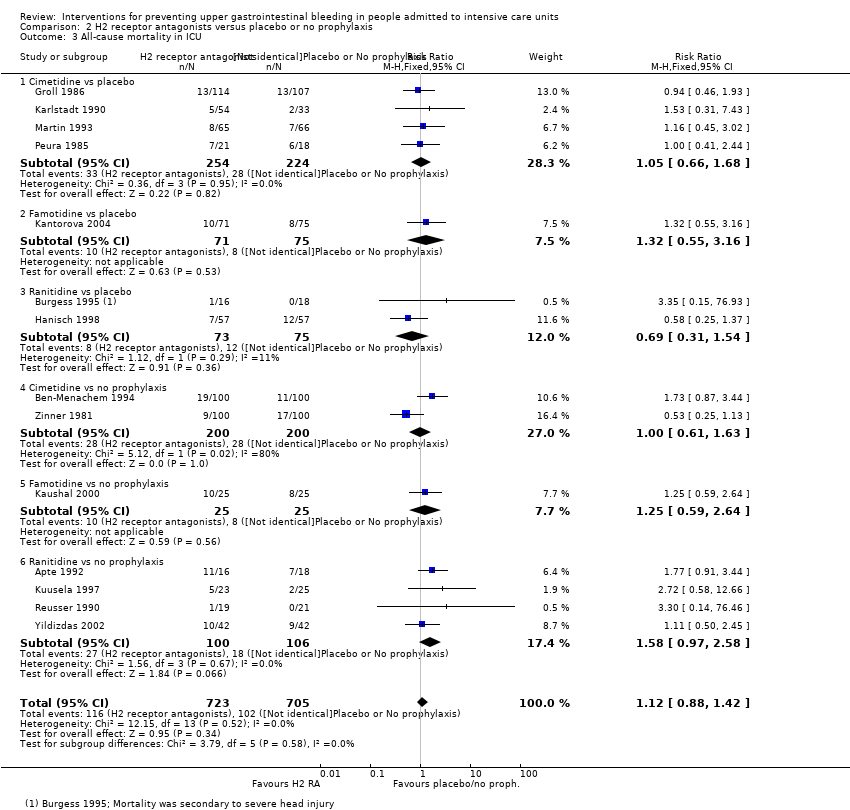
Comparison 2 H2 receptor antagonists versus placebo or no prophylaxis, Outcome 3 All‐cause mortality in ICU.
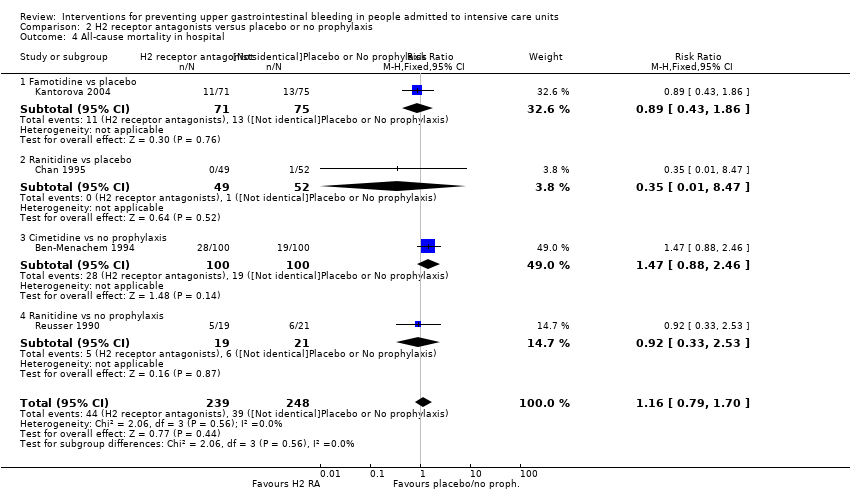
Comparison 2 H2 receptor antagonists versus placebo or no prophylaxis, Outcome 4 All‐cause mortality in hospital.

Comparison 2 H2 receptor antagonists versus placebo or no prophylaxis, Outcome 5 Duration of ICU stay.

Comparison 2 H2 receptor antagonists versus placebo or no prophylaxis, Outcome 6 Duration of intubation.
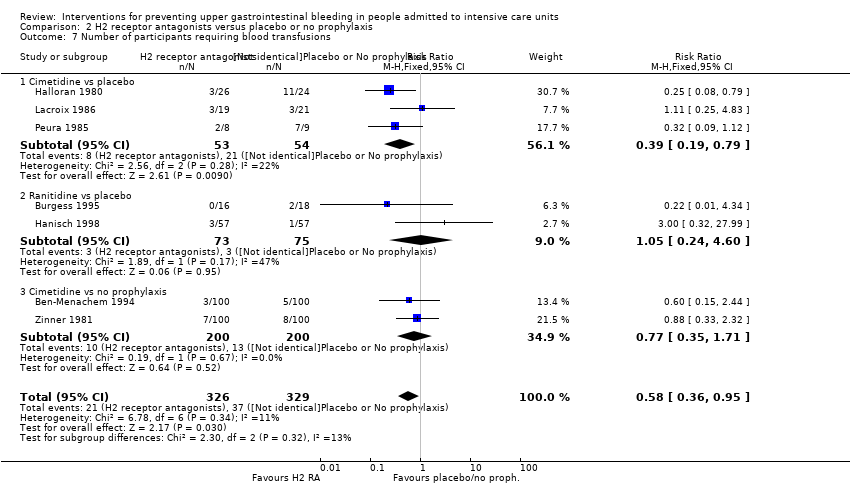
Comparison 2 H2 receptor antagonists versus placebo or no prophylaxis, Outcome 7 Number of participants requiring blood transfusions.

Comparison 2 H2 receptor antagonists versus placebo or no prophylaxis, Outcome 8 Units of blood transfused.

Comparison 2 H2 receptor antagonists versus placebo or no prophylaxis, Outcome 9 Adverse events of interventions.

Comparison 3 Proton pump inhibitors versus placebo or no prophylaxis, Outcome 1 Clinically important upper GI bleeding.
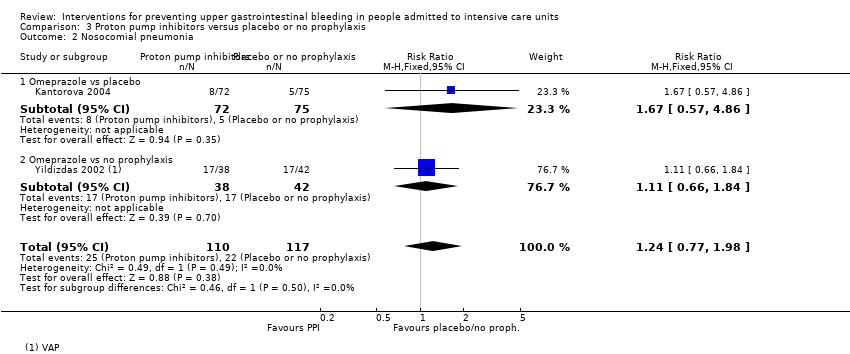
Comparison 3 Proton pump inhibitors versus placebo or no prophylaxis, Outcome 2 Nosocomial pneumonia.

Comparison 3 Proton pump inhibitors versus placebo or no prophylaxis, Outcome 3 All‐cause mortality in ICU.

Comparison 3 Proton pump inhibitors versus placebo or no prophylaxis, Outcome 4 All‐cause mortality in hospital.

Comparison 3 Proton pump inhibitors versus placebo or no prophylaxis, Outcome 5 Duration of ICU stay.
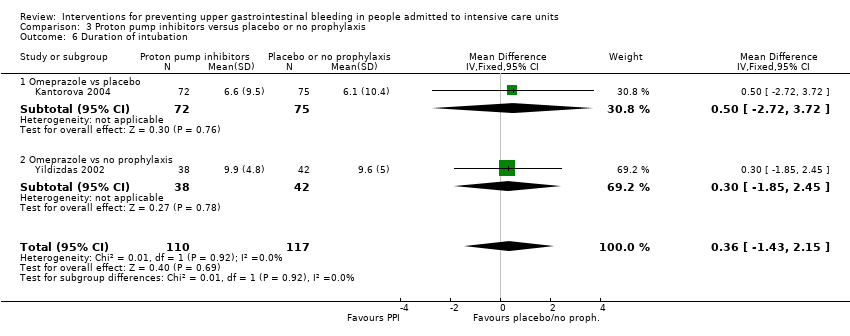
Comparison 3 Proton pump inhibitors versus placebo or no prophylaxis, Outcome 6 Duration of intubation.

Comparison 4 Proton pump inhibitors + sucralfate versus no prophylaxis, Outcome 1 Clinically important upper GI bleeding.

Comparison 5 Prostaglandin analogues versus placebo or no prophylaxis, Outcome 1 Clinically important upper GI bleeding.
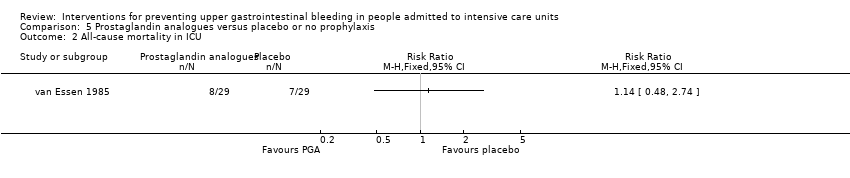
Comparison 5 Prostaglandin analogues versus placebo or no prophylaxis, Outcome 2 All‐cause mortality in ICU.

Comparison 6 Anticholinergics versus placebo or no prophylaxis, Outcome 1 Clinically important upper GI bleeding.

Comparison 6 Anticholinergics versus placebo or no prophylaxis, Outcome 2 Nosocomial pneumonia.

Comparison 6 Anticholinergics versus placebo or no prophylaxis, Outcome 3 All‐cause mortality in ICU.
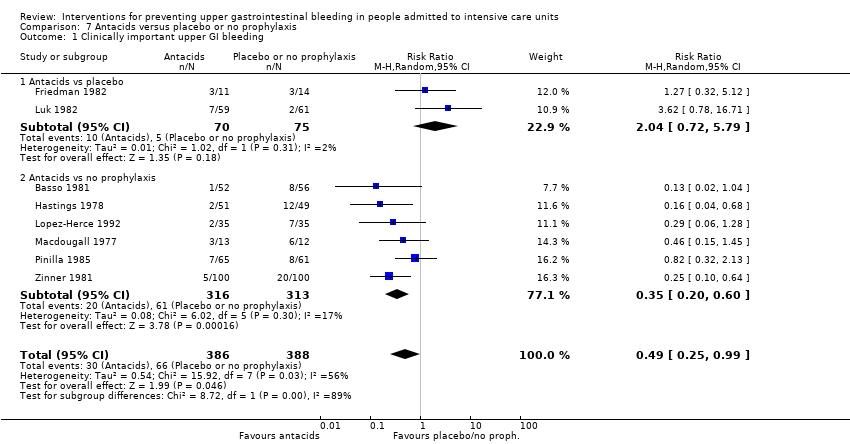
Comparison 7 Antacids versus placebo or no prophylaxis, Outcome 1 Clinically important upper GI bleeding.
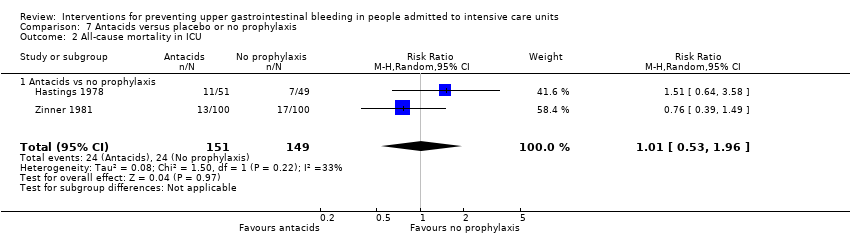
Comparison 7 Antacids versus placebo or no prophylaxis, Outcome 2 All‐cause mortality in ICU.

Comparison 7 Antacids versus placebo or no prophylaxis, Outcome 3 All‐cause mortality in hospital.

Comparison 7 Antacids versus placebo or no prophylaxis, Outcome 4 Number of participants requiring blood transfusions.

Comparison 7 Antacids versus placebo or no prophylaxis, Outcome 5 Adverse events of interventions.

Comparison 8 Sucralfate versus placebo or no prophylaxis, Outcome 1 Clinically important upper GI bleeding.
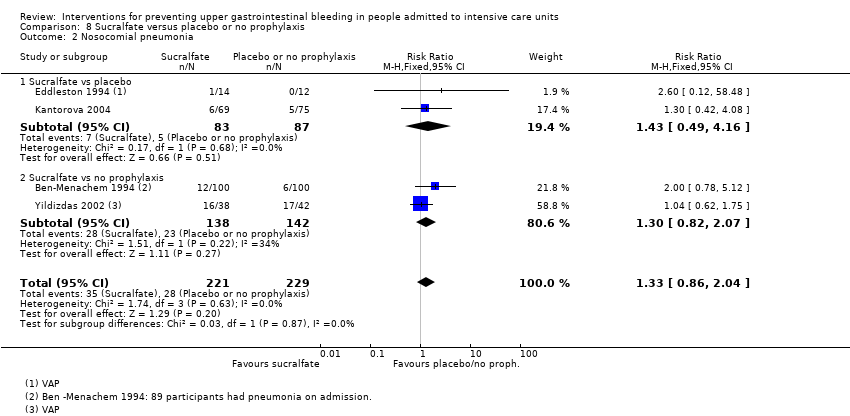
Comparison 8 Sucralfate versus placebo or no prophylaxis, Outcome 2 Nosocomial pneumonia.

Comparison 8 Sucralfate versus placebo or no prophylaxis, Outcome 3 All‐cause mortality in ICU.

Comparison 8 Sucralfate versus placebo or no prophylaxis, Outcome 4 All‐cause mortality in hospital.

Comparison 8 Sucralfate versus placebo or no prophylaxis, Outcome 5 Duration of ICU stay.

Comparison 8 Sucralfate versus placebo or no prophylaxis, Outcome 6 Duration of intubation.
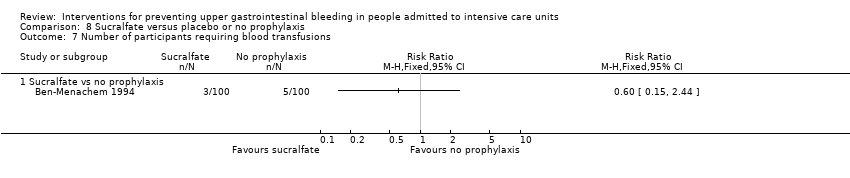
Comparison 8 Sucralfate versus placebo or no prophylaxis, Outcome 7 Number of participants requiring blood transfusions.
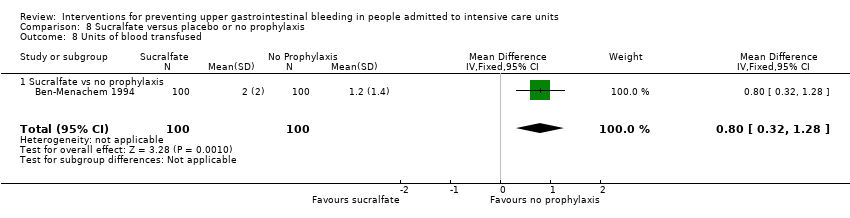
Comparison 8 Sucralfate versus placebo or no prophylaxis, Outcome 8 Units of blood transfused.

Comparison 8 Sucralfate versus placebo or no prophylaxis, Outcome 9 Adverse events of interventions.

Comparison 9 H2 receptor antagonists versus proton pump inhibitors, Outcome 1 Clinically important upper GI bleeding.

Comparison 9 H2 receptor antagonists versus proton pump inhibitors, Outcome 2 Nosocomial pneumonia.
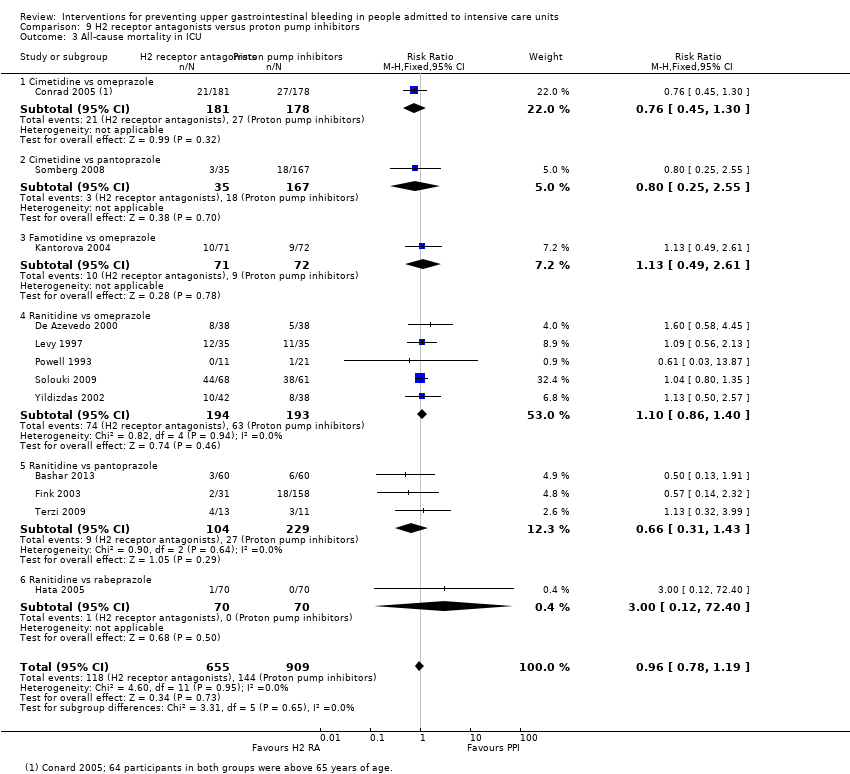
Comparison 9 H2 receptor antagonists versus proton pump inhibitors, Outcome 3 All‐cause mortality in ICU.

Comparison 9 H2 receptor antagonists versus proton pump inhibitors, Outcome 4 All‐cause mortality in hospital.

Comparison 9 H2 receptor antagonists versus proton pump inhibitors, Outcome 5 Duration of ICU stay.
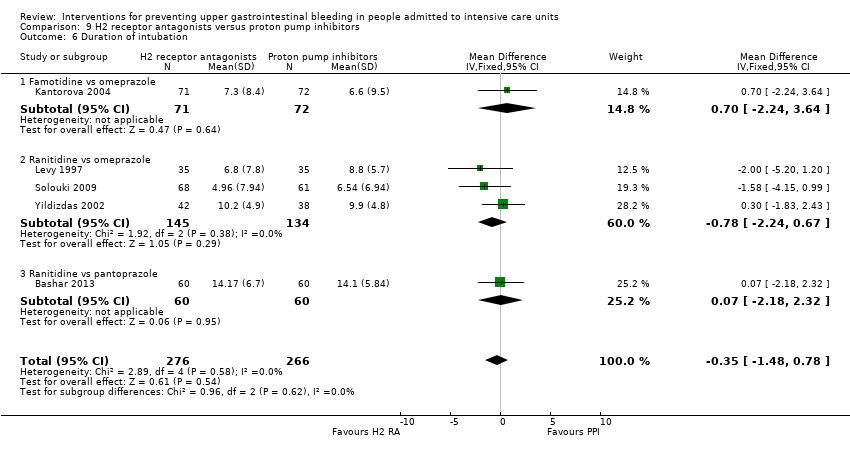
Comparison 9 H2 receptor antagonists versus proton pump inhibitors, Outcome 6 Duration of intubation.
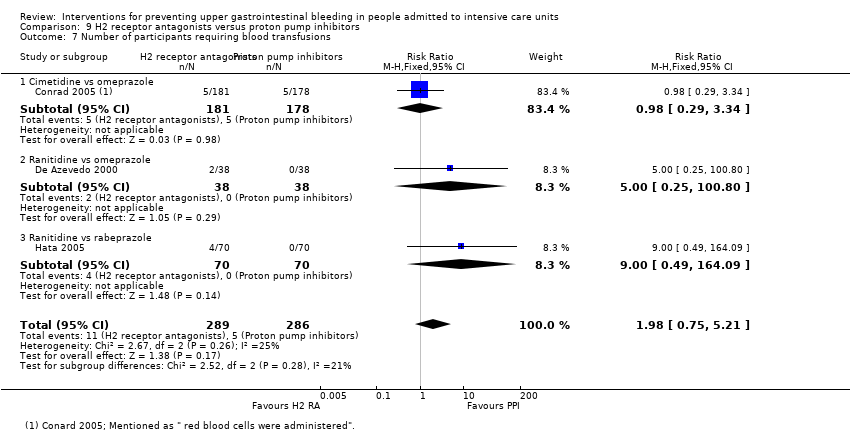
Comparison 9 H2 receptor antagonists versus proton pump inhibitors, Outcome 7 Number of participants requiring blood transfusions.

Comparison 9 H2 receptor antagonists versus proton pump inhibitors, Outcome 8 Adverse events of interventions.

Comparison 10 H2 receptor antagonists versus antacids, Outcome 1 Clinically important upper GI bleeding.

Comparison 10 H2 receptor antagonists versus antacids, Outcome 2 Nosocomial pneumonia.

Comparison 10 H2 receptor antagonists versus antacids, Outcome 3 All‐cause mortality in ICU.
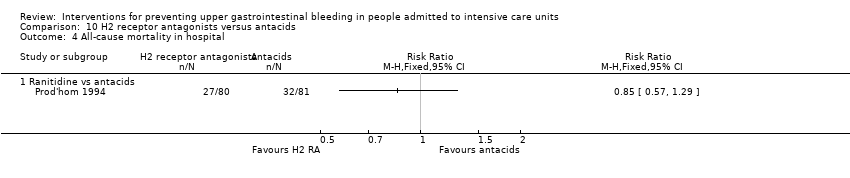
Comparison 10 H2 receptor antagonists versus antacids, Outcome 4 All‐cause mortality in hospital.

Comparison 10 H2 receptor antagonists versus antacids, Outcome 5 Duration of intubation.

Comparison 10 H2 receptor antagonists versus antacids, Outcome 6 Number of participants requiring blood transfusions.

Comparison 10 H2 receptor antagonists versus antacids, Outcome 7 Adverse events of interventions.
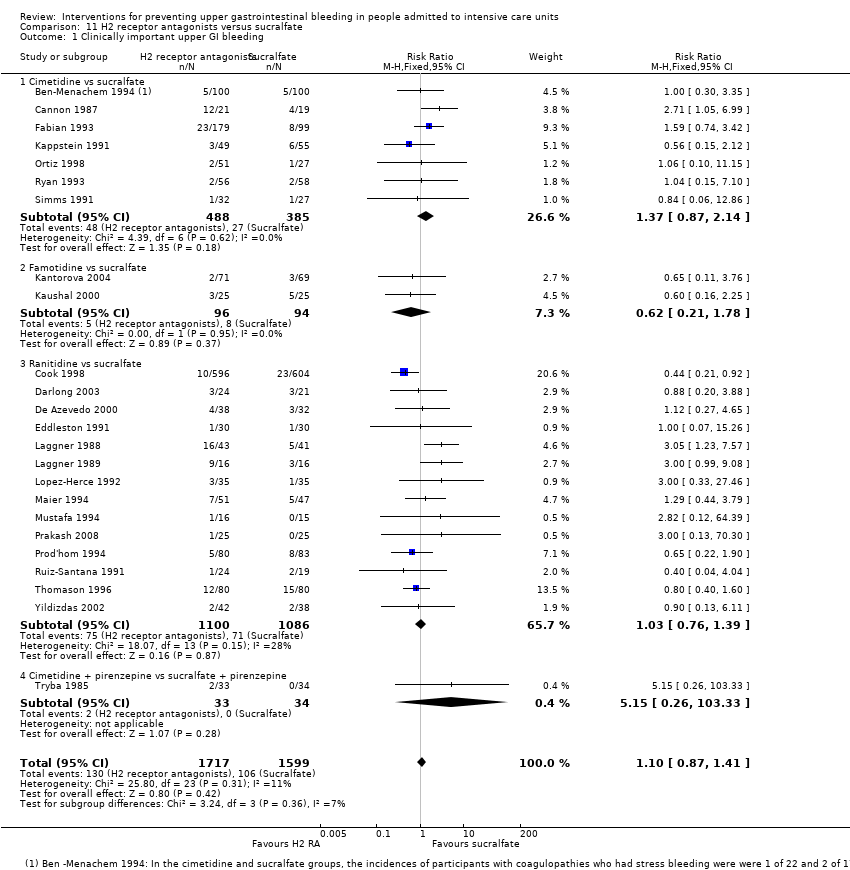
Comparison 11 H2 receptor antagonists versus sucralfate, Outcome 1 Clinically important upper GI bleeding.
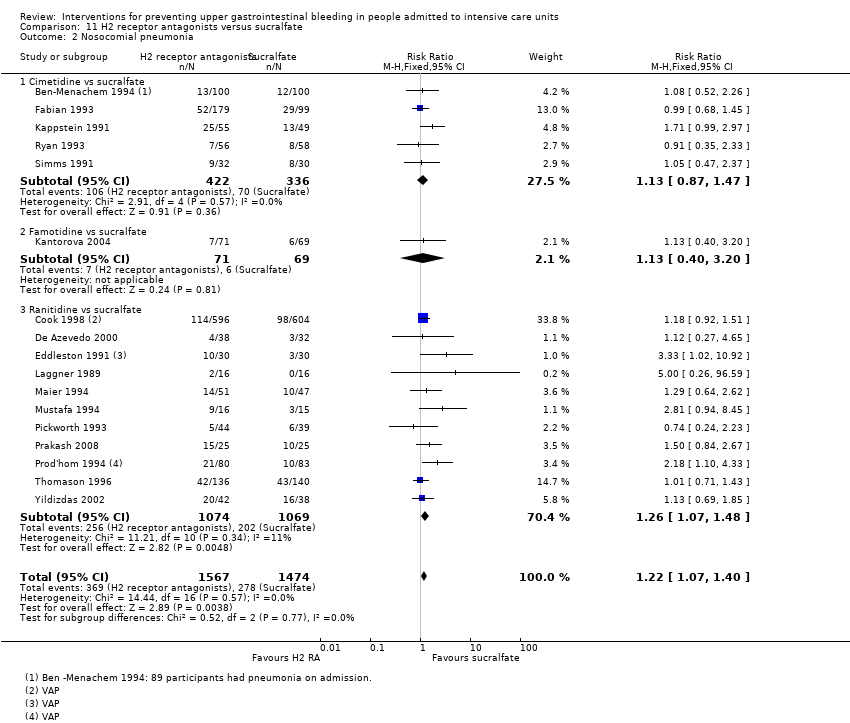
Comparison 11 H2 receptor antagonists versus sucralfate, Outcome 2 Nosocomial pneumonia.

Comparison 11 H2 receptor antagonists versus sucralfate, Outcome 3 All‐cause mortality in ICU.

Comparison 11 H2 receptor antagonists versus sucralfate, Outcome 4 All‐cause mortality in hospital.

Comparison 11 H2 receptor antagonists versus sucralfate, Outcome 5 Duration of intubation.

Comparison 11 H2 receptor antagonists versus sucralfate, Outcome 6 Duration of ICU stay.

Comparison 11 H2 receptor antagonists versus sucralfate, Outcome 7 Number of participants requiring blood transfusion.

Comparison 11 H2 receptor antagonists versus sucralfate, Outcome 8 Units of blood transfused.

Comparison 11 H2 receptor antagonists versus sucralfate, Outcome 9 Adverse events of interventions.

Comparison 12 H2 receptor antagonists versus anticholinergics, Outcome 1 Clinically important upper GI bleeding.
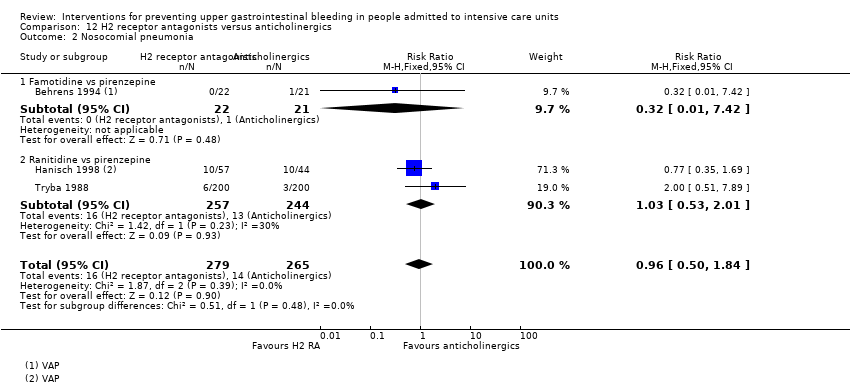
Comparison 12 H2 receptor antagonists versus anticholinergics, Outcome 2 Nosocomial pneumonia.

Comparison 12 H2 receptor antagonists versus anticholinergics, Outcome 3 All‐cause mortality in ICU.

Comparison 12 H2 receptor antagonists versus anticholinergics, Outcome 4 Number of participants requiring blood transfusion.
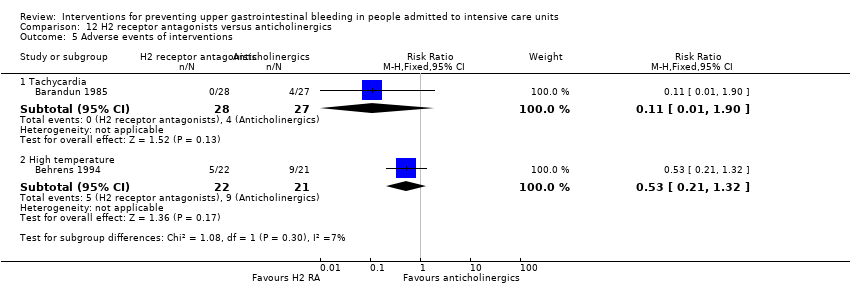
Comparison 12 H2 receptor antagonists versus anticholinergics, Outcome 5 Adverse events of interventions.

Comparison 13 H2 receptor antagonists versus prostaglandin analogues, Outcome 1 Clinically important upper GI bleeding.

Comparison 13 H2 receptor antagonists versus prostaglandin analogues, Outcome 2 All‐cause mortality in ICU.

Comparison 14 H2 receptor antagonists versus teprenone, Outcome 1 Clinically important upper GI bleeding.

Comparison 14 H2 receptor antagonists versus teprenone, Outcome 2 All‐cause mortality in ICU.

Comparison 14 H2 receptor antagonists versus teprenone, Outcome 3 Number of participants requiring blood transfusion.

Comparison 15 H2 receptor antagonist + antacids versus sucralfate, Outcome 1 Clinically important upper GI bleeding.

Comparison 15 H2 receptor antagonist + antacids versus sucralfate, Outcome 2 Nosocomial pneumonia.

Comparison 15 H2 receptor antagonist + antacids versus sucralfate, Outcome 3 All‐cause mortality in ICU.

Comparison 15 H2 receptor antagonist + antacids versus sucralfate, Outcome 4 Duration of ICU stay.

Comparison 15 H2 receptor antagonist + antacids versus sucralfate, Outcome 5 Duration of intubation.

Comparison 15 H2 receptor antagonist + antacids versus sucralfate, Outcome 6 Number of participants requiring blood transfusion.

Comparison 16 Proton pump inhibitors versus teprenone, Outcome 1 Clinically important upper GI bleeding.

Comparison 16 Proton pump inhibitors versus teprenone, Outcome 2 All‐cause mortality in ICU.

Comparison 16 Proton pump inhibitors versus teprenone, Outcome 3 Number of participants requiring blood transfusion.
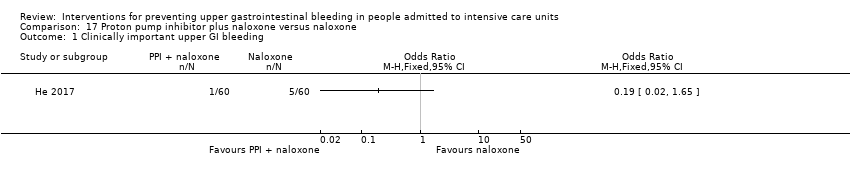
Comparison 17 Proton pump inhibitor plus naloxone versus naloxone, Outcome 1 Clinically important upper GI bleeding.
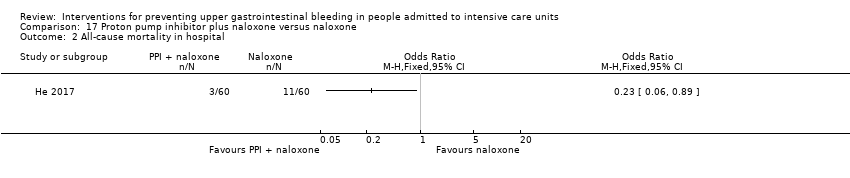
Comparison 17 Proton pump inhibitor plus naloxone versus naloxone, Outcome 2 All‐cause mortality in hospital.

Comparison 17 Proton pump inhibitor plus naloxone versus naloxone, Outcome 3 Adverse events ‐ gastrointestinal discomfort.
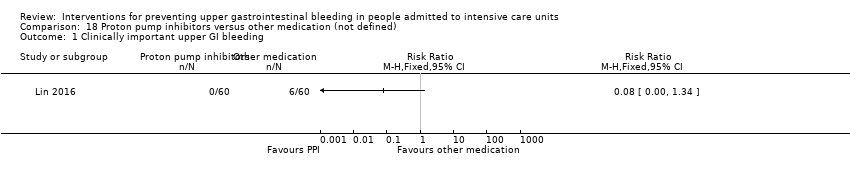
Comparison 18 Proton pump inhibitors versus other medication (not defined), Outcome 1 Clinically important upper GI bleeding.

Comparison 18 Proton pump inhibitors versus other medication (not defined), Outcome 2 Nosocomial pneumonia.

Comparison 18 Proton pump inhibitors versus other medication (not defined), Outcome 3 All‐cause mortality in hospital.

Comparison 19 Antacids versus sucralfate, Outcome 1 Clinically important upper GI bleeding.
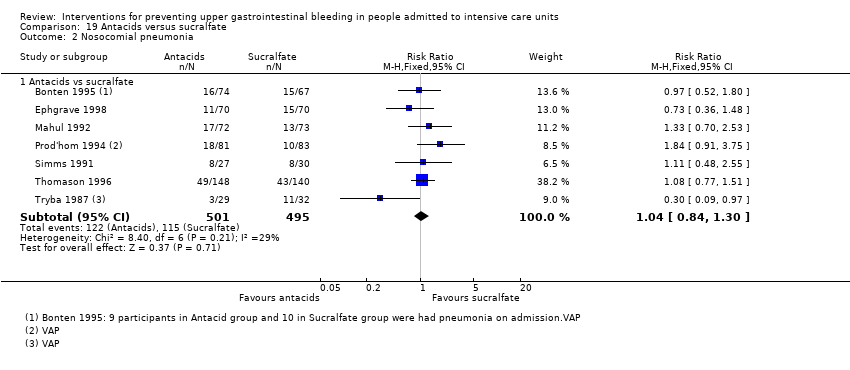
Comparison 19 Antacids versus sucralfate, Outcome 2 Nosocomial pneumonia.

Comparison 19 Antacids versus sucralfate, Outcome 3 All‐cause mortality in ICU.

Comparison 19 Antacids versus sucralfate, Outcome 4 All‐cause mortality in hospital.

Comparison 19 Antacids versus sucralfate, Outcome 5 Duration of ICU stay.

Comparison 19 Antacids versus sucralfate, Outcome 6 Duration of intubation.

Comparison 19 Antacids versus sucralfate, Outcome 7 Number of participants requiring blood transfusion.

Comparison 19 Antacids versus sucralfate, Outcome 8 Adverse events of interventions.

Comparison 20 Antacids versus prostaglandin analogues, Outcome 1 Clinically important upper GI bleeding.

Comparison 20 Antacids versus prostaglandin analogues, Outcome 2 All‐cause mortality in ICU.

Comparison 20 Antacids versus prostaglandin analogues, Outcome 3 Adverse events of interventions.
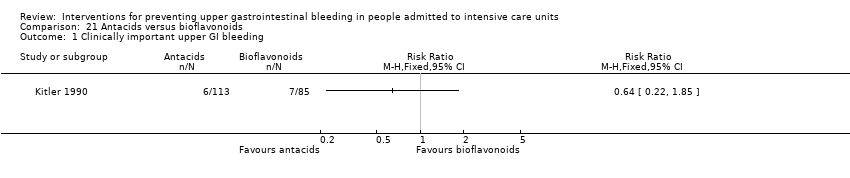
Comparison 21 Antacids versus bioflavonoids, Outcome 1 Clinically important upper GI bleeding.
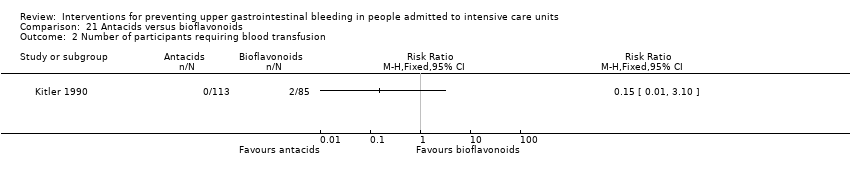
Comparison 21 Antacids versus bioflavonoids, Outcome 2 Number of participants requiring blood transfusion.

Comparison 22 Sucralfate versus proton pump inhibitors, Outcome 1 Clinically important upper GI bleeding.
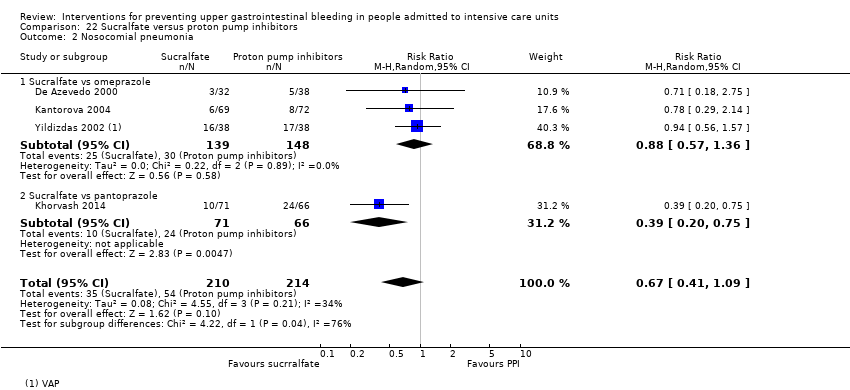
Comparison 22 Sucralfate versus proton pump inhibitors, Outcome 2 Nosocomial pneumonia.
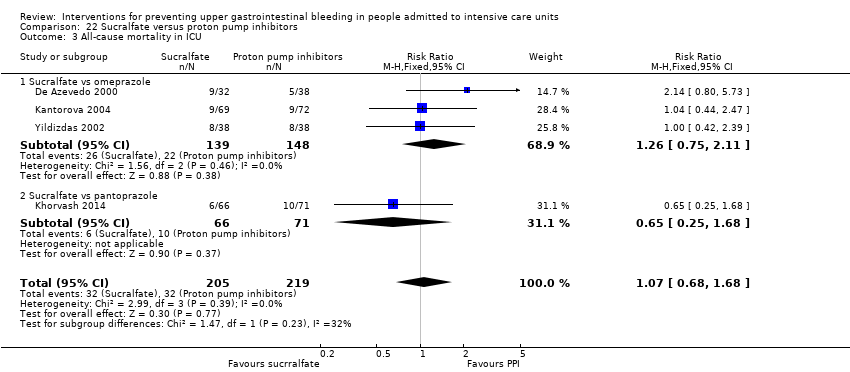
Comparison 22 Sucralfate versus proton pump inhibitors, Outcome 3 All‐cause mortality in ICU.
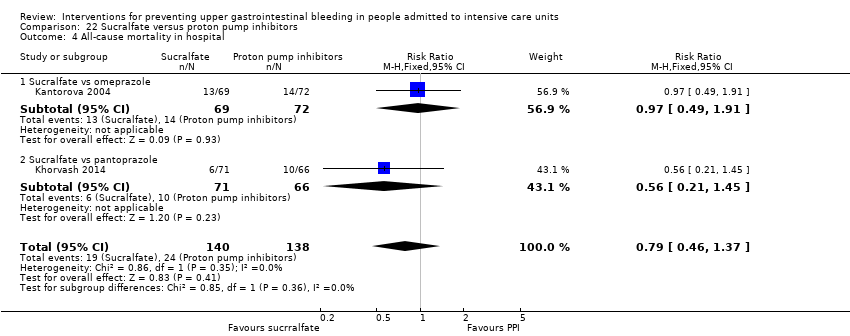
Comparison 22 Sucralfate versus proton pump inhibitors, Outcome 4 All‐cause mortality in hospital.

Comparison 22 Sucralfate versus proton pump inhibitors, Outcome 5 Duration of ICU stay.

Comparison 22 Sucralfate versus proton pump inhibitors, Outcome 6 Duration of intubation.
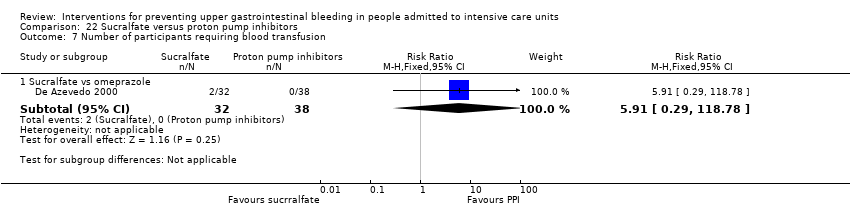
Comparison 22 Sucralfate versus proton pump inhibitors, Outcome 7 Number of participants requiring blood transfusion.

Comparison 22 Sucralfate versus proton pump inhibitors, Outcome 8 Adverse events of interventions.

Comparison 23 Sucralfate versus bioflavonoids, Outcome 1 Clinically important upper GI bleeding.

Comparison 23 Sucralfate versus bioflavonoids, Outcome 2 Number of participants requiring blood transfusion.

Comparison 24 Total parenteral nutrition (TPN) versus any other intervention + TPN, Outcome 1 Clinically important upper GI bleeding.

Comparison 24 Total parenteral nutrition (TPN) versus any other intervention + TPN, Outcome 2 All‐cause mortality in ICU.

Comparison 24 Total parenteral nutrition (TPN) versus any other intervention + TPN, Outcome 3 Duration of intubation.

Comparison 25 Bowel stimulation versus no prophylaxis, Outcome 1 Clinically important upper GI bleeding.

Comparison 26 Nasojejunal nutrition versus nasogastric nutrition, Outcome 1 Clinically important upper GI bleeding.

Comparison 26 Nasojejunal nutrition versus nasogastric nutrition, Outcome 2 Nosocomial pneumonia.
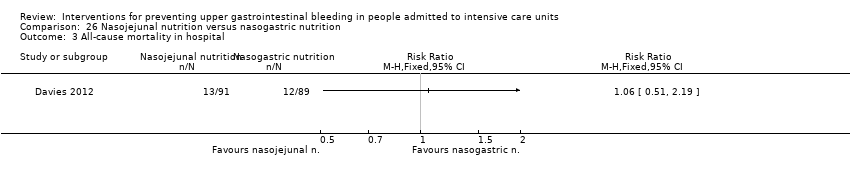
Comparison 26 Nasojejunal nutrition versus nasogastric nutrition, Outcome 3 All‐cause mortality in hospital.

Comparison 26 Nasojejunal nutrition versus nasogastric nutrition, Outcome 4 Adverse events of interventions.
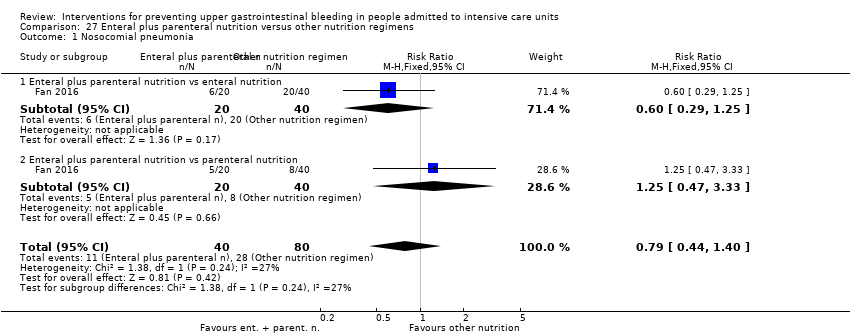
Comparison 27 Enteral plus parenteral nutrition versus other nutrition regimens, Outcome 1 Nosocomial pneumonia.

Comparison 27 Enteral plus parenteral nutrition versus other nutrition regimens, Outcome 2 All‐cause mortality in hospital.
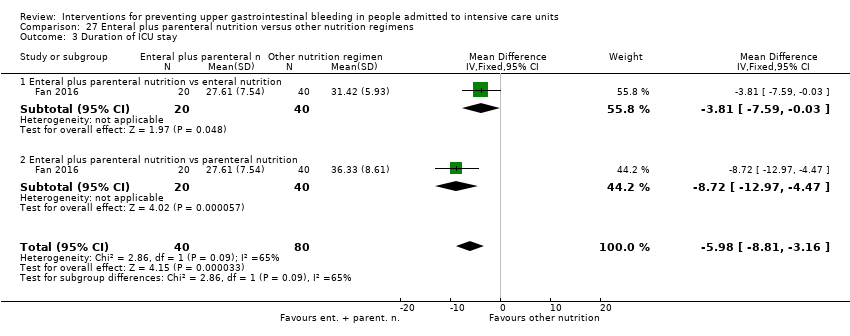
Comparison 27 Enteral plus parenteral nutrition versus other nutrition regimens, Outcome 3 Duration of ICU stay.

Comparison 27 Enteral plus parenteral nutrition versus other nutrition regimens, Outcome 4 Duration of intubation.

Comparison 27 Enteral plus parenteral nutrition versus other nutrition regimens, Outcome 5 Adverse events ‐ stress ulcer.

Comparison 27 Enteral plus parenteral nutrition versus other nutrition regimens, Outcome 6 Adverse events ‐ diarrhoea.

Comparison 27 Enteral plus parenteral nutrition versus other nutrition regimens, Outcome 7 Adverse events ‐ pyaemia.
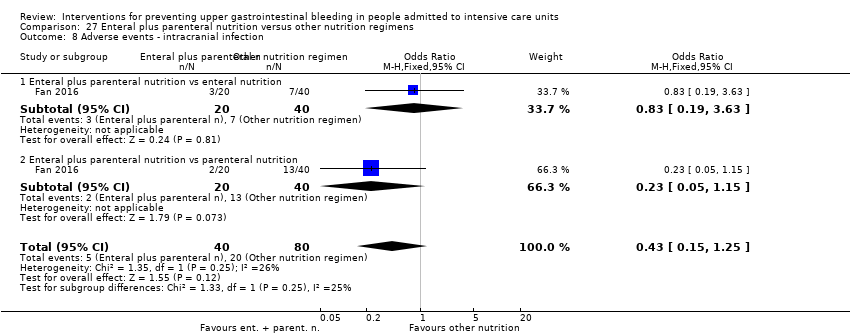
Comparison 27 Enteral plus parenteral nutrition versus other nutrition regimens, Outcome 8 Adverse events ‐ intracranial infection.

Comparison 27 Enteral plus parenteral nutrition versus other nutrition regimens, Outcome 9 Adverse events ‐ hypoproteinaemia.
| Any intervention compared with placebo or no prophylaxis for preventing upper gastrointestinal bleeding in people admitted to intensive care units | ||||||
| Patient or population: people admitted to intensive care units | ||||||
| Outcomes | Anticipated absolute effects* (95% CI) | Relative effect | № of participants | Certainty of the evidence | Comments | |
| Risk with placebo or no prophylaxis | Risk with Interventions | |||||
| Clinically important upper GI bleeding Follow‐up: 15 days† | Study population | RR 0.47 | 3207 | ⊕⊕⊕⊝ | ||
| 188 per 1000 | 88 per 1000 | |||||
| Nosocomial pneumonia Follow‐up: 48 hours after extubation‡ | Study population | RR 1.15 | 1331 | ⊕⊕⊝⊝ | ||
| 143 per 1000 | 164 per 1000 | |||||
| All‐cause mortality in ICU Follow‐up: 4 weeks§ | Study population | RR 1.10 | 2159 | ⊕⊕⊝⊝ | ||
| 152 per 1000 | 168 per 1000 | |||||
| Duration of ICU stay Follow‐up: not reported | Mean duration of ICU stay ranged from 8.6 to 11.1 days | MD 0.24 days higher | ‐ | 447 | ⊕⊕⊝⊝ | |
| Number of participants requiring blood transfusion Follow‐up: 48 hours after discharge‡ | Study population | RR 0.63 | 981 | ⊕⊕⊕⊝ | ||
| 96 per 1000 | 60 per 1000 | |||||
| Serious adverse events | Not reported | |||||
| *The risk in the intervention group (and its 95% confidence interval) is based on the assumed risk in the comparison group and the relative effect of the intervention (and its 95% CI). †Duration of follow‐up reported in four studies. §Duration of follow‐up reported in five studies. | ||||||
| GRADE Working Group grades of evidence. | ||||||
| aDowngraded by one level for risk of bias because of high risk of selection bias in one study, high risk of performance bias in nine studies, high risk of detection bias in five studies, high risk of attrition bias in four studies, high risk of reporting bias in five studies, and high risk of other biases in four studies. bDowngraded by one level for imprecision because effect estimate and 95% CI were compatible with benefit and harm. cDowngraded by one level for risk of bias because of high risk of performance bias in three studies, high risk of detection bias in one study, and high risk of attrition bias in two studies. dDowngraded by one level for risk of bias because of high risk of performance bias in seven studies and high risk of attrition bias in two studies. eDowngraded by one level for risk of bias because of high risk of performance bias in one study. fDowngraded by one level for risk of bias because of high risk of selection bias in one study, high risk of performance bias in two studies, high risk of attrition bias in one study, high risk of reporting bias in one study, and high risk of other biases in one study. | ||||||
| H2 receptor antagonists compared with placebo or no prophylaxis for preventing upper gastrointestinal bleeding in people admitted to intensive care units | ||||||
| Patient or population: people admitted to intensive care units | ||||||
| Outcomes | Anticipated absolute effects* (95% CI) | Relative effect | № of participants | Certainty of the evidence | Comments | |
| Risk with placebo or no prophylaxis | Risk with H2 receptor antagonists | |||||
| Clinically important upper GI bleeding Follow‐up: 15 days/weeks† | Study population | RR 0.50 | 2149 | ⊕⊕⊕⊝ | ||
| 182 per 1000 | 91 per 1000 | |||||
| Nosocomial pneumonia Follow‐up: 48 hours after extubation‡ | Study population | RR 1.12 | 945 | ⊕⊕⊝⊝ | ||
| 146 per 1000 | 164 per 1000 | |||||
| All‐cause mortality in ICU Follow‐up: 4 weeks§ | Study population | RR 1.12 | 1428 | ⊕⊕⊝⊝ | ||
| 145 per 1000 | 162 per 1000 | |||||
| Duration of ICU stay Follow‐up: not reported | Mean duration of ICU stay ranged from 8.6 to 11.1 days | MD 0.73 days higher | ‐ | 230 | ⊕⊕⊝⊝ | |
| Number of participants requiring blood transfusions Follow‐up: 48 hours after extubationǁ | Study population | RR 0.58 | 655 | ⊕⊕⊕⊝ | ||
| 112 per 1000 | 65 per 1000 | |||||
| Serious adverse events | Not reported | |||||
| *The risk in the intervention group (and its 95% confidence interval) is based on the assumed risk in the comparison group and the relative effect of the intervention (and its 95% CI). ‡Duration of follow‐up reported in two studies. §Duration of follow‐up reported in five studies. ǁDuration of follow‐up reported in one study. | ||||||
| GRADE Working Group grades of evidence. | ||||||
| aDowngraded by one level for risk of bias because of high risk of selection bias in one study, high risk of performance bias in eight studies, high risk of attrition bias in two studies, high risk of reporting bias in four studies, and high risk of other biases in three studies. bDowngraded by one level for imprecision because 95% CI was compatible with benefit and harm. cDowngraded by one level for risk of bias because of high risk performance bias in three studies and high risk of attrition bias in one study. dDowngraded by one level for risk of bias because of high risk of performance bias in three studies and high risk of attrition bias in one study. eDowngraded by one level for risk of bias because of high risk of performance bias in one study. fDowngraded by one level for risk of bias because of high risk of selection bias in one study, high risk of performance bias in two studies, high risk of attrition bias in one study, and high risk of other biases in one study. | ||||||
| Proton pump inhibitors compared with placebo or no prophylaxis for preventing upper gastrointestinal bleeding in people admitted to intensive care units | ||||||
| Patient or population: people admitted to intensive care units | ||||||
| Outcomes | Anticipated absolute effects* (95% CI) | Relative effect | № of participants | Certainty of the evidence | Comments | |
| Risk with placebo or no prophylaxis | Risk with proton pump inhibitors | |||||
| Clinically important upper GI bleeding Follow‐up: not reported | Study population | RR 0.63 | 237 | ⊕⊕⊝⊝ | ||
| 49 per 1000 | 31 per 1000 | |||||
| Nosocomial pneumonia Follow‐up: not reported | Study population | RR 1.24 | 227 | ⊕⊕⊝⊝ | ||
| 188 per 1000 | 233 per 1000 | |||||
| All‐cause mortality in ICU Follow‐up: not reported | Study population | RR 1.09 | 258 | ⊕⊕⊝⊝ | ||
| 134 per 1000 | 146 per 1000 | |||||
| Duration of ICU stay Follow‐up: not reported | Mean duration of ICU stay ranged from 8.6 to 11.1 days | MD 0.03 days lower | ‐ | 227 | ⊕⊕⊝⊝ | |
| Number of participants requiring blood transfusion | Not reported | |||||
| Serious adverse events | Not reported | |||||
| *The risk in the intervention group (and its 95% confidence interval) is based on the assumed risk in the comparison group and the relative effect of the intervention (and its 95% CI). | ||||||
| GRADE Working Group grades of evidence. | ||||||
| aDowngraded by one level for imprecision because 95% CI was compatible with benefit and harm. bDowngraded by one level for risk of bias because of high risk of performance bias in one study and high risk of attrition bias in one study. cDowngraded by one level for risk of bias because of high risk of performance bias in one study. | ||||||
| Antacids compared with placebo or no prophylaxis for preventing upper gastrointestinal bleeding in people admitted to intensive care units | ||||||
| Patient or population: people admitted to intensive care units | ||||||
| Outcomes | Anticipated absolute effects* (95% CI) | Relative effect | № of participants | Certainty of the evidence | Comments | |
| Risk with placebo or no prophylaxis | Risk with antacids | |||||
| Clinically important upper GI bleeding Follow‐up: not reported | Study population | RR 0.49 | 774 | ⊕⊕⊝⊝ | ||
| 170 per 1000 | 83 per 1000 | |||||
| Nosocomial pneumonia | Not reported | |||||
| All‐cause mortality in ICU Follow‐up: not reported | Study population | RR 1.01 | 300 | ⊕⊕⊝⊝ | ||
| 161 per 1000 | 163 per 1000 | |||||
| Duration of ICU stay | Not reported | |||||
| Number of participants requiring blood transfusions Follow‐up: not reported | Study population | RR 0.94 | 226 | ⊕⊕⊝⊝ | ||
| 45 per 1000 | 43 per 1000 | |||||
| Serious adverse events | Not reported | |||||
| *The risk in the intervention group (and its 95% confidence interval) is based on the assumed risk in the comparison group and the relative effect of the intervention (and its 95% CI). | ||||||
| GRADE Working Group grades of evidence. | ||||||
| aDowngraded by one level for inconsistency because of moderate heterogeneity; I² = 56%. bDowngraded by one level for risk of bias because of high risk of performance bias in five studies, high risk of detection bias in one study, high risk of reporting bias in two studies, and high risk of other biases in one study. cDowngraded by one level for imprecision because 95% CI was compatible with benefit and harm. dDowngraded by one level for risk of bias because of high risk of performance bias in two studies. eDowngraded by one level for risk of bias because of high risk of performance bias in one study. | ||||||
| Sucralfate compared with placebo or no prophylaxis for preventing upper gastrointestinal bleeding in people admitted to intensive care units | ||||||
| Patient or population: people admitted to intensive care units | ||||||
| Outcomes | Anticipated absolute effects* (95% CI) | Relative effect | № of participants | Certainty of the evidence | Comments | |
| Risk with placebo or no prophylaxis | Risk with sucralfate | |||||
| Clinically important upper GI bleeding Follow‐up: 15 days† | Study population | RR 0.53 | 598 | ⊕⊕⊕⊝ | ||
| 108 per 1000 | 57 per 1000 | |||||
| Nosocomial pneumonia Follow‐up: not reported | Study population | RR 1.33 | 450 | ⊕⊕⊝⊝ | ||
| 122 per 1000 | 163 per 1000 | |||||
| All‐cause mortality in ICU Follow‐up: 15 days† | Study population | RR 0.97 | 500 | ⊕⊕⊝⊝ | ||
| 165 per 1000 | 160 per 1000 | |||||
| Duration of ICU stay Follow‐up: not reported | Mean duration of ICU stay ranged from 8.6 to 11.1 days | MD 0.02 days lower | ‐ | 224 | ⊕⊕⊝⊝ | |
| Number of participants requiring blood transfusion Follow‐up: not reported | Study population | RR 0.60 | 200 | ⊕⊕⊝⊝ | ||
| 50 per 1000 | 30 per 1000 | |||||
| Serious adverse events | Not reported | |||||
| *The risk in the intervention group (and its 95% confidence interval) is based on the assumed risk in the comparison group and the relative effect of the intervention (and its 95% CI). | ||||||
| GRADE Working Group grades of evidence. | ||||||
| aDowngraded by one level for risk of bias because of high risk of performance bias in five studies, high risk of reporting bias in one study, and high risk of other biases in one study. bDowngraded by one level for imprecision because 95% CI was compatible with benefit and harm. cDowngraded by one level for risk of bias because of high risk of performance bias in two studies. dDowngraded by one level for risk of bias because of high risk of performance bias in three studies. eDowngraded by one level for risk of bias because of high risk of performance bias in one study. | ||||||
| H2 receptor antagonists compared with proton pump inhibitors for preventing upper gastrointestinal bleeding in people admitted to intensive care units | ||||||
| Patient or population: people admitted to intensive care units | ||||||
| Outcomes | Anticipated absolute effects* (95% CI) | Relative effect | № of participants | Certainty of the evidence | Comments | |
| Risk with proton pump inhibitors | Risk with H2 receptor antagonists | |||||
| Clinically important upper GI bleeding Follow‐up: not reported | Study population | RR 2.90 | 1636 | ⊕⊕⊝⊝ | ||
| 25 per 1000 | 73 per 1000 | |||||
| Nosocomial pneumonia Follow‐up: 30 days† | Study population | RR 1.02 | 1256 | ⊕⊕⊝⊝ | ||
| 123 per 1000 | 126 per 1000 | |||||
| All‐cause mortality in ICU Follow‐up: 30 days† | Study population | RR 0.96 | 1564 | ⊕⊕⊝⊝ | ||
| 158 per 1000 | 152 per 1000 | |||||
| Duration of ICU stay Follow‐up: not reported | Mean duration of ICU stay ranged from 7.7 to 23.6 days | MD 0.14 days higher | ‐ | 482 | ⊕⊕⊝⊝ | |
| Number of participants requiring blood transfusion Follow‐up: not reported | Study population | RR 1.98 | 575 | ⊕⊕⊕⊝ | ||
| 17 per 1000 | 35 per 1000 | |||||
| Serious adverse events | Not reported | |||||
| *The risk in the intervention group (and its 95% confidence interval) is based on the assumed risk in the comparison group and the relative effect of the intervention (and its 95% CI). | ||||||
| GRADE Working Group grades of evidence. | ||||||
| aDowngraded by one level for inconsistency because of substantial heterogeneity; I² = 59%. bDowngraded by one level for risk of bias because of high risk of selection bias in one study, high risk of performance bias in five studies, high risk of detection bias in two studies, and high risk of other biases in one study. cDowngraded by one level for imprecision because 95% CI was compatible with benefit and harm. dDowngraded by one level for risk of bias because of high risk of performance bias in four studies, high risk of detection bias in two studies, and high risk of other biases in one study. eDowngraded by one level for risk of bias because of high risk of performance bias in five studies, high risk of attrition bias in one study, and high risk of other biases in one study. fDowngraded by one level for risk of bias because of high risk of performance bias in three studies, high risk of attrition bias in one study, and high risk of other biases in one study. | ||||||
| H2 receptor antagonists compared with antacids for preventing upper gastrointestinal bleeding in people admitted to intensive care units | ||||||
| Patient or population: people admitted to intensive care units | ||||||
| Outcomes | Anticipated absolute effects* (95% CI) | Relative effect | № of participants | Certainty of the evidence | Comments | |
| Risk with antacids | Risk with H2 receptor antagonists | |||||
| Clinically important upper GI bleeding Follow‐up: 25 days† | Study population | RR 0.96 | 1700 | ⊕⊕⊝⊝ | ||
| 86 per 1000 | 82 per 1000 | |||||
| Nosocomial pneumonia Follow‐up: 25 days‡ | Study population | RR 1.05 | 581 | ⊕⊕⊝⊝ | ||
| 280 per 1000 | 294 per 1000 | |||||
| All‐cause mortality in ICU Follow‐up: 25 days§ | Study population | RR 1.01 | 1321 | ⊕⊝⊝⊝ | ||
| 163 per 1000 | 165 per 1000 | |||||
| Duration of ICU stay | Not reported | |||||
| Number of participants requiring blood transfusion Follow‐up: not reported | Study population | RR 2.49 | 744 | ⊕⊕⊕⊝ | ||
| 30 per 1000 | 75 per 1000 | |||||
| Serious adverse events | Not reported | |||||
| *The risk in the intervention group (and its 95% confidence interval) is based on the assumed risk in the comparison group and the relative effect of the intervention (and its 95% CI). ‡Duration of follow‐up reported in one study. §Duration of follow‐up reported in three studies. | ||||||
| GRADE Working Group grades of evidence. | ||||||
| aDowngraded by one level for imprecision because 95% CI was compatible with benefit and harm. bDowngraded by one level for risk of bias because of high risk of selection bias in two studies, high risk of performance bias in 12 studies, high risk of detection bias in two studies, and high risk of reporting bias in two studies. cDowngraded by one level for risk of bias because of high risk of selection bias in one study, high risk of performance bias in four studies, high risk of detection bias in one study, and high risk of reporting bias in one study. dDowngraded by one level for inconsistency because of moderate heterogeneity; I² = 53%. eDowngraded by one level for risk of bias because of high risk of selection bias in two studies, high risk of performance bias in nine studies, and high risk of reporting bias in one study. fDowngraded by one level for risk of bias because of high risk of selection bias in one study and high risk of performance bias in four studies. | ||||||
| H2 receptor antagonists compared with sucralfate for preventing upper gastrointestinal bleeding in people admitted to intensive care units | ||||||
| Patient or population: people admitted to intensive care units | ||||||
| Outcomes | Anticipated absolute effects* (95% CI) | Relative effect | № of participants | Certainty of the evidence | Comments | |
| Risk with sucralfate | Risk with H2 receptor antagonists | |||||
| Clinically important upper GI bleeding Follow‐up: 15 days† | Study population | RR 1.10 | 3316 | ⊕⊕⊝⊝ | ||
| 66 per 1000 | 73 per 1000 | |||||
| Nosocomial pneumonia Follow‐up: 25 days‡ | Study population | RR 1.22 | 3041 | ⊕⊕⊕⊝ | ||
| 189 per 1000 | 230 per 1000 | |||||
| All‐cause mortality in ICU Follow‐up: 25 days§ | Study population | RR 1.09 | 3178 | ⊕⊕⊝⊝ | ||
| 204 per 1000 | 222 per 1000 | |||||
| Duration of ICU stay Follow‐up: 2 weeks | Mean duration of ICU stay ranged from 7.9 to 13.7 days | MD 0.01 days higher | ‐ | 1791 | ⊕⊝⊝⊝ | |
| Number of participants requiring blood transfusion Follow‐up: until death or dischargeǁ | Study population | RR 1.25 | 1095 | ⊕⊕⊝⊝ | ||
| 35 per 1000 | 43 per 1000 | |||||
| Serious adverse events | Not reported | |||||
| *The risk in the intervention group (and its 95% confidence interval) is based on the assumed risk in the comparison group and the relative effect of the intervention (and its 95% CI). †Duration of follow‐up reported in five studies. ‡Duration of follow‐up reported in three studies. §Duration of follow‐up reported in six studies. ǁDuration of follow‐up reported in one study. | ||||||
| GRADE Working Group grades of evidence. | ||||||
| aDowngraded by one level for imprecision because 95% CI was compatible with benefit and harm. bDowngraded by one level for risk of bias because of high risk of selection bias in one study, high risk of performance bias in 20 studies, high risk of detection bias in two studies, high risk of attrition bias in two studies, high risk of reporting bias in four studies, and high risk of other biases in two studies. cDowngraded by one level for risk of bias because of high risk of selection bias in two studies, high risk of performance bias in 12 studies, high risk of detection bias in one study, high risk of attrition bias in one study, and high risk of reporting bias in two studies. dDowngraded by one level for risk of bias because of high risk of selection bias in two studies, high risk of performance bias in 16 studies, high risk of detection bias in one study, high risk of attrition bias in two studies, high risk of reporting bias in three studies, and high risk of other biases in one study. eDowngraded by one level for inconsistency because of considerable heterogeneity; I² = 82%. fDowngraded by one level for risk of bias because of high risk of performance bias in four studies and high risk of attrition bias in one study. gDowngraded by one level for risk of bias because of high risk of performance bias in eight studies, high risk of attrition bias in one study, high risk of reporting bias in one study, and high risk of other biases in one study. | ||||||
| Antacids compared with sucralfate for preventing upper gastrointestinal bleeding in people admitted to intensive care units | ||||||
| Patient or population: people admitted to intensive care units | ||||||
| Outcomes | Anticipated absolute effects* (95% CI) | Relative effect | № of participants | Certainty of the evidence | Comments | |
| Risk with sucralfate | Risk with antacids | |||||
| Clinically important upper GI bleeding Follow‐up: 21 days† | Study population | RR 1.00 | 1772 | ⊕⊕⊝⊝ | ||
| 66 per 1000 | 66 per 1000 | |||||
| Nosocomial pneumonia Follow‐up: 25 days‡ | Study population | RR 1.04 | 996 | ⊕⊕⊝⊝ | ||
| 232 per 1000 | 242 per 1000 | |||||
| All‐cause mortality in ICU Follow‐up: 25 days† | Study population | RR 1.15 | 1249 | ⊕⊕⊝⊝ | ||
| 206 per 1000 | 237 per 1000 | |||||
| Duration of ICU stay Follow‐up: not reported | Mean duration of ICU stay ranged from 10.4 to 16.8 days | MD 2.5 days lower | ‐ | 227 | ⊕⊕⊝⊝ | |
| Number of participants requiring blood transfusion Follow‐up: until discharge or onset of GI bleeding§ | Study population | RR 0.73 | 667 | ⊕⊕⊝⊝ | ||
| 52 per 1000 | 38 per 1000 | |||||
| Serious adverse events | Not reported | |||||
| *The risk in the intervention group (and its 95% confidence interval) is based on the assumed risk in the comparison group and the relative effect of the intervention (and its 95% CI). ‡Duration of follow‐up reported in two studies. §Duration of follow‐up reported in one study. | ||||||
| GRADE Working Group grades of evidence. | ||||||
| aDowngraded by one level for imprecision because 95% CI was compatible with benefit and harm. bDowngraded by one level for risk of bias because of high risk of selection bias in three studies, high risk of performance bias in 12 studies, high risk of detection bias in one study, high risk of attrition bias in one study, high risk of reporting bias in two studies, and high risk of other biases in two studies. cDowngraded by one level for risk of bias because of high risk of performance bias in four studies, high risk of detection bias in one study, high risk of reporting bias in one study, and high risk of other biases in one study. dDowngraded by one level for risk of bias because of high risk of selection bias in three studies, high risk of performance bias in eight studies, high risk of attrition bias in one study, high risk of reporting bias in one study, and high risk of other biases in one study. eDowngraded by one level for risk of bias because of high risk of attrition bias in one study. fDowngraded by one level for risk of bias because of high risk of selection bias in one study, high risk of performance bias in six studies, and high risk of other biases in one study. | ||||||
| Outcome or subgroup title | No. of studies | No. of participants | Statistical method | Effect size |
| 1 Clinically important upper GI bleeding Show forest plot | 30 | 3132 | Risk Ratio (M‐H, Fixed, 95% CI) | 0.47 [0.39, 0.57] |
| 1.1 H2 receptor antagonists vs placebo or no prophylaxis | 24 | 1844 | Risk Ratio (M‐H, Fixed, 95% CI) | 0.46 [0.37, 0.59] |
| 1.2 Proton pump inhibitors vs placebo or no prophylaxis | 3 | 159 | Risk Ratio (M‐H, Fixed, 95% CI) | 0.57 [0.13, 2.59] |
| 1.3 Prostagladin analogues vs placebo or no prophylaxis | 1 | 58 | Risk Ratio (M‐H, Fixed, 95% CI) | 1.0 [0.22, 4.55] |
| 1.4 Anticholinergics vs placebo or no prophylaxis | 2 | 103 | Risk Ratio (M‐H, Fixed, 95% CI) | 0.87 [0.30, 2.49] |
| 1.5 Antacids vs placebo or no prophylaxis | 7 | 515 | Risk Ratio (M‐H, Fixed, 95% CI) | 0.39 [0.23, 0.63] |
| 1.6 Sucralfate vs placebo or no prophylaxis | 7 | 453 | Risk Ratio (M‐H, Fixed, 95% CI) | 0.47 [0.25, 0.87] |
| 2 Nosocomial pneumonia Show forest plot | 9 | 1331 | Risk Ratio (M‐H, Fixed, 95% CI) | 1.15 [0.90, 1.48] |
| 2.1 H2 receptor antagonists vs placebo or no prophylaxis | 8 | 788 | Risk Ratio (M‐H, Fixed, 95% CI) | 1.06 [0.77, 1.46] |
| 2.2 Proton pump inhibitors vs placebo or no prophylaxis | 2 | 149 | Risk Ratio (M‐H, Fixed, 95% CI) | 1.13 [0.59, 2.17] |
| 2.3 Anticholinergics vs placebo or no prophylaxis | 1 | 72 | Risk Ratio (M‐H, Fixed, 95% CI) | 1.06 [0.43, 2.59] |
| 2.4 Sucralfate vs placebo or no prophylaxis | 4 | 322 | Risk Ratio (M‐H, Fixed, 95% CI) | 1.59 [0.84, 3.01] |
| 3 All‐cause mortality in ICU Show forest plot | 19 | 2159 | Risk Ratio (M‐H, Fixed, 95% CI) | 1.10 [0.90, 1.34] |
| 3.1 H2 receptor antagonists vs placebo or no prophylaxis | 14 | 1209 | Risk Ratio (M‐H, Fixed, 95% CI) | 1.16 [0.89, 1.53] |
| 3.2 Proton pump inhibitors vs placebo or no prophylaxis | 3 | 180 | Risk Ratio (M‐H, Fixed, 95% CI) | 1.05 [0.46, 2.38] |
| 3.3 Prostagladin analogues vs placebo or no prophylaxis | 1 | 58 | Risk Ratio (M‐H, Fixed, 95% CI) | 1.14 [0.48, 2.74] |
| 3.4 Anticholinergics vs placebo or no prophylaxis | 2 | 103 | Risk Ratio (M‐H, Fixed, 95% CI) | 1.22 [0.59, 2.56] |
| 3.5 Antacids vs placebo or no prophylaxis | 2 | 250 | Risk Ratio (M‐H, Fixed, 95% CI) | 1.02 [0.58, 1.79] |
| 3.6 Sucralfate vs placebo or no prophylaxis | 5 | 359 | Risk Ratio (M‐H, Fixed, 95% CI) | 0.93 [0.58, 1.51] |
| 4 All‐cause mortality in hospital Show forest plot | 5 | 857 | Risk Ratio (M‐H, Fixed, 95% CI) | 1.15 [0.85, 1.55] |
| 4.1 H2 receptor antagonists vs placebo or no prophylaxis | 4 | 387 | Risk Ratio (M‐H, Fixed, 95% CI) | 1.14 [0.71, 1.83] |
| 4.2 Proton pump inhibitors vs placebo or no prophylaxis | 1 | 100 | Risk Ratio (M‐H, Fixed, 95% CI) | 1.17 [0.42, 3.22] |
| 4.3 Antacids vs placebo or no prophylaxis | 1 | 126 | Risk Ratio (M‐H, Fixed, 95% CI) | 1.44 [0.79, 2.64] |
| 4.4 Sucralfate vs placebo or no prophylaxis | 2 | 244 | Risk Ratio (M‐H, Fixed, 95% CI) | 0.94 [0.53, 1.68] |
| 5 Duration of ICU stay Show forest plot | 2 | 447 | Mean Difference (IV, Fixed, 95% CI) | 0.24 [‐1.13, 1.61] |
| 5.1 H2 receptor antagonists vs placebo or no prophylaxis | 2 | 152 | Mean Difference (IV, Fixed, 95% CI) | 0.73 [‐1.64, 3.09] |
| 5.2 Proton pump inhibitors vs placebo or no prophylaxis | 2 | 149 | Mean Difference (IV, Fixed, 95% CI) | 0.01 [‐2.33, 2.35] |
| 5.3 Sucralfate vs placebo or no prophylaxis | 2 | 146 | Mean Difference (IV, Fixed, 95% CI) | ‐0.01 [‐2.40, 2.38] |
| 6 Duration of intubation Show forest plot | 2 | 447 | Mean Difference (IV, Fixed, 95% CI) | 0.87 [‐0.58, 2.31] |
| 6.1 H2 receptor antagonists vs placebo or no prophylaxis | 2 | 152 | Mean Difference (IV, Fixed, 95% CI) | 0.78 [‐1.72, 3.29] |
| 6.2 Proton pump inhibitors vs placebo or no prophylaxis | 2 | 149 | Mean Difference (IV, Fixed, 95% CI) | 0.36 [‐2.18, 2.90] |
| 6.3 Sucralfate vs placebo or no prophylaxis | 2 | 146 | Mean Difference (IV, Fixed, 95% CI) | 1.43 [‐1.04, 3.89] |
| 7 Number of participants requiring blood transfusions Show forest plot | 9 | 981 | Risk Ratio (M‐H, Fixed, 95% CI) | 0.63 [0.41, 0.97] |
| 7.1 H2 receptor antagonists vs placebo or no prophylaxis | 7 | 605 | Risk Ratio (M‐H, Fixed, 95% CI) | 0.57 [0.35, 0.94] |
| 7.2 Antacids vs placebo or no prophylaxis | 2 | 226 | Risk Ratio (M‐H, Fixed, 95% CI) | 0.94 [0.30, 2.96] |
| 7.3 Sucralfate vs placebo or no prophylaxis | 1 | 150 | Risk Ratio (M‐H, Fixed, 95% CI) | 0.75 [0.13, 4.34] |
| 8 Units of blood transfused Show forest plot | 2 | 309 | Mean Difference (IV, Random, 95% CI) | 0.09 [‐0.99, 1.17] |
| 8.1 H2 receptor antagonists vs placebo or no prophylaxis | 2 | 159 | Mean Difference (IV, Random, 95% CI) | ‐1.73 [‐6.37, 2.90] |
| 8.2 Sucralfate vs placebo or no prophylaxis | 1 | 150 | Mean Difference (IV, Random, 95% CI) | 0.80 [0.25, 1.35] |
| Outcome or subgroup title | No. of studies | No. of participants | Statistical method | Effect size |
| 1 Clinically important upper GI bleeding Show forest plot | 24 | 2149 | Risk Ratio (M‐H, Random, 95% CI) | 0.50 [0.36, 0.70] |
| 1.1 Cimetidine vs placebo | 10 | 772 | Risk Ratio (M‐H, Random, 95% CI) | 0.53 [0.28, 1.02] |
| 1.2 Famotidine vs placebo | 1 | 146 | Risk Ratio (M‐H, Random, 95% CI) | 2.11 [0.20, 22.79] |
| 1.3 Ranitidine vs placebo | 5 | 446 | Risk Ratio (M‐H, Random, 95% CI) | 0.36 [0.17, 0.77] |
| 1.4 Cimetidine vs no prophylaxis | 3 | 516 | Risk Ratio (M‐H, Random, 95% CI) | 0.59 [0.23, 1.48] |
| 1.5 Famotidine vs no prophylaxis | 1 | 50 | Risk Ratio (M‐H, Random, 95% CI) | 0.3 [0.09, 0.96] |
| 1.6 Ranitidine vs no prophylaxis | 4 | 219 | Risk Ratio (M‐H, Random, 95% CI) | 0.51 [0.26, 1.00] |
| 2 Nosocomial pneumonia Show forest plot | 8 | 945 | Risk Ratio (M‐H, Fixed, 95% CI) | 1.12 [0.85, 1.48] |
| 2.1 Cimetidine vs placebo | 2 | 204 | Risk Ratio (M‐H, Fixed, 95% CI) | 0.34 [0.06, 2.00] |
| 2.2 Famotidine vs placebo | 1 | 146 | Risk Ratio (M‐H, Fixed, 95% CI) | 1.48 [0.49, 4.45] |
| 2.3 Ranitidine vs placebo | 2 | 277 | Risk Ratio (M‐H, Fixed, 95% CI) | 0.79 [0.47, 1.31] |
| 2.4 Cimetidine vs no prophylaxis | 1 | 200 | Risk Ratio (M‐H, Fixed, 95% CI) | 2.17 [0.86, 5.47] |
| 2.5 Ranitidine vs no prophylaxis | 2 | 118 | Risk Ratio (M‐H, Fixed, 95% CI) | 1.33 [0.93, 1.90] |
| 3 All‐cause mortality in ICU Show forest plot | 14 | 1428 | Risk Ratio (M‐H, Fixed, 95% CI) | 1.12 [0.88, 1.42] |
| 3.1 Cimetidine vs placebo | 4 | 478 | Risk Ratio (M‐H, Fixed, 95% CI) | 1.05 [0.66, 1.68] |
| 3.2 Famotidine vs placebo | 1 | 146 | Risk Ratio (M‐H, Fixed, 95% CI) | 1.32 [0.55, 3.16] |
| 3.3 Ranitidine vs placebo | 2 | 148 | Risk Ratio (M‐H, Fixed, 95% CI) | 0.69 [0.31, 1.54] |
| 3.4 Cimetidine vs no prophylaxis | 2 | 400 | Risk Ratio (M‐H, Fixed, 95% CI) | 1.0 [0.61, 1.63] |
| 3.5 Famotidine vs no prophylaxis | 1 | 50 | Risk Ratio (M‐H, Fixed, 95% CI) | 1.25 [0.59, 2.64] |
| 3.6 Ranitidine vs no prophylaxis | 4 | 206 | Risk Ratio (M‐H, Fixed, 95% CI) | 1.58 [0.97, 2.58] |
| 4 All‐cause mortality in hospital Show forest plot | 4 | 487 | Risk Ratio (M‐H, Fixed, 95% CI) | 1.16 [0.79, 1.70] |
| 4.1 Famotidine vs placebo | 1 | 146 | Risk Ratio (M‐H, Fixed, 95% CI) | 0.89 [0.43, 1.86] |
| 4.2 Ranitidine vs placebo | 1 | 101 | Risk Ratio (M‐H, Fixed, 95% CI) | 0.35 [0.01, 8.47] |
| 4.3 Cimetidine vs no prophylaxis | 1 | 200 | Risk Ratio (M‐H, Fixed, 95% CI) | 1.47 [0.88, 2.46] |
| 4.4 Ranitidine vs no prophylaxis | 1 | 40 | Risk Ratio (M‐H, Fixed, 95% CI) | 0.92 [0.33, 2.53] |
| 5 Duration of ICU stay Show forest plot | 2 | 230 | Mean Difference (IV, Fixed, 95% CI) | 0.73 [‐0.92, 2.38] |
| 5.1 Famotidine vs placebo | 1 | 146 | Mean Difference (IV, Fixed, 95% CI) | 1.5 [‐1.93, 4.93] |
| 5.2 Ranitidine vs no prophylaxis | 1 | 84 | Mean Difference (IV, Fixed, 95% CI) | 0.5 [‐1.38, 2.38] |
| 6 Duration of intubation Show forest plot | 2 | 230 | Mean Difference (IV, Fixed, 95% CI) | 0.79 [‐0.95, 2.54] |
| 6.1 Famotidine vs placebo | 1 | 146 | Mean Difference (IV, Fixed, 95% CI) | 1.20 [‐1.86, 4.26] |
| 6.2 Ranitidine vs no prophylaxis | 1 | 84 | Mean Difference (IV, Fixed, 95% CI) | 0.60 [‐1.52, 2.72] |
| 7 Number of participants requiring blood transfusions Show forest plot | 7 | 655 | Risk Ratio (M‐H, Fixed, 95% CI) | 0.58 [0.36, 0.95] |
| 7.1 Cimetidine vs placebo | 3 | 107 | Risk Ratio (M‐H, Fixed, 95% CI) | 0.39 [0.19, 0.79] |
| 7.2 Ranitidine vs placebo | 2 | 148 | Risk Ratio (M‐H, Fixed, 95% CI) | 1.05 [0.24, 4.60] |
| 7.3 Cimetidine vs no prophylaxis | 2 | 400 | Risk Ratio (M‐H, Fixed, 95% CI) | 0.77 [0.35, 1.71] |
| 8 Units of blood transfused Show forest plot | 2 | 209 | Mean Difference (IV, Fixed, 95% CI) | 0.33 [‐0.04, 0.70] |
| 8.1 Cimetidine vs placebo | 1 | 9 | Mean Difference (IV, Fixed, 95% CI) | ‐4.35 [‐7.35, ‐1.35] |
| 8.2 Cimetidine vs no prophylaxis | 1 | 200 | Mean Difference (IV, Fixed, 95% CI) | 0.40 [0.03, 0.77] |
| 9 Adverse events of interventions Show forest plot | 8 | Risk Ratio (M‐H, Fixed, 95% CI) | Subtotals only | |
| 9.1 Diarrhoea | 2 | 225 | Risk Ratio (M‐H, Fixed, 95% CI) | 1.30 [0.57, 2.96] |
| 9.2 Thrombocytopenia | 1 | 200 | Risk Ratio (M‐H, Fixed, 95% CI) | 3.0 [0.12, 72.77] |
| 9.3 Hypophosphatemia | 1 | 25 | Risk Ratio (M‐H, Fixed, 95% CI) | 3.75 [0.17, 84.02] |
| 9.4 Mental confusion | 5 | 657 | Risk Ratio (M‐H, Fixed, 95% CI) | 2.01 [1.10, 3.65] |
| 9.5 Nausea and vomiting | 2 | 287 | Risk Ratio (M‐H, Fixed, 95% CI) | 0.46 [0.09, 2.35] |
| 9.6 Increased creatinine levels | 1 | 200 | Risk Ratio (M‐H, Fixed, 95% CI) | 1.04 [0.64, 1.69] |
| 9.7 Erythema | 1 | 70 | Risk Ratio (M‐H, Fixed, 95% CI) | 3.0 [0.13, 71.22] |
| 9.8 Pancreatitis | 1 | 39 | Risk Ratio (M‐H, Fixed, 95% CI) | 0.29 [0.01, 6.66] |
| 9.9 Chest infection | 1 | 101 | Risk Ratio (M‐H, Fixed, 95% CI) | 1.74 [0.92, 3.30] |
| 9.10 Delirium | 1 | 39 | Risk Ratio (M‐H, Fixed, 95% CI) | 2.59 [0.11, 59.93] |
| 9.11 Hallucinations | 1 | 39 | Risk Ratio (M‐H, Fixed, 95% CI) | 2.59 [0.11, 59.93] |
| 9.12 Severe bleeding | 1 | 101 | Risk Ratio (M‐H, Fixed, 95% CI) | 0.35 [0.01, 8.47] |
| Outcome or subgroup title | No. of studies | No. of participants | Statistical method | Effect size |
| 1 Clinically important upper GI bleeding Show forest plot | 3 | 237 | Risk Ratio (M‐H, Fixed, 95% CI) | 0.63 [0.18, 2.22] |
| 1.1 Omeprazole vs placebo | 1 | 147 | Risk Ratio (M‐H, Fixed, 95% CI) | 1.04 [0.07, 16.34] |
| 1.2 Omeprazole vs no prophylaxis | 1 | 80 | Risk Ratio (M‐H, Fixed, 95% CI) | 0.74 [0.13, 4.18] |
| 1.3 Pantoprazole vs placebo | 1 | 10 | Risk Ratio (M‐H, Fixed, 95% CI) | 0.28 [0.02, 4.66] |
| 2 Nosocomial pneumonia Show forest plot | 2 | 227 | Risk Ratio (M‐H, Fixed, 95% CI) | 1.24 [0.77, 1.98] |
| 2.1 Omeprazole vs placebo | 1 | 147 | Risk Ratio (M‐H, Fixed, 95% CI) | 1.67 [0.57, 4.86] |
| 2.2 Omeprazole vs no prophylaxis | 1 | 80 | Risk Ratio (M‐H, Fixed, 95% CI) | 1.11 [0.66, 1.84] |
| 3 All‐cause mortality in ICU Show forest plot | 3 | 258 | Risk Ratio (M‐H, Fixed, 95% CI) | 1.09 [0.60, 1.99] |
| 3.1 Omeprazole vs placebo | 2 | 178 | Risk Ratio (M‐H, Fixed, 95% CI) | 1.20 [0.51, 2.83] |
| 3.2 Omeprazole vs no prophylaxis | 1 | 80 | Risk Ratio (M‐H, Fixed, 95% CI) | 0.98 [0.42, 2.29] |
| 4 All‐cause mortality in hospital Show forest plot | 1 | 150 | Risk Ratio (M‐H, Fixed, 95% CI) | 1.08 [0.54, 2.13] |
| 4.1 Omeprazole vs placebo | 1 | 150 | Risk Ratio (M‐H, Fixed, 95% CI) | 1.08 [0.54, 2.13] |
| 5 Duration of ICU stay Show forest plot | 2 | 227 | Mean Difference (IV, Fixed, 95% CI) | ‐0.03 [‐1.63, 1.58] |
| 5.1 Omeprazole vs placebo | 1 | 147 | Mean Difference (IV, Fixed, 95% CI) | ‐0.90 [‐3.96, 2.16] |
| 5.2 Omeprazole vs no prophylaxis | 1 | 80 | Mean Difference (IV, Fixed, 95% CI) | 0.30 [‐1.58, 2.18] |
| 6 Duration of intubation Show forest plot | 2 | 227 | Mean Difference (IV, Fixed, 95% CI) | 0.36 [‐1.43, 2.15] |
| 6.1 Omeprazole vs placebo | 1 | 147 | Mean Difference (IV, Fixed, 95% CI) | 0.5 [‐2.72, 3.72] |
| 6.2 Omeprazole vs no prophylaxis | 1 | 80 | Mean Difference (IV, Fixed, 95% CI) | 0.30 [‐1.85, 2.45] |
| Outcome or subgroup title | No. of studies | No. of participants | Statistical method | Effect size |
| 1 Clinically important upper GI bleeding Show forest plot | 1 | Risk Ratio (M‐H, Fixed, 95% CI) | Totals not selected | |
| Outcome or subgroup title | No. of studies | No. of participants | Statistical method | Effect size |
| 1 Clinically important upper GI bleeding Show forest plot | 1 | Risk Ratio (M‐H, Fixed, 95% CI) | Totals not selected | |
| 1.1 Prostaglandin analogues vs placebo | 1 | Risk Ratio (M‐H, Fixed, 95% CI) | 0.0 [0.0, 0.0] | |
| 2 All‐cause mortality in ICU Show forest plot | 1 | Risk Ratio (M‐H, Fixed, 95% CI) | Totals not selected | |
| Outcome or subgroup title | No. of studies | No. of participants | Statistical method | Effect size |
| 1 Clinically important upper GI bleeding Show forest plot | 2 | 131 | Risk Ratio (M‐H, Fixed, 95% CI) | 0.95 [0.36, 2.51] |
| 1.1 Pirenzepine vs placebo | 1 | 101 | Risk Ratio (M‐H, Fixed, 95% CI) | 1.94 [0.34, 11.13] |
| 1.2 Pirenzepin + ranitidine vs placebo + ranitidine | 1 | 30 | Risk Ratio (M‐H, Fixed, 95% CI) | 0.6 [0.17, 2.07] |
| 2 Nosocomial pneumonia Show forest plot | 1 | Risk Ratio (M‐H, Fixed, 95% CI) | Totals not selected | |
| 2.1 Pirenzepine vs placebo | 1 | Risk Ratio (M‐H, Fixed, 95% CI) | 0.0 [0.0, 0.0] | |
| 3 All‐cause mortality in ICU Show forest plot | 2 | 131 | Risk Ratio (M‐H, Fixed, 95% CI) | 1.23 [0.66, 2.30] |
| 3.1 Pirenzepine vs placebo | 1 | 101 | Risk Ratio (M‐H, Fixed, 95% CI) | 1.30 [0.65, 2.60] |
| 3.2 Pirenzepine + ranitidine vs placebo + ranitidine | 1 | 30 | Risk Ratio (M‐H, Fixed, 95% CI) | 1.0 [0.24, 4.18] |
| Outcome or subgroup title | No. of studies | No. of participants | Statistical method | Effect size |
| 1 Clinically important upper GI bleeding Show forest plot | 8 | 774 | Risk Ratio (M‐H, Random, 95% CI) | 0.49 [0.25, 0.99] |
| 1.1 Antacids vs placebo | 2 | 145 | Risk Ratio (M‐H, Random, 95% CI) | 2.04 [0.72, 5.79] |
| 1.2 Antacids vs no prophylaxis | 6 | 629 | Risk Ratio (M‐H, Random, 95% CI) | 0.35 [0.20, 0.60] |
| 2 All‐cause mortality in ICU Show forest plot | 2 | 300 | Risk Ratio (M‐H, Random, 95% CI) | 1.01 [0.53, 1.96] |
| 2.1 Antacids vs no prophylaxis | 2 | 300 | Risk Ratio (M‐H, Random, 95% CI) | 1.01 [0.53, 1.96] |
| 3 All‐cause mortality in hospital Show forest plot | 1 | Risk Ratio (M‐H, Fixed, 95% CI) | Totals not selected | |
| 3.1 Antacids vs no prophylaxis | 1 | Risk Ratio (M‐H, Fixed, 95% CI) | 0.0 [0.0, 0.0] | |
| 4 Number of participants requiring blood transfusions Show forest plot | 2 | Risk Ratio (M‐H, Fixed, 95% CI) | Subtotals only | |
| 4.1 Antacids vs no prophylaxis | 2 | 226 | Risk Ratio (M‐H, Fixed, 95% CI) | 0.94 [0.30, 2.96] |
| 5 Adverse events of interventions Show forest plot | 4 | Risk Ratio (M‐H, Fixed, 95% CI) | Subtotals only | |
| 5.1 Diarrhoea | 4 | 395 | Risk Ratio (M‐H, Fixed, 95% CI) | 3.56 [1.83, 6.94] |
| 5.2 Hypomagnesaemia | 1 | 25 | Risk Ratio (M‐H, Fixed, 95% CI) | 3.75 [0.17, 84.02] |
| 5.3 Hypophosphataemia | 2 | 225 | Risk Ratio (M‐H, Fixed, 95% CI) | 5.48 [1.81, 16.61] |
| 5.4 Hypermagnesaemia | 1 | 100 | Risk Ratio (M‐H, Fixed, 95% CI) | 6.73 [0.36, 127.02] |
| 5.5 Nausea and vomiting | 3 | 370 | Risk Ratio (M‐H, Fixed, 95% CI) | 2.39 [0.86, 6.64] |
| 5.6 Mental confusion | 1 | 200 | Risk Ratio (M‐H, Fixed, 95% CI) | 1.27 [0.61, 2.67] |
| 5.7 Creatinine increase | 1 | 200 | Risk Ratio (M‐H, Fixed, 95% CI) | 1.17 [0.73, 1.87] |
| Outcome or subgroup title | No. of studies | No. of participants | Statistical method | Effect size |
| 1 Clinically important upper GI bleeding Show forest plot | 7 | 598 | Risk Ratio (M‐H, Fixed, 95% CI) | 0.53 [0.32, 0.88] |
| 1.1 Sucralfate vs placebo | 2 | 170 | Risk Ratio (M‐H, Fixed, 95% CI) | 1.40 [0.30, 6.62] |
| 1.2 Sucralfate vs no prophylaxis | 5 | 428 | Risk Ratio (M‐H, Fixed, 95% CI) | 0.46 [0.26, 0.80] |
| 2 Nosocomial pneumonia Show forest plot | 4 | 450 | Risk Ratio (M‐H, Fixed, 95% CI) | 1.33 [0.86, 2.04] |
| 2.1 Sucralfate vs placebo | 2 | 170 | Risk Ratio (M‐H, Fixed, 95% CI) | 1.43 [0.49, 4.16] |
| 2.2 Sucralfate vs no prophylaxis | 2 | 280 | Risk Ratio (M‐H, Fixed, 95% CI) | 1.30 [0.82, 2.07] |
| 3 All‐cause mortality in ICU Show forest plot | 5 | 500 | Risk Ratio (M‐H, Fixed, 95% CI) | 0.97 [0.66, 1.43] |
| 3.1 Sucralfate vs placebo | 2 | 170 | Risk Ratio (M‐H, Fixed, 95% CI) | 0.92 [0.48, 1.80] |
| 3.2 Sucralfate vs no prophylaxis | 3 | 330 | Risk Ratio (M‐H, Fixed, 95% CI) | 0.99 [0.62, 1.60] |
| 4 All‐cause mortality in hospital Show forest plot | 2 | 344 | Risk Ratio (M‐H, Fixed, 95% CI) | 0.97 [0.62, 1.52] |
| 4.1 Sucralfate vs placebo | 1 | 144 | Risk Ratio (M‐H, Fixed, 95% CI) | 1.09 [0.54, 2.18] |
| 4.2 Sucralfate vs no prophylaxis | 1 | 200 | Risk Ratio (M‐H, Fixed, 95% CI) | 0.89 [0.49, 1.62] |
| 5 Duration of ICU stay Show forest plot | 2 | 224 | Mean Difference (IV, Fixed, 95% CI) | ‐0.02 [‐1.70, 1.65] |
| 5.1 Sucralfate vs placebo | 1 | 144 | Mean Difference (IV, Fixed, 95% CI) | ‐0.70 [‐4.07, 2.67] |
| 5.2 Sucralfate vs no prophylaxis | 1 | 80 | Mean Difference (IV, Fixed, 95% CI) | 0.20 [‐1.73, 2.13] |
| 6 Duration of intubation Show forest plot | 2 | 224 | Mean Difference (IV, Fixed, 95% CI) | 1.42 [‐0.27, 3.10] |
| 6.1 Sucralfate vs placebo | 1 | 144 | Mean Difference (IV, Fixed, 95% CI) | 0.80 [‐2.20, 3.80] |
| 6.2 Sucralfate vs no prophylaxis | 1 | 80 | Mean Difference (IV, Fixed, 95% CI) | 1.70 [‐0.34, 3.74] |
| 7 Number of participants requiring blood transfusions Show forest plot | 1 | Risk Ratio (M‐H, Fixed, 95% CI) | Totals not selected | |
| 7.1 Sucralfate vs no prophylaxis | 1 | Risk Ratio (M‐H, Fixed, 95% CI) | 0.0 [0.0, 0.0] | |
| 8 Units of blood transfused Show forest plot | 1 | 200 | Mean Difference (IV, Fixed, 95% CI) | 0.8 [0.32, 1.28] |
| 8.1 Sucralfate vs no prophylaxis | 1 | 200 | Mean Difference (IV, Fixed, 95% CI) | 0.8 [0.32, 1.28] |
| 9 Adverse events of interventions Show forest plot | 1 | 70 | Risk Ratio (M‐H, Fixed, 95% CI) | 9.0 [0.50, 161.13] |
| 9.1 Nausea / Vomiting | 1 | 70 | Risk Ratio (M‐H, Fixed, 95% CI) | 9.0 [0.50, 161.13] |
| Outcome or subgroup title | No. of studies | No. of participants | Statistical method | Effect size |
| 1 Clinically important upper GI bleeding Show forest plot | 13 | 1636 | Risk Ratio (M‐H, Fixed, 95% CI) | 2.90 [1.83, 4.58] |
| 1.1 Cimetidine vs omeprazole | 1 | 359 | Risk Ratio (M‐H, Fixed, 95% CI) | 1.40 [0.55, 3.61] |
| 1.2 Famotidine vs lansoprazole | 1 | 51 | Risk Ratio (M‐H, Fixed, 95% CI) | 3.63 [0.15, 84.98] |
| 1.3 Famotidine vs omeprazole | 1 | 143 | Risk Ratio (M‐H, Fixed, 95% CI) | 2.03 [0.19, 21.87] |
| 1.4 Famotidine vs pantoprazole | 2 | 159 | Risk Ratio (M‐H, Fixed, 95% CI) | 0.73 [0.18, 3.04] |
| 1.5 Famotidine vs esomeprazole | 2 | 371 | Risk Ratio (M‐H, Fixed, 95% CI) | 7.53 [1.39, 40.85] |
| 1.6 Ranitidine vs omeprazole | 5 | 413 | Risk Ratio (M‐H, Fixed, 95% CI) | 4.08 [1.99, 8.36] |
| 1.7 Ranitidine vs rabeprazole | 1 | 140 | Risk Ratio (M‐H, Fixed, 95% CI) | 9.0 [0.49, 164.09] |
| 2 Nosocomial pneumonia Show forest plot | 10 | 1256 | Risk Ratio (M‐H, Fixed, 95% CI) | 1.02 [0.77, 1.35] |
| 2.1 Cimetidine vs omeprazole | 1 | 359 | Risk Ratio (M‐H, Fixed, 95% CI) | 0.84 [0.45, 1.54] |
| 2.2 Cimetidine vs pantoprazole | 1 | 202 | Risk Ratio (M‐H, Fixed, 95% CI) | 0.89 [0.28, 2.91] |
| 2.3 Famotidine vs esomeprazole | 1 | 60 | Risk Ratio (M‐H, Fixed, 95% CI) | 1.0 [0.07, 15.26] |
| 2.4 Famotidine vs omeprazole | 1 | 143 | Risk Ratio (M‐H, Fixed, 95% CI) | 0.89 [0.34, 2.32] |
| 2.5 Ranitidine vs omeprazole | 5 | 413 | Risk Ratio (M‐H, Fixed, 95% CI) | 1.19 [0.80, 1.75] |
| 2.6 H2 receptor antagonists (not defined) vs proton pump inhibitors (not defined) | 1 | 79 | Risk Ratio (M‐H, Fixed, 95% CI) | 1.03 [0.47, 2.26] |
| 3 All‐cause mortality in ICU Show forest plot | 12 | 1564 | Risk Ratio (M‐H, Fixed, 95% CI) | 0.96 [0.78, 1.19] |
| 3.1 Cimetidine vs omeprazole | 1 | 359 | Risk Ratio (M‐H, Fixed, 95% CI) | 0.76 [0.45, 1.30] |
| 3.2 Cimetidine vs pantoprazole | 1 | 202 | Risk Ratio (M‐H, Fixed, 95% CI) | 0.80 [0.25, 2.55] |
| 3.3 Famotidine vs omeprazole | 1 | 143 | Risk Ratio (M‐H, Fixed, 95% CI) | 1.13 [0.49, 2.61] |
| 3.4 Ranitidine vs omeprazole | 5 | 387 | Risk Ratio (M‐H, Fixed, 95% CI) | 1.10 [0.86, 1.40] |
| 3.5 Ranitidine vs pantoprazole | 3 | 333 | Risk Ratio (M‐H, Fixed, 95% CI) | 0.66 [0.31, 1.43] |
| 3.6 Ranitidine vs rabeprazole | 1 | 140 | Risk Ratio (M‐H, Fixed, 95% CI) | 3.0 [0.12, 72.40] |
| 4 All‐cause mortality in hospital Show forest plot | 2 | 454 | Risk Ratio (M‐H, Fixed, 95% CI) | 0.72 [0.37, 1.43] |
| 4.1 Famotidine vs esomeprazole | 1 | 311 | Risk Ratio (M‐H, Fixed, 95% CI) | 0.37 [0.04, 3.49] |
| 4.2 Famotidine vs omeprazole | 1 | 143 | Risk Ratio (M‐H, Fixed, 95% CI) | 0.80 [0.39, 1.63] |
| 5 Duration of ICU stay Show forest plot | 5 | 482 | Mean Difference (IV, Fixed, 95% CI) | 0.14 [‐1.14, 1.41] |
| 5.1 Famotidine vs esomeprazole | 1 | 60 | Mean Difference (IV, Fixed, 95% CI) | ‐0.30 [‐6.51, 5.91] |
| 5.2 Famotidine vs omeprazole | 1 | 143 | Mean Difference (IV, Fixed, 95% CI) | 2.40 [‐0.44, 5.24] |
| 5.3 Ranitidine vs omeprazole | 3 | 279 | Mean Difference (IV, Fixed, 95% CI) | ‐0.44 [‐1.90, 1.02] |
| 6 Duration of intubation Show forest plot | 5 | 542 | Mean Difference (IV, Fixed, 95% CI) | ‐0.35 [‐1.48, 0.78] |
| 6.1 Famotidine vs omeprazole | 1 | 143 | Mean Difference (IV, Fixed, 95% CI) | 0.70 [‐2.24, 3.64] |
| 6.2 Ranitidine vs omeprazole | 3 | 279 | Mean Difference (IV, Fixed, 95% CI) | ‐0.78 [‐2.24, 0.67] |
| 6.3 Ranitidine vs pantoprazole | 1 | 120 | Mean Difference (IV, Fixed, 95% CI) | 0.07 [‐2.18, 2.32] |
| 7 Number of participants requiring blood transfusions Show forest plot | 3 | 575 | Risk Ratio (M‐H, Fixed, 95% CI) | 1.98 [0.75, 5.21] |
| 7.1 Cimetidine vs omeprazole | 1 | 359 | Risk Ratio (M‐H, Fixed, 95% CI) | 0.98 [0.29, 3.34] |
| 7.2 Ranitidine vs omeprazole | 1 | 76 | Risk Ratio (M‐H, Fixed, 95% CI) | 5.0 [0.25, 100.80] |
| 7.3 Ranitidine vs rabeprazole | 1 | 140 | Risk Ratio (M‐H, Fixed, 95% CI) | 9.0 [0.49, 164.09] |
| 8 Adverse events of interventions Show forest plot | 5 | Risk Ratio (M‐H, Fixed, 95% CI) | Subtotals only | |
| 8.1 Pyrexia | 1 | 202 | Risk Ratio (M‐H, Fixed, 95% CI) | 0.93 [0.05, 19.03] |
| 8.2 Thrombocytopaenia | 2 | 253 | Risk Ratio (M‐H, Fixed, 95% CI) | 3.64 [0.65, 20.46] |
| 8.3 Neuroleptic malignant syndrome | 1 | 202 | Risk Ratio (M‐H, Fixed, 95% CI) | 1.56 [0.06, 37.42] |
| 8.4 Cholestatic jaundice | 1 | 202 | Risk Ratio (M‐H, Fixed, 95% CI) | 1.56 [0.06, 37.42] |
| 8.5 Abnormal liver function test | 1 | 202 | Risk Ratio (M‐H, Fixed, 95% CI) | 1.56 [0.06, 37.42] |
| 8.6 Pruritus | 1 | 202 | Risk Ratio (M‐H, Fixed, 95% CI) | 1.56 [0.06, 37.42] |
| 8.7 Phlebitis | 1 | 202 | Risk Ratio (M‐H, Fixed, 95% CI) | 1.56 [0.06, 37.42] |
| 8.8 Major CV events | 1 | 311 | Risk Ratio (M‐H, Fixed, 95% CI) | 0.79 [0.26, 2.43] |
| 8.9 Abdominal distension and vomiting | 1 | 90 | Risk Ratio (M‐H, Fixed, 95% CI) | 1.15 [0.62, 2.14] |
| 8.10 Hypomagnesaemia | 1 | 129 | Risk Ratio (M‐H, Fixed, 95% CI) | 0.43 [0.16, 1.13] |
| 8.11 Nausea and vomiting | 1 | 129 | Risk Ratio (M‐H, Fixed, 95% CI) | 0.48 [0.13, 1.77] |
| 8.12 Diarrhoea | 1 | 129 | Risk Ratio (M‐H, Fixed, 95% CI) | 1.11 [0.16, 7.67] |
| Outcome or subgroup title | No. of studies | No. of participants | Statistical method | Effect size |
| 1 Clinically important upper GI bleeding Show forest plot | 16 | 1700 | Risk Ratio (M‐H, Random, 95% CI) | 0.96 [0.67, 1.36] |
| 1.1 Cimetidine vs antacids | 11 | 1155 | Risk Ratio (M‐H, Random, 95% CI) | 1.07 [0.65, 1.78] |
| 1.2 Cimetidine + pirenzepine vs antacid + pirenzepine | 1 | 66 | Risk Ratio (M‐H, Random, 95% CI) | 1.0 [0.15, 6.68] |
| 1.3 Ranitidine vs antacids | 4 | 479 | Risk Ratio (M‐H, Random, 95% CI) | 0.72 [0.42, 1.23] |
| 2 Nosocomial pneumonia Show forest plot | 4 | 581 | Risk Ratio (M‐H, Fixed, 95% CI) | 1.05 [0.81, 1.36] |
| 2.1 Cimetidine vs antacids | 2 | 136 | Risk Ratio (M‐H, Fixed, 95% CI) | 1.24 [0.70, 2.19] |
| 2.2 Ranitidine vs antacids | 2 | 445 | Risk Ratio (M‐H, Fixed, 95% CI) | 1.00 [0.75, 1.34] |
| 3 All‐cause mortality in ICU Show forest plot | 11 | 1321 | Risk Ratio (M‐H, Random, 95% CI) | 1.01 [0.66, 1.55] |
| 3.1 Cimetidine vs antacids | 8 | 885 | Risk Ratio (M‐H, Random, 95% CI) | 1.05 [0.69, 1.59] |
| 3.2 Cimetidine + pirenzepine vs antacid + pirenzepine | 1 | 66 | Risk Ratio (M‐H, Random, 95% CI) | 1.25 [0.37, 4.25] |
| 3.3 Ranitidine vs antacids | 2 | 370 | Risk Ratio (M‐H, Random, 95% CI) | 1.13 [0.14, 8.97] |
| 4 All‐cause mortality in hospital Show forest plot | 1 | Risk Ratio (M‐H, Fixed, 95% CI) | Totals not selected | |
| 4.1 Ranitidine vs antacids | 1 | Risk Ratio (M‐H, Fixed, 95% CI) | 0.0 [0.0, 0.0] | |
| 5 Duration of intubation Show forest plot | 3 | 121 | Mean Difference (IV, Random, 95% CI) | ‐0.81 [‐3.85, 2.23] |
| 5.1 Cimetidine vs antacids | 3 | 121 | Mean Difference (IV, Random, 95% CI) | ‐0.81 [‐3.85, 2.23] |
| 6 Number of participants requiring blood transfusions Show forest plot | 6 | 744 | Risk Ratio (M‐H, Fixed, 95% CI) | 2.49 [1.35, 4.62] |
| 6.1 Cimetidine vs antacids | 5 | 583 | Risk Ratio (M‐H, Fixed, 95% CI) | 2.47 [1.32, 4.63] |
| 6.2 Ranitidine vs antacids | 1 | 161 | Risk Ratio (M‐H, Fixed, 95% CI) | 3.04 [0.13, 73.46] |
| 7 Adverse events of interventions Show forest plot | 12 | Risk Ratio (M‐H, Fixed, 95% CI) | Subtotals only | |
| 7.1 Diarrhoea | 6 | 777 | Risk Ratio (M‐H, Fixed, 95% CI) | 0.23 [0.13, 0.43] |
| 7.2 Thrombocytopaenia | 4 | 452 | Risk Ratio (M‐H, Fixed, 95% CI) | 1.40 [0.93, 2.09] |
| 7.3 Nausea and vomiting | 4 | 380 | Risk Ratio (M‐H, Fixed, 95% CI) | 0.46 [0.19, 1.10] |
| 7.4 Hypophosphataemia | 2 | 108 | Risk Ratio (M‐H, Fixed, 95% CI) | 0.24 [0.04, 1.30] |
| 7.5 Hypomagnesaemia | 1 | 22 | Risk Ratio (M‐H, Fixed, 95% CI) | 0.33 [0.02, 7.39] |
| 7.6 Increase in creatinine | 2 | 286 | Risk Ratio (M‐H, Fixed, 95% CI) | 0.85 [0.56, 1.28] |
| 7.7 Mental confusion | 4 | 476 | Risk Ratio (M‐H, Fixed, 95% CI) | 1.26 [0.77, 2.07] |
| 7.8 Hypermagnesaemia | 2 | 115 | Risk Ratio (M‐H, Fixed, 95% CI) | 0.58 [0.17, 2.03] |
| 7.9 Rash/Erythema | 2 | 231 | Risk Ratio (M‐H, Fixed, 95% CI) | 3.02 [0.32, 28.53] |
| 7.10 Alkalosis | 1 | 75 | Risk Ratio (M‐H, Fixed, 95% CI) | 0.32 [0.01, 7.73] |
| 7.11 Dryness of mouth | 1 | 67 | Risk Ratio (M‐H, Fixed, 95% CI) | 5.15 [0.26, 103.33] |
| 7.12 Leucopaenia | 1 | 161 | Risk Ratio (M‐H, Fixed, 95% CI) | 3.04 [0.13, 73.46] |
| Outcome or subgroup title | No. of studies | No. of participants | Statistical method | Effect size |
| 1 Clinically important upper GI bleeding Show forest plot | 24 | 3316 | Risk Ratio (M‐H, Fixed, 95% CI) | 1.10 [0.87, 1.41] |
| 1.1 Cimetidine vs sucralfate | 7 | 873 | Risk Ratio (M‐H, Fixed, 95% CI) | 1.37 [0.87, 2.14] |
| 1.2 Famotidine vs sucralfate | 2 | 190 | Risk Ratio (M‐H, Fixed, 95% CI) | 0.62 [0.21, 1.78] |
| 1.3 Ranitidine vs sucralfate | 14 | 2186 | Risk Ratio (M‐H, Fixed, 95% CI) | 1.03 [0.76, 1.39] |
| 1.4 Cimetidine + pirenzepine vs sucralfate + pirenzepine | 1 | 67 | Risk Ratio (M‐H, Fixed, 95% CI) | 5.15 [0.26, 103.33] |
| 2 Nosocomial pneumonia Show forest plot | 17 | 3041 | Risk Ratio (M‐H, Fixed, 95% CI) | 1.22 [1.07, 1.40] |
| 2.1 Cimetidine vs sucralfate | 5 | 758 | Risk Ratio (M‐H, Fixed, 95% CI) | 1.13 [0.87, 1.47] |
| 2.2 Famotidine vs sucralfate | 1 | 140 | Risk Ratio (M‐H, Fixed, 95% CI) | 1.13 [0.40, 3.20] |
| 2.3 Ranitidine vs sucralfate | 11 | 2143 | Risk Ratio (M‐H, Fixed, 95% CI) | 1.26 [1.07, 1.48] |
| 3 All‐cause mortality in ICU Show forest plot | 21 | 3178 | Risk Ratio (M‐H, Fixed, 95% CI) | 1.09 [0.95, 1.24] |
| 3.1 Cimetidine vs sucralfate | 6 | 814 | Risk Ratio (M‐H, Fixed, 95% CI) | 1.18 [0.91, 1.54] |
| 3.2 Famotidine vs sucralfate | 2 | 190 | Risk Ratio (M‐H, Fixed, 95% CI) | 1.23 [0.69, 2.19] |
| 3.3 Ranitidine vs sucralfate | 12 | 2107 | Risk Ratio (M‐H, Fixed, 95% CI) | 1.04 [0.88, 1.22] |
| 3.4 Cimetidine + pirenzepine vs sucralfate + pirenzepine | 1 | 67 | Risk Ratio (M‐H, Fixed, 95% CI) | 1.29 [0.38, 4.38] |
| 4 All‐cause mortality in hospital Show forest plot | 4 | 717 | Risk Ratio (M‐H, Fixed, 95% CI) | 1.14 [0.86, 1.50] |
| 4.1 Cimetidine vs sucralfate | 2 | 413 | Risk Ratio (M‐H, Fixed, 95% CI) | 1.28 [0.86, 1.92] |
| 4.2 Ranitidine vs sucralfate | 1 | 164 | Risk Ratio (M‐H, Fixed, 95% CI) | 1.11 [0.71, 1.74] |
| 4.3 Famotidine vs sucralfate | 1 | 140 | Risk Ratio (M‐H, Fixed, 95% CI) | 0.82 [0.40, 1.71] |
| 5 Duration of intubation Show forest plot | 10 | 1751 | Mean Difference (IV, Random, 95% CI) | 0.22 [‐1.55, 2.00] |
| 5.1 Cimetidine vs sucralfate | 2 | 97 | Mean Difference (IV, Random, 95% CI) | 0.58 [‐1.71, 2.87] |
| 5.2 Famotidine vs sucralfate | 1 | 140 | Mean Difference (IV, Random, 95% CI) | 0.40 [‐2.30, 3.10] |
| 5.3 Ranitidine vs sucralfate | 7 | 1514 | Mean Difference (IV, Random, 95% CI) | 0.15 [‐2.12, 2.43] |
| 6 Duration of ICU stay Show forest plot | 6 | 1791 | Mean Difference (IV, Random, 95% CI) | 0.01 [‐1.92, 1.95] |
| 6.1 Cimetidine vs sucralfate | 1 | 213 | Mean Difference (IV, Random, 95% CI) | 0.0 [‐3.05, 3.05] |
| 6.2 Famotidine vs sucralfate | 1 | 140 | Mean Difference (IV, Random, 95% CI) | 2.20 [‐0.96, 5.36] |
| 6.3 Ranitidine vs sucralfate | 4 | 1438 | Mean Difference (IV, Random, 95% CI) | ‐0.43 [‐2.70, 1.84] |
| 7 Number of participants requiring blood transfusion Show forest plot | 9 | 1095 | Risk Ratio (M‐H, Fixed, 95% CI) | 1.25 [0.70, 2.23] |
| 7.1 Cimetidine vs sucralfate | 5 | 732 | Risk Ratio (M‐H, Fixed, 95% CI) | 1.00 [0.47, 2.16] |
| 7.2 Ranitidine vs sucralfate | 4 | 363 | Risk Ratio (M‐H, Fixed, 95% CI) | 1.77 [0.71, 4.39] |
| 8 Units of blood transfused Show forest plot | 1 | Mean Difference (IV, Fixed, 95% CI) | Totals not selected | |
| 8.1 Cimetidine vs sucralfate | 1 | Mean Difference (IV, Fixed, 95% CI) | 0.0 [0.0, 0.0] | |
| 9 Adverse events of interventions Show forest plot | 6 | Risk Ratio (M‐H, Fixed, 95% CI) | Subtotals only | |
| 9.1 Thrombocytopaenia | 2 | 240 | Risk Ratio (M‐H, Fixed, 95% CI) | 4.72 [0.56, 39.47] |
| 9.2 Nausea and vomiting | 2 | 137 | Risk Ratio (M‐H, Fixed, 95% CI) | 0.07 [0.01, 0.54] |
| 9.3 Hypermagnesaemia | 1 | 40 | Risk Ratio (M‐H, Fixed, 95% CI) | 2.71 [0.31, 23.93] |
| 9.4 Rash/Erythema | 2 | 233 | Risk Ratio (M‐H, Fixed, 95% CI) | 3.06 [0.32, 28.87] |
| 9.5 Confusion | 3 | 382 | Risk Ratio (M‐H, Fixed, 95% CI) | 4.48 [0.77, 26.00] |
| 9.6 Neutropaenia | 1 | 114 | Risk Ratio (M‐H, Fixed, 95% CI) | 5.18 [0.25, 105.47] |
| 9.7 Dryness of mouth | 1 | 67 | Risk Ratio (M‐H, Fixed, 95% CI) | 5.15 [0.26, 103.33] |
| 9.8 Leucopaenia | 1 | 163 | Risk Ratio (M‐H, Fixed, 95% CI) | 3.11 [0.13, 75.26] |
| Outcome or subgroup title | No. of studies | No. of participants | Statistical method | Effect size |
| 1 Clinically important upper GI bleeding Show forest plot | 3 | 556 | Risk Ratio (M‐H, Fixed, 95% CI) | 1.37 [0.58, 3.26] |
| 1.1 Cimetidine vs pirenzepine | 1 | 55 | Risk Ratio (M‐H, Fixed, 95% CI) | 1.45 [0.26, 7.99] |
| 1.2 Ranitidine vs pirenzepine | 2 | 501 | Risk Ratio (M‐H, Fixed, 95% CI) | 1.35 [0.50, 3.67] |
| 2 Nosocomial pneumonia Show forest plot | 3 | 544 | Risk Ratio (M‐H, Fixed, 95% CI) | 0.96 [0.50, 1.84] |
| 2.1 Famotidine vs pirenzepine | 1 | 43 | Risk Ratio (M‐H, Fixed, 95% CI) | 0.32 [0.01, 7.42] |
| 2.2 Ranitidine vs pirenzepine | 2 | 501 | Risk Ratio (M‐H, Fixed, 95% CI) | 1.03 [0.53, 2.01] |
| 3 All‐cause mortality in ICU Show forest plot | 2 | 501 | Risk Ratio (M‐H, Random, 95% CI) | 0.89 [0.21, 3.87] |
| 3.1 Ranitidine vs pirenzepine | 2 | 501 | Risk Ratio (M‐H, Random, 95% CI) | 0.89 [0.21, 3.87] |
| 4 Number of participants requiring blood transfusion Show forest plot | 1 | Risk Ratio (M‐H, Fixed, 95% CI) | Totals not selected | |
| 4.1 Ranitidine vs pirenzepine | 1 | Risk Ratio (M‐H, Fixed, 95% CI) | 0.0 [0.0, 0.0] | |
| 5 Adverse events of interventions Show forest plot | 2 | Risk Ratio (M‐H, Fixed, 95% CI) | Subtotals only | |
| 5.1 Tachycardia | 1 | 55 | Risk Ratio (M‐H, Fixed, 95% CI) | 0.11 [0.01, 1.90] |
| 5.2 High temperature | 1 | 43 | Risk Ratio (M‐H, Fixed, 95% CI) | 0.53 [0.21, 1.32] |
| Outcome or subgroup title | No. of studies | No. of participants | Statistical method | Effect size |
| 1 Clinically important upper GI bleeding Show forest plot | 1 | Risk Ratio (M‐H, Fixed, 95% CI) | Totals not selected | |
| 1.1 Cimetidine vs misoprostol | 1 | Risk Ratio (M‐H, Fixed, 95% CI) | 0.0 [0.0, 0.0] | |
| 2 All‐cause mortality in ICU Show forest plot | 1 | Risk Ratio (M‐H, Fixed, 95% CI) | Totals not selected | |
| 2.1 Cimetidine vs misoprostol | 1 | Risk Ratio (M‐H, Fixed, 95% CI) | 0.0 [0.0, 0.0] | |
| Outcome or subgroup title | No. of studies | No. of participants | Statistical method | Effect size |
| 1 Clinically important upper GI bleeding Show forest plot | 1 | Risk Ratio (M‐H, Fixed, 95% CI) | Totals not selected | |
| 1.1 Ranitidine vs teprenone | 1 | Risk Ratio (M‐H, Fixed, 95% CI) | 0.0 [0.0, 0.0] | |
| 2 All‐cause mortality in ICU Show forest plot | 1 | Risk Ratio (M‐H, Fixed, 95% CI) | Totals not selected | |
| 2.1 Ranitidine vs teprenone | 1 | Risk Ratio (M‐H, Fixed, 95% CI) | 0.0 [0.0, 0.0] | |
| 3 Number of participants requiring blood transfusion Show forest plot | 1 | Risk Ratio (M‐H, Fixed, 95% CI) | Totals not selected | |
| 3.1 Ranitidine vs teprenone | 1 | Risk Ratio (M‐H, Fixed, 95% CI) | 0.0 [0.0, 0.0] | |
| Outcome or subgroup title | No. of studies | No. of participants | Statistical method | Effect size |
| 1 Clinically important upper GI bleeding Show forest plot | 2 | 230 | Risk Ratio (M‐H, Fixed, 95% CI) | 0.24 [0.06, 0.95] |
| 1.1 Cimetidine + antacids vs sucralfate | 1 | 100 | Risk Ratio (M‐H, Fixed, 95% CI) | 0.14 [0.01, 2.70] |
| 1.2 Cimetidine or ranitidine + antacids vs sucralfate | 1 | 130 | Risk Ratio (M‐H, Fixed, 95% CI) | 0.29 [0.06, 1.41] |
| 2 Nosocomial pneumonia Show forest plot | 3 | 281 | Risk Ratio (M‐H, Random, 95% CI) | 1.09 [0.51, 2.32] |
| 2.1 Cimetidine + antacids vs sucralfate | 1 | 100 | Risk Ratio (M‐H, Random, 95% CI) | 0.53 [0.26, 1.07] |
| 2.2 Ranitidine + antacids vs sucralfate | 1 | 51 | Risk Ratio (M‐H, Random, 95% CI) | 1.27 [0.64, 2.53] |
| 2.3 Cimetidine or ranitidine + antacids vs sucralfate | 1 | 130 | Risk Ratio (M‐H, Random, 95% CI) | 2.02 [0.89, 4.58] |
| 3 All‐cause mortality in ICU Show forest plot | 2 | 230 | Risk Ratio (M‐H, Fixed, 95% CI) | 1.38 [0.92, 2.05] |
| 3.1 Cimetidine + antacids vs sucralfate | 1 | 100 | Risk Ratio (M‐H, Fixed, 95% CI) | 1.0 [0.46, 2.19] |
| 3.2 Cimetidine or ranitidine + antacids vs sucralfate | 1 | 130 | Risk Ratio (M‐H, Fixed, 95% CI) | 1.57 [0.99, 2.50] |
| 4 Duration of ICU stay Show forest plot | 1 | Mean Difference (IV, Fixed, 95% CI) | Totals not selected | |
| 5 Duration of intubation Show forest plot | 2 | 230 | Mean Difference (IV, Random, 95% CI) | ‐1.24 [‐13.82, 11.33] |
| 5.1 Cimetidine + antacids vs sucralfate | 1 | 100 | Mean Difference (IV, Random, 95% CI) | ‐8.8 [‐20.11, 2.51] |
| 5.2 Cimetidine or ranitidine + antacids vs sucralfate | 1 | 130 | Mean Difference (IV, Random, 95% CI) | 4.20 [‐0.54, 8.94] |
| 6 Number of participants requiring blood transfusion Show forest plot | 1 | Risk Ratio (M‐H, Fixed, 95% CI) | Totals not selected | |
| Outcome or subgroup title | No. of studies | No. of participants | Statistical method | Effect size |
| 1 Clinically important upper GI bleeding Show forest plot | 1 | Risk Ratio (M‐H, Fixed, 95% CI) | Totals not selected | |
| 1.1 Proton pump inhibitors vs teprenone | 1 | Risk Ratio (M‐H, Fixed, 95% CI) | 0.0 [0.0, 0.0] | |
| 2 All‐cause mortality in ICU Show forest plot | 1 | Risk Ratio (M‐H, Fixed, 95% CI) | Totals not selected | |
| 2.1 Proton pump inhibitors vs teprenone | 1 | Risk Ratio (M‐H, Fixed, 95% CI) | 0.0 [0.0, 0.0] | |
| 3 Number of participants requiring blood transfusion Show forest plot | 1 | Risk Ratio (M‐H, Fixed, 95% CI) | Totals not selected | |
| 3.1 Proton pump inhibitors vs teprenone | 1 | Risk Ratio (M‐H, Fixed, 95% CI) | 0.0 [0.0, 0.0] | |
| Outcome or subgroup title | No. of studies | No. of participants | Statistical method | Effect size |
| 1 Clinically important upper GI bleeding Show forest plot | 1 | Odds Ratio (M‐H, Fixed, 95% CI) | Totals not selected | |
| 2 All‐cause mortality in hospital Show forest plot | 1 | Odds Ratio (M‐H, Fixed, 95% CI) | Totals not selected | |
| 3 Adverse events ‐ gastrointestinal discomfort Show forest plot | 1 | Odds Ratio (M‐H, Fixed, 95% CI) | Totals not selected | |
| Outcome or subgroup title | No. of studies | No. of participants | Statistical method | Effect size |
| 1 Clinically important upper GI bleeding Show forest plot | 1 | Risk Ratio (M‐H, Fixed, 95% CI) | Totals not selected | |
| 2 Nosocomial pneumonia Show forest plot | 1 | Risk Ratio (M‐H, Fixed, 95% CI) | Totals not selected | |
| 3 All‐cause mortality in hospital Show forest plot | 1 | Risk Ratio (M‐H, Fixed, 95% CI) | Totals not selected | |
| Outcome or subgroup title | No. of studies | No. of participants | Statistical method | Effect size |
| 1 Clinically important upper GI bleeding Show forest plot | 16 | 1772 | Risk Ratio (M‐H, Fixed, 95% CI) | 1.00 [0.72, 1.39] |
| 1.1 Antacids vs sucralfate | 15 | 1705 | Risk Ratio (M‐H, Fixed, 95% CI) | 0.96 [0.69, 1.35] |
| 1.2 Antacid + pirenzepine vs sucralfate + pirenzepine | 1 | 67 | Risk Ratio (M‐H, Fixed, 95% CI) | 5.15 [0.26, 103.33] |
| 2 Nosocomial pneumonia Show forest plot | 7 | Risk Ratio (M‐H, Fixed, 95% CI) | Subtotals only | |
| 2.1 Antacids vs sucralfate | 7 | 996 | Risk Ratio (M‐H, Fixed, 95% CI) | 1.04 [0.84, 1.30] |
| 3 All‐cause mortality in ICU Show forest plot | 11 | 1249 | Risk Ratio (M‐H, Fixed, 95% CI) | 1.15 [0.93, 1.40] |
| 3.1 Antacid vs sucralfate | 10 | 1182 | Risk Ratio (M‐H, Fixed, 95% CI) | 1.15 [0.94, 1.41] |
| 3.2 Antacid + pirenzepine vs sucralfate + pirenzepine | 1 | 67 | Risk Ratio (M‐H, Fixed, 95% CI) | 1.03 [0.28, 3.78] |
| 4 All‐cause mortality in hospital Show forest plot | 3 | 450 | Risk Ratio (M‐H, Random, 95% CI) | 0.98 [0.69, 1.39] |
| 5 Duration of ICU stay Show forest plot | 2 | Mean Difference (IV, Fixed, 95% CI) | Subtotals only | |
| 5.1 Antacids vs sucralfate | 2 | 227 | Mean Difference (IV, Fixed, 95% CI) | ‐2.50 [‐6.61, 1.61] |
| 6 Duration of intubation Show forest plot | 4 | Std. Mean Difference (IV, Fixed, 95% CI) | Subtotals only | |
| 6.1 Antacids vs sucralfate | 4 | 281 | Std. Mean Difference (IV, Fixed, 95% CI) | ‐0.18 [‐0.41, 0.06] |
| 7 Number of participants requiring blood transfusion Show forest plot | 6 | 667 | Risk Ratio (M‐H, Fixed, 95% CI) | 0.73 [0.40, 1.34] |
| 8 Adverse events of interventions Show forest plot | 9 | Risk Ratio (M‐H, Fixed, 95% CI) | Subtotals only | |
| 8.1 Diarrhoea | 6 | 599 | Risk Ratio (M‐H, Fixed, 95% CI) | 12.40 [3.88, 39.64] |
| 8.2 Hypermagnesaemia | 4 | 317 | Risk Ratio (M‐H, Fixed, 95% CI) | 4.72 [1.24, 17.95] |
| 8.3 Nausea and vomiting | 3 | 223 | Risk Ratio (M‐H, Fixed, 95% CI) | 0.63 [0.28, 1.41] |
| 8.4 Thrombocytopaenia | 1 | 38 | Risk Ratio (M‐H, Fixed, 95% CI) | 5.0 [0.26, 97.70] |
| 8.5 Severe alkalosis | 1 | 100 | Risk Ratio (M‐H, Fixed, 95% CI) | 3.0 [0.13, 71.92] |
| 8.6 Allergic reactions | 1 | 100 | Risk Ratio (M‐H, Fixed, 95% CI) | 0.2 [0.01, 4.06] |
| Outcome or subgroup title | No. of studies | No. of participants | Statistical method | Effect size |
| 1 Clinically important upper GI bleeding Show forest plot | 2 | 329 | Risk Ratio (M‐H, Fixed, 95% CI) | 0.33 [0.12, 0.91] |
| 2 All‐cause mortality in ICU Show forest plot | 2 | 417 | Risk Ratio (M‐H, Fixed, 95% CI) | 0.84 [0.42, 1.67] |
| 3 Adverse events of interventions Show forest plot | 1 | Risk Ratio (M‐H, Fixed, 95% CI) | Subtotals only | |
| 3.1 Diarrhoea | 1 | 368 | Risk Ratio (M‐H, Fixed, 95% CI) | 0.92 [0.64, 1.33] |
| 3.2 Elevated serum bicarbonate | 1 | 338 | Risk Ratio (M‐H, Fixed, 95% CI) | 2.21 [1.27, 3.87] |
| 3.3 Phospate levels < 2.5 mg/dL | 1 | 276 | Risk Ratio (M‐H, Fixed, 95% CI) | 1.66 [1.01, 2.73] |
| Outcome or subgroup title | No. of studies | No. of participants | Statistical method | Effect size |
| 1 Clinically important upper GI bleeding Show forest plot | 1 | Risk Ratio (M‐H, Fixed, 95% CI) | Totals not selected | |
| 2 Number of participants requiring blood transfusion Show forest plot | 1 | Risk Ratio (M‐H, Fixed, 95% CI) | Totals not selected | |
| Outcome or subgroup title | No. of studies | No. of participants | Statistical method | Effect size |
| 1 Clinically important upper GI bleeding Show forest plot | 3 | Risk Ratio (M‐H, Fixed, 95% CI) | Subtotals only | |
| 1.1 Sucralfate vs omeprazole | 3 | 287 | Risk Ratio (M‐H, Fixed, 95% CI) | 2.58 [0.77, 8.63] |
| 2 Nosocomial pneumonia Show forest plot | 4 | 424 | Risk Ratio (M‐H, Random, 95% CI) | 0.67 [0.41, 1.09] |
| 2.1 Sucralfate vs omeprazole | 3 | 287 | Risk Ratio (M‐H, Random, 95% CI) | 0.88 [0.57, 1.36] |
| 2.2 Sucralfate vs pantoprazole | 1 | 137 | Risk Ratio (M‐H, Random, 95% CI) | 0.39 [0.20, 0.75] |
| 3 All‐cause mortality in ICU Show forest plot | 4 | 424 | Risk Ratio (M‐H, Fixed, 95% CI) | 1.07 [0.68, 1.68] |
| 3.1 Sucralfate vs omeprazole | 3 | 287 | Risk Ratio (M‐H, Fixed, 95% CI) | 1.26 [0.75, 2.11] |
| 3.2 Sucralfate vs pantoprazole | 1 | 137 | Risk Ratio (M‐H, Fixed, 95% CI) | 0.65 [0.25, 1.68] |
| 4 All‐cause mortality in hospital Show forest plot | 2 | 278 | Risk Ratio (M‐H, Fixed, 95% CI) | 0.79 [0.46, 1.37] |
| 4.1 Sucralfate vs omeprazole | 1 | 141 | Risk Ratio (M‐H, Fixed, 95% CI) | 0.97 [0.49, 1.91] |
| 4.2 Sucralfate vs pantoprazole | 1 | 137 | Risk Ratio (M‐H, Fixed, 95% CI) | 0.56 [0.21, 1.45] |
| 5 Duration of ICU stay Show forest plot | 2 | Mean Difference (IV, Fixed, 95% CI) | Subtotals only | |
| 5.1 Sucralfate vs omeprazole | 2 | 217 | Mean Difference (IV, Fixed, 95% CI) | 0.01 [‐1.68, 1.70] |
| 6 Duration of intubation Show forest plot | 3 | 354 | Mean Difference (IV, Fixed, 95% CI) | ‐0.16 [‐1.61, 1.28] |
| 6.1 Sucralfate vs omeprazole | 2 | 217 | Mean Difference (IV, Fixed, 95% CI) | 0.02 [‐1.56, 1.60] |
| 6.2 Sucralfate vs pantoprazole | 1 | 137 | Mean Difference (IV, Fixed, 95% CI) | ‐1.10 [‐4.69, 2.49] |
| 7 Number of participants requiring blood transfusion Show forest plot | 1 | Risk Ratio (M‐H, Fixed, 95% CI) | Subtotals only | |
| 7.1 Sucralfate vs omeprazole | 1 | 70 | Risk Ratio (M‐H, Fixed, 95% CI) | 5.91 [0.29, 118.78] |
| 8 Adverse events of interventions Show forest plot | 1 | Risk Ratio (M‐H, Random, 95% CI) | Subtotals only | |
| 8.1 Fever | 1 | 137 | Risk Ratio (M‐H, Random, 95% CI) | 0.81 [0.70, 0.94] |
| 8.2 Leucocytosis | 1 | 137 | Risk Ratio (M‐H, Random, 95% CI) | 0.66 [0.55, 0.80] |
| 8.3 Sudden purulent sputum | 1 | 137 | Risk Ratio (M‐H, Random, 95% CI) | 0.85 [0.38, 1.86] |
| 8.4 Sudden cough or aggravation of coughing | 1 | 137 | Risk Ratio (M‐H, Random, 95% CI) | 0.23 [0.07, 0.79] |
| 8.5 Dyspnoea | 1 | 137 | Risk Ratio (M‐H, Random, 95% CI) | 0.68 [0.54, 0.87] |
| 8.6 Rales or bronchial sounds | 1 | 137 | Risk Ratio (M‐H, Random, 95% CI) | 0.31 [0.19, 0.51] |
| 8.7 Aggravation of blood gas exchange | 1 | 137 | Risk Ratio (M‐H, Random, 95% CI) | 0.76 [0.49, 1.18] |
| 8.8 Change in sputum quality | 1 | 137 | Risk Ratio (M‐H, Random, 95% CI) | 0.23 [0.13, 0.40] |
| Outcome or subgroup title | No. of studies | No. of participants | Statistical method | Effect size |
| 1 Clinically important upper GI bleeding Show forest plot | 1 | Risk Ratio (M‐H, Fixed, 95% CI) | Totals not selected | |
| 2 Number of participants requiring blood transfusion Show forest plot | 1 | Risk Ratio (M‐H, Fixed, 95% CI) | Totals not selected | |
| Outcome or subgroup title | No. of studies | No. of participants | Statistical method | Effect size |
| 1 Clinically important upper GI bleeding Show forest plot | 1 | Risk Ratio (M‐H, Fixed, 95% CI) | Subtotals only | |
| 1.1 TPN vs ranitidine + TPN | 1 | 54 | Risk Ratio (M‐H, Fixed, 95% CI) | 0.8 [0.05, 12.14] |
| 1.2 TPN vs sucralfate + TPN | 1 | 49 | Risk Ratio (M‐H, Fixed, 95% CI) | 0.32 [0.03, 3.26] |
| 2 All‐cause mortality in ICU Show forest plot | 1 | Risk Ratio (M‐H, Fixed, 95% CI) | Subtotals only | |
| 2.1 TPN vs ranitidine + TPN | 1 | 54 | Risk Ratio (M‐H, Fixed, 95% CI) | 1.12 [0.41, 3.09] |
| 2.2 TPN vs sucralfate + TPN | 1 | 49 | Risk Ratio (M‐H, Fixed, 95% CI) | 0.63 [0.26, 1.52] |
| 3 Duration of intubation Show forest plot | 1 | Mean Difference (IV, Fixed, 95% CI) | Subtotals only | |
| 3.1 TPN vs ranitidine + TPN | 1 | 54 | Mean Difference (IV, Fixed, 95% CI) | ‐2.0 [‐9.53, 5.53] |
| 3.2 TPN vs sucralfate + TPN | 1 | 49 | Mean Difference (IV, Fixed, 95% CI) | 3.0 [‐1.50, 7.50] |
| Outcome or subgroup title | No. of studies | No. of participants | Statistical method | Effect size |
| 1 Clinically important upper GI bleeding Show forest plot | 1 | Risk Ratio (M‐H, Fixed, 95% CI) | Totals not selected | |
| Outcome or subgroup title | No. of studies | No. of participants | Statistical method | Effect size |
| 1 Clinically important upper GI bleeding Show forest plot | 1 | Risk Ratio (M‐H, Fixed, 95% CI) | Totals not selected | |
| 2 Nosocomial pneumonia Show forest plot | 1 | Risk Ratio (M‐H, Fixed, 95% CI) | Totals not selected | |
| 3 All‐cause mortality in hospital Show forest plot | 1 | Risk Ratio (M‐H, Fixed, 95% CI) | Totals not selected | |
| 4 Adverse events of interventions Show forest plot | 1 | Risk Ratio (M‐H, Fixed, 95% CI) | Totals not selected | |
| Outcome or subgroup title | No. of studies | No. of participants | Statistical method | Effect size |
| 1 Nosocomial pneumonia Show forest plot | 1 | 120 | Risk Ratio (M‐H, Fixed, 95% CI) | 0.79 [0.44, 1.40] |
| 1.1 Enteral plus parenteral nutrition vs enteral nutrition | 1 | 60 | Risk Ratio (M‐H, Fixed, 95% CI) | 0.6 [0.29, 1.25] |
| 1.2 Enteral plus parenteral nutrition vs parenteral nutrition | 1 | 60 | Risk Ratio (M‐H, Fixed, 95% CI) | 1.25 [0.47, 3.33] |
| 2 All‐cause mortality in hospital Show forest plot | 1 | 120 | Odds Ratio (M‐H, Fixed, 95% CI) | 0.20 [0.06, 0.60] |
| 2.1 Enteral plus parenteral nutrition vs enteral nutrition | 1 | 60 | Odds Ratio (M‐H, Fixed, 95% CI) | 0.26 [0.05, 1.30] |
| 2.2 Enteral plus parenteral nutrition vs parenteral nutrition | 1 | 60 | Odds Ratio (M‐H, Fixed, 95% CI) | 0.15 [0.03, 0.74] |
| 3 Duration of ICU stay Show forest plot | 1 | 120 | Mean Difference (IV, Fixed, 95% CI) | ‐5.98 [‐8.81, ‐3.16] |
| 3.1 Enteral plus parenteral nutrition vs enteral nutrition | 1 | 60 | Mean Difference (IV, Fixed, 95% CI) | ‐3.81 [‐7.59, ‐0.03] |
| 3.2 Enteral plus parenteral nutrition vs parenteral nutrition | 1 | 60 | Mean Difference (IV, Fixed, 95% CI) | ‐8.72 [‐12.97, ‐4.47] |
| 4 Duration of intubation Show forest plot | 1 | 120 | Mean Difference (IV, Fixed, 95% CI) | ‐7.37 [‐9.29, ‐5.45] |
| 4.1 Enteral plus parenteral nutrition vs enteral nutrition | 1 | 60 | Mean Difference (IV, Fixed, 95% CI) | ‐4.17 [‐6.96, ‐1.38] |
| 4.2 Enteral plus parenteral nutrition vs parenteral nutrition | 1 | 60 | Mean Difference (IV, Fixed, 95% CI) | ‐10.24 [‐12.88, ‐7.60] |
| 5 Adverse events ‐ stress ulcer Show forest plot | 1 | 120 | Risk Ratio (M‐H, Fixed, 95% CI) | 0.69 [0.36, 1.33] |
| 5.1 Enteral plus parenteral nutrition vs enteral nutrition | 1 | 60 | Risk Ratio (M‐H, Fixed, 95% CI) | 1.14 [0.38, 3.45] |
| 5.2 Enteral plus parenteral nutrition vs parenteral nutrition | 1 | 60 | Risk Ratio (M‐H, Fixed, 95% CI) | 0.53 [0.23, 1.20] |
| 6 Adverse events ‐ diarrhoea Show forest plot | 1 | 120 | Odds Ratio (M‐H, Fixed, 95% CI) | 0.42 [0.17, 1.02] |
| 6.1 Enteral plus parenteral nutrition vs enteral nutrition | 1 | 60 | Odds Ratio (M‐H, Fixed, 95% CI) | 0.17 [0.05, 0.59] |
| 6.2 Enteral plus parenteral nutrition vs parenteral nutrition | 1 | 60 | Odds Ratio (M‐H, Fixed, 95% CI) | 1.42 [0.35, 5.73] |
| 7 Adverse events ‐ pyaemia Show forest plot | 1 | 120 | Odds Ratio (M‐H, Fixed, 95% CI) | 0.88 [0.37, 2.09] |
| 7.1 Enteral plus parenteral nutrition vs enteral nutrition | 1 | 60 | Odds Ratio (M‐H, Fixed, 95% CI) | 4.11 [0.87, 19.41] |
| 7.2 Enteral plus parenteral nutrition vs parenteral nutrition | 1 | 60 | Odds Ratio (M‐H, Fixed, 95% CI) | 0.37 [0.11, 1.21] |
| 8 Adverse events ‐ intracranial infection Show forest plot | 1 | 120 | Odds Ratio (M‐H, Fixed, 95% CI) | 0.43 [0.15, 1.25] |
| 8.1 Enteral plus parenteral nutrition vs enteral nutrition | 1 | 60 | Odds Ratio (M‐H, Fixed, 95% CI) | 0.83 [0.19, 3.63] |
| 8.2 Enteral plus parenteral nutrition vs parenteral nutrition | 1 | 60 | Odds Ratio (M‐H, Fixed, 95% CI) | 0.23 [0.05, 1.15] |
| 9 Adverse events ‐ hypoproteinaemia Show forest plot | 1 | 120 | Odds Ratio (M‐H, Fixed, 95% CI) | 0.11 [0.04, 0.27] |
| 9.1 Enteral plus parenteral nutrition vs enteral nutrition | 1 | 60 | Odds Ratio (M‐H, Fixed, 95% CI) | 0.20 [0.06, 0.72] |
| 9.2 Enteral plus parenteral nutrition vs parenteral nutrition | 1 | 60 | Odds Ratio (M‐H, Fixed, 95% CI) | 0.04 [0.01, 0.19] |