مقایسه سیتولوژی در برابر تست ویروس پاپیلومای انسانی برای غربالگری سرطان سرویکس در جمعیت عمومی
چکیده
پیشینه
غربالگری سرطان سرویکس به طور مرسوم بر مبنای سیتولوژی سرویکس (cervical cytology) صورت میگرفته است. با توجه به وجود رابطه اتیولوژیک بین عفونت ناشی از ویروس پاپیلومای انسانی (human papillomavirus; HPV) و کارسیتوژنزیس سرویکس (cervical carcinogenesis)، تست HPV به عنوان یک تست غربالگری جایگزین پیشنهاد شده است.
اهداف
تعیین دقت تشخیصی تست HPV برای تشخیص نئوپلازی اینترااپیتلیال سرویکس (cervical intraepithelial neoplasias; CIN) درجه 2 یا بدتر (+CIN 2) تایید شده با هیستولوژی، شامل آدنوکارسینوما در محل، در زنان شرکتکننده در غربالگری اولیه سرطان سرویکس؛ و چگونی مقایسه این روش تشخیصی با دقت تست سیتولوژی (بر پایه مایع (liquid‐based) و متداول (conventional)) در آستانههای متنوع.
روشهای جستوجو
برای یافتن مقالات حاوی دادههای کمی، نسبت به اجرای جستوجوی سیتماتیک منابع علمی در MEDLINE و Embase (از 1992 تا نوامبر 2015) اقدام و فهرست منابع مقالات بازیابی شده را به صورت دستی جستوجو کردیم.
معیارهای انتخاب
مطالعات تطبیقی انجام شده در مورد دقت تست را وارد مرور کردیم، در صورتی که تمامی زنان هر دو تست HPV و سیتولوژی سرویکس را پس از تایید وضعیت بیماری بر اساس استاندارد مرجع دریافت کرده باشند، و در صورتی که نتیجه حداقل یکی از تستهای غربالگری مثبت باشد. مطالعات برای ورود به مرور باید زنانی را در برمیگرفتند که در برنامه غربالگری سرطان سرویکس شرکت کرده و برای اختلالات سیتولوژیک قبلی مورد پیگیری قرار نگرفته بودند.
گردآوری و تجزیهوتحلیل دادهها
ما نسبت به تکمیل جدول 2x2 شامل تعداد موارد مثبت حقیقی (true positives; TP)، مثبت کاذب (false positives; FP)، منفی حقیقی (true negative; TN) و منفی کاذب (false negatives; FN) برای هر یک از تستهای غربالگری (تست HPV و سیتولوژی) مورد استفاده در هر یک از مطالعات اقدام کردیم. حساسیتها (sensitivities) و ویژگیهای (specificities) قطعی و نسبی تستها را برای تشخیص +CIN 2 و +CIN 3 در آستانههای متنوع و حساسیت محاسبه شده (TP/(TP + TN)) و ویژگیهای محاسبه شده (TN/(TN + FP)) را برای هر یک از تستها به صورت جداگانه محاسبه کردیم. حساسیت و ویژگی نسبی برای یک تست در مقایسه با تست دیگر به ترتیب به صورت حساسیت بالاتر تست ‐1 بر حساسیت تست ‐2 و ویژگی بالاتر تست ‐1 بر تست ‐2 تعریف شدند. برای ارزیابی سوگیری (bias) مطالعات، از ابزار ارزیابی کیفیت مطالعات دقت تست تشخیصی (Quality Assessment of Diagnostic test Accuracy Studies; QUADAS) استفاده کردیم. از مدل اثرات تصادفی دو‐حالتی برای محاسبه تخمینهای دقت تجمعی استفاده کردیم. این مدل تغییر پذیری درون و بین مطالعاتی و همبستگی ذاتی را بین حساسیت و ویژگی در برمیگیرد.
نتایج اصلی
در مجموع 40 مطالعه را شامل بیش از 140,000 زن 20 تا 70 ساله در این مرور وارد کردیم. بسیاری از مطالعات دارای خطر پائین سوگیری بودند. تعداد کافی از مطالعات وارد شده به مرور وجود داشتند که متدولوژی آنها برای اجرای این مقایسهها بین تستها کفایت میکرد: هیبرید کپچر 2 (hybrid capture 2; HC2) (آستانه 1 پیکوگرم بر میلیلیتر در برابر سیتولوژی معمولی (conventional cytology; CC) (آستانههای سلولهای سنگفرشی آتیپیک با اهمیت نامعین (atypical squamous cells of undetermined significance; ASCUS) + و ضایعات اینترااپیتلیال سنگفرشی با درجه پائین (low‐grade squamous intraepithelial lesions; LSIL) + یا سیتولوژی بر پایه مایع (liquid‐based cytology; LBC) (آستانههای +ASCUS و +LSIL)، سایر تستهای HPV با خطر بالا در برابر سیتولوژی معمولی (آستانههای +ASCUS و +LSIL) یا LBC (آستانههای +ASCUS و +LSIL). برای +CIN 2، تخمینهای حساسیت تجمعی برای HC2؛ CC و LBC؛ (+ASCUS) به ترتیب عبارت بودند از 89.9%، 62.5% و 72.9%، و تخمینهای ویژگی تجمعی به ترتیب عبارت بودند از 89.9%، 96.6%، 90.3%. نتایج به دست آمده بر اساس سن زنان (کمتر یا بیشتر از 30 سال)، یا در مطالعات دارای سوگیری تایید پذیری تفاوتی نداشتند. با وجود این، دقت HC2 در کشورهای اروپایی در مقایسه با سایر کشورها بالاتر بود. نتایج مربوط به حساسیت تستها ناهمگون و بین 52% تا 94% برای LBC، و 61% تا 100% برای HC2 متغیر بود. در مجموع، کیفیت شواهد مربوط به حساسیت تستها متوسط و برای ویژگی بالا بود.
حساسیت نسبی HC2 در برابر CC برای +CIN 2، معادل 1.52؛ (95% CI؛ 1.24 تا 1.86) و ویژگی نسبی 0.94؛ (95% CI؛ 0.92 تا 0.96) و حساسیت نسبی در برابر LBC برای +CIN 2، معادل 1.18؛ (95% CI؛ 1.10 تا 1.26) و ویژگی نسبی 0.96؛ (95% CI؛ 0.95 تا 0.97) بود. حساسیت نسبی HC2 در برابر CC برای +CIN 3، معادل 1.46؛ (95% CI؛ 1.12 تا 1.91) و ویژگی نسبی 0.95؛ (95% CI؛ 0.93 تا 0.97) بود. حساسیت نسبی HC2 در برابر LBC برای +CIN 3، معادل 1.17؛ (95% CI؛ 1.07 تا 1.28) و ویژگی نسبی 0.96؛ (95% CI؛ 0.95 تا 0.97) بود.
نتیجهگیریهای نویسندگان
در حالی که تستهای HPV با احتمال کمتری موارد +CIN 2 و +CIN 3 را تشخیص نمیدهند، این تستها منجر به ارجاعهای غیر‐ضروری بیشتری میشوند. با وجود این، یک تست HPV منفی نسبت به یک تست سیتولوژی منفی بیشتر اطمینانبخش است، از آنجایی که تست سیتولوژی دارای شانس بیشتری از منفی کاذب است که میتواند منجر به ایجاد تاخیر در دریافت درمان مناسب شود. شواهد به دست آمده از مطالعات طولی آیندهنگر برای تعیین عوارض بالینی نسبی این تستها مورد نیاز است.
خلاصه به زبان ساده
بررسی تست ویروس پاپیلومای انسانی (human papillomavirus; HPV) در مقایسه با تست پاپانیکولا (Papanicolaou; Pap) برای غربالگری سرطان سرویکس
سوال مطالعه مروری
ما مطالعاتی را که به مقایسه دو تست غربالگری برای سرطان سرویکس پرداخته بودند، ارزیابی کردیم: تست HPV (تست ویروس پاپیلومای انسانی) و تست Pap که تحت عنوان اسمیر سرویکس (cervical smear) یا تست پاپانیکولا نیز شناخته میشود. هدف از انجام مرور دانستن این نکته بود که کدامیک از تستها تغییرات پیشسرطانی سرویکس را با دقت بیشتری تعیین میکنند.
پیشینه
تستهای HPV و Pap تستهایی هستند که یک پزشک برای چک کردن پیشرفت سرطان سرویکس یا تغییرات پیشسرطانی سلولهای سرویکس (که تحت عنوان ضایعات شناخته میشوند) انجام میدهند. این ضایعات میتوانند درون 10 تا 20 سال به سرطان سرویکس تبدیل شوند. تست HPV بررسی میکند که یک زن دارای عفونت HPV که ممکن است منجر به سرطان سرویکس شود، هست یا خیر. در صورتی که نتیجه این تست مثبت باشد، ممکن است نشان دهنده تغییرات پیشسرطانی در سرویکس باشد. انواع مختلفی از تستهای HPV وجود دارد. یکی از آنها تست HC2 است. تست Pap بررسی میکند که سلولهای سرویکس غیر‐عادی هستند یا خیر. سلولهای غیر‐عادی سرویکس که به صورت طیفی از درجه پائین تا درجه بالا تست میشوند، ممکن است نشان دهنده وجود تغییرات پیشسرطانی در سرویکس باشند که ممکن است منجر به بروز سرطان سرویکس شود. یکی از انواع تستهای Pap سیتولوژی معمولی (conventional cytology) و نوع دیگر آن سیتولوژی بر پایه مایع (liquid‐based cytology) است. بر اساس نوع تست، در صورتی که تست مثبت باشد، فرد ممکن است نیاز به بررسی سرویکس داشته یا میتواند برای برداشتن ضایعات پیشسرطانی تحت جراحی قرار بگیرد.
ویژگیهای مطالعه
برای به دست آوردن تمامی مطالعات مرتبط تا نوامبر 2015 جستوجو کردیم. چهل مطالعه به مقایسه تست HPV با تست Pap روی بیش از 140,000زن 20 تا 70 ساله مراجعه کننده برای انجام غربالگری روتین سرویکس پرداخته بودند. این مطالعات بررسی کرده بودند که کدامیک از این تستها میتواند تغییرات پیشسرطانی سرویکس را که نئوپلازی اینترااپیتلیال سرویکس (CIN 2 و CIN 3) گفته میشود، تشخیص دهد.
کیفیت شواهد
تعداد مطالعات و تعداد زنان شرکتکننده در آنها برای اینکه ما بتوانیم نتیجهگیریهای لازم را بهعمل آوریم، کافی بودند. با وجود این، برخی از نتایج به دست آمده از مطالعات نسبت به هم متفاوت بودند. برای مثال، تستهای انجام شده در مطالعات به اجرا درآمده در اروپا نسبت به مطالعات انجام شده در آسیا یا آمریکای مرکزی یا جنوبی دقیقتر بودند. در مجموع، کیفیت شواهد متوسط تا بالا بود.
نتایج کلیدی
یک تست بدون نقص به طور صحیح نشان میدهد که یک زن دارای تغییرات پیشسرطانی هست یا خیر. اما بیشتر تستها بینقص نیستند.
این مرور نشان داد که به ازای هر 1000 زن غربالگری شده، حدود 20 زن دارای تغییرات پیشسرطانی خواهند بود. تست HPV، به درستی 18 نفر از این زنان را شناسایی خواهد کرد (اما 2 نفر را از دست خواهد داد). تست Pap، به درستی 15 نفر از این زنان را شناسایی خواهد کرد (اما 5 نفر را از دست خواهد داد). زنان دارای تغییرات پیشسرطانی که شناسایی نمیشوند، میتوانند مبتلا به سرطان سرویکس شوند.
به ازای هر 1000 زن غربالگری شده، 980 زن وجود خواهند داشت که دارای تغییرات پیشسرطانی نخواهند بود. تست HPV، به درستی 881 زن را شناسایی خواهد کرد (اما به 99 زن به اشتباه گفته خواهد شد که آنها دارای ضایعه هستند). تست Pap، به درستی 885 زن را شناسایی خواهد کرد (اما به 95 زن به اشتباه گفته خواهد شد که آنها دارای ضایعه هستند). زنانی که به اشتباه به آنها گفته میشود که دارای ضایعه هستند، ممکن است تحت بررسی سرویکس قرار گرفته یا ممکن است به طور غیر‐ضروری تحت جراحی قرار گیرند.
Authors' conclusions
Summary of findings
| Human papillomavirus (HPV) compared to Papanicolaou (Pap) test for detection of cervical intraepithelial neoplasia (CIN 2+) in asymptomatic women | |||||
| Patient or population: adult asymptomatic women Settings: outpatient screening programmes New Test: HPV, HC2 test Cut‐off value: 1 pg/mL Comparison Test: Pap, liquid‐based cytology (LBC) test Cut‐off value: atypical squamous cells of undetermined significance (ASCUS) Reference Test: a colposcopy exam with or without biopsy as clinically indicated | |||||
| HPV | 138,230 women | Pooled sensitivity | 89.9% (88.6 to 91.1%) | Pooled specificity | 89.9% (89.7 to 90.0%) |
| Pap | 82,003 women | Pooled sensitivity | 72.9% (70.7 to 75%) | Pooled specificity | 90.3% (90.1 to 90.5%) |
| Test results | Number of results per 1000 women tested | Quality of the evidence | Comments | ||
| Prevalence of CIN 2+, 2%1 | |||||
| HPV | Pap | ||||
| True positives (TP) | 18 (18 to 18) | 15 (14 to 15) | ⊕⊕⊕⊝ | Women will be correctly classified and will receive further confirmatory testing or treatment | |
| TP absolute difference | 3 more | ||||
| False negatives (FN) | 2 (2 to 2) | 5 (5 to 6) | Women will be falsely reassured that they do not have CIN 2+, and the potentially beneficial treatment may be missed or will be delayed | ||
| FN absolute difference | 3 fewer | ||||
| True negatives (TN) | 881 (879 to 882) | 885 (883 to 887) | ⊕⊕⊕⊕ | Women will be correctly reassured that they do not have CIN 2+ | |
| TN absolute difference | 4 fewer | ||||
| False positives (FP) | 99 (98 to 101) | 95 (93 to 97) | Women will likely receive unnecessary further testing and possibly also unnecessary treatment; additionally further testing and unnecessary treatment may lead to adverse effects and use of resources without any health benefits | ||
| FP absolute difference | 4 more | ||||
| CI: Confidence interval; HPV human papillomavirus; Pap: Papanicolaou test, CIN: cervical intraepithelial neoplasia | |||||
| GRADE Working Group grades of evidence | |||||
| 1 Prevalence of 2% (20 women out of 1000) was assumed to be the average prevalence of cervical intraepithelial neoplasia 2+ in non HIV asymptomatic women. | |||||
Background
Screening for cervical cancer meets the prerequisites that the World Health Organization (WHO) dictates as necessary for a useful mass screening programme (Wilson 1968). The disease is common enough to justify mass screening, it is associated with significant mortality, effective treatment is available for pre‐invasive or early invasive disease and, finally, detection and treatment of a presymptomatic state results in benefits beyond those obtained through treatment of symptomatic disease. An effective mass screening test, the Pap test, was introduced in the 1940s by George Papanicolaou and is based on the cytological morphology assessment of exfoliated cervical cells (Papanicolaou 1941). Organised screening programmes based on the Pap test have been successful in reducing the incidence of and mortality from the disease, although cancer still does occurs in women who attend for screening (Laara 1987). It has been established that cervical cancer has a strong causal relationship with persistent infection with high‐risk human papillomavirus (HPV) types (IARC 2007). Since then, research efforts have focused on the evaluation of a test for the detection of HPV DNA as an alternative method of screening for cervical cancer precursors.
Target condition being diagnosed
Worldwide, there are approximately half a million cases of cervical cancer annually and 85% of cases occur in low‐ and middle‐income countries. Cervical cancer accounts for 10% of all female cancers, making it the fourth leading cause of cancer death in women (Arbyn 2011). It is the third most common gynaecological cancer in the UK, after ovarian and endometrial cancer, although before the introduction of the screening programme it was the most common (Quinn 1999). In high‐income countries, the incidence of and mortality from cervical cancer appears to be falling, particularly in countries with systematic screening programmes (Arbyn 2009). Despite this trend, cervical cancer remains the second most common cancer in women in high‐income countries under 45 years of age (Arbyn 2011).
Infection of the uterine cervix with the high‐risk types of HPV is necessary for the development of cervical cancer, although the HPV infection alone is usually not sufficient to cause cancer. The presence of additional co‐factors is required (Bosch 2002; IARC 2007). Most high‐risk HPV infections clear spontaneously but in a small proportion of women the infection persists. It is these women who are at risk of developing high‐grade cervical intraepithelial neoplasia (CIN) grades 2 or 3 and adenocarcinoma in situ, which are cancer precursors (Schiffman 2007). CIN 2 and 3 can be effectively treated by excision or ablation of the lesion. Over a period of 30 years, untreated CIN 3 has a risk of progressing to invasive disease in approximately 25% to 30% of cases (McCredie 2008; McIndoe 1984).
Index test(s)
HPV test
Considering that HPV cannot be grown in conventional cell cultures, and serological assays have only limited sensitivity (Dilner 1999), the diagnosis of HPV infection requires the detection of its genome in cellular samples collected from the site under investigation. In the case of the uterine cervix the test is performed by collecting exfoliated cervical cells, similar to the Pap test. Specimens can be collected either by a healthcare provider during a pelvic examination, or through self‐sampling in the convenience of the woman’s home. Molecular technologies for the detection of HPV DNA can be broadly divided into amplified and non‐amplified. The tests mainly used in clinical research use amplification methods, which are further divided into signal amplified and target amplified. The main representative techniques of each category are the hybrid capture 2 (HC2; Digene Corporation, Gainthersburg, MD, USA) assay and polymerase chain reactions (PCR), respectively.
HC2 is a Food and Drug Administration‐ (FDA) approved test for HPV detection. The B probe of HC2 can detect infection from any of 13 high‐risk types (16, 18, 31, 33, 35, 39, 45, 51, 52, 56, 58, 59 and 68) but separate typing is not possible. The number of viral copies that have to be present per sample in order to obtain a positive result is 5000. HC2 succeeded an earlier test, the hybrid capture tube, which detected four fewer high‐risk types and had a higher threshold for positivity (50,000 viral copies per sample). That is, it had lower sensitivity than HC2 and is therefore not currently used.
PCR is a chemical reaction resulting in the synthesis of a large number of target HPV DNA copies. It allows testing on scanty cell samples, small amounts of DNA, or few viral copies and consists of two main steps. The first step is the amplification of the target DNA. This is performed with a thermocycling process (heating and cooling) and the use of oligonucleotide primers. The primers are usually consensus or general, meaning that they can be used to amplify a broad spectrum of HPV genotypes. They are aimed mainly at the L1 region of their genome. More recently PCR assays have been developed that target sequences of the E genes of the virus. Type‐specific primers that amplify a particular HPV genotype can also be used, though rarely. There are various designs of general primers currently available. They differ in the size of the DNA region they amplify and in measures taken to compensate for the problem of intertypic sequence variation of the target DNA sites. The GP5+/6+ primers amplify a 150 bp fragment and have to be used at a low annealing temperature in order to compensate for the mismatches with different genotypes. The MY09/11 primers amplify a 450 bp fragment and consist of a complex mixture of oligonucleotides in order to make up for intertypic variation. The PGMY primers amplify the same region of DNA as MY09/11 but contain inosine, which matches any nucleotide. The SPF10 system is another example of inosine‐containing primers and targets a 65 bp region. Finally the CPI/II primers amplify a 188 bp region of the E1 gene.
The second step of the PCR process is the detection and analysis of the PCR products. The amplified DNA sequence can be detected by agarose gel electrophoresis. However type‐specific analysis is possible and this can be achieved by a variety of methods such as restriction fragment length polymorphism, Southern blotting, microtiter plate hybridisation, direct sequence analysis and reverse hybridisation.
There are several new HPV assays that identify separate HPV genotypes: only the two main oncogenic types HPV16, HPV18 (for instance Cobas 4800, Cervista, Abbott RTPCR) or the full range of high‐risk HPV types and even a limited or extended number of non high‐risk HPV types. A review of the range of new HPV tests In the current review can be found in Poljak 2012. Only detection of high‐risk HPV types is addressed in the current review.
The basic disadvantage of HPV DNA detection methods in clinical practice is their low specificity. This is because HPV infections are usually transient and most of them do not cause any serious consequences. Only a small proportion of HPV infections initiate an oncogenic process that will eventually lead to the development of precancer CIN and invasive cancer. Women with active HPV infection will express E6/E7 oncogenes. These are required for malignant transformation, by inhibiting the tumour suppressors p53 and RB. The E6/E7 mRNA transcripts are detected by mRNA‐based molecular techniques and may therefore be of higher prognostic value, improving the specificity and positive prognostic value compared with the HPV DNA testing used in screening. The most widely used mRNA tests, are the PreTect HPV Proofer assay (NorChip AS, Klokkarstua, Norway), which detects only five (16, 18, 31, 33 and 45) high‐risk HPV types (Chan 1999) and the APTIMA test (Hologic, Add Cyty, USA), which detect E6/E7 RNA of 14 high‐risk HPV types (Arbyn 2012).
This review will not examine other molecular markers of HPV infection such as P16 and L1 immunostaining.
Comparator test: Pap test
Until recently, in the developed world, screening for cervical cancer was carried out by means of cytological examination of a cervical smear (the Pap test). After visualisation of the cervix with the use of a speculum the specimen is obtained with a sampling device, usually a spatula or a brush, which is rotated on the cervix. The collected material is applied to a glass slide (for conventional cytology) or the sampling device is rinsed in or left in a preservative solution (for liquid‐based cytology (LBC)).
Cytologists reading the Pap tests usually follow the Bethesda classification system for reporting cervical cytologic diagnoses (Solomon 2002). In this system the smears are reported as negative for intraepithelial lesion or malignancy; atypical squamous cells of undetermined significance (ASC‐US); atypical squamous cells, cannot exclude high grade lesion (ASC‐H); low‐grade squamous intraepithelial lesion (LSIL); high‐grade squamous intraepithelial lesion (HSIL); squamous cell carcinoma; atypical glandular cells (ACG); adenocarcinoma in situ (AIS); or adenocarcinoma. Women with an abnormal Pap test should be referred for further investigation, which includes either repetition of the cytology, HPV triage or colposcopy (Jordan 2008; Wright 2006). Cervical smears in the UK are reported using the British Society of Cervical Cytopathology (BSCC) terminology, which includes the categories of negative, inadequate, mild dyskaryosis, moderate dyskaryosis, severe dyskaryosis, possible invasive cancer, glandular neoplasia, and borderline changes. Women in the UK are referred for colposcopy if three consecutive smears are reported as inadequate; two consecutive smears as borderline; or any smear is reported as mild, moderate or severe dyskaryosis, possible invasive cancer or glandular neoplasia (NHSCSP 2004).
The European executive policy is that women between the ages of 25 and 65 years are invited to have a cervical smear test every three to five years (Arbyn 2010). The establishment of a population‐based screening programme with the ideal screening interval involves considerable infrastructure, workforce and equipment costs, which can be a barrier for implementation in low‐ and middle‐income countries.
Rationale
It is proven that 80% of cervical cancer can be prevented by well‐organised, high‐quality screening programmes using Pap smears with three‐ to five‐year screening intervals (IARC 2005). With well‐organised programmes, mortality from the disease can be reduced by up to 80% (IARC 2005). Some of the Nordic countries are good examples in this respect (Sigurdsson 1999). On the other hand, in several countries a decrease in cervical cancer incidence of only 40% to 65% has been documented. There are still countries with very high death and morbidity rates from this disease and with no historical decrease in the rates (Arbyn 2009; IARC 2005).
Various shortcomings of cervical cytology screening have been suggested as the source of this observation. One of them is the relatively low sensitivity of a single Pap test, even though the longitudinal sensitivity of repeated cytology is higher. In cancer screening a high rate of false negative results is a serious weakness. Therefore a more sensitive screening test is desirable. A systematic review of cervical screening failures in countries with organised screening programmes showed that, among the women who developed cervical cancer, 20% to 55% had had false‐negative smears 0 to 6 years prior to the diagnosis (Spence 2007). However, this result should be interpreted cautiously as the percentage of cancers that are cytologically negative is in direct proportion to screening coverage. In a population with complete coverage all cervical cancers that still occur would necessarily be due to screening or follow‐up failures.
Apart from the issue of low sensitivity, there are other concerns about the Pap smear test. There is considerable variation in the organisation and implementation of cervical cancer screening programmes within European countries (Anttila 2004). Infrastructure and resources in health care are not sufficient in many areas to build up an effective programme based on cytology. Even in several high‐income countries, a large proportion of the target women remain totally unscreened (Breitenecker 2004), forming a high‐risk group for cervical cancer. Moreover, very frequent screening intervals of young women may be associated with growing anxiety, over‐treatment and unfounded costs. Finally, there are concerns about the quality of the Pap test.
Given that HPV is the cause of cervical cancer and that HPV DNA is detected in virtually all cervical cancers (Walboomers 1999), new screening techniques based on HPV DNA testing have raised hopes and expectations for better prevention of the disease. Testing for HPV DNA is one of the most intensively studied alternatives to cervical cytology screening. The role of HPV testing has already been established and its use has gained wide acceptance in certain areas such as the triage of Pap smears with atypical squamous cell changes (ASCUS smears) and follow‐up after treatment (Arbyn 2004; Arbyn 2006). Its role in general population screening is still being discussed.
Objectives
The main objective of this review was to determine the diagnostic accuracy of HPV testing for detecting histologically confirmed CIN 2 or worse (CIN 2+), including adenocarcinoma in situ, in women participating in primary cervical cancer screening; and how it compares to the accuracy of cytological testing (liquid‐based and conventional) at various thresholds.
Secondary objectives
Secondary objectives of the review were:
-
to determine the accuracy for each test at prespecified thresholds and the accuracy of different HPV testing techniques;
-
to investigate sources of heterogeneity of test accuracy in the included studies. As possible sources of heterogeneity we assessed the influence of the following covariates: the geographical location where the study was conducted, the age limits of the study population, the number of HPV types that the HPV test detects, and the likelihood of verification bias.
Methods
Criteria for considering studies for this review
Types of studies
We looked for comparative test accuracy studies where all participants had received both HPV testing and cervical cytology (paired studies) followed by partial or complete verification of the disease status with the reference standard (see below). Studies where participants were randomised to receive either only the index test or only the comparator test were not eligible to be included. Our review focuses on paired studies because the comparison of index tests in such studies is (potentially) more valid because key factors can be held similar, including population and reference standard procedure.
Participants
Women participating in a cervical cancer screening programme who were not being followed up for previous cytological abnormalities. The study population could not be part of a case‐control design (with a predetermined proportion of known disease positives to known disease negatives). Rather, women had to form a consecutive series; they had to be recruited as a single group with their disease status being unknown at the time of recruitment. The women had to be close to or within the age range suitable for cervical screening according to international guidelines (20 to 70 years).
Index tests
Only HPV tests that are still currently used in clinical research practice were considered. These are:
-
HC2 or newer improved signal amplification methods;
-
PCR using the following primers GP5+/GP6+, MY09/11, SPF10, or CPI/II;
-
Aptima (HPV E6/E7 mRNA testing);
-
other techniques that were identified during the search process.
For the HC2 method we considered two thresholds for the definition of a positive result: 1 pg/mL and 2 pg/mL; and for the other techniques the threshold used by the researchers.
Comparator tests
For conventional cytology or liquid‐based cytology we considered two thresholds that define an abnormal Pap smear: ASCUS or worse, and LSIL or worse (Solomon 2002). In studies where the cytology was reported in other systems (that is the BSCC terminology or the Second Munich Cytological Classification) we converted the results to the nearest equivalent in the Bethesda system (Solomon 2002). We considered the borderline category of the BSCC and the Pap IIw category of the Munich classification as equivalent to the ASC‐US category. We considered the mild dyskaryosis category of the BSCC and the Pap IIID category of the Munich classification as equivalent to the LSIL category.
Target conditions
The target condition was high grade CIN 2 or worse. Some studies used the threshold of CIN 3. We included these in the review but analysed them separately.
Reference standards
As a reference standard, we used the combination of colposcopy and histology. If colposcopy was normal, we did not require a histologic result for proof of absence of disease. If colposcopy was abnormal and a biopsy was taken, then we used the histologic result as the reference standard. We assumed that the histologic examination of material obtained by colposcopy‐directed biopsy, loop excision or endocervical curettage provided complete assessment of the considered disease status.
Colposcopy as a reference standard is a subjective examination and has low sensitivity for the detection of small CIN 3 lesions (Jeronimo 2006). On the other hand its performance in quality‐assured settings is not at all insensitive for clinically important CIN 3. The ideal reference standard for the evaluation of a cervical screening test would be the excision of the whole transformation zone and its subsequent histopathological examination. Given that such a procedure in healthy women is ethically unjustifiable, due to its morbidity, studies have to rely on colposcopy with directed biopsies even with its limitations.
In this review we included studies where the reference standard was used in one of three ways:
-
applied to all women;
-
applied to all women with a positive screening test and to a random sample of screen‐negative women in order to correct for verification bias;
-
restricted to those with a positive screening test.
This last category of studies is prone to verification bias if the double test negatives are considered to be true negatives. However, verification bias will be limited when one of the screen tests is very sensitive. These studies can produce unbiased estimates of relative sensitivity and relative false positive rates (Arbyn 2009a; Schatzkin 1987).
Search methods for identification of studies
Electronic searches
We performed a systematic literature search of articles (1992 to November 2015) that contained quantitative data. We started our search from 1992 because HPV testing for clinical use was not introduced until a few years later.
We retrieved articles from the electronic bibliographic databases:
-
MEDLINE, through PubMed (January 1992 to November 2015);
-
Embase (January 1992 to November 2015).
The search strategies for MEDLINE and Embase are given in Appendix 1. The service provider that we used to access Embase was Ovid. We used studies that we had identified as relevant as seeds in Scopus to identify articles citing the relevant studies, and used the 'related articles' feature in PubMed, to retrieve articles which were similar in terms of keywords and database subject headings to the original included studies.
The search was restricted to articles written in the English language.
Searching other resources
We checked the reference lists of articles identified as relevant for additional relevant articles, and the reference lists of these were in turn checked for relevance. We contacted authors of relevant articles in order to obtain missing data.
Data collection and analysis
Selection of studies
One review author (GK) assessed the titles and abstracts from the literature search to determine whether they met the eligibility criteria. If there was any doubt we retrieved the full text of the article. Another review author (PMH) then reviewed the search results and the articles detected by the first review author in order to increase the specificity of the search. For any disagreements the third review author (MA) was consulted. The selection process was not blind (that is the names of the authors and institutions were not concealed). A list of the excluded studies is provided including the reasons for exclusion (Characteristics of excluded studies).
Data extraction and management
One review author (GK) collected data on the following using an electronic data collection form:
-
study design;
-
number of participants;
-
age range of participants;
-
threshold for the definition of a positive screening result;
-
index and comparator tests;
-
method used as reference standard;
-
threshold used for the definition of disease (e.g. CIN 2+, or CIN 3+);
-
the number of true positives, false positives, true negatives, and false negatives in a 2 x 2 table completed for each screening test used in each study.
A second review author (PMH) double‐checked the electronic data collection form.
Assessment of methodological quality
To assess the methodological quality of the included studies, two review authors (GK, PMH) used the 'Quality Assessment of Diagnostic test Accuracy Studies (QUADAS) tool (Whiting 2003). The results for each study are presented in table form. The application of QUADAS items to the current review is explained in Appendix 2.
Statistical analysis and data synthesis
We extracted the numbers of true positives, false negatives, false positives and true negatives defined at the considered thresholds from each study. We calculated the absolute and relative sensitivities and the specificities of the tests for the detection of CIN 2+ and CIN 3+ at various thresholds and we computed sensitivity (TP/(TP + TN) and specificity (TN/ (TN + FP) separately for each test. Relative sensitivity and specificity of one test compared to another test were defined as sensitivity of test‐1 over sensitivity of test‐2 and specificity of test‐1 over specificity of test‐2, respectively.
We used a bivariate random‐effects model analysis (BRMA) as has been described by Chu 2006 and Reitsma 2005. The BRMA preserves the two‐dimensional nature of the original data. It allows the meta‐analyst to take into account the within‐ and between‐study variability and the intrinsic correlation between sensitivity and specificity. When there were only three studies, a reduced BRMA model with zero covariance component was fitted (univariate random‐effects model; URMA). When there were only two studies, we further reduced the BRMA by excluding the random‐effects to a univariate fixed‐effects model (UFMA). The BRMA, URMA and UFMA were all programmed and fitted using SAS PROC NLMIXED in SAS 9.4 (SAS 9.4; Takwoingi 2010). We performed direct comparison, comparing two tests, by including one test as a covariate in the BRMA model. We first derived the relative measures from the parameters of the models in the log scale and later exponentiated. Using STATA 14 (STATA 14), the binomial distribution using the cii command was used to compute the exact confidence intervals when there was only one study. The standard errors for the log relative sensitivity and specificity were obtained using the delta method, which was internally implemented in SAS. For one study, the asymptotic standard error of the log relative sensitivity and specificity was computed in STATA 14. The resulting 95% Wald confidence intervals for the log relative sensitivity and specificity were subsequently exponentiated to yield relative accuracy measures within the 0 to infinity range.
Given that heterogeneity is likely to be present in many meta‐analyses, we considered that a mixed model that uses all of the available data seemed preferable to conducting multiple analyses on subsets of the data using a range of statistical methods. In particular, in the studies where a random sample of test negatives was verified (Reference standards category 2) we did not put the 2 x 2 data directly into Review Manager 5 (RevMan 5) but first calculated the adjusted number of screening test true and false positives and negatives given the proportion of the verified population (RevMan 2014).
Investigations of heterogeneity
For investigation of the sources of heterogeneity, we performed multiple BRMA regressions, each one including one covariate. The covariates that we considered for such analyses were the geographical location where the study was conducted (continent or sub‐continent), the age limits of the study population, the number of HPV types that the HPV test detects, and the likelihood of verification bias.
The possible effect of some other important possible quality‐related variables that could cause heterogeneity, such as the type of cytology (liquid‐based or conventional), the type of HPV testing (HC2 or PCR), and the positivity thresholds was avoided by considering conventional cytology, LBC, HC2, PCR at different thresholds as separate tests.
Sensitivity analyses
We performed a separate analysis on the accuracy of HPV testing in women over 30 years of age. Studies where the population was strictly over 30 years of age were included in this analysis. This age group was selected as the likelihood of persistent HPV infection and subsequent development of (pre‐cancer) is substantially higher in women older than 30.
Results
Results of the search
Total hits from MEDLINE: 9387
Total hits from Embase: 9934
The PRISMA flow chart with details of the results of the search, the exclusions and the inclusions is given in Figure 1 (Moher 2009).
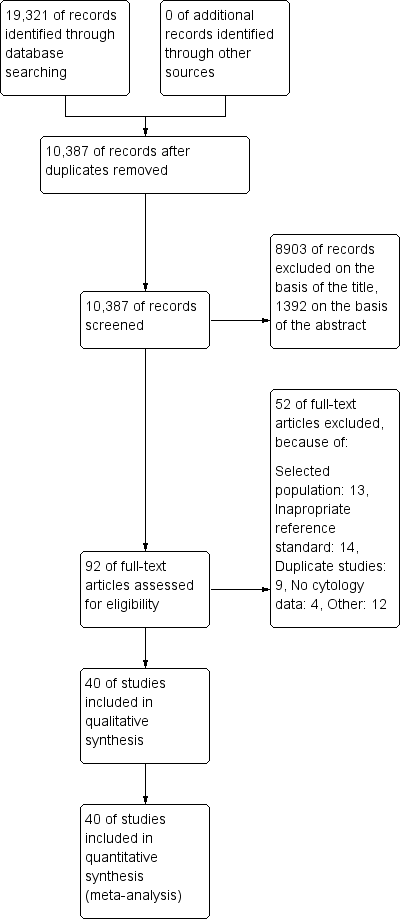
Study flow diagram detailing the number of the initially retrieved articles and consequent exclusions
Ultimately 40 studies were included in this systematic review, which used the following tests.
-
Conventional cytology was used in 22 studies
-
Liquid‐based cytology in 20 studies
-
HC2 for HPV DNA testing was used in 27 studies
-
HC2+4 for HPV DNA testing (an expanded version of HC2 that tests for 4 additional HPV types) in one study
-
PCR for HPV DNA testing in 10 studies
-
The Cobas HPV DNA test in two studies
-
The Care HPV DNA test in two studies
-
The SNIPER HPV DNA test in one study
-
The NASBA HPV E6/E7 mRNA test in one study
-
The Aptima HPV E6/E7 mRNA test in four studies
Regarding the geographical location of the studies, 18 studies took place in European countries, three studies were in Africa, four studies in Central and South America, 10 studies in Asia (China and India), two studies in the Pacific, and three studies in North America. The earliest study was published in 1995, with the majority of the studies published between 2002 and 2011.
Methodological quality of included studies
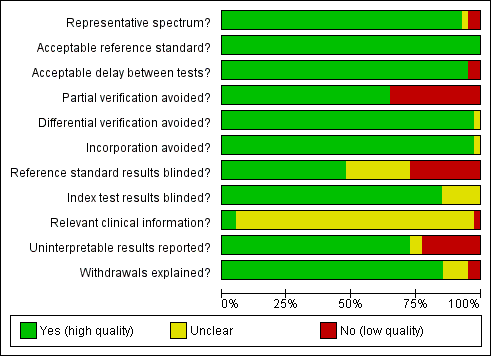
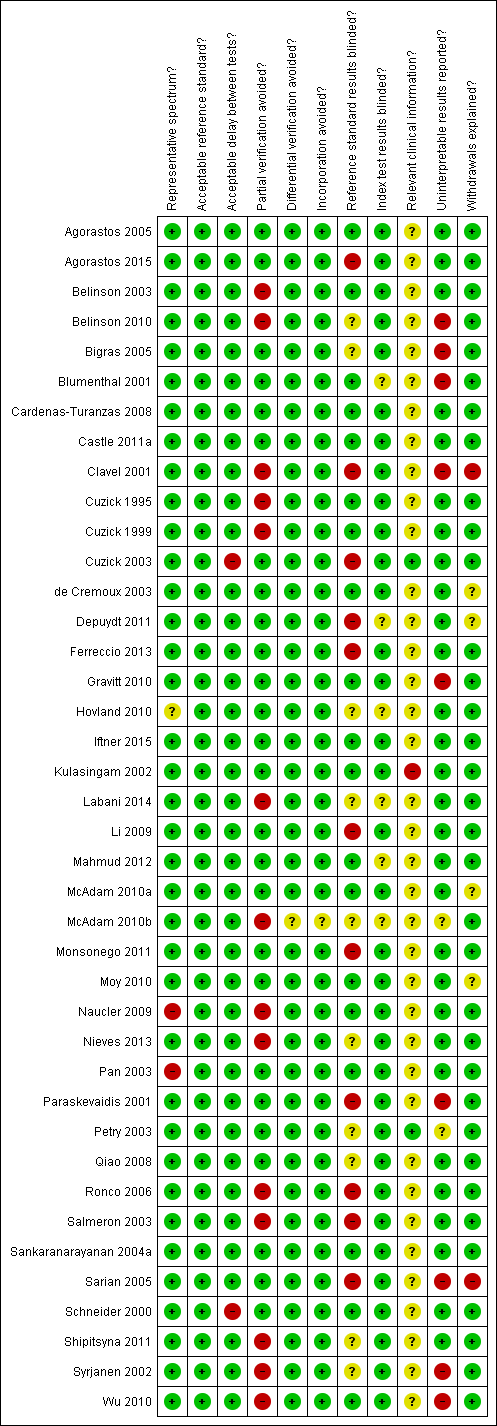
A description of each QUADAS item is given in Appendix 2. The first QUADAS item was answered 'yes' (i.e. the tests are done on a random sample of women within the cervical screening age range (20 to 70 years) not being followed up for cervical abnormalities) in 37 of the 40 studies. An appropriate reference standard (QUADAS 3) was used in all studies (colposcopy with directed biopsies as minimum). The fourth QUADAS item (i.e. the total interval between cytology, HPV testing and verification with the reference standard was less than 12 weeks) was answered 'yes' in 38 of the40 studies, the fifth (i.e. all women or at least a random sample of all women tested with cytology or HPV testing had disease status verification by the reference standard) in 26 of the 40 studies, the sixth (i.e. all women who had disease status verification, had this done by the same method) in 39 of the 40 studies, the seventh (i.e. the reference standard used for disease status verification is not composed in any part by cervical cytology or HPV testing) in 39 of the 40 studies, the tenth (i.e. the cytologists and the technicians interpreting the Pap smear and the HPV test were not aware of the colposcopy/biopsy results) in 19 of the 40 studies, the eleventh (i.e. the colposcopists and the pathologists were not aware of the cytology and HPV test results when interpreting the results of the reference standard) in 34 of the 40 studies, the twelfth (i.e. the cytologist was aware of the woman's basic history) in 2 of the 40 studies (this item was scored yes only if it was explicitly stated in the study that the cytologists were given the relevant information about each woman), the thirteenth (i.e. the numbers of inadequate cytology and HPV test results are given) in 29 of the 40 studies, and the fourteenth (i.e. it is clear what happened to all participants who entered the study including the withdrawals) in 34 of the 40 studies.
The criteria that were the hardest to be scored as 'yes' in this meta‐analysis were the fifth, the tenth, the twelfth and the thirteenth. The fifth criterion (was partial verification avoided?) was answered 'no' in 14 studies that applied the reference standard (colposcopy) only to women with a positive screening test (Belinson 2003; Belinson 2010; Clavel 2001; Cuzick 1995; Cuzick 1999; Labani 2014; McAdam 2010b; Naucler 2009, Nieves 2013; Ronco 2006, Salmeron 2003; Shipitsyna 2011; Syrjanen 2002; Wu 2010). The tenth criterion (were the reference standard results blinded?) was answered 'no' in 11 studies where colposcopists were aware of the cytology or the HPV test results, and 'unclear' in 10 studies where there was no specific mention in the paper. The twelfth criterion (relevant clinical information given to the people reporting the screening test?) was answered as 'unclear' in 38 studies, as most papers did not clarify whether the cytologists were given the routine information required for the reporting of a Pap smear (last menstrual period, relevant smear history, age etc). The thirteenth criterion (were un interpretable results reported?) was answered as 'no' or 'unclear' in 11 studies where there was no mention on the numbers of inadequate smears and invalid HPV assays Figure 2. There were 23 studies with two or fewer items answered 'no' or 'unclear' (Agorastos 2005; Agorastos 2015; Belinson 2003; Cardenas‐Turanzas 2008; Castle 2011a; Cuzick 1995; Cuzick 1999; Cuzick 2003; de Cremoux 2003; Ferreccio 2013; Gravitt 2010; Iftner 2015; Mahmud 2012; McAdam 2010a; Monsonego 2011; Kulasingam 2002; Li 2009; Moy 2010; Pan 2003; Petry 2003; Qiao 2008; Sankaranarayanan 2004a; Schneider 2000). On the other hand there seven studies with more than three items answered 'no' or unclear (Clavel 2001; Depuydt 2011; Hovland 2010; Labani 2014; McAdam 2010b; Sarian 2005; Syrjanen 2002) (Figure 3). Overall the impression of the reviewers was that there was an adequate number of good quality studies for the completion of this meta‐analysis. Two issues that reduced the quality of many studies were the issue of verification bias (QUADAS 5) and the issue of the blinding of the reference standard. The first was addressed in a sensitivity analysis

Methodological quality graph: review authors' judgements about each methodological quality item presented as percentages across all included studies

Methodological quality summary: review authors' judgements about each methodological quality item for each included study
Findings
Cervical cytology
Conventional cytology (CC) at the threshold of ASCUS+ for the detection of CIN 2+ and CIN 3+
There were 16 cross‐sectional studies assessing CC for the detection of CIN 2+ (Data table 1) with 61,099 participants. Nine studies were conducted in Europe, two in Africa, two in Asia, one in North America, and two in Central and South America. Seven studies were undertaken in a population aged strictly over 30 years. The median sample size was 2256 (range 305 to 10,358) and the median prevalence of CIN 2+ was 1.66% (range 0.3% to 4.9%). The earliest study was published in 1995, with the majority published between 2003 and 2010.
There were nine cross‐sectional studies assessing CC using the threshold of CIN 3+ (Data table 2) with 51,857 participants. Four studies were conducted in Europe, two in Asia, one in Africa and two in Central and South America. Six studies were undertaken in a population aged strictly over 30 years. The median sample size was 6194 (range 1386 to 10,358) and the median prevalence of CIN 3+ was 0.8% (range 0.2% to 1.5%) The earliest study was published in 1999, with the majority published between 2003 and 2010.
Sensitivity of CC ranged from 43% to 96% (pooled 65.9% (95% CI 54.9 to 75.3)) for the outcome CIN 2+ and from 39% to 85% (pooled 70.3% (95% CI 57.9 to 80.3)) for the outcome CIN 3+. The specificity ranged from 86% to 98% (pooled 96.3% (95% CI 94.7 to 97.4)) for CIN 2+ and 85% to 98% (pooled 96.7% (95% CI 94.6 to 98.0)) for CIN 3+ Table 1.
| Test | Disease threshold | studies | Pooled sensitivity (95% CI) | Pooled specificity (95% CI) |
| CC (ASCUS+) | CIN 2+ | 16 | 65.87% (54.94 to 75.33) | 96.28% (94.72 to 97.39) |
| LBC (ASCUS+) | CIN 2+ | 15 | 75.51% (66.57 to 82.68) | 91.85% (88.43 to 94.32) |
| CC (LSIL+) | CIN 2+ | 9 | 62.84% (46.79‐76.50) | 97.73% (96.09‐98.70) |
| LBC (LSIL+) | CIN 2+ | 10 | 70.33% (59.73 to 79.11) | 96.20% (94.57 to 97.36) |
| HC2 (1 pg/mL) | CIN 2+ | 25 | 92.60% (99.45 to 95.30) | 89.30% (87.03 to 91.20) |
| PCR (> 12 types) | CIN 2+ | 6 | 95.13% (89.50 to 97.84) | 91.89% (83.79 to 96.13) |
| APTIMA | CIN 2+ | 3 | 92.66% (31.77 to 99.71) | 93.31% (47.30 to 99.54) |
| CC (ASCUS+) | CIN 3+ | 9 | 70.27% (57.87 to 80.30) | 96.67% (94.56 to 98.00) |
| LBC (ASCUS+) | CIN 3+ | 13 | 75.97% (64.72 to 84.49) | 91.19% (87.21 to 94.01) |
| CC (LSIL+) | CIN 3+ | 5 | 74.43% (67.81 to 80.10) | 96.86% (94.87 to 98.10) |
| LBC (LSIL+) | CIN 3+ | 5 | 71.91% (51.68 to 86.00) | 96.05% (93.53 to 97.60) |
| HC2 (1 pg/mL) | CIN 3+ | 19 | 96.50% (94.00 to 97.90) | 89.20% (86.70 to 91.30) |
| PCR (> 12 types) | CIN 3+ | 4 | 93.57% (69.90 to 98.91) | 86.49% (68.16 to 95.04) |
| APTIMA | CIN 3+ | 4 | 96.04% (72.91 to 99.54) | 92.80% (86.15 to 96.39) |
Tests with fewer than three studies are not included in the table.
CC at the threshold of LSIL+ for the detection of CIN 2+ and CIN 3+
There were nine cross‐sectional studies assessing CC for the detection of CIN 2+ (Data table 3) with 41,494 overall participants. Four studies were conducted in Europe, three in Africa, one in Asia, and one in Central and South America. Three studies were undertaken in a population aged strictly over 30 years. The median sample size was 2199 (range 305 to 10,591) and the median prevalence of CIN 2+ was 2% (range 0.8% to 9.5%). The earliest study was published in 2001, with the majority published between 2004 and 2011.
There were five cross‐sectional studies assessing CC using the threshold of CIN 3+ (Data table 4) with 35,648 overall participants. Two studies were conducted in Europe, one in Asia, one in Africa and one in Central and South America. Two studies were undertaken in a population aged strictly over 30 years. The median sample size was 10,138 (range 1386 to 10,591) and the median prevalence of CIN 3+ was 1% (range 0.7% to 1.5%). The earliest study was published in 2002, with the majority published between 2002 and 2005.
Sensitivities of the tests ranged from 18% to 89% (pooled 62.8%, 95% CI 46.8% to 76.5%) and 64% to 80% (pooled 74.4%, 95% CI 67.8% to 80.1%). Specificities ranged from 92% to 100% (pooled 97.7%, 95% CI 96.1% to 98.7%) and 95% to 98% (pooled 96.9%, 95 % CI 94.9% to 98.1%) for the detection of CIN 2+ and CIN 3+, respectively.
Liquid‐based cytology (LBC) at the threshold of ASCUS+ for the detection of CIN 2+ and CIN 3+
There were 15 cross‐sectional studies assessing LBC for the detection of CIN 2+ (Data table 5) with 82,003 overall participants. Seven studies were conducted in Europe, one in Africa, six in Asia, and one in North America. Five studies were undertaken in a population aged strictly over 30 years. The median sample size was 3843 (range 301 to 16,516) and the median prevalence of CIN 2+ was 2.3% (range 0.4% to 5%). The earliest study was published in 2001, with the majority published between 2006 and 2011.
There were 13 cross‐sectional studies assessing LBC using the threshold of CIN 3+ (Data table 6) with 71,919 overall participants. Five studies were conducted in Europe, five in Asia, one in Central and South America and one in North America. Five studies were undertaken in a population aged strictly over 30 years. The median sample size was 3843 (range 979 to 16,516) and the median prevalence of CIN 3+ was 0.9% (range 0.2% to 3.5%). The earliest study was published in 2002, with the majority published between 2009 and 2011.
Sensitivities of the tests ranged from 52% to 94% (pooled 75.5%, 95% CI 66.6% to 82.7%) and 52% to 98% (pooled 76.0%, 95% CI 64.7% to 84.5%) for the detection of CIN 2+ and CIN 3+ respectively. Specificities ranged from 73% to 97% (pooled 91.9%, 95% CI 90.1% to 90.5%) for detection of CIN 2+ and from 73% to 97% (pooled 91.2%, 95% CI 90.1 to 90.5%) for CIN 3+.
LBC at the threshold of LSIL+ for the detection of CIN 2+ and CIN 3+
There were 10 cross‐sectional studies assessing LBC for the detection of CIN 2+ (Data table 7) with 33,519 overall participants. Three studies were conducted in Europe, one in Africa, four in Asia, and two in Oceania and Pacific. Six studies were undertaken in a population aged strictly over 30 years. The median sample size was 2475 (range 301 to 9451) and the median prevalence of CIN 2+ was 3.6% (range 1% to 5.3%). The earliest study was published in 2003, with the majority published between 2009 and 2011.
There were five cross‐sectional studies assessing LBC using the threshold of CIN 3+ (Data table 8) with 21,166 overall participants. Three studies were conducted in Europe, and two in Asia. Three studies were undertaken in a population aged strictly over 30 years. The median sample size was 2905 (range 1993 to 9451) and the median prevalence of CIN 3+ was 0.9% (range 0.4% to 2.2%). The earliest study was published in 2003, with the majority published between 2008 and 2011.
Sensitivities of the tests ranged from 42% to 87% (pooled 70.3%, 95% CI 59.7% to 79.1%) and 48% to 93% (pooled 71.9%, 95% CI 61.2% to 76%). Specificities ranged from 90% to 98% (pooled 96.2%, 95% CI 94.6% to 97.4%) and 92% to 98% (pooled 96.1%, 95% CI 93.5% to 97.6%) for the detection of CIN 2+ and CIN 3+, respectively.
HPV testing
Hybrid capture II (HC2) at the threshold of 1 pg/mL for the detection of CIN 2+ and CIN 3+
There were 25 cross‐sectional studies assessing HC2 for the detection of CIN 2+ (Data table 9) with 138,230 overall participants. Nine studies were conducted in Europe, two in Africa, eight in Asia, one in North America, two in Oceania and Pacific, and three in Central and South America. Thirteen studies were undertaken in a population aged strictly over 30 years. The median sample size was 4195 (range 491 to 16,410) and the median prevalence of CIN 2+ was 1.8% (range 0.5 to 10.1%). The earliest study was published in 2001, with the majority published between 2001 and 2008.
There were 19 cross‐sectional studies assessing HC2 for the detection of CIN 3+ (Data table 10) with 120,380 overall participants. Seven studies were conducted in Europe, seven in Asia, one in Africa and four in Central and South America. Nine studies were undertaken in a population aged strictly over 30 years. The median sample size was 4429 (range 1352 to 16,410) and the median prevalence of CIN 3+ was 0.8% (range 0.2% to 2.2%). The earliest study was published in 2002, with the majority published between 2002 and 2008.
Sensitivities of the tests ranged from 61% to 100% (pooled 92.6%, 95% CI 89.6% to 95.3%) and 81% to 100% (pooled 96.5%, 95% CI 94% to 97.9%). Specificities ranged from 64% to 95% (pooled 89.3%, 95% CI 87% to 91.2%) and 69% to 95% (pooled 89.2%, 95% CI 86.7% to 91.3%) for the detection of CIN 2+ and CIN 3+, respectively.
HC2 at the threshold of 2 pg/mL for the detection of CIN 2+ and CIN 3+
Only two cross‐sectional studies reported diagnostic data on HC2 at the threshold of 2 pg/mL for the detection of CIN 2+ (Data table 11) and CIN 3+ (Data table 12) with 26,768 overall participants. Sensitivity was 96% in both studies for the detection of CIN 2+ and specificity was similar at 94% and 95%. The sensitivity and specificity when HC2 was assessed at the threshold of 2 pg/mL for the detection of CIN 3+ was nearly identical to the test for detection of CIN 2+ (sensitivity was 95% and 96% in the two studies and specificity was 94% and 95%).
Polymerase chain reaction (PCR) for 13 high‐risk types or more (16, 18, 31, 33, 35, 39, 45, 51, 52, 56, 58, 59, 66, 68) for the detection of CIN 2+ and CIN 3+
There were six cross‐sectional studies assessing PCR for 13 high‐risk types for the detection of CIN 2+ (Data table 13) with 16,343 overall participants. Four studies were conducted in Europe, one in Africa, and one in Asia. Two studies were undertaken in a population aged strictly over 30 years. The median sample size was 2100 (range 313 to 6089) and the median prevalence of CIN 2+ was 2% (range 0.3% to 5%). The earliest study was published in 2000, with the majority published between 2009 and 2011.
There were four cross‐sectional studies assessing PCR for 13 high‐risk types for the detection of CIN 3+ (Data table 14) with 14,048 overall participants. Two studies were conducted in Europe, one in Asia, and one in North America. Two studies were undertaken in a population aged strictly over 30 years. The median sample size was 3490 (range 979 to 6089) and the median prevalence of CIN 3+ was 1.3% (range 0.8% to 3.3%). The earliest study was published in 2002, with the majority published between 2009 and 2011.
Sensitivities of the tests ranged from 75% to 100% and 88% to 100%, specificities from 85% to 97% and 79% to 94% for the detection of CIN 2+ and CIN 3+, respectively.
PCR for 10 to 11 high‐risk types for the detection of CIN 2+ and CIN 3+
Only two cross‐sectional studies reported diagnostic data on PCR for 10 to 11 high‐risk types for the detection of CIN 2+ (Data table 15) with 3964 overall participants, and just one study for CIN 3+ (Data table 16). Sensitivity was 74% and 89% in both studies for the detection of CIN 2+ and specificity was 95% and 79%. The sensitivity and specificity for the detection of CIN 3+ was 79% and 95%, respectively.
Aptima (HPV E6/7 mRNA testing) for the detection of CIN 2+ and CIN 3+
Three cross‐sectional studies reported diagnostic data on Aptima for the detection of CIN 2+ (Data table 17) with 15,895 overall participants and four reported data on CIN 3+ (Data table 18) with 17,944 overall participants. Sensitivity range was 91% to 100% (pooled 92.7%, 95% CI 31.7% to 99.7%) for the detection of CIN 2+ and 93% to 100% (pooled 96%, 95% CI 72.9% to 99.5%) for the detection of CIN 3+. Specificity range for CIN 2+ was 91% to 97% (pooled 93.3%, 95% CI 47.3% to 99.5%) and for CIN 3+ 90% to 96% (pooled 92.8%, 95% CI 86.2% to 96.3%).
Cobas HPV test
Two cross‐sectional studies reported diagnostic data on Cobas for the detection of CIN 2+ Data table 24 and CIN 3+ Data table 25 with 11,666 overall participants. Sensitivity range for CIN 2+ was 88% to 100% and 92% to 100% for CIN 3+. Specificity range was 58% to 90% for CIN 2+ and 57% to 90% for CIN 3+.
Other tests
Only single studies reported diagnostic data on the following tests; PCR for four high‐risk types for CIN 2+ (Data table 19), care HPV test (0.5 pg/mL) for CIN 2+ (Data table 20) and CIN 3+ (Data table 21)), care HPV test (1 pg/mL) for CIN 2+ (Data table 22) and CIN 3+ (Data table 23), NASBA (five types (Data table 26) and nine types (Data table 27)) for CIN 2+ and HC2+4 (1 pg/mL) for CIN 2+ (Data table 28) and CIN 3+ (Data table 29). Of these single study tests, sensitivity was lowest (81%) in the NASBA (five types) for CIN 2+ and highest (94%) in the NASBA (nine types) for CIN 2+. Similarly, specificity was lowest (83%) in the care HPV test (0.5 pg/mL) for CIN 3+ and highest (97%) in the NASBA (five types) for CIN 2+.
Comparisons between cervical cytology and HPV testing for detection of CIN 2+ and CIN 3+
Comparisons could not be made for all tests, as the number of studies evaluating some of the test types were inadequate to provide stable ROC estimates (mainly analyses which included fewer than four studies). HPV testing for all or most high‐risk HPV types such as HC2 or certain PCR assays had higher pooled sensitivity for CIN 2+ or CIN 3+ than CC or LBC at any threshold (ASCUS or LSIL). The pooled sensitivity of LBC was higher than CC. Conversely HPV testing had lower pooled specificity than cytology at any threshold (ASCUS or LSIL), with the difference being more evident with CC rather than LBC. We did not compare tests when there were fewer than two studies presenting paired data Table 2.
| Comparison | Disease threshold | Relative sensitivity (95% CI) | Relative specificity (95% CI) | Studies | Analysis number |
| HC2 vs CC (ASCUS+) | CIN 2+ | 1.52 (1.24 to 1.86) | 0.94 (0.92 to 0.96) | 9 | 1 |
| HC2 vs CC (ASCUS+) | CIN 3+ | 1.46 (1.12 to 1.91) | 0.95 (0.93 to 0.9) | 6 | 2 |
| PCR (> 12 types) vs CC (ASCUS+) | CIN 2+ | 1.37 (0.58 to 3.21) | 0.95 (0.76 to 1.19) | 3 | 5 |
| HC2 vs CC (LSIL+) | CIN 2+ | 1.28 (1.15 to 1.41) | 0.91 (0.87 to 0.95) | 6 | 7 |
| HC2 vs CC (LSIL+) | CIN 3+ | 1.22 (1.12 to 1.32) | 0.91 (0.87 to 0.95) | 5 | 8 |
| HC2 vs LBC (ASCUS+) | CIN 2+ | 1.18 (1.10 to 1.26) | 0.96 (0.95 to 0.97) | 10 | 11 |
| HC2 vs LBC (ASCUS+) | CIN 3+ | 1.17 (1.05 to 1.30) | 0.96 (0.95 to 0.98) | 8 | 12 |
| PCR (> 12 types) vs LBC (ASCUS+) | CIN 2+ | 1.53 (0.53 to 4.44) | 0.90 (0.89 to 0.92) | 3 | 15 |
| PCR (> 12 types) vs LBC (ASCUS+) | CIN 3+ | 1.47 (0.64 to 3.35) | 0.94 (0.8 to 1.09) | 3 | 16 |
| HC2 vs LBC (LSIL+) | CIN 2+ | 1.35 (1.19 to 1.53) | 0.92 (0.89 to 0.95) | 8 | 17 |
| HC2 vs LBC (LSIL+) | CIN 3+ | 1.30 (0.86 to 1.96) | 0.92 (0.8 to 1.00) | 4 | 18 |
| APTIMA vs LBC (ASCUS+) | CIN 3+ | 1.30 (0.49 to 3.41) | 0.98 (0.93 to 1.04) | 3 | 22 |
Comparisons with fewer than three studies are not included in the table
When restricting the analysis only for studies with a population strictly over age 30, HC2 had slightly improved sensitivity and specificity for CIN 2+.
CC at cut‐off ASCUS versus HC2
There were nine studies comparing conventional cytology (ASCUS+) to HC2 (1 pg/mL) for the detection of CIN 2+ (Figure 4) and six studies for CIN 3+ (Figure 5). Only the Cuzick 2003 study examined the accuracy of conventional cytology (ASCUS+) versus HC2 (2 pg/mL) for detection of both CIN 2+ and CIN 3+.
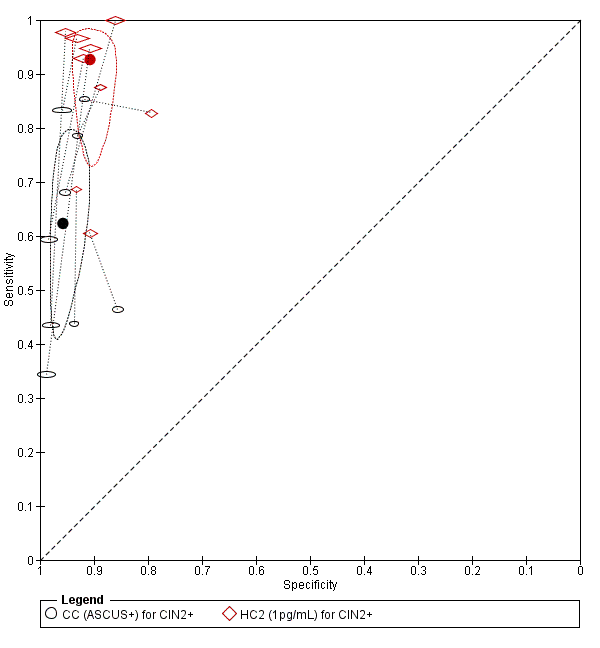
Summary ROC plot of 2 tests for detection of CIN 2+ (verified with histology): Conventional Cytology (ASCUS+) and HPV testing with hybrid capture 2 (1pg/mL). The black and red solid circles correspond to the summary estimates of sensitivity and specificity, and are shown with a 95% confidence region.

Summary ROC plot of 2 tests for detection of CIN 3+ (verified with histology): Conventional Cytology (CC) (ASCUS+) and HPV testing with hybrid capture (HC) 2 (1pg/mL). The black and red solid circles correspond to the summary estimates of sensitivity and specificity, and are shown with a 95% confidence region.
The HC2 test at the 1 pg/mL threshold appeared to be a better test than CC at the threshold of ASCUS (for CIN 2+) in terms of summary (S)ROC curve, and the meta‐analytic sensitivity was considerably lower than in the HC2 tests. However, the specificity was slightly higher in the CC ASCUS test compared to the HC2 tests.
The relative sensitivity of HC2 versus CC for CIN 2+ was 1.52 (95% CI: 1.24 to 1.86) and the relative specificity 0.94 (95% CI 0.92 to 0.96).The relative sensitivity of HC2 versus CC for CIN 3+ was 1.46 (95% CI 1.12 to 1.91) and the relative specificity 0.95 (95% CI 0.93 to 0.97).
CC ASCUS versus PCR (for more than 12 high‐risk types)
There were three studies comparing CC (ASCUS+) to PCR for the detection of CIN 2+ (Figure 5) and just one (Naucler 2009) for CIN 3+.
The PCR SROC curve for detection of CIN 2+ appeared to indicate a better test than CC (ASCUS+) but this was only based on three studies that offered paired data. The meta‐analytic sensitivity and specificity were reasonably high and the PCR test seemed to have better overall discrimination than the CC test. The specificity in the CC test was very high but sensitivity was too low to make this test acceptable based on the limited data available.
The relative sensitivity of PCR (more than 12 types) versus CC for CIN 2+ was 1.37 (95% CI 0.58 to 3.21) and the relative specificity was 0.95 (95% CI 0.76 to 1.19). The relative sensitivity of PCR (more than 12 types) versus CC for CIN 3+ was 1.30 (95% CI 1.09 to 1.54) and the relative specificity was 0.95 (95% CI 0.94 to 0.96).
CC LSIL versus HC2
There were six studies comparing conventional cytology (LSIL+) to HC2 (1 pg/mL) for the detection of CIN 2+ (Figure 6) and five studies for CIN 3+ (Figure 7). Only the Cuzick 2003 study examined the accuracy of CC (LSIL+) versus HC2 (2 pg/mL) for detection of CIN 2+. There were no studies reporting data with CIN 3+ outcome for this test comparison.

Summary ROC plot of 2 tests for detection of CIN 2+ (verified with histology): Conventional Cytology (CC) (LSIL+) and HPV testing with hybrid capture (HC) 2 (1pg/mL). The black and red solid circles correspond to the summary estimates of sensitivity and specificity, and are shown with a 95% confidence region.

Summary ROC plot of 2 tests for detection of CIN 3+ (verified with histology): Conventional Cytology (CC) (LSIL+) and HPV testing with hybrid capture (HC) (1pg/mL). The black and red solid circles correspond to the summary estimates of sensitivity and specificity, and are shown with a 95% confidence region.
The SROC curves show that both tests are not accurate at correctly classifying women with and without the disease. Although the meta‐analytic sensitivity was higher in the HC2 tests compared to the CC test, the specificity was considerably lower. Specificity was very high in the CC test but sensitivity was not at an acceptable level.
The relative sensitivity of HC2 versus CC for CIN 2+ was 1.28 (95% CI 1.15 to 1.41) and the relative specificity was 0.91 (95% CI 0.87 to 0.95).The relative sensitivity of HC2 versus CC for CIN 3+ was 1.22 (95% CI 1.12 to 1.32) and the relative specificity was 0.91 (95% CI 0.87 to 0.95).
CC LSIL versus PCR (for more than 12 high‐risk types)
There were two studies comparing CC (LSIL+) to PCR for the detection of CIN 2+ and none for CIN 3+. From the SROC the PCR test seemed far superior at detecting CIN 2+ compared to the CC test, but this was only based on two studies so it is difficult to draw any conclusions.
LBC ASCUS versus HC2
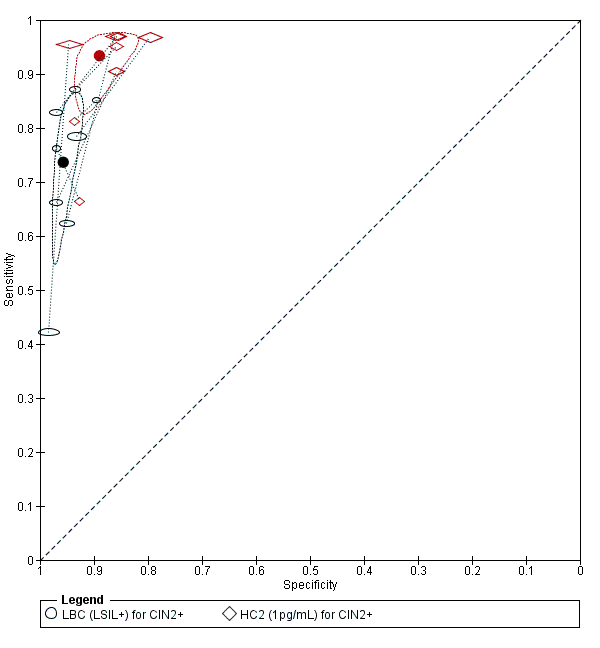
There were 10 studies comparing LBC (ASCUS+) to HC2 (1 pg/mL) for the detection of CIN 2+ (Figure 8) and seven studies for CIN 3+ (Figure 9). Only the Ronco 2006 study examined the accuracy of LBC (ASCUS+) versus HC2 (2 pg/mL) for detection of both CIN 2+ and CIN 3+.

Summary ROC plot of 2 tests for detection of CIN 2+ (verified with histology): Liquid Based Cytology (LBC) (ASCUS+) and HPV testing with hybrid capture (HC) 2 (1pg/mL). The black and red solid circles correspond to the summary estimates of sensitivity and specificity, and are shown with a 95% confidence region.

Summary ROC plot of 2 tests for detection of CIN 3+ (verified with histology): Liquid Based Cytology (LBC) (ASCUS+) and HPV testing with hybrid capture (HC) 2 (1pg/mL). The black and red solid circles correspond to the summary estimates of sensitivity and specificity, and are shown with a 95% confidence region.
The HC2 SROC curves at all thresholds appeared to represent good tests, whereas the LBC test at the threshold of ASCUS (for both CIN 2+ and CIN 3+) appeared inferior. The meta‐analytic sensitivity was considerably lower than in the HC2 tests whereas the specificity is not much lower in the HC2 test compared to LBC. The HC2 tests appeared to have better overall discrimination.
The relative sensitivity of HC2 versus LBC for CIN 2+ was 1.18 (95% CI 1.10 to 1.26) and the relative specificity was 0.96 (95% CI 0.95 to 0.97). The relative sensitivity of HC2 versus LBC for CIN 3+ was 1.17 (95% CI 1.07 to 1.28) and the relative specificity was 0.96 (95% CI 0.95 to 0.97).
LBC ASCUS versus PCR (for more than 12 high‐risk types)
There were three studies comparing LBC (ASCUS+) to PCR for the detection of CIN 2+ (Figure 10) and three for CIN 3+.
Summary ROC plot of 2 tests for detection of CIN 2+ (verified with histology): Liquid Based Cytology (LBC) (LSIL+) and HPV testing by hybrid capture (HC) 2 (1pg/mL). The black and red solid circles correspond to the summary estimates of sensitivity and specificity, and are shown with a 95% confidence region.
From the SROC the PCR test seemed superior at detecting CIN 2+ compared to the LBC test, but this was only based on two studies so it is difficult to draw any conclusions. The meta‐analytic sensitivity was very high for detection of CIN 2+ and CIN 3+ but specificity was much lower, based on these limited data. Sensitivity in the LBC test was very low.
The relative sensitivity of PCR (more than 12 types) versus LBC for CIN 2+ was 1.53 (95% CI 0.53 to 4.44) and the relative specificity was 0.90 (95% CI 0.82 to 0.99).The relative sensitivity of PCR (more than 12 types) versus LBC for CIN 3+ was 1.47 (95% CI 0.64 to 3.35) and the relative specificity was 0.94 (95% CI 0.80 to 1.09).
LBC LSIL versus HC2
There were eight studies comparing LBC (LSIL+) to HC2 (1 pg/mL) for the detection of CIN 2+ (Figure 9) and four studies for CIN 3+. No study examined the accuracy of LBC (LSIL+) versus HC2 (2 pg/mL) for detection of CIN 2+ or CIN 3+.
The HC2 SROC curves at all thresholds appeared very sensitive, but specificity was lower. The LBC tests at the threshold of LSIL (for both CIN 2+ and CIN 3+) appeared superior in specificity but sensitivity was too low. The HC2 test appeared to have better overall discrimination.
The relative sensitivity of HC2 versus LBC for CIN 2+ was 1.35 (95% CI 1.19 to 1.53) and the relative specificity was 0.92 (95% CI 0.89 to 0.95).The relative sensitivity of HC2 versus LBC for CIN 3+ was 1.30 (95% CI 0.49 to 1.96) and the relative specificity was 0.92 (95% CI 0.84 to 1.00).
LBC LSIL versus PCR (for more than 12 high‐risk types)
There were two studies comparing LBC (LSIL+) to PCR for the detection of CIN 2+ and one (Depuydt 2011) for CIN 3+.
From the SROC the PCR test seemed superior at detecting CIN 2+ compared to the LBC test, but this was only based on two studies so it is difficult to draw any conclusions.
LBC ASCUS versus APTIMA
There were three studies comparing LBC (ASCUS+) to APTIMA for the detection of CIN 3+.
The APTIMA test appeared to have superior sensitivity to LBC with similar specificity. The relative sensitivity of APTIMA versus LBC for CIN 3+ was 1.30 (95% CI 0.49 to 3.41) and the relative specificity was 0.98 (95% CI 0.93 to 1.04).
Investigations of heterogeneity
The influence of factors on the accuracy of HC2 (defined at cut‐off 1 pg/mL) for CIN 2+, and CIN 3+, assessed by bivariate random‐effects meta‐analyses with one covariate each time is shown in Table 3. The sensitivity was significantly higher in studies enrolling women older than 30 years than in studies enrolling women of any age: relative sensitivity of 1.13 (95% CI 1.03 to 1.25) and 1.10 (95% CI 1.02 to 1.19) for outcomes CIN 2+ and CIN 3+, respectively. The specificity was also higher in women older than 30 years, but the difference was only significant for the outcome CIN 3+ (relative specificity of 1.04, 95% CI 1.00 to 1.08.
| Comparison | Studies | Disease threshold | Relative sensitivity (95% CI) | Relative specificity (95% CI) |
| Age > 30 vs any age | 17 vs 20 | CIN 2+ | 1.13 (1.03 to 1.25) | 1.01 (0.98 to 1.04) |
| 13 vs 14 | CIN 3+ | 1.10 (1.02 to 1.19) | 1.04 (1.00 to 1.08) | |
| Increased vs low risk of verification bias | 17 vs 20 | CIN 2+ | 1.05 (0.95 to 1.16) | 1.00 (0.97 to 1.04) |
| 12 vs 15 | CIN 3+ | 1.09 (1.01 to 1.18) | 1.00 (0.96 to 1.05) | |
| High‐income vs middle‐/low‐income countries | 21 vs 16 | CIN 2+ | 1.01 (0.91 to 1.12) | 1.03 (1.00 to 1.07) |
| 13 vs 14 | CIN 3+ | 0.94 (0.87 to 1.02) | 1.01 (0.96 to 1.05) |
Assessed by bivariate random‐effects meta‐analysis including one covariate each time.
The sensitivity was higher in studies with high versus low risk for verification bias, but the difference was only significant for the outcome of CIN 3+ (relative sensitivity of 1.09, 95% CI 1.01 to 1.18). The specificity estimates were not affected by risk of verification bias.
To assess geographical effect, locations were recorded as high‐income (North‐America, Australia/New Zealnd, Europe) or middle‐ and low‐income (other countries). We could not identify any significant effects on accuracy estimates.
The effect of the number of HPV types targeted by the HPV assay could not be assessed for HC2, since this test always detects 13 high‐risk types. Also for other assays, insufficient data were available to assess the effect of the number of types by BRMA analyses.
Sensitivity analysis
The pooled sensitivity and specificity of HC2 at threshold of 1 pg/mL for CIN 2+ was 89.0% (95% CI 81.1% to 93.9%) and 88.6% (95% CI 84.2% to 91.9%), respectively, when the meta‐analysis included only the 11 studies where the reference standard was used on all women (Data table 28). The sensitivity and specificity of CC or LBC at cut‐off ASCUS+ for CIN 2+, pooled from nine studies (Data table 29), where all women were submitted to the reference standard, was 72.2% (95% CI 57.5% to 83.3%) and 93.6% (95% CI 88.9% to 96.4%).
When the meta‐analysis was restricted to 13 studies where only women of age 30 or older were enrolled (Data table 30), the pooled sensitivity of HC2 at 1 pg/mL for CIN 2+ was 93.9% (95% CI 89.3% to 96.6%), whereas the specificity for CIN 1 or below at the same cut‐off was 91.3% (95% CI 88.9% to 93.2%).
Influence of the number of types targeted by HPV assays is included in the results by HPV test (see above). HC2 always included 13 high‐risk types, APTIMA and Cobas 4800 always included 14 types. Several distinct PCR‐based assays were used targeting different high‐risk HPV types: four high‐risk HPV types in one study (Cuzick 1995), 10‐11 high‐risk HPV types in two studies (Cuzick 1999, Paraskevaidis 2001) and 13 or more HPV types in six studies (Data table 13). All these PCR systems were distinct assays, so the effect of the choice and number of high‐risk HPV types could not be assessed separately from the test platform. Only for the NASBA test did we retrieve one study where the same assay targeted five types (HPV16, 18, 31, 33 and 45) or nine types (the same five types plus HPV35, 51, 52 and 58). The sensitivities were 13/16 (81%) and 15/16 (94%) and the specificities were 287/297 (97%) and 279/297 (84%), respectively.
Discussion
Summary of main results
We evaluated the accuracy of two cervical cancer screening methods: cervical cytology and HPV testing in a large body of clinical studies. We focused mainly on the sensitivity and the specificity of the tests. Predictive values depend on the local disease prevalence, and therefore generalisation of the results is usually of limited value.
The results show that the HC2 and the PCR (for more than 12 HPV types) have higher sensitivity than cytology even at the lowest cytological positivity threshold of ASCUS, showing that these HPV tests are less likely to miss CIN 2+ (and CIN 3+) than cytological tests. The specificity on the other hand is significantly higher for cytology at the threshold of LSIL than either for HC2 or PCR. Whilst the predictive value of a negative HPV test approached 100%, HPV tests are associated with more unnecessary referrals (for false positives) than cytological tests. The accuracy of the test depends on how well the test separates the group being tested into those with and without the disease in question. The HC2 tests appeared to have better overall discrimination. The same conclusion can be extrapolated for other methods of DNA testing for all or most high‐risk HPV types by PCR although there were fewer studies available for robust conclusions. The four studies that used E6 and E7 mRNA detection with APTIMA showed higher sensitivity and equivalent specificity to cytology.
There was large inter‐study variation in the sensitivity and specificity estimations of all screening tests. For cytology, this was partly expected because the reproducibility of the cytological interpretation of smears is often problematic (Stoler 2001). The sensitivity of cytology is exceptionally low in the German studies (Petry 2003; Schneider 2000), which raises concerns regarding the sampling technique and cytologic interpretation in these studies. In one of these studies (Petry 2003), the instrument used for sampling was a cotton‐tipped swab, which is not recommended, but this alone cannot explain the very low sensitivity of cytology. For PCR, the inter‐study variation could be explained by the different primers used and other variations in the technique between laboratories. For the HC2 method, however, the variation was surprising and was mainly caused by the low sensitivity of HPV testing, which was often observed in low‐ and middle‐income countries (Blumenthal 2001; Gravitt 2010; McAdam 2010a; McAdam 2010b; Sankaranarayanan 2004a). This could be attributed to the variable quality of verification procedures (Arbyn 2008; Arbyn 2009). In one particular study classified as low risk of bias, CC and HC2 are shown to have almost equal sensitivity (Sankaranarayanan 2004a). Possible explanations for the low HC2 sensitivity in our study could be contamination of the sample by acetic acid or Lugol’s iodine or deterioration of the sample because of exposure at high temperature. Contamination of the sample by acetic acid or Lugol’s iodine could normally not have occurred, since, according to the protocol, the sample for HC2 was collected before application of vinegar or iodine solution. Finally, misclassification of the outcome could also explain the low observed sensitivity of HC2. The policy of random biopsies, which was employed in some studies, might have increased the detection rate of lesions, although the value of random biopsies is disputed (Wentzensen 2015). The low pooled specificity of HC2, which was observed in studies conducted in Africa, is mainly due to the outlying specificity of one study (Blumenthal 2001).
It has been proposed that the specificity of HPV testing is age‐related and higher in older women, something that should be borne in mind when evaluating the cost‐effectiveness of HPV test screening. This was not confirmed by this meta‐analysis, which showed only a mild but not significant increase in sensitivity and specificity for the HC2 test in women over 30 years compared to the general population. However this particular analysis was not done on paired studies.
Strengths and weaknesses of the review
Strengths of the review
A relatively large number of studies fulfilling the inclusion criteria was identified. Many studies reported results for various cytologic, virologic and histologic thresholds. This enabled us to perform meta‐analyses for many of these thresholds. The studies had a wide geographical distribution with all continents being represented in more than one study, with the exception of Oceania. Most of the studies were of good methodological quality according to the QUADAS criteria. Also the design of concomitant testing of the subjects with both tests limited the risk of selection bias.
Limitations of the review
In most studies, the presence or absence of disease was not verified with colposcopy and histology in all women, leading to potential verification bias. It is likely that false‐negative results are missed for either test without adequate verification of test negatives. Theoretically this causes an overestimation of the sensitivity of the tests, but it should not affect the relative sensitivity (sensitivity ratio) or false‐positivity rate. The pooled sensitivity of HC2 was higher in the high‐risk‐of‐verification‐bias group but surprisingly, the pooled sensitivity of cytology was higher in the low‐risk group. This was mainly the effect of one study classified as low risk of bias where the two tests were shown to have almost equal sensitivity (Sankaranarayanan 2004a).
It is likely that the contrast between HPV testing and cytology was inflated by the inclusion of the two German studies, where cytology had very low sensitivity. In most studies colposcopists were aware of the screening test results, which could bias their colposcopic diagnosis and their decision to take a biopsy or not. Finally, the use of colposcopy or even punch biopsies as a gold standard can also be sub‐optimal as their performance is operator‐dependent (Stoler 2001) and could have influenced the findings of each study and subsequently these meta‐analyses.
The review included only studies in the English language. It was presumed that this would cover the vast majority of the existing studies on the subject. The thoroughness of the search would have otherwise been questionable. However, during the search process we did not identify any relevant studies in a non‐English language that were excluded solely because of it.
Applicability of findings to the review question
Our study was restricted to cross‐sectional outcomes such as sensitivity and specificity where the performance of one application of the screening tests is compared to a gold standard (colposcopy and histology). It is known that the precancerous lesions of the cervix take several years to progress to cancer. During this time, women are subjected to a number of cytological examinations. Therefore, even though it is likely, it cannot be argued that the superior cross‐sectional sensitivity of HPV testing will certainly mean superiority within an actual cervical screening setting. In addition, since CIN2–3 is potentially regressive, it has not yet been shown that HPV screening does more than just finding more small‐size lesions, which would clear without intervention. For this reason, high‐risk HPV‐based cervical cancer screening was not yet recommended in the second edition of the European Guidelines for Cervical Cancer Screening, considering evidence available in 2006 (Arbyn 2010).
In conclusion, this meta‐analysis has shown clearly that HC2 has a superior sensitivity to CC and LBC. However, the improved cross‐sectional accuracy does not guarantee a better performance in terms of reduction on the incidence of cervical cancer if the HPV test is implemented in primary screening. The longitudinal outcomes of the ongoing randomised studies should clarify this issue. In the meantime, data from the second screening round of RCTs, comparing cytology with HPV screening, have demonstrated a significant reduction of CIN 3+, and even of invasive cancer, among women in the first round who had a negative HPV test, compared to women in the control arm who had a negative Pap smear (Arbyn 2012; Ronco 2014).

Study flow diagram detailing the number of the initially retrieved articles and consequent exclusions
Methodological quality graph: review authors' judgements about each methodological quality item presented as percentages across all included studies
Methodological quality summary: review authors' judgements about each methodological quality item for each included study

Summary ROC plot of 2 tests for detection of CIN 2+ (verified with histology): Conventional Cytology (ASCUS+) and HPV testing with hybrid capture 2 (1pg/mL). The black and red solid circles correspond to the summary estimates of sensitivity and specificity, and are shown with a 95% confidence region.

Summary ROC plot of 2 tests for detection of CIN 3+ (verified with histology): Conventional Cytology (CC) (ASCUS+) and HPV testing with hybrid capture (HC) 2 (1pg/mL). The black and red solid circles correspond to the summary estimates of sensitivity and specificity, and are shown with a 95% confidence region.

Summary ROC plot of 2 tests for detection of CIN 2+ (verified with histology): Conventional Cytology (CC) (LSIL+) and HPV testing with hybrid capture (HC) 2 (1pg/mL). The black and red solid circles correspond to the summary estimates of sensitivity and specificity, and are shown with a 95% confidence region.
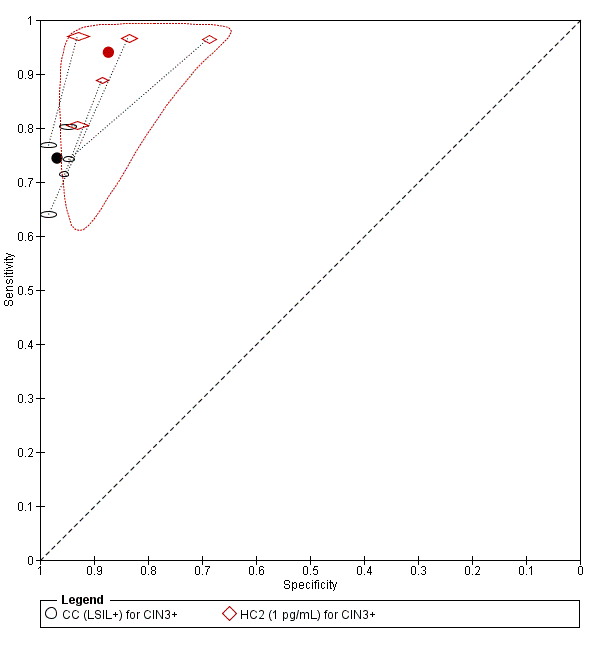
Summary ROC plot of 2 tests for detection of CIN 3+ (verified with histology): Conventional Cytology (CC) (LSIL+) and HPV testing with hybrid capture (HC) (1pg/mL). The black and red solid circles correspond to the summary estimates of sensitivity and specificity, and are shown with a 95% confidence region.

Summary ROC plot of 2 tests for detection of CIN 2+ (verified with histology): Liquid Based Cytology (LBC) (ASCUS+) and HPV testing with hybrid capture (HC) 2 (1pg/mL). The black and red solid circles correspond to the summary estimates of sensitivity and specificity, and are shown with a 95% confidence region.

Summary ROC plot of 2 tests for detection of CIN 3+ (verified with histology): Liquid Based Cytology (LBC) (ASCUS+) and HPV testing with hybrid capture (HC) 2 (1pg/mL). The black and red solid circles correspond to the summary estimates of sensitivity and specificity, and are shown with a 95% confidence region.

Summary ROC plot of 2 tests for detection of CIN 2+ (verified with histology): Liquid Based Cytology (LBC) (LSIL+) and HPV testing by hybrid capture (HC) 2 (1pg/mL). The black and red solid circles correspond to the summary estimates of sensitivity and specificity, and are shown with a 95% confidence region.

CC (ASCUS+) for CIN2+.
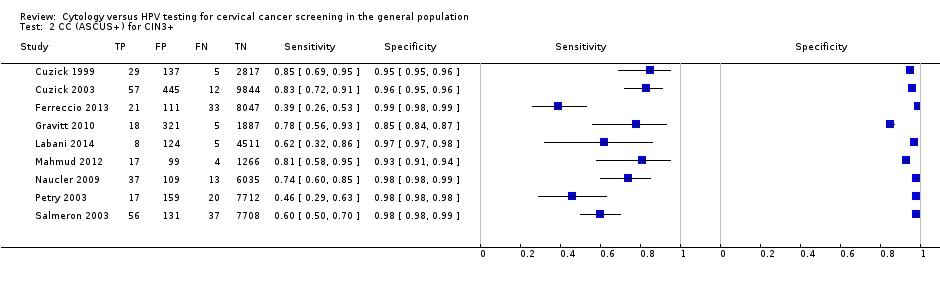
CC (ASCUS+) for CIN3+.
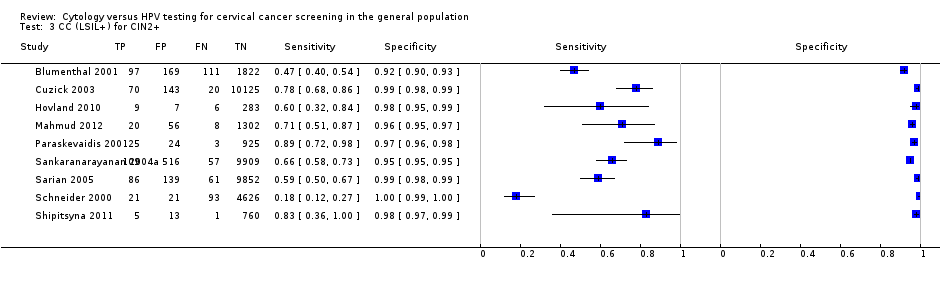
CC (LSIL+) for CIN2+.
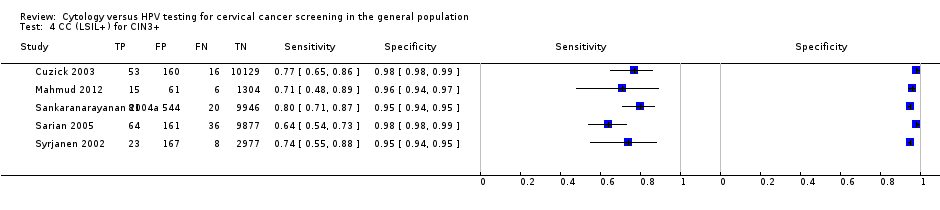
CC (LSIL+) for CIN3+.
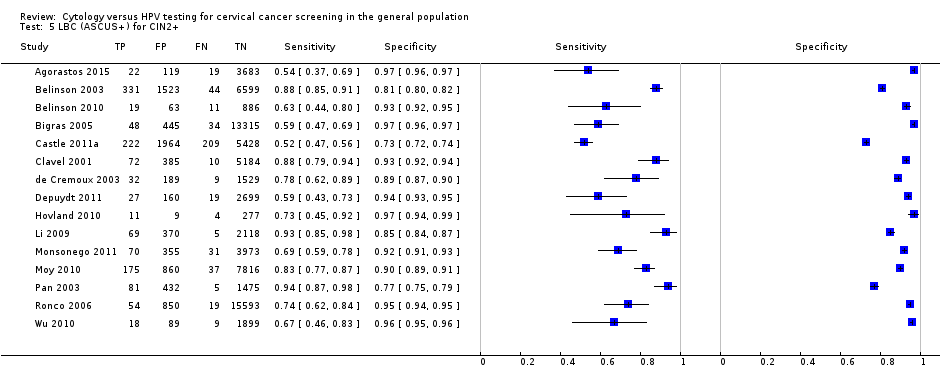
LBC (ASCUS+) for CIN2+.

LBC (ASCUS+) for CIN3+.
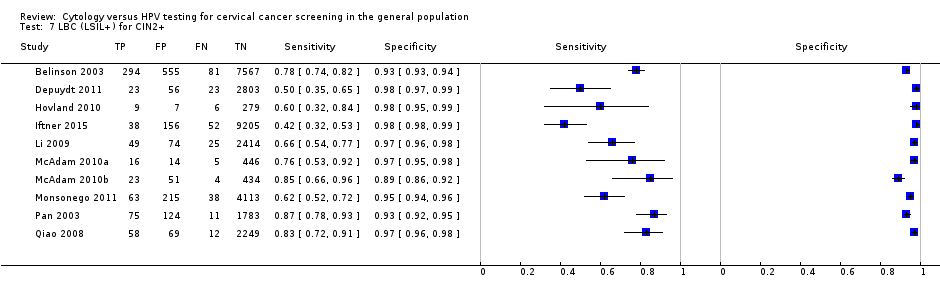
LBC (LSIL+) for CIN2+.
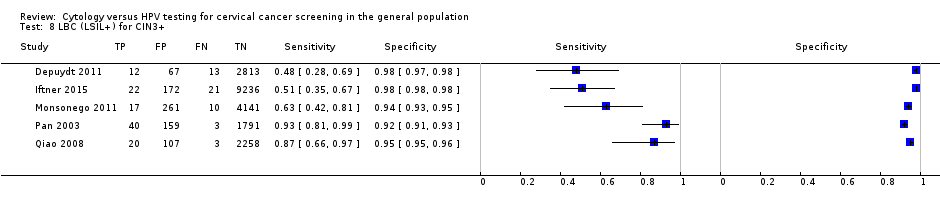
LBC (LSIL+) for CIN3+.

HC2 (1pg/mL) for CIN2+.

HC2 (1 pg/mL) for CIN3+.

HC2 (2 pg/mL) for CIN2+.

HC2 (2 pg/mL) for CIN3+.
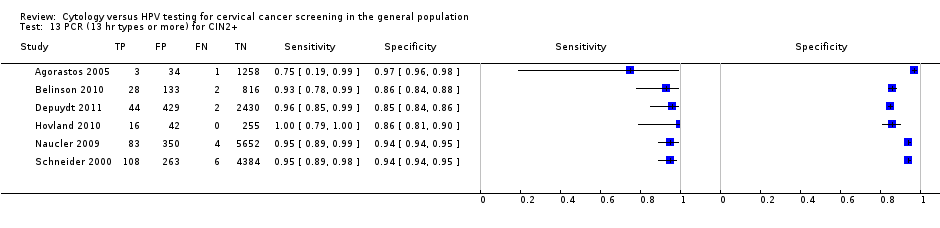
PCR (13 hr types or more) for CIN2+.
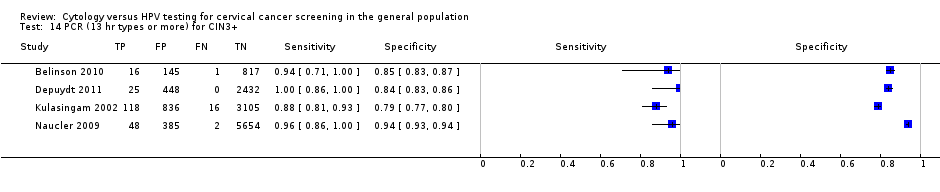
PCR (13 hr types or more) for CIN3+.

PCR (10‐11 hr types) for CIN2+.

PCR (10‐11 hr types) for CIN3+.

Aptima for CIN2+.
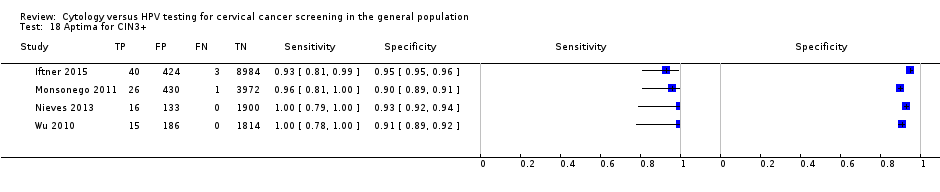
Aptima for CIN3+.

PCR (4 hr types) for CIN2+.
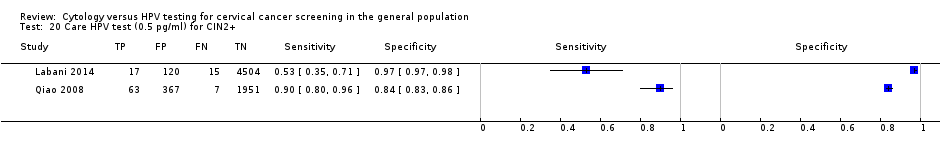
Care HPV test (0.5 pg/ml) for CIN2+.
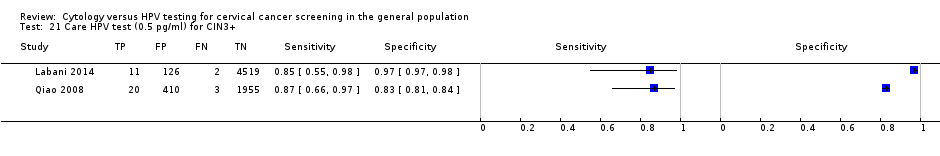
Care HPV test (0.5 pg/ml) for CIN3+.


NASBA (5 types) for CIN2+.

NASBA (9 types) for CIN2+.

HC2+4 (1 pg/ml) for CIN2+.

HC2+4 (1 pg/ml) for CIN3+.

HC2 (1pg/mL) for CIN2+ no verification bias.

CC or LBC (ASCUS+) for CIN2+ no verification bias.

HC2 (1pg/mL) for CIN2+ women >30.
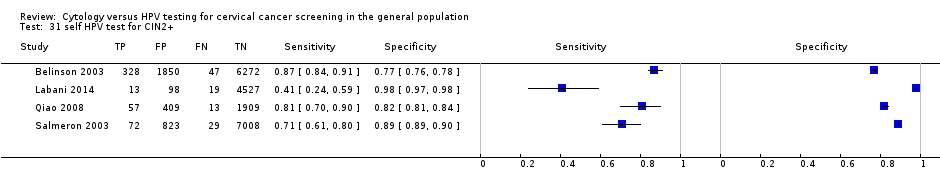
self HPV test for CIN2+.
| Human papillomavirus (HPV) compared to Papanicolaou (Pap) test for detection of cervical intraepithelial neoplasia (CIN 2+) in asymptomatic women | |||||
| Patient or population: adult asymptomatic women Settings: outpatient screening programmes New Test: HPV, HC2 test Cut‐off value: 1 pg/mL Comparison Test: Pap, liquid‐based cytology (LBC) test Cut‐off value: atypical squamous cells of undetermined significance (ASCUS) Reference Test: a colposcopy exam with or without biopsy as clinically indicated | |||||
| HPV | 138,230 women | Pooled sensitivity | 89.9% (88.6 to 91.1%) | Pooled specificity | 89.9% (89.7 to 90.0%) |
| Pap | 82,003 women | Pooled sensitivity | 72.9% (70.7 to 75%) | Pooled specificity | 90.3% (90.1 to 90.5%) |
| Test results | Number of results per 1000 women tested | Quality of the evidence | Comments | ||
| Prevalence of CIN 2+, 2%1 | |||||
| HPV | Pap | ||||
| True positives (TP) | 18 (18 to 18) | 15 (14 to 15) | ⊕⊕⊕⊝ | Women will be correctly classified and will receive further confirmatory testing or treatment | |
| TP absolute difference | 3 more | ||||
| False negatives (FN) | 2 (2 to 2) | 5 (5 to 6) | Women will be falsely reassured that they do not have CIN 2+, and the potentially beneficial treatment may be missed or will be delayed | ||
| FN absolute difference | 3 fewer | ||||
| True negatives (TN) | 881 (879 to 882) | 885 (883 to 887) | ⊕⊕⊕⊕ | Women will be correctly reassured that they do not have CIN 2+ | |
| TN absolute difference | 4 fewer | ||||
| False positives (FP) | 99 (98 to 101) | 95 (93 to 97) | Women will likely receive unnecessary further testing and possibly also unnecessary treatment; additionally further testing and unnecessary treatment may lead to adverse effects and use of resources without any health benefits | ||
| FP absolute difference | 4 more | ||||
| CI: Confidence interval; HPV human papillomavirus; Pap: Papanicolaou test, CIN: cervical intraepithelial neoplasia | |||||
| GRADE Working Group grades of evidence | |||||
| 1 Prevalence of 2% (20 women out of 1000) was assumed to be the average prevalence of cervical intraepithelial neoplasia 2+ in non HIV asymptomatic women. | |||||
| Test | Disease threshold | studies | Pooled sensitivity (95% CI) | Pooled specificity (95% CI) |
| CC (ASCUS+) | CIN 2+ | 16 | 65.87% (54.94 to 75.33) | 96.28% (94.72 to 97.39) |
| LBC (ASCUS+) | CIN 2+ | 15 | 75.51% (66.57 to 82.68) | 91.85% (88.43 to 94.32) |
| CC (LSIL+) | CIN 2+ | 9 | 62.84% (46.79‐76.50) | 97.73% (96.09‐98.70) |
| LBC (LSIL+) | CIN 2+ | 10 | 70.33% (59.73 to 79.11) | 96.20% (94.57 to 97.36) |
| HC2 (1 pg/mL) | CIN 2+ | 25 | 92.60% (99.45 to 95.30) | 89.30% (87.03 to 91.20) |
| PCR (> 12 types) | CIN 2+ | 6 | 95.13% (89.50 to 97.84) | 91.89% (83.79 to 96.13) |
| APTIMA | CIN 2+ | 3 | 92.66% (31.77 to 99.71) | 93.31% (47.30 to 99.54) |
| CC (ASCUS+) | CIN 3+ | 9 | 70.27% (57.87 to 80.30) | 96.67% (94.56 to 98.00) |
| LBC (ASCUS+) | CIN 3+ | 13 | 75.97% (64.72 to 84.49) | 91.19% (87.21 to 94.01) |
| CC (LSIL+) | CIN 3+ | 5 | 74.43% (67.81 to 80.10) | 96.86% (94.87 to 98.10) |
| LBC (LSIL+) | CIN 3+ | 5 | 71.91% (51.68 to 86.00) | 96.05% (93.53 to 97.60) |
| HC2 (1 pg/mL) | CIN 3+ | 19 | 96.50% (94.00 to 97.90) | 89.20% (86.70 to 91.30) |
| PCR (> 12 types) | CIN 3+ | 4 | 93.57% (69.90 to 98.91) | 86.49% (68.16 to 95.04) |
| APTIMA | CIN 3+ | 4 | 96.04% (72.91 to 99.54) | 92.80% (86.15 to 96.39) |
| Tests with fewer than three studies are not included in the table. | ||||
| Comparison | Disease threshold | Relative sensitivity (95% CI) | Relative specificity (95% CI) | Studies | Analysis number |
| HC2 vs CC (ASCUS+) | CIN 2+ | 1.52 (1.24 to 1.86) | 0.94 (0.92 to 0.96) | 9 | 1 |
| HC2 vs CC (ASCUS+) | CIN 3+ | 1.46 (1.12 to 1.91) | 0.95 (0.93 to 0.9) | 6 | 2 |
| PCR (> 12 types) vs CC (ASCUS+) | CIN 2+ | 1.37 (0.58 to 3.21) | 0.95 (0.76 to 1.19) | 3 | 5 |
| HC2 vs CC (LSIL+) | CIN 2+ | 1.28 (1.15 to 1.41) | 0.91 (0.87 to 0.95) | 6 | 7 |
| HC2 vs CC (LSIL+) | CIN 3+ | 1.22 (1.12 to 1.32) | 0.91 (0.87 to 0.95) | 5 | 8 |
| HC2 vs LBC (ASCUS+) | CIN 2+ | 1.18 (1.10 to 1.26) | 0.96 (0.95 to 0.97) | 10 | 11 |
| HC2 vs LBC (ASCUS+) | CIN 3+ | 1.17 (1.05 to 1.30) | 0.96 (0.95 to 0.98) | 8 | 12 |
| PCR (> 12 types) vs LBC (ASCUS+) | CIN 2+ | 1.53 (0.53 to 4.44) | 0.90 (0.89 to 0.92) | 3 | 15 |
| PCR (> 12 types) vs LBC (ASCUS+) | CIN 3+ | 1.47 (0.64 to 3.35) | 0.94 (0.8 to 1.09) | 3 | 16 |
| HC2 vs LBC (LSIL+) | CIN 2+ | 1.35 (1.19 to 1.53) | 0.92 (0.89 to 0.95) | 8 | 17 |
| HC2 vs LBC (LSIL+) | CIN 3+ | 1.30 (0.86 to 1.96) | 0.92 (0.8 to 1.00) | 4 | 18 |
| APTIMA vs LBC (ASCUS+) | CIN 3+ | 1.30 (0.49 to 3.41) | 0.98 (0.93 to 1.04) | 3 | 22 |
| Comparisons with fewer than three studies are not included in the table | |||||
| Comparison | Studies | Disease threshold | Relative sensitivity (95% CI) | Relative specificity (95% CI) |
| Age > 30 vs any age | 17 vs 20 | CIN 2+ | 1.13 (1.03 to 1.25) | 1.01 (0.98 to 1.04) |
| 13 vs 14 | CIN 3+ | 1.10 (1.02 to 1.19) | 1.04 (1.00 to 1.08) | |
| Increased vs low risk of verification bias | 17 vs 20 | CIN 2+ | 1.05 (0.95 to 1.16) | 1.00 (0.97 to 1.04) |
| 12 vs 15 | CIN 3+ | 1.09 (1.01 to 1.18) | 1.00 (0.96 to 1.05) | |
| High‐income vs middle‐/low‐income countries | 21 vs 16 | CIN 2+ | 1.01 (0.91 to 1.12) | 1.03 (1.00 to 1.07) |
| 13 vs 14 | CIN 3+ | 0.94 (0.87 to 1.02) | 1.01 (0.96 to 1.05) | |
| Assessed by bivariate random‐effects meta‐analysis including one covariate each time. | ||||
| Test | No. of studies | No. of participants |
| 1 CC (ASCUS+) for CIN2+ Show forest plot | 16 | 61099 |
| 2 CC (ASCUS+) for CIN3+ Show forest plot | 9 | 51857 |
| 3 CC (LSIL+) for CIN2+ Show forest plot | 9 | 41494 |
| 4 CC (LSIL+) for CIN3+ Show forest plot | 5 | 35648 |
| 5 LBC (ASCUS+) for CIN2+ Show forest plot | 15 | 82003 |
| 6 LBC (ASCUS+) for CIN3+ Show forest plot | 13 | 71919 |
| 7 LBC (LSIL+) for CIN2+ Show forest plot | 10 | 33519 |
| 8 LBC (LSIL+) for CIN3+ Show forest plot | 5 | 21166 |
| 9 HC2 (1pg/mL) for CIN2+ Show forest plot | 25 | 138230 |
| 10 HC2 (1 pg/mL) for CIN3+ Show forest plot | 19 | 120380 |
| 11 HC2 (2 pg/mL) for CIN2+ Show forest plot | 2 | 26768 |
| 12 HC2 (2 pg/mL) for CIN3+ Show forest plot | 2 | 26768 |
| 13 PCR (13 hr types or more) for CIN2+ Show forest plot | 6 | 16343 |
| 14 PCR (13 hr types or more) for CIN3+ Show forest plot | 4 | 14048 |
| 15 PCR (10‐11 hr types) for CIN2+ Show forest plot | 2 | 3965 |
| 16 PCR (10‐11 hr types) for CIN3+ Show forest plot | 1 | 2988 |
| 17 Aptima for CIN2+ Show forest plot | 3 | 15895 |
| 18 Aptima for CIN3+ Show forest plot | 4 | 17944 |
| 19 PCR (4 hr types) for CIN2+ Show forest plot | 1 | 1985 |
| 20 Care HPV test (0.5 pg/ml) for CIN2+ Show forest plot | 2 | 7044 |
| 21 Care HPV test (0.5 pg/ml) for CIN3+ Show forest plot | 2 | 7046 |
| 22 Cobas for CIN2+ Show forest plot | 2 | 11666 |
| 23 Cobas for CIN3+ Show forest plot | 2 | 11666 |
| 24 NASBA (5 types) for CIN2+ Show forest plot | 1 | 313 |
| 25 NASBA (9 types) for CIN2+ Show forest plot | 1 | 313 |
| 26 HC2+4 (1 pg/ml) for CIN2+ Show forest plot | 1 | 1352 |
| 27 HC2+4 (1 pg/ml) for CIN3+ Show forest plot | 1 | 1352 |
| 28 HC2 (1pg/mL) for CIN2+ no verification bias Show forest plot | 12 | 53013 |
| 29 CC or LBC (ASCUS+) for CIN2+ no verification bias Show forest plot | 8 | 31341 |
| 30 HC2 (1pg/mL) for CIN2+ women >30 Show forest plot | 13 | 69334 |
| 31 self HPV test for CIN2+ Show forest plot | 4 | 23474 |