Intervenciones para el aumento del consumo de frutas y vegetales en niños de hasta cinco años de edad
Resumen
Antecedentes
El consumo insuficiente de frutas y vegetales en la niñez aumenta el riesgo de enfermedades no transmisibles futuras, incluidas las enfermedades cardiovasculares. Por lo tanto, las intervenciones para aumentar el consumo de frutas y vegetales, como las centradas en estrategias específicas de alimentación en niños y las intervenciones de educación nutricional de los padres en la primera infancia pueden ser una estrategia efectiva para reducir esta carga de morbilidad.
Objetivos
Evaluar la efectividad, la relación entre costo y efectividad y los eventos adversos asociados de las intervenciones diseñadas para aumentar el consumo de frutas, vegetales o ambos, en niños de hasta cinco años de edad.
Métodos de búsqueda
Se hicieron búsquedas en CENTRAL, MEDLINE, Embase y en dos registros de ensayos clínicos para identificar ensayos elegibles el 25 enero 2018. Se hicieron búsquedas en Proquest Dissertations and Theses en noviembre 2017. Se revisaron las listas de referencias de los ensayos incluidos y se realizaron búsquedas manuales en tres revistas internacionales de nutrición. Se contactó con los autores de los estudios incluidos para identificar otros ensayos potencialmente relevantes.
Criterios de selección
Se incluyeron los ensayos controlados aleatorios, que incluyeron ensayos controlados aleatorios grupales y ensayos cruzados (crossover) de cualquier intervención dirigida principalmente al consumo de frutas, vegetales o ambos, en niños de hasta cinco años de edad, y que incorporaron una evaluación dietética o bioquímica del consumo de frutas o vegetales. Dos autores de la revisión, de forma independiente, examinaron los títulos y los resúmenes de los artículos identificados; un tercer autor de la revisión resolvió los desacuerdos.
Obtención y análisis de los datos
Dos autores de la revisión, de forma independiente, extrajeron los datos y evaluaron los riesgos de sesgo de los estudios incluidos; un tercer autor de la revisión resolvió los desacuerdos. Debido a la heterogeneidad no explicada, en los metanálisis de los resultados primarios de la revisión se utilizaron modelos de efectos aleatorios cuando se identificó un número suficiente de ensayos. Se calcularon las diferencias de medias estandarizadas (DME) para considerar la heterogeneidad del consumo de frutas y vegetales. Se realizaron evaluaciones de los riesgos de sesgo y se valoró la calidad de la evidencia (enfoque GRADE) mediante los procedimientos Cochrane.
Resultados principales
Se incluyeron 63 ensayos con 178 brazos en los ensayos y 11 698 participantes. Treinta y nueve ensayos examinaron la repercusión de las prácticas de alimentación infantil (p.ej. exposición repetida a los alimentos) en el aumento de la ingesta de vegetales en los niños. Catorce ensayos examinaron la repercusión de la educación nutricional de los padres en el aumento de la ingesta de frutas y vegetales en los niños. Nueve estudios examinaron la repercusión de intervenciones con componentes múltiples (p.ej. educación nutricional de los padres y cambios en las políticas prescolares) en el aumento de la ingesta de frutas y vegetales en los niños. Un estudio examinó el efecto de una intervención nutricional en los niños sobre el aumento de la ingesta de frutas y vegetales.
Se consideró que 14 de los 63 ensayos incluidos no tuvieron alto riesgo de sesgo en todos los dominios; los sesgos de realización, de detección y de desgaste fueron los dominios considerados con más frecuencia con alto riesgo de sesgo de los estudios restantes.
Hay evidencia de calidad muy baja de que las prácticas de alimentación infantil versus ninguna intervención pueden tener un efecto positivo pequeño en el consumo infantil de vegetales equivalente a un aumento de 3,50 g en el consumo de vegetales deseado (DME 0,33; IC del 95%: 0,13 a 0,54; participantes = 1741; estudios = 13). Las intervenciones de componentes múltiples versus ninguna intervención pueden tener un efecto muy pequeño sobre el consumo de frutas y vegetales en niños (DME 0,35; IC del 95%: 0,04 a 0,66; participantes = 2009; estudios = 5; evidencia de baja calidad), equivalente a un aumento de 0,37 tazas de fruta y vegetales por día. No hay seguridad sobre si existen diferencias a corto plazo en el consumo de frutas y vegetales en los niños en los metanálisis de los ensayos que examinaron la educación nutricional de los padres versus ninguna intervención (DME 0,12; IC del 95%: ‐0,03 a 0,28; participantes = 3078; estudios = 11; evidencia de muy baja calidad).
No hay suficientes datos disponibles para evaluar la efectividad a largo plazo, la efectividad en función de los costos y las consecuencias adversas no intencionales de las intervenciones. Los estudios informaron que recibieron fondos gubernamentales o de caridad, excepto cuatro estudios que informaron la financiación por la industria.
Conclusiones de los autores
A pesar de identificar 63 ensayos elegibles de enfoques diversos de intervención, la evidencia con respecto a cómo aumenta el consumo de frutas y vegetales en los niños todavía es escasa. Hubo evidencia de calidad muy baja y baja, respectivamente, de que las prácticas de alimentación infantil y las intervenciones de componentes múltiples pueden dar lugar a aumentos muy pequeños en el consumo de frutas y vegetales en los niños de cinco años de edad o menos. No está claro si las intervenciones de educación nutricional de los padres son efectivas para aumentar el consumo de frutas y vegetales en los niños de cinco años de edad o menos. Debido a que la calidad de la evidencia es muy baja o baja, es probable que los estudios de investigación futuros cambien las estimaciones y las conclusiones. Se requiere un seguimiento a largo plazo, y los estudios de investigación futuros deben adoptar métodos más rigurosos para avanzar en este campo.
Esta es una revisión sistemática activa. Las revisiones sistemáticas activas ofrecen un nuevo enfoque a la actualización de las revisiones, en el cual la revisión se actualiza continuamente, con la incorporación de la nueva evidencia relevante según esté disponible. Consultar el estado actual de esta revisión en la Base de Datos Cochrane de Revisiones Sistemáticas (Cochrane Database of Systematic Reviews.
PICO
Resumen en términos sencillos
Intervenciones para el aumento del consumo de frutas y vegetales en niños de hasta cinco años de edad
Antecedentes
El consumo insuficiente de frutas y vegetales es una carga considerable para la salud en los países desarrollados. Comer frutas y vegetales se asocia con una reducción del riesgo de enfermedades no transmisibles en el futuro (como las enfermedades cardiovasculares). La primera infancia representa un período crítico para el establecimiento de los hábitos alimentarios en los niños. Por lo tanto, las intervenciones para aumentar el consumo de frutas y vegetales en la primera infancia pueden ser una estrategia efectiva para reducir esta carga de morbilidad.
Pregunta de la revisión
Evaluar la repercusión de las intervenciones diseñadas para aumentar el consumo de frutas o vegetales o ambos, en niños de hasta cinco años de edad.
Métodos
Se hicieron búsquedas en varias bases de datos electrónicas y en revistas relevantes para encontrar ensayos. Se estableció contacto con los autores de los ensayos incluidos para obtener ensayos adicionales potencialmente relevantes. Fue elegible cualquier ensayo aleatorio (los participantes tienen las mismas probabilidades de ser asignados a un tratamiento o un control) de intervenciones dirigidas a aumentar la ingesta de frutas o vegetales o ambos, en niños de hasta cinco años de edad que midiera la ingesta. Dos autores de la revisión, de forma independiente, buscaron y extrajeron la información de los estudios. La evidencia está actualizada hasta enero de 2018.
Resultados
Se incluyeron 63 ensayos en los que participaron 11 698 personas. Treinta y nueve ensayos examinaron intervenciones de prácticas de alimentación infantil (p.ej. exposición repetida a vegetales), 14 examinaron intervenciones de educación nutricional de los padres, nueve examinaron intervenciones de componentes múltiples (p.ej. combinar cambios de política prescolar con educación de los padres) y uno examinó una intervención de educación nutricional en niños. Las prácticas de alimentación en niños y las intervenciones de componentes múltiples pueden dar lugar a aumentos muy pequeños en la ingesta de frutas y vegetales a corto plazo en niños (menos de 12 meses). No está claro si las intervenciones de educación nutricional de los padres son efectivas para aumentar la ingesta de frutas y vegetales en niños. No hubo información suficiente para evaluar la efectividad a largo plazo, la relación entre costo y efectividad ni los daños no intencionales. Los estudios informaron que recibieron ayuda económica de fondos gubernamentales o de organizaciones benéficas, excepto cuatro estudios que informaron haber recibido financiación de la industria.
Conclusiones
Las prácticas de alimentación infantil y las intervenciones de componentes múltiples pueden aumentar la ingesta de frutas y vegetales infantil (en 3,50 g y 0,37 tazas por día, respectivamente). Esta conclusión se basa en evidencia de calidad muy baja y baja y es muy probable que cambie cuando se realicen estudios de investigación futuros. No está claro si las intervenciones de educación nutricional de los padres aumentan la ingesta de frutas y vegetales de los niños.
Esta es una revisión sistemática activa. Las revisiones sistemáticas activas ofrecen un nuevo enfoque a la actualización de las revisiones, en el cual la revisión se actualiza continuamente, con la incorporación de la nueva evidencia relevante según esté disponible. Consultar el estado actual de esta revisión en la Base de Datos Cochrane de Revisiones Sistemáticas (Cochrane Database of Systematic Reviews.
Conclusiones de los autores
Summary of findings
| Child feeding interventions compared to no intervention for children aged five years and under | ||||||
| Patient or population: children aged five years and under | ||||||
| Outcomes | Anticipated absolute effects* (95% CI) | Relative effect | № of participants | Quality of the evidence | Comments | |
| Risk with no intervention | Risk with child‐feeding interventions | |||||
| Short‐term impact (< 12 months) child vegetable intake | The mean as‐desired vegetable intake was 7.7 grams1 | The mean as‐desired vegetable intake (grams) in the intervention group was 3.50 higher (1.38 higher to 5.73 higher) | ‐ | 1741 | ⊕⊝⊝⊝ | Scores estimated using a standardised mean difference of 0.33 (0.13 to 0.54) and a standard deviation of 10.61.1 The mean duration of follow‐up post‐intervention for studies included in the meta‐analysis was 6.2 weeks. Harnack 2012 compared ≥ 1 child‐feeding practice interventions to a no‐treatment control and reported a significant increase in intake of fruit but could not be synthesised in meta‐analysis. |
| Short‐term impact (< 12 months) cost effectiveness ‐ not reported | No child‐feeding interventions reported this outcome | ‐ | ‐ | ‐ | ‐ | |
| Short‐term impact (< 12 months) unintended adverse events | One trial (Spill 2011a) reported no adverse effects on amount of meals consumed | ‐ | 39 | ⊕⊝⊝⊝ | ‐ | |
| *The risk in the intervention group (and its 95% confidence interval) is based on the assumed risk in the comparison group and the relative effect of the intervention (and its 95% CI) | ||||||
| GRADE Working Group grades of evidence | ||||||
| 1We used the post‐intervention mean and standard deviation of the control group from Wardle 2003a for the risk with no intervention and to re‐express the SMD in terms of grams of intake. | ||||||
| Parent nutrition education interventions compared to no intervention for children aged 5 years and under | ||||||
| Patient or population: children aged 5 years and under | ||||||
| Outcomes | Anticipated absolute effects* (95% CI) | Relative effect | № of participants | Quality of the evidence | Comments | |
| Risk with no intervention | Risk with parent nutrition education interventions | |||||
| Short‐term impact (< 12 months) child fruit and vegetable intake | The mean servings of vegetables per day was 1.61 | The mean servings of vegetables per day in the intervention group was 0.12 higher (0.03 lower to 0.28 higher) | ‐ | 3078 | ⊕⊝⊝⊝ | Scores estimated using a standardised mean difference of 0.12 (‐0.03 to 0.28) and a standard deviation of 1.01 The mean duration of follow‐up post‐intervention for studies included in the meta‐analysis was 8.8 weeks. We were unable to pool results of three trials that reported mixed results in the meta‐analysis. One study found a parent‐responsivity and behaviour‐management intervention to be effective in increasing total fruit intake compared to control (Black 2011); one study found a parent health report on fruit and vegetable consumption to be effective in increasing total vegetable intake compared to control, but not fruit (Hunsaker 2017); and the other study found both a parent‐complementary feeding intervention and a parent‐complementary feeding and home‐visit intervention to be effective in increasing both fruit and vegetable intake compared to control (Vazir 2013). |
| Short‐term impact (< 12 months) cost effectiveness | Information regarding intervention costs was reported in 1 trial (Campbell 2013) | ‐ | 389 | ⊕⊝⊝⊝ | ‐ | |
| Short‐term impact (< 12 months) unintended adverse events | One trial (Wyse 2012) reported no adverse effect on family food expenditure | ‐ | 343 | ⊕⊝⊝⊝ | ||
| *The risk in the intervention group (and its 95% confidence interval) is based on the assumed risk in the comparison group and the relative effect of the intervention (and its 95% CI). | ||||||
| GRADE Working Group grades of evidence | ||||||
| 1We used the post‐intervention mean and standard deviation of the control group from Skouteris 2015 for the risk with no intervention and to re‐express the SMD in terms of servings of vegetables per day. | ||||||
| Multicomponent interventions compared to no intervention for children aged 5 years and under | ||||||
| Patient or population: children aged 5 years and under | ||||||
| Outcomes | Anticipated absolute effects* (95% CI) | Relative effect | № of participants | Quality of the evidence | Comments | |
| Risk with no intervention | Risk with multicomponent interventions | |||||
| Short‐term impact (< 12 months) child fruit and vegetable intake | The mean cups of vegetables per day was 1.081 | The mean cups of vegetables per day in the intervention group was 0.37 higher (0.04 higher to 0.69 higher) | ‐ | 2009 | ⊕⊕⊝⊝ | Scores estimated using a standardised mean difference of 0.35 (0.04 to 0.66) and a standard deviation of 1.051 The mean duration of follow‐up post‐intervention for studies included in the meta‐analysis was 1.1 weeks 4 studies could not be pooled in meta‐analysis. 3 reported significant increases in both fruit and vegetable consumption, and 1 significantly increased fruit but not vegetable consumption |
| Short‐term impact (< 12 months) cost effectiveness ‐ not reported | No studies reported this outcome | ‐ | ‐ | ‐ | ‐ | |
| Short‐term impact (< 12 months) unintended adverse events ‐ not reported | No studies reported this outcome | ‐ | ‐ | ‐ | ‐ | |
| *The risk in the intervention group (and its 95% confidence interval) is based on the assumed risk in the comparison group and the relative effect of the intervention (and its 95% CI). | ||||||
| GRADE Working Group grades of evidence | ||||||
| 1We used the post‐intervention mean and standard deviation of the control group from Williams 2014 for the risk with no intervention and to re‐express the SMD in terms of cups vegetables per day. | ||||||
| Child nutrition education interventions compared to no intervention for children aged 5 years and under | ||||||
| Patient or population: children aged 5 years and under | ||||||
| Outcomes | Anticipated absolute effects* (95% CI) | Relative effect | № of participants | Quality of the evidence | Comments | |
| Risk with no intervention | Risk with child nutrition education interventions | |||||
| Short‐term impact (< 12 months) child fruit and vegetable intake | The mean short‐term impact (< 12 months) child vegetable intake frequency score was 4 (a score of 4 corresponds to consumption of vegetables 3 ‐ 4 times per week) | MD 0 | ‐ | 238 | ⊕⊕⊝⊝ | The only study (Baskale 2011) reported an increase in some of the fruits and vegetables assessed in the intervention group and no significant differences in the control group The duration of follow‐up post‐intervention was 8 weeks |
| Cost or cost effectiveness ‐ not reported | No studies reported this outcome | ‐ | ‐ | ‐ | ‐ | |
| Unintended adverse events ‐ not reported | No studies reported this outcome | ‐ | ‐ | ‐ | ‐ | |
| *The risk in the intervention group (and its 95% confidence interval) is based on the assumed risk in the comparison group and the relative effect of the intervention (and its 95% CI). | ||||||
| GRADE Working Group grades of evidence | ||||||
| 1Downgraded one level for risk of bias: high risk of bias due to lack of blinding and loss to follow‐up. | ||||||
Antecedentes
Descripción de la afección
El consumo insuficiente de fruta y vegetales se asocia con varias enfermedades no transmisibles como el cáncer y las enfermedades cardiovasculares (Boeing 2012; Hartley 2013; Micha 2015; World Health Organization 2003; World Health Organization 2011). A nivel global, el 2,8% de todas las muertes y el 1% de todos los años de vida ajustados en función de la discapacidad (AVAD) cada año son atribuibles a la ingesta inadecuada de frutas y vegetales (World Health Organization 2017). El consumo bajo de frutas y vegetales causa el 14% de las muertes debido al cáncer gastrointestinal, el 11% de todas las cardiopatías isquémicas y el 9% de todas las muertes por accidente cerebrovascular (Organización Mundial de la Salud 2017), por lo que es una prioridad de salud pública.
La cantidad diaria de frutas y vegetales recomendada para los niños de cinco años de edad o menos varía internacionalmente. Por ejemplo, en los EE.UU. se recomienda una y de una a 1,5 tazas de frutas y vegetales para niños de entre dos y tres años y de cuatro a ocho años, respectivamente (U.S. Department of Health and Human Services). Mientras, en Australia se recomiendan de 0,5 a 1,15 raciones de frutas (75 g a 113 g) y de dos a 4,5 raciones de vegetales (150 g a 338 g) para los niños de uno a dos años de edad, de dos a tres años y de cuatro a ocho años (National Health and Medical Research Council). Encuestas poblacionales infantiles indican que dichas recomendaciones no se cumplen y que es necesario aumentar la ingesta infantil de frutas y vegetales (Australian Bureau of Statistics 2014; Inchley 2016; Lock 2005; National Cancer Institute 2015; World Health Organization 2004a; Yngve 2005). Por ejemplo, poco más de un tercio de los niños en edad escolar de las naciones europeas informan que consumen vegetales diariamente (Inchley 2016). Los datos de los niños más pequeños son similares. Una encuesta realizada de 2007 a 2010 en los EE.UU. mostró que el 33% de los niños de uno a tres años de edad cumplían con las recomendaciones sobre las frutas y el 13% cumplía con las recomendaciones sobre los vegetales (National Cancer Institute 2015). Una encuesta nacional de 2011 a 2012 en Australia mostró que el 90% de los niños de dos a ocho años de edad consumían el número recomendado de raciones de frutas por día, y el 49% de los niños de dos a tres años de edad consumían las raciones de vegetales recomendadas (Australian Bureau of Statistics 2014). A nivel global, la ingesta media de frutas y vegetales está por debajo de las recomendaciones de la Organización Mundial de la Salud (OMS) en todas las regiones de dicha organización. Las naciones de Sudamérica, África y el Sudeste Asiático informan cantidades más bajas de ingesta infantil de frutas y vegetales; los niños en edad escolar consumen con frecuencia menos de 300 g por día (Lock 2005).
Hay cierta evidencia de estudios longitudinales que indica que es probable que los comportamientos alimentarios establecidos en la niñez persistan hasta la edad adulta (Craigie 2011; Lien 2001; Mikkilä 2004). Por ejemplo, los datos de seguimiento a los 37 años del estudio de cohortes Boyd Orr en niños británicos, encontraron tasas inferiores de mortalidad cardiovascular por todas las causas entre los niños con mayor ingesta de vegetales en la niñez (Ness 2005). Además, los estudios longitudinales han mostrado que el consumo de frutas y vegetales en la niñez se asocia con reducciones de las enfermedades no transmisibles en la edad adulta (Maynard 2003; Ness 2005). Por lo tanto, estimular la alimentación sana entre los niños puede representar una estrategia efectiva de prevención primaria para la reducción del riesgo de enfermedades no transmisibles (Boeing 2012; Centers for Disease Control and Prevention 2011; Maynard 2003; Ness 2005; World Health Organization 2004b). La ingesta adecuada de frutas y vegetales durante la niñez también puede tener varios efectos beneficiosos inmediatos, que incluyen la reducción del riesgo de carencias de micronutrientes y de varias enfermedades respiratorias (Antova 2003; Boeing 2012; Forastiere 2005; World Health Organization 2003).
Descripción de la intervención
La etiología del consumo de frutas y vegetales es compleja, e incluye la interacción dinámica de diversos factores. Debido a esta complejidad, se han elaborado varios marcos para guiar el desarrollo de intervenciones para aumentar la ingesta de frutas y vegetales (Centers for Disease Control and Prevention 2011; Klepp 2005; Miller 2000; World Health Organization 2004b). Por ejemplo, el marco conceptual elaborado por el Pro Children Project internacional indica que las intervenciones dirigidas a diversos factores del ambiente cultural, físico y social, así como las dirigidas a los factores personales, pueden ser efectivas para influir de forma positiva en la ingesta de frutas y vegetales entre los niños (Klepp 2005).
A pesar del rango de posibles intervenciones objetivo, incluidas las intervenciones primordiales de prevención dirigidas a los factores de riesgo de las enfermedades no transmisibles antes de que ocurran (en comparación con las intervenciones de prevención primaria que tratan los factores de riesgo de las enfermedades no transmisibles), los ensayos anteriores han tendido a centrarse en los determinantes más susceptibles de intervención como el conocimiento y las aptitudes acerca de la nutrición, o el ambiente alimentario de contextos como las escuelas (Hector 2008). Entre los niños en edad escolar, las revisiones sistemáticas indican que existe evidencia más sólida de la efectividad de las intervenciones de componentes múltiples con elementos como el programa de estudios, la participación de los padres, y los cambios en las políticas y en el ambiente alimentario (Blanchette 2005; De Sa 2008; Jaime 2009; Knai 2006; Van Cauwenberghe 2010). Revisiones anteriores en niños de cinco años de edad o menos (Campbell 2007; Hesketh 2010; Tedstone 1998) han encontrado también cierta evidencia para las intervenciones de componentes múltiples. Por ejemplo, una intervención con el objetivo de prevenir la aparición de enfermedades cardiovasculares en los niños en edad prescolar, se dirigió a múltiples factores de riesgo, como el consumo infantil de frutas y vegetales (Peñalvo 2013a; Peñalvo 2013b). Las intervenciones de componentes múltiples, que incluyen el programa de estudios, el ambiente escolar y los componentes familiares mejoraron de manera exitosa los hábitos relacionados con las frutas y los vegetales de los niños en edad prescolar, que también se mantuvieron con el transcurso del tiempo (Peñalvo 2013a; Peñalvo 2013b; Peñalvo 2015).
De qué manera podría funcionar la intervención
Se han utilizado varias teorías para explicar los mecanismos por los cuales las intervenciones pueden influir en el consumo infantil de frutas y vegetales (Rasmussen 2006). En la mayoría de los casos, se han utilizado las teorías psicosociales como la Social Cognitive Theory (Bandura 1986), la Theory of Planned Behaviour (Ajzen 1991) o el Stages of Change Trans‐theoretical Model (Prochaska 1984) para explicar las posibles vías causales del consumo de frutas y vegetales (Rasmussen 2006). De manera colectiva, estas teorías afirman que para el cambio conductual se necesitan cambios en las actitudes, el conocimiento y las aptitudes y las normas y las expectativas percibidas. El Pro Children Project internacional incorporó el Social‐Ecological Model en su marco teórico conceptual de los determinantes del consumo infantil de frutas y vegetales (Klepp 2005). Las intervenciones derivadas del Modelo Socio‐Ecológico reconocen la importancia de más influencias estructurales en la ingesta infantil de frutas y vegetales, por ejemplo, la disponibilidad o la accesibilidad a las frutas y los vegetales en el hogar o en contextos que los niños frecuentan, como las escuelas.
Por qué es importante realizar esta revisión
Revisiones anteriores han identificado varios factores asociados con el consumo de frutas y vegetales en los niños (Blanchette 2005; Pearson 2008; Rasmussen 2006; Van der Horst 2007). Aunque estas revisiones proporcionan información importante para el desarrollo de intervenciones, solo las revisiones sistemáticas de los ensayos de intervención pueden determinar la efectividad de las estrategias para aumentar el consumo infantil de frutas y vegetales. Se han publicado varias revisiones (Burchett 2003; Ciliska 2000; Delgado‐Noguera 2011; De Sa 2008; Evans 2012; French 2003; Hendrie 2017; Howerton 2007; Knai 2006; Savoie‐Roskos 2017; Van Cauwenberghe 2010). Sin embargo, solo unas pocas se han concentrado específicamente en los niños de cinco años de edad o menos (Campbell 2007; Hesketh 2010; Tedstone 1998), y la más reciente se realizó en 2010. A pesar de que estas revisiones informan un efecto positivo de dichas intervenciones (Hesketh 2010; Tedstone 1998), la mayoría carece de información importante para la práctica como la efectividad de las intervenciones en diversas subpoblaciones (como los grupos minoritarios), la efectividad de las intervenciones en función de los costos, o la presencia de cualquier efecto adverso no intencional de la intervención. De manera similar, como es posible que las repercusiones positivas de las intervenciones de comportamientos de salud no se mantengan, es importante una revisión de la efectividad a largo plazo de las intervenciones (más de 12 meses postintervención) para que los elaboradores de políticas y los médicos evalúen los posibles efectos beneficiosos en la salud de las intervenciones relacionadas con las frutas y los vegetales (Fjeldsoe 2011; Jones 2011). Las revisiones anteriores no han examinado específicamente la repercusión de las intervenciones basadas en la duración del seguimiento postintervención. Por lo tanto, se necesita una revisión sistemática integral sobre este tema para proporcionar orientación a los médicos y los elaboradores de políticas interesados en implementar estrategias para promover el consumo de frutas y vegetales en la primera infancia.
Después de la publicación de la actualización de esta revisión en 2017, se mantendrá como una revisión sistemática activa, como piloto hasta el final de marzo de 2018. Lo anterior significa que se harán búsquedas de manera continua y se incorporará rápidamente cualquier evidencia recién identificada en la revisión (para más información acerca del enfoque de revisión sistemática activa pilotada por Cochrane, ver Apéndice 1). Se considera que un enfoque de revisión sistemática activa es apropiado para esta revisión por tres razones. Primero, la revisión aborda un tema de salud pública particularmente importante, la creciente carga de morbilidad y mortalidad atribuible a la baja ingesta de frutas y vegetales. El consumo insuficiente de frutas y vegetales se asocia con varias enfermedades no transmisibles como el cáncer y las enfermedades cardiovasculares, y en la mayoría de las regiones del mundo el consumo diario actual de frutas y vegetales está bastante por debajo de la ingesta recomendada para reducir el riesgo de enfermedades no transmisibles. La primera infancia representa un período crítico para el establecimiento de los comportamientos alimentarios sanos como la ingesta de frutas y vegetales, ya que es probable que los hábitos alimentarios que se desarrollan temprano persistan en la edad adulta. Por lo tanto, es importante comprender mejor cómo mejorar la ingesta de frutas y vegetales durante la niñez. En segundo lugar, se mantiene la incertidumbre con respecto a la evidencia existente; a pesar de las búsquedas que incluye la presente actualización (hasta el 25 de enero de 2018) que identificó 63 estudios para inclusión en la revisión, no existe evidencia de alta calidad de intervenciones efectivas para aumentar el consumo de frutas y vegetales en niños. En tercer lugar, se conoce que hay múltiples ensayos en curso en esta área de investigación que será importante incorporar, y se espera que los estudios de investigación futuros tengan repercusión sobre las conclusiones.
Objetivos
Evaluar la efectividad, la relación entre costo y efectividad y los eventos adversos imprevistos de las intervenciones diseñadas para aumentar el consumo de frutas, vegetales o ambos, en niños de hasta cinco años de edad.
Métodos
Criterios de inclusión de estudios para esta revisión
Tipos de estudios
Los ensayos elegibles fueron los ensayos controlados aleatorios (ECA), incluidos los ensayos controlados aleatorios grupales y los ensayos cruzados, que:
-
compararon dos o más programas alternativos de intervención para aumentar el consumo de frutas o vegetales, o ambos, en niños de cinco años de edad o menos;
-
compararon un programa de intervención para aumentar el consumo de frutas o vegetales, o ambos, en niños de cinco años de edad o menos con un grupo control sin intervención o de atención estándar.
Se excluyeron los ensayos que no incluyeron la ingesta de frutas o vegetales como un resultado primario del ensayo, para evitar los posibles efectos de confusión de otras intervenciones, y porque los sesgos de publicación y de informe selectivo de resultado son más predominantes entre los resultados secundarios de los ensayos (o los resultados que por otra parte no se declararon). Se incluyeron los ensayos que no declararon un resultado primario del ensayo pero evaluaron un resultado elegible de ingesta de frutas o vegetales. Se incluyeron los ensayos cruzados elegibles para la revisión, porque se consideraron un método apropiado y habitual para evaluar el efecto de las intervenciones para aumentar el consumo de frutas y vegetales en niños.
Tipos de participantes
Los participantes podrían incluir:
-
niños de cinco años de edad o menos. Los ensayos con niños mayores de cinco años solo se incluyeron si la edad promedio de la muestra del estudio al inicio fue cinco años o menos;
-
padres, guardianes y familias responsables de la atención de niños de cinco años de edad o menos;
-
profesionales responsables de la atención de niños de cinco años de edad o menos, incluido el personal de atención infantil y los profesionales sanitarios.
Tipos de intervenciones
Se consideró cualquier intervención educacional, basada en la experiencia, de promoción de salud o psicológica o de terapia o asesoría conductual o de tratamiento o estructural o de políticas o de reforma legislativa, diseñada para aumentar el consumo de frutas o vegetales, o ambos, en niños de cinco años de edad o menos (como se definió en tipos de participantes). Las intervenciones se podían realizar en cualquier contexto, incluido el domicilio, los servicios de atención infantil/prescolar, los servicios sanitarios o los contextos comunitarios.
Comparación: Cualquier intervención alternativa para promover el consumo de frutas y vegetales como se describe anteriormente, o un control sin intervención, atención habitual o atención control o control en lista de espera. Los controles de atención en los ensayos aleatorios para las intervenciones conductuales son los que incluyen la atención clínica e inducen la expectativa de un efecto terapéutico beneficioso para el control de los efectos no específicos de la intervención (Freedland 2011). Los grupos control en lista de espera, que también están diseñados para el control de los efectos no específicos, incluyen a los participantes asignados a recibir una intervención al final del estudio (comienzo retardado) (Whitehead 2004).
Tipos de medida de resultado
Se incluyeron los estudios con resultados evaluados que midieron índices biomédicos o alimentarios, o ambos, del resultado primario de la revisión.
Resultados primarios
El resultado primario fue la ingesta de frutas y vegetales en niños. La ingesta de frutas y vegetales se podía evaluar con diversas medidas como:
-
cambio en el número de porciones o raciones diarias de frutas o vegetales, o ambos, al seguimiento, medido según los recuerdos alimentarios, los diarios alimentarios, los cuestionarios de frecuencia de consumo de alimentos o los registros alimentarios completados por un adulto en nombre del niño. Las intervenciones se agruparon según los efectos a corto plazo (menos de 12 meses postintervención) y los efectos a largo plazo (al menos 12 meses postintervención);
-
cambio en los gramos de frutas o vegetales, o ambos, al seguimiento, medido según los recuerdos alimentarios, los diarios alimentarios, los cuestionarios de frecuencia de consumo de alimentos o los registros alimentarios completados por un adulto en nombre del niño. Se agruparon según los efectos a corto plazo (menos de 12 meses postintervención) y los efectos a largo plazo (al menos 12 meses postintervención);
-
cambios en los marcadores biomédicos de consumo de frutas o vegetales, o ambos, como α‐caroteno, β‐caroteno, criptoxantina, licopeno y luteína. Se agruparon según los efectos a corto plazo (menos de 12 meses postintervención) y los efectos a largo plazo (12 meses o más postintervención).
Los resultados de la ingesta de jugos de frutas o verduras solos no fueron elegibles. Fueron elegibles los resultados que incluyeron la ingesta infantil de jugos de frutas y vegetales como parte de una medida global de ingesta infantil de frutas y vegetales.
Resultados secundarios
-
Estimaciones de los costos absolutos y la efectividad en función de los costos de las intervenciones para aumentar el consumo de frutas y vegetales informadas en los estudios identificados.
-
Cualquier efecto adverso informado de una intervención para aumentar el consumo de frutas y vegetales informado en los estudios identificados. Lo anterior podía incluir cualquier repercusión física, conductual, psicológica o económica sobre el niño, los padres o la familia, o sobre el servicio o la institución en la que pudo haberse realizado la intervención.
Métodos de búsqueda para la identificación de los estudios
This review represents the third update of a review first published in 2012 (Wolfenden 2012) and updated in 2017 (Hodder 2017) and January 2018 (Hodder 2018).
Búsquedas electrónicas
We searched the following electronic databases on 25 October 2017, 25 November 2017, 25 December 2017 and 25 January 2018 to identify any relevant trials added since the last published review (Hodder 2018):
-
Cochrane Central Register of Studies (CENTRAL, via CRS‐Web);
-
Epub Ahead of Print, In‐Process & Other Non‐Indexed Citations, MEDLINE Daily and MEDLINE (Ovid, 1946 to 25 January 2018);
-
Embase (Ovid, 1980 to 2018 Week 4).
As a living systematic review, we are conducting monthly searches of these databases, for which we have set up auto‐alerts to deliver monthly search yields, where possible.
We had previously conducted electronic searches of CINAHL (EBSCO, 1937 to 5 July 2016) (searched 5 July 2016) and PsycINFO (Ovid, 1806 to June week 5 2016) (searched 5 July 2016) (Hodder 2017) .
The search strategies are described in Appendix 2. We applied the sensitivity‐maximising version of the Cochrane RCT filter (Lefebvre 2011) to MEDLINE, and adaptations of it to the other databases except for CENTRAL. We imposed no restrictions by date or language of publication.
Búsqueda de otros recursos
We searched the reference lists of included articles and handsearched all articles published between September 2016 and September 2017 in three relevant international peer‐reviewed journals (Journal of Nutrition Education and Behavior, Public Health Nutrition, and Journal of the Academy of Nutrition and Dietetics (previously titled Journal of the American Dietetic Association)).
We are now running monthly trial registry searches of the WHO International Clinical Trials Registry Platform (www.who.int/ictrp/) and ClinicalTrials.gov (www.clinicaltrials.gov), which we last conducted in January 2018. In September 2016 we also searched a third clinical trials register, the metaRegister of clinical trials (www.isrctn.com/page/mrct).
We also searched a database of published dissertations (Proquest Dissertations and Theses) in November 2017 and GoogleScholar in December 2017.
We contacted the authors of included studies to try to obtain other eligible trials published in peer‐reviewed journals, as well as ongoing trials. We describe ongoing studies, where available, detailing the primary author, research question(s), methods and outcome measures (Characteristics of ongoing studies).
As this is a living systematic review, we will continue to handsearch the three journals listed above, the database of published dissertations and 'grey literature' in GoogleScholar manually every six months.
As additional steps to inform the living systematic review, we will contact corresponding authors of ongoing studies as they are identified and ask them to advise when results are available, or to share early or unpublished data. We will contact the corresponding authors of any newly‐included studies for advice as to other relevant studies. We will conduct citation tracking of included studies in Web of Science Core Collection on an ongoing basis. For that purpose, we have set up citation alerts in Web of Science Core Collection. We will manually screen the reference lists of any newly‐included studies and systematic reviews.
We will review search methods and strategies approximately yearly, to ensure they reflect any terminology changes in the topic area, or in the databases.
Obtención y análisis de los datos
Selección de los estudios
Pairs of review authors (from RH, KO, RW, FS, SY, NN) independently screened titles and abstracts of identified papers. Review authors were not blinded to the details of the study author or journal. Review authors applied a standardised screening tool to assess eligibility. We screened articles against the eligibility criteria of participants (mean age of children more than five years), outcome (primary outcome was not fruit and vegetable intake), comparator (was not a no‐intervention, usual care, attention or wait‐list control), intervention (did not aim to increase child fruit or vegetable intake) and study type (was not RCT, C‐RCT or cross‐over trial with random allocation to group). Based on the title and abstract, we excluded papers which clearly did not meet the eligibility criteria of the review. Pairs of review authors (from FS, RH, KO, NN, RS, SY) then independently examined the full text of all remaining articles. We documented Information regarding the reason for the ineligibility of any paper for which we reviewed the full text, and present it in the table 'Characteristics of excluded studies'. A third review author with expertise in review methodology (LW) resolved any disagreements between review authors on study eligibility. For those papers which did not provide sufficient information to determine eligibility, we contacted the study authors for clarification.
We will immediately screen any new citations retrieved by the monthly searches. As the first step of monthly screening, we will apply the machine learning classifier (RCT model) (Wallace 2017), available in the Cochrane Register of Studies (CRS‐Web) (Cochrane 2017a). The classifier assigns a probability (from 0 to 100) to each citation of being a true RCT. For citations that are assigned a probability score of less than 10, the machine learning classifier currently has a specificity/recall of 99.987% (Wallace 2017). We will screen in duplicate and independently all citations that have been assigned a score from 10 to 100. Cochrane Crowd will screen citations that score 9 or less (Cochrane 2017b) and will return any citations that they deem to be potential RCTs to the review authors for screening.
Extracción y manejo de los datos
Pairs of review authors (from EJ, RW, RH, KB, KO, ER, TCM, RS, NN) independently extracted data from each included trial. Review authors were not blinded to the details of the study author or journal. We recorded data on data extraction forms designed and piloted specifically for this review. Consultation with a third review author with expertise in review methodology (LW) resolved discrepancies between review authors about data extraction. We tried to contact authors of included papers in instances where the information required for data extraction was not available from the published report, or was unclear. One review author entered extracted data into the systematic review software Review Manager 5 (RevMan 5) (RH) and another review author checked it (KO). Where available, we extracted the following information from included trials:
-
Information on the study, research design and methods, such as the study authors; date of publication; date of study initiation; study duration; setting; number of participants; participants' age, gender, ethnicity, and socioeconomic position;
-
Information on the experimental conditions of the trial, such as the number of experimental conditions; intervention and comparator components; duration; number of contacts; modalities; interventionist; and integrity;
-
Information on the trial outcomes and results, such as rates of recruitment and attrition; sample size; number of participants per experimental condition; mean and standard deviation of the primary or secondary outcomes described above; any subgroup analyses by gender, population group or intervention characteristics; and analyses (including whether studies appropriately adjusted for clustering).
Evaluación del riesgo de sesgo de los estudios incluidos
Working in pairs, review authors FS, FT and TCM independently assessed the risks of bias in the included studies. We consulted a fourth review author (RH) with expertise in review methodology to resolve any disagreements between review authors. Review authors used the tool outlined in the Cochrane Handbook for Systematic Reviews of Interventions (Higgins 2011) to assess the risks of bias. The tool requires an explicit judgement by the review authors, based on trial information, about the risks of bias attributable to the generation of the random sequence, the allocation concealment, the blinding of participants, personnel and outcome assessors, the completeness of outcome data, selective reporting, and any other potential threats to validity. We also judged recruitment bias, baseline imbalance, loss of clusters and incorrect analysis for C‐RCTs. Judgements on the risks of bias for each trial are recorded in the ‘Risk of bias’ tables accompanying the review.
Medidas del efecto del tratamiento
Where meta‐analyses were performed, we expressed the intervention effect as a mean difference (MD) where outcomes were reported using a standard metric (such as grams), and as a standardised mean difference (SMD) where outcomes were reported using different methods or metrics of fruit and vegetable intake (such as grams, grams per kilogram of body weight, and serves per day).
Cuestiones relativas a la unidad de análisis
We assessed cluster‐randomised trials in the review for unit‐of‐analysis errors. Where cluster‐randomised studies did not account for clustering, we contacted study authors to provide intra‐class correlation coefficients (ICCs) to allow calculation of design effects and effective sample sizes to enable individual‐level pooling. Where ICCs were not available, we estimated a mean ICC from reported ICCs of included studies, and used it to calculate effective sample sizes.
Manejo de los datos faltantes
Where available, we reported outcomes of trials using an intention‐to‐treat analysis. If studies did not report intention‐to‐treat analyses, we reported as‐treated analysis of trial outcomes. We explored the impact of including as‐treated trial outcomes in meta‐analysis for studies with a high rate of attrition (more than 20% for short‐term outcomes) in sensitivity analyses (see below Sensitivity analysis). We contacted study authors to obtain any missing data (e.g. standard deviations).
Evaluación de la heterogeneidad
We assessed statistical heterogeneity by visual inspection of forest plots of the included trials, and calculation of the I2 statistic where we were able to pool data from included trials (Higgins 2003). Due to the similarity in trial characteristics (e.g. type of participants, intervention or outcomes), we could not conduct subgroup analyses by trial characteristics to identify the source of substantial heterogeneity (defined as I2 greater than 50%).
Evaluación de los sesgos de notificación
We checked for reporting bias by visual inspection of the funnel plots.
Síntesis de los datos
We assessed trial outcomes using a variety of dietary assessment tools and reported in various metrics, including vitamin C from fruit, fruit or vegetable serves, and grams of fruit and/or vegetable consumption. We calculated standardised mean differences (SMDs; to account for variable outcome measures) for each comparison, using the generic inverse variance method in a fixed‐effect meta‐analysis model (where there was no or low statistical heterogeneity in the primary analysis) or a random‐effects meta‐analysis model (where there was unexplained heterogeneity in the primary analysis), using the RevMan 5 software. We selected post‐intervention values over change‐from‐baseline data for inclusion in meta‐analysis, to reduce the risk of selective reporting and to maximise the number of studies that could be pooled.
We synthesised studies that provided data suitable for pooling in meta‐analyses grouped by intervention type (infant feeding, parent nutrition education, and multicomponent interventions). When studies reported multiple fruit or vegetable outcomes, we selected the stated primary trial outcome for inclusion in our meta‐analyses, or if a primary outcome was not stated we selected the first reported outcome for inclusion. For studies which reported multiple follow‐up points, we extracted data from the longest follow‐up period for inclusion in meta‐analyses.
We selected reported study estimates that adjusted for potential confounding variables for inclusion in meta‐analysis over reported estimates that did not adjust for potential confounding variables. Similarly, for C‐RCTs that reported study estimates that were unadjusted and adjusted for clustering, we preferred estimates that adjusted for clustering for inclusion in meta‐analyses. For C‐RCTs that did not report post‐intervention study estimates (and a relevant measure of variance) that accounted for clustering, we calculated a design effect and effective sample size using study data (number of clusters, number of participants analysed) and a reported ICC from one of the included studies (vegetable intake: ICC 0.014, fruit intake: ICC 0.016; De Bock 2012). For such C‐RCTs (De Coen 2012; Martinez‐Andrade 2014; Namenek Brouwer 2013; Nicklas 2017; O'Connell 2012; Roset‐Salla 2016; Smith 2017; Verbestel 2014; Williams 2014; Zeinstra 2018), we entered the reported post‐intervention outcome data (e.g. mean and standard deviation) and author‐calculated effective sample sizes into RevMan 5 to calculate individual‐level adjusted study estimates to enable inclusion in meta‐analyses. We tried to pool studies separately that compared two or more alternative interventions.
For cross‐over trials, we tried to synthesise results separately from parallel RCTs, by pooling results from paired analyses that adjust for within‐individual comparisons. If such data were not available, we combined results by pooling data from the first cross‐over period (i.e. essentially a parallel RCT) with parallel RCTs.
In all instances where we could not combine data in a meta‐analysis, we have provided a narrative summary of the trial findings according to the review objectives.
Whenever we find new evidence (i.e. studies, data or information) meeting the review inclusion criteria, we will extract the data, assess risks of bias and incorporate it into the synthesis every three months, as appropriate.
We will incorporate any new study data into existing meta‐analyses using the standard approaches outlined in the Data synthesis section.
We will not adjust the meta‐analyses to account for multiple testing, given that the methods related to frequent updating of meta‐analyses are under development (Simmonds (in press)).
Summary of Findings table and GRADE
We created 'Summary of findings' tables using the following outcomes:
-
Child fruit and vegetable intake. This could include changes in the number of portions or serves or grams of daily fruit or vegetable or both at follow‐up, as measured by diet recalls, food diaries, food frequency questionnaires or diet records completed by an adult on behalf of the child; or changes in biomedical markers of consumption of fruit or vegetables or both, such as α‐carotene, β‐carotene, cryptoxanthin, lycopene and lutein.
-
Estimates of absolute costs and cost effectiveness of interventions to increase the consumption of fruit and vegetables reported in the included studies;
-
Any reported adverse events of an intervention to increase the consumption of fruit and vegetables reported in the included studies. This could include any physical, behavioural, psychological or financial impact on the child, parent or family, or the service or facility where an intervention may have been implemented.
We have produced four 'Summary of findings' tables, one for each of the following comparisons:
-
Child‐feeding interventions compared to no‐intervention control;
-
Parent nutrition education interventions compared to no‐intervention control;
-
Multicomponent interventions compared to no‐intervention control;
-
Child nutrition education interventions compared to no‐intervention control.
We used the five GRADE considerations (study limitations, consistency of effect, imprecision, indirectness and publication bias) to assess the quality of a body of evidence as it relates to the studies which contribute data to the meta‐analyses for the prespecified outcomes. We used methods and recommendations described in Section 8.5 and Chapter 12 of the Cochrane Handbook for Systematic Reviews of Interventions (Higgins 2011), using GRADEpro software (gradepro.org/). We justified all decisions to downgrade the quality of studies using footnotes, and made comments to aid the reader's understanding of the review where necessary. For each comparison where we had calculated a SMD, we re‐expressed it based on the instrument used in the lowest risk of bias in that comparison (e.g. grams of vegetable intake or serves of vegetables a day), by multiplying the post‐intervention standard deviation of the control group by the pooled SMD.
Two review authors (RH and NN), working independently, judged the quality of the evidence, with disagreements resolved by discussion or by involving a third review author (LW). We justified, documented and incorporated the judgements into the reporting of results for each outcome.
We extracted study data, formatted our comparisons in data tables and prepared a 'Summary of findings' table before writing the results and conclusions of our review.
Análisis de subgrupos e investigación de la heterogeneidad
Where possible, we conducted subgroup analyses of interventions for the following subgroups, which we had planned a priori:
-
Interventions targeting boys and girls (not conducted);
-
Interventions targeting minority groups including indigenous populations (not conducted, described narratively);
-
Interventions delivered in various settings including health and children’s services (conducted where possible for some comparisons and settings);
-
Interventions of varying intensities, defined in terms of the number and duration of intervention contacts or components (not conducted);
-
Interventions delivered in different modes, such as by telephone, the Internet or face‐to‐face (conducted for some comparisons and modalities, otherwise described narratively).
Análisis de sensibilidad
Where possible, we conducted sensitivity analyses to explore the impact on the overall assessment of treatment effects:
-
Excluding studies at high risk of bias (defined a priori);
-
Excluding studies not reporting an intention‐to‐treat analysis, with high rates of participant attrition defined as greater than 20% (defined a priori);
-
Excluding studies that did not have a primary outcome of child fruit and vegetable, fruit or vegetable consumption (post hoc).
For the sensitivity analysis excluding studies that did not have a primary outcome of child fruit and vegetable, fruit or vegetable consumption, we considered studies to have a primary outcome of children's fruit and vegetable intake even when this was not explicitly stated if: children's fruit and vegetable intake was the only reported outcome, a sample size calculation for children's fruit and vegetable intake was reported, or children's fruit and vegetable intake was the first reported outcome.
Other
We will review our scope and methods if appropriate in the light of potential changes in the topic area, or the evidence being included in the review (e.g. additional comparisons, interventions or outcomes, or new review methods available).
We are piloting this review as a living systematic review up until March 2018.
Results
Description of studies
See: Characteristics of included studies; Characteristics of excluded studies; Characteristics of ongoing studies.
Results of the search
We ran searches for the previous reviews (Wolfenden 2012; Hodder 2017; Hodder 2018) and this review update, which together generated a total of 25,480 citations (24,661 previous reviews; 819 this review update). Screening of titles and abstracts for the review update identified 91 records (737 in total, including 646 from the previous reviews) for formal inclusion or exclusion (See Figure 1). Of these, 63 trials (Anzman‐Frasca 2012; Barends 2013; Baskale 2011; Black 2011; Blissett 2016; Campbell 2013; Caton 2013; Cohen 1995; Cooke 2011; Correia 2014; Cravener 2015; Daniels 2014; De Bock 2012; De Coen 2012; de Droog 2014; de Droog 2017; de Wild 2013; de Wild 2015a; de Wild 2015b; de Wild 2017; Duncanson 2013; Fildes 2014; Fildes 2015; Fisher 2012; Forestell 2007; Gerrish 2001; Haire‐Joshu 2008; Harnack 2012; Hausner 2012; Heath 2014; Hetherington 2015; Hunsaker 2017; Keller 2012; Kling 2016; Martinez‐Andrade 2014; Mennella 2008; Namenek Brouwer 2013; Natale 2014a; Nicklas 2017; O'Connell 2012; Remington 2012; Remy 2013; Roe 2013; Roset‐Salla 2016; Savage 2012; Sherwood 2015; Skouteris 2015; Smith 2017; Spill 2010; Spill 2011a; Spill 2011b; Staiano 2016; Sullivan 1994; Tabak 2012; Vazir 2013; Verbestel 2014; Vereecken 2009; Wardle 2003a; Watt 2009; Williams 2014; Witt 2012; Wyse 2012; Zeinstra 2018) met the inclusion criteria, eight of which were new studies identified in the most recent update (Cohen 1995; Forestell 2007; Gerrish 2001; Heath 2014; Kling 2016; Sherwood 2015; Smith 2017; Zeinstra 2018). We contacted authors of the included trials for any missing outcome data, to permit meta‐analysis.

Study flow diagram
Included studies
There were 178 trial arms and 11,698 participants randomised across the 63 included trials. We give full details of the trials in the Characteristics of included studies table. Twenty‐nine trials were undertaken in the USA, nine in the UK, eight in the Netherlands, five in Australia, three in Belgium, and one each in Turkey, Germany, Denmark, Mexico, France, Spain, Honduras and India, and one study that was undertaken in the UK, Greece and Portugal. Thirty‐two of the included studies were RCTs, of which 17 compared an intervention to a no‐treatment control group; 21 were C‐RCTs, of which 18 compared an intervention to a no‐treatment control group; and 10 were cross‐over trials. The unit of randomisation in C‐RCTs included childcare centres or preschools (n = 14), parent groups (n = 2), preschool classrooms (n = 1), primary schools (n = 1), primary school classrooms (n = 1), primary care clinics (n = 1) and villages (n = 1). Twenty‐nine trials were conducted in a preschool or school setting; 14 in a home setting; five in a healthcare setting (e.g. primary care); six in a home and laboratory setting; two in a laboratory setting; three in a preschool and home setting; and four in a home and healthcare setting. Included studies examined the impact of various types of interventions to increase child fruit and vegetable consumption. Fifty‐nine of the included studies assessed intake of vegetables, and 31 assessed intake of fruit. Various objective and subjective measures were used to assess fruit and vegetable intake, such as as‐desired intake and mean daily intake as reported by parents. One trial reported information about intervention costs and two trials reported information on any adverse events or unintended adverse consequences of the intervention. Information on the reliability and validity of selected fruit and vegetable intake outcome measures in children were reported by 11 studies. Post‐intervention follow‐up periods ranged from immediate to 3.5 years. Of the 63 included studies, 13 did not report whether funding support was received to undertake the trial, one study reported no funding support (Baskale 2011), and the remaining 49 studies reported a source of funding. Funding support for such studies were governmental or charitable, with the exception of four studies that reported receiving funding from food industry sources (Fisher 2012; Gerrish 2001; Sullivan 1994; Tabak 2012).
Child‐feeding practice interventions
Thirty‐nine trials tested the impact of specific child feeding‐practice interventions (e.g. repeated exposure) in increasing children's intake of fruit or vegetables (Anzman‐Frasca 2012; Barends 2013; Blissett 2016; Caton 2013; Cohen 1995; Cooke 2011; Correia 2014; Cravener 2015; Daniels 2014; de Droog 2014; de Droog 2017; de Wild 2013; de Wild 2015a; de Wild 2015b; de Wild 2017; Forestell 2007; Fildes 2014; Fildes 2015; Fisher 2012; Gerrish 2001; Harnack 2012; Hausner 2012; Heath 2014; Hetherington 2015; Keller 2012; Kling 2016; Mennella 2008; O'Connell 2012; Remington 2012; Remy 2013; Roe 2013; Savage 2012; Spill 2010; Spill 2011a; Spill 2011b; Staiano 2016; Sullivan 1994; Wardle 2003a; Zeinstra 2018). Of the trials testing the impact of specific feeding‐practice interventions, 25 compared the effectiveness of two or more interventions and 14 trials compared one or more interventions with a no‐treatment control group; eleven of these were cross‐over trials.
Fourteen trials examined the effect of repeated exposure compared to an alternate or no intervention. Five compared the effect of a repeated exposure intervention to one or more alternative interventions (including associative conditioning, flavour‐flavour learning, flavour‐nutrient learning, choice of vegetable versus no choice) (Anzman‐Frasca 2012; Barends 2013; Caton 2013; Hausner 2012; Remy 2013), one compared the effect of repeated exposure choice offering of vegetable to no choice (de Wild 2015a), one study compared the effect of repeated exposures and variety (Mennella 2008), and one study compared the effect of repeated exposure to a target vegetable using different preparation methods compared to a control vegetable (de Wild 2017). The other six trials examined the effect of a repeated exposure intervention compared to no‐treatment control, of which one trial each examined the effect of repeated exposure alone (O'Connell 2012), taste exposure plus rewards (Fildes 2014), exposure plus social reward and exposure plus tangible reward (Remington 2012), exposure and nutrition information (Wardle 2003a), exposure plus tangible reward, exposure plus social reward and exposure alone (Cooke 2011), and repeated exposure over five months within a childcare setting (Zeinstra 2018).
Two trials examined the effect of flavour nutrient learning, of which one trial compared the effects of low‐energy vegetable soup versus high‐energy vegetable soup (de Wild 2013), and the other trial compared incorporation of vegetable puree into meals at three different levels of energy density (Spill 2011a). A further trial examined the effect of six different levels of portion size and energy density on vegetable intake (Kling 2016).
Five trials examined the effect of parent‐feeding interventions. One trial compared the effects of advice to the parent about introducing vegetables to no‐treatment control (Fildes 2015), one trial compared the effects of an early feeding intervention targeting complementary feeding practices to a no‐treatment control (Daniels 2014), one trial compared the effects of early and repeated exposure to vegetables during complementary feeding to a no‐treatment control (Hetherington 2015), one trial compared parent prompting and modelling, parent prompting alone and modelling alone (Blissett 2016), and the other trial compared exclusive breastfeeding, complementary feeding with breastfeeding, and complementary feeding with breastfeeding on demand (Cohen 1995).
Five trials examined the effect of pairing fruit and vegetables with positive stimuli. One trial compared pairing vegetables with stimuli such as stickers and cartoon packaging to a no‐treatment control (Cravener 2015), one trial compared pairing fruit and vegetables with character branding to a no‐treatment control (Keller 2012), one trial compared pairing of vegetables with a modelling DVD to a non‐food DVD and a no‐DVD control group (Staiano 2016), one trial compared the effect of pairing passive and interactive story‐telling (about a character that eats carrots) featuring either a product‐congruent (a rabbit) or product‐incongruent (a turtle) character across four experimental groups compared to a control group (de Droog 2014), and the fifth trial compared the effects of passive and interactive story‐telling (about a rabbit that eats carrots) with or without the use of a hand puppet (de Droog 2017).
Four trials examined the effect of pairing target vegetables with liked foods (Correia 2014; de Wild 2015b; Fisher 2012; Forestell 2007). Two trials examined the effect of varying serving sizes (Savage 2012; Spill 2011b). One trial examined the effects of dietary experience (salted or unsalted vegetables) (Sullivan 1994). The remaining three trials examined the effect of different serving methods; one trial compared serving fruit and vegetables first before other menu items to a specific plate of prepared food (Harnack 2012), one trial compared three different portion sizes of vegetables served at the beginning of a meal to a control meal (Spill 2010), and the third trial of eight arms compared the impact of a single type of vegetable, a variety of vegetables, a single type of fruit, and a variety of fruits on consumption (Roe 2013). One trial compared the effect of repeated exposure to pureed green beans alone to pureed green beans and peaches on green bean consumption (Forestell 2007).
One trial examined the effect of introducing a variety of flavours when introducing vegetables, which compared exposure to target vegetable (carrot), an alternate vegetable (potato), and a variety of vegetables that did not include the target vegetable (Gerrish 2001). One trial compared exposure to a picture book of a liked, disliked and unfamiliar vegetable on vegetable consumption (Heath 2014).
Parent nutrition education interventions
Fourteen studies tested the impact of parent nutrition education interventions in increasing children's intake of fruit or vegetables (Black 2011; Campbell 2013; Duncanson 2013; Haire‐Joshu 2008; Hunsaker 2017; Martinez‐Andrade 2014; Roset‐Salla 2016; Sherwood 2015; Skouteris 2015; Tabak 2012; Vazir 2013; Verbestel 2014; Watt 2009; Wyse 2012). Four trials were conducted in a healthcare setting: one trial compared a parenting practices intervention to a maternal diet and physical activity intervention to control (Black 2011), one trial compared a dietitian‐delivered intervention in a first‐time parents' group regarding infant feeding, physical activity and sedentary behaviours to control (Campbell 2013), one trial compared a six‐week parent intervention on obesity awareness and prevention to control (Martinez‐Andrade 2014), and the fourth trial compared a multistrategy parent intervention including health snack exposure to control (Skouteris 2015). Five trials were conducted within a home setting: one trial compared the provision of an interactive nutrition education CD and parenting DVD to parents to wait‐list control (Duncanson 2013), one trial compared a parent intervention inclusive of a tailored newsletter, home visits and materials to usual care (Haire‐Joshu 2008), one trial compared a dietitian‐delivered parent intervention on vegetable availability, picky eating, modelling and family meals to control (Tabak 2012); one trial compared a parent health report on fruit and vegetable consumption compared to control (Hunsaker 2017) and the fifth compared a parent intervention on infant‐feeding practices to usual care (Watt 2009). Three trials were conducted in a preschool setting; one trial compared a parent education intervention on dietary knowledge and changing habits to control (Roset‐Salla 2016), one trial compared a parent intervention including a poster with guidelines and tips, and tailored feedback about child dietary behaviours versus control (Verbestel 2014), and the third trial compared a parent intervention including a resource kit and telephone calls to improve parent knowledge and skills about the home food environment versus control (Wyse 2012). One trial conducted in both a home and health setting compared a parent complementary feeding intervention to parent complementary feeding and home visit intervention to control (Vazir 2013). One trial compared a paediatrician counselling and home‐based programme delivered to parents of children at risk of obesity compared to a safety and injury prevention control (Sherwood 2015).
Multicomponent interventions
Nine studies tested the impact of multicomponent interventions (e.g. teacher and parent education, preschool policy changes) in increasing children's intake of fruit or vegetables (De Bock 2012; De Coen 2012; Namenek Brouwer 2013; Natale 2014a; Nicklas 2017; Smith 2017; Vereecken 2009; Williams 2014; Witt 2012). Four trials were conducted in a preschool setting; one trial compared an intervention combining familiarisation, preparation and cooking of meals with children, teachers and parents and parent education regarding modelling and nutrition needs of children to control (De Bock 2012); one trial compared a garden‐based intervention and curriculum materials about targeted fruits or vegetables to control (Namenek Brouwer 2013); one trial compared a teacher curriculum, parent curriculum, and preschool policy intervention to control (Natale 2014a); and the fourth trial compared a nutrition education intervention targeting children, parents and preschool staff to control (Williams 2014). Two trials were conducted in a school setting; one trial compared a community, school and parent intervention for nutrition and physical activity health targets to control (De Coen 2012); and the other trial compared a preschool environment, child, parent and teacher intervention to control (Vereecken 2009). One trial, conducted in both a school and a home setting, compared an interactive education intervention about physical activity and healthful eating inclusive of teacher guides and parent newsletters to control (Witt 2012). An additional trial, conducted in both a preschool and a home setting, compared a motivational theatre intervention which included the screening of four DVDs of a puppet show aimed at persuading children to increase vegetable consumption, and provision of resources to parents including ingredients for a vegetable snack, to a no‐intervention control (Nicklas 2017). One trial conducted in both a preschool and home setting compared provision of fruit and vegetables for consumption at home to a parent and child nutrition education with fruit and vegetable provision and a no‐intervention control (Smith 2017).
Child nutrition education interventions
One study tested the impact of an intervention involving the delivery of nutrition education to children within nursery classrooms in increasing child fruit and vegetable intake (Baskale 2011).
Excluded studies
Following an assessment of study titles and abstracts for the update, we sought the full texts of 92 records for further review for study eligibility (738 in total, when combined with 646 from previous reviews) (Figure 1). We were able to locate the full texts of 90 articles (708 in total, when combined with 618 from previous reviews). We considered 78 records from 64 studies (594 records from 507 studies in total) to be ineligible in this review update following the trial screening process (reasons for exclusion of records included participants n = 24; outcomes n = 31; comparator n = 2; study design n = 20; intervention n = 1). See Characteristics of excluded studies for further details.
Studies awaiting classification
We did not identify any new studies that we were unable to classify (we had identified two trials in previous reviews, as no full text was available). See Characteristics of studies awaiting classification.
Ongoing studies
We identified 11 ongoing trials with a published protocol (Characteristics of ongoing studies), for which neither published nor unpublished data were available (eight from the previous reviews and three new ongoing trials). These include: a C‐RCT (Belanger 2016) testing the effect of a multicomponent intervention involving community partnerships and healthy eating training for staff in early childcare centres compared to a no‐intervention control; a RCT (Horodynski 2011) testing the effect of a child‐feeding intervention focused on maternal self‐efficacy during feeding and appropriate feeding styles compared to usual care; a C‐RCT (Østbye 2015) testing the effect of a multicomponent home and childcare intervention compared to a no‐intervention control; a RCT (Sobko 2016) testing the effect of a multicomponent healthy lifestyle programme delivered to parent‐child dyads compared to a wait list or a no‐intervention control; a RCT(Watt 2014) testing the effect of a multicomponent intervention involving parents and childcare staff compared to a no‐intervention control; a RCT (Helle 2017) testing the effect of an eHealth intervention delivered to parents to promote healthy food habits to a no‐intervention control; a C‐RCT (Kobel 2017) testing the effect of a kindergarten‐based healthy lifestyle intervention delivered to parents and children to a no‐intervention control; a RCT (Seguin 2017) testing the effect of a community‐based and cost‐offset community‐supported agricultural intervention to a no‐intervention control; a factorial RCT (Brophy‐Herb 2017) testing the effect of 65 differing levels of support for family meals delivered to families recruited from disadvantaged preschools to a no‐intervention control; a C‐RCT (Hennink‐Kaminski 2017) testing the effect of a multicomponent intervention (including social marketing, child healthy eating and physical activity education, and home components) delivered to preschool teachers and parents to a wait‐list control; and a RCT (Mennella 2017) testing the effect of an intervention involving consumption of vegetables during breastfeeding delivered to mothers to a no‐intervention control.
We identified a further five new ongoing trials in trials registries (four from the previous review and one new ongoing trial), however no published protocol, nor published or unpublished data were available (Characteristics of ongoing studies). These include a RCT testing the effect of a repeated‐exposure intervention to an infant feeding‐schedule intervention to a repeated‐exposure and infant‐feeding intervention to attention‐control (NTR6572); a C‐RCT testing the effect of a taste‐exposure intervention to a nutritional‐education intervention to a taste‐exposure and nutritional‐education intervention to a no‐intervention control (NCT03003923); a RCT testing the effect of a parental‐cooking intervention to a no‐intervention control (ISRCTN45864056); a C‐RCT testing the effect of a warm lunch with a variety of vegetables to a sensory lesson, meal practice and feeding‐style intervention to a no‐intervention control (ISRCTN98064772); and a factorial RCT testing the effect of five interventions to increase complementary feeding behaviour by mothers to a no‐intervention control (NCT03229629).
Risk of bias in included studies
None of the 63 included studies were at low risk in all risk‐of‐bias domains (Figure 2; Figure 3).

Risk of bias graph: review authors' judgements about each risk of bias item presented as percentages across all included studies

Risk of bias summary: review authors' judgements about each risk of bias item for each included study
Random sequence generation
We rated 20 of the 63 studies at low risk of bias for random sequence generation, with all random‐number sequences created using various computer‐based software (Campbell 2013; Cooke 2011; Cravener 2015; Daniels 2014; Duncanson 2013; Fildes 2015; Haire‐Joshu 2008; Kling 2016; Martinez‐Andrade 2014; Namenek Brouwer 2013; Roe 2013; Skouteris 2015; Spill 2010; Spill 2011a; Spill 2011b; Staiano 2016; Vazir 2013; Vereecken 2009; Watt 2009; Wyse 2012). We rated one study (Cohen 1995) at high risk of bias for random sequence generation due to allocation being conducted according to infant's week of birth. The method of sequence generation in the remaining 42 studies was unclear (Anzman‐Frasca 2012; Barends 2013; Baskale 2011; Black 2011; Blissett 2016; Caton 2013; Correia 2014; De Bock 2012; De Coen 2012; de Droog 2014; de Droog 2017; de Wild 2013; de Wild 2015a; de Wild 2015b; de Wild 2017; Fildes 2014; Fisher 2012; Forestell 2007; Gerrish 2001; Harnack 2012; Hausner 2012; Heath 2014; Hetherington 2015; Hunsaker 2017; Keller 2012; Mennella 2008; Natale 2014a; Nicklas 2017; O'Connell 2012; Remington 2012; Remy 2013; Roset‐Salla 2016; Savage 2012; Sherwood 2015; Smith 2017; Sullivan 1994; Tabak 2012; Verbestel 2014; Wardle 2003a; Williams 2014; Witt 2012; Zeinstra 2018).
Allocation
Only five of the 63 studies reported that participant allocation to the experimental group was concealed from those conducting the research (De Bock 2012; Duncanson 2013; Remington 2012; Wardle 2003a; Watt 2009). We judged two studies to have a high risk of selection bias; in one study (de Droog 2017) those responsible for delivering the intervention conducted the allocation and in the other study (Haire‐Joshu 2008), as educators were aware of site allocation when they were enrolling participants to the trial. The remaining 56 studies had an unclear risk of selection bias (Anzman‐Frasca 2012; Barends 2013; Baskale 2011; Black 2011; Blissett 2016; Campbell 2013; Caton 2013; Cohen 1995; Cooke 2011; Correia 2014; Cravener 2015; Daniels 2014; De Coen 2012; de Droog 2014; de Wild 2013; de Wild 2015a; de Wild 2015b; de Wild 2017; Fildes 2014; Fildes 2015; Fisher 2012; Forestell 2007; Gerrish 2001; Harnack 2012; Hausner 2012; Heath 2014; Hetherington 2015; Hunsaker 2017; Keller 2012; Kling 2016; Martinez‐Andrade 2014; Mennella 2008; Namenek Brouwer 2013; Natale 2014a; Nicklas 2017; O'Connell 2012; Remy 2013; Roe 2013; Roset‐Salla 2016; Savage 2012; Sherwood 2015; Skouteris 2015; Smith 2017; Spill 2010; Spill 2011a; Spill 2011b; Staiano 2016; Sullivan 1994; Tabak 2012; Vazir 2013; Verbestel 2014; Vereecken 2009; Williams 2014; Witt 2012; Wyse 2012; Zeinstra 2018).
Blinding
Performance bias
In 28 of the studies, we judged the potential for trial outcomes to be influenced by participants or personnel delivering the intervention to be high, due to the lack of blinding and the method used for outcome assessment (e.g. self‐report) (Anzman‐Frasca 2012; Barends 2013; Baskale 2011; Black 2011; Campbell 2013; Cohen 1995; Daniels 2014; De Bock 2012; De Coen 2012; de Wild 2017; Fildes 2014; Fildes 2015; Gerrish 2001; Haire‐Joshu 2008; Hetherington 2015; Martinez‐Andrade 2014; Natale 2014a; Roset‐Salla 2016; Sherwood 2015; Skouteris 2015; Smith 2017; Tabak 2012; Vazir 2013; Verbestel 2014; Vereecken 2009; Watt 2009; Williams 2014; Wyse 2012). We rated 29 studies at low risk of performance bias, due to blinding or the use of objective outcome assessments, which were unlikely to be influenced by awareness of group allocation (e.g. weighing food on electronic scales) (Blissett 2016; Caton 2013; Cooke 2011; Correia 2014; Cravener 2015; de Droog 2014; de Droog 2017; de Wild 2013; de Wild 2015a; de Wild 2015b; Duncanson 2013; Fisher 2012; Hausner 2012; Heath 2014; Keller 2012; Kling 2016; Namenek Brouwer 2013; O'Connell 2012; Remington 2012; Remy 2013; Roe 2013; Savage 2012; Spill 2010; Spill 2011a; Spill 2011b; Sullivan 1994; Wardle 2003a; Witt 2012; Zeinstra 2018). For the six remaining studies the risk of performance bias was unclear (Forestell 2007; Harnack 2012; Hunsaker 2017; Mennella 2008; Nicklas 2017; Staiano 2016).
Detection bias
We rated 25 studies at high risk of detection bias, due to participants or assessors not being blind to group allocation and the use of self‐report measures (Baskale 2011; Black 2011; Campbell 2013; Cohen 1995; Daniels 2014; De Bock 2012; De Coen 2012; de Wild 2017; Fildes 2014; Forestell 2007; Heath 2014; Hunsaker 2017; Martinez‐Andrade 2014; Namenek Brouwer 2013; Natale 2014a; Roset‐Salla 2016; Sherwood 2015; Skouteris 2015; Smith 2017; Spill 2010; Tabak 2012; Verbestel 2014; Vereecken 2009; Williams 2014; Wyse 2012). Blinding of assessors, or the objective measurement of child's fruit and vegetable intake which is unlikely to be impacted by lack of blinding (e.g. the food was weighed or counted), meant that 31 studies had a low risk of detection bias (Anzman‐Frasca 2012; Blissett 2016; Caton 2013; Cooke 2011; Correia 2014; de Droog 2014; de Droog 2017; de Wild 2013; de Wild 2015a; de Wild 2015b; Duncanson 2013; Fisher 2012; Gerrish 2001; Haire‐Joshu 2008; Hausner 2012; Keller 2012; Kling 2016; Mennella 2008; Nicklas 2017; O'Connell 2012; Remy 2013; Remington 2012; Savage 2012; Spill 2011a; Spill 2011b; Sullivan 1994; Vazir 2013; Wardle 2003a; Watt 2009; Witt 2012; Zeinstra 2018). The remaining seven studies had an unclear risk of detection bias (Barends 2013; Cravener 2015; Fildes 2015; Harnack 2012; Hetherington 2015; Roe 2013; Staiano 2016).
Incomplete outcome data
Eight studies reported no attrition, and therefore had a very low risk of bias (Anzman‐Frasca 2012; Cravener 2015; Gerrish 2001; Nicklas 2017; O'Connell 2012; Savage 2012; Spill 2010; Staiano 2016). A further 22 studies reported a low loss of participants (usually less than 10%) and similar losses across arms and we considered them to be at low risk, too (Barends 2013; Cooke 2011; de Wild 2015a; Fildes 2015; Fisher 2012; Haire‐Joshu 2008; Hausner 2012; Heath 2014; Hetherington 2015; Kling 2016; Namenek Brouwer 2013; Remington 2012; Roe 2013; Sherwood 2015; Skouteris 2015; Smith 2017; Spill 2011b; Sullivan 1994; Tabak 2012; Vazir 2013; Wardle 2003a; Wyse 2012). Twenty‐seven studies had a high risk of bias due to high attrition rates, unequal attrition across experimental arms, or an intention‐to‐treat analysis not being used (Baskale 2011; Blissett 2016; Caton 2013; Correia 2014; Daniels 2014; De Bock 2012; De Coen 2012; de Droog 2017; de Wild 2013; de Wild 2015b; Duncanson 2013; Fildes 2014; Forestell 2007; Hausner 2012; Hunsaker 2017; Keller 2012; Martinez‐Andrade 2014; Mennella 2008; Natale 2014a; Remy 2013; Roset‐Salla 2016; Spill 2011a; Verbestel 2014; Watt 2009; Williams 2014; Witt 2012; Zeinstra 2018). Six studies had an unclear risk of attrition bias (Black 2011; Campbell 2013; Cohen 1995; de Droog 2014; de Wild 2017; Vereecken 2009).
Selective reporting
Most studies had an unclear risk of selective reporting (Anzman‐Frasca 2012; Barends 2013; Baskale 2011; Black 2011; Blissett 2016; Caton 2013; Cohen 1995; Cooke 2011; Correia 2014; Cravener 2015; De Bock 2012; De Coen 2012; de Droog 2014; de Wild 2015a; de Wild 2015b; Fildes 2014; Fildes 2015; Fisher 2012; Forestell 2007; Gerrish 2001; Haire‐Joshu 2008; Harnack 2012; Hausner 2012; Heath 2014; Hetherington 2015; Hunsaker 2017; Keller 2012; Mennella 2008; Natale 2014a; O'Connell 2012; Remington 2012; Roset‐Salla 2016; Savage 2012; Skouteris 2015; Smith 2017; Staiano 2016; Sullivan 1994; Tabak 2012; Vazir 2013; Verbestel 2014; Vereecken 2009; Wardle 2003a; Williams 2014; Witt 2012; Zeinstra 2018). We judged one trial (Campbell 2013) to be at high risk of bias due to outcomes referred to in the protocol not being reported. The remaining 17 studies reported all expected outcomes and we rated them at low risk of bias (Daniels 2014; de Droog 2017; de Wild 2013; de Wild 2017; Duncanson 2013; Kling 2016; Martinez‐Andrade 2014; Namenek Brouwer 2013; Nicklas 2017; Remy 2013; Roe 2013; Sherwood 2015; Spill 2010; Spill 2011a; Spill 2011bWatt 2009; Wyse 2012).
Other potential sources of bias
Of the 32 RCTs, 19 had a low risk of bias (Anzman‐Frasca 2012; Barends 2013; Caton 2013; Cravener 2015; de Droog 2014; de Droog 2017; de Wild 2017; Fildes 2015; Forestell 2007; Gerrish 2001; Heath 2014; Hunsaker 2017; Remington 2012; Savage 2012; Sherwood 2015; Skouteris 2015; Sullivan 1994; Wardle 2003a; Watt 2009), eight had an unclear risk of bias (Black 2011; Blissett 2016; Cohen 1995; Hetherington 2015; Keller 2012; Remy 2013; Staiano 2016; Tabak 2012) and five had a high risk of bias (Daniels 2014; de Wild 2015a; Duncanson 2013; Fildes 2014; Mennella 2008) for other potential sources of bias. One trial did not account for clustering in the analysis, even though the trial protocol said clustering would be accounted for (Daniels 2014). Four trials had a high risk of bias, as they reported baseline imbalances between study groups that were not accounted for in the analysis (de Wild 2015a; Duncanson 2013; Fildes 2014; Mennella 2008).
Of the 21 C‐RCTs, seven had a low risk of bias (Baskale 2011; Campbell 2013; Cooke 2011; Haire‐Joshu 2008; Vazir 2013; Vereecken 2009; Wyse 2012), 12 had unclear risk of bias (De Bock 2012; Fisher 2012; Hausner 2012; Martinez‐Andrade 2014; Namenek Brouwer 2013; Natale 2014a; Nicklas 2017; Roset‐Salla 2016; Smith 2017; Williams 2014; Witt 2012; Zeinstra 2018) and two had high risk of bias (De Coen 2012; Verbestel 2014). Both De Coen 2012 and Verbestel 2014 had high risk of bias due to recruitment bias, as communities were randomised first before schools, childcare centres and participants were invited to participate.
Of the 10 cross‐over trials, nine had a low risk of bias (Correia 2014; de Wild 2013; de Wild 2015b; Harnack 2012; Kling 2016; Roe 2013; Spill 2010; Spill 2011a; Spill 2011b), and one study had high risk of bias (O'Connell 2012), due to differences in baseline vegetable consumption that were not adjusted for in the analysis.
Effects of interventions
See: Summary of findings for the main comparison Child feeding interventions compared to no intervention for children aged five years and under; Summary of findings 2 Parent nutrition education interventions compared to no intervention for children aged five years and under; Summary of findings 3 Multicomponent interventions compared to no intervention for children aged five years and under; Summary of findings 4 Child nutrition education interventions compared to no intervention for children aged five years and under
Primary outcome. Effectiveness of interventions in increasing the consumption of fruit and/or vegetables
All the included trials reported the impact of the effectiveness of the intervention on a measure of children's fruit or vegetable intake. Variability in the measurement and reporting of intervention effects as change from baseline or final value scores precluded statistical examination of heterogeneity. Nonetheless, examination of the interventions tested, trial settings and study populations suggested that the included trials were heterogeneous and we conducted meta‐analyses pooling data from trials where we considered interventions to be similar. Otherwise, we have provided a narrative synthesis of trial findings.
Child‐feeding practice interventions
Short‐term impact (less than 12 months)
The effects of interventions targeting child‐feeding practices were mixed. Meta‐analysis pooling post‐intervention data (follow‐up period range: immediate to six months) from trials comparing child‐feeding practices to no treatment (Cohen 1995; Cooke 2011; Cravener 2015; Daniels 2014; Fildes 2014; Fildes 2015; Hetherington 2015; Keller 2012; O'Connell 2012; Remington 2012; Staiano 2016; Wardle 2003a; Zeinstra 2018) revealed an overall small positive effect on vegetable consumption (SMD 0.33, 95% CI 0.13 to 0.54; participants = 1741; studies = 13; I2 = 70%; very low‐quality evidence; Analysis 1.1), which was equivalent to an increase of 3.50 g as‐desired consumption of vegetables. Results were similar in sensitivity analyses of studies at low risk of bias (SMD 0.23, 95% CI 0.03 to 0.44; participants = 487; studies = 5; I2 = 14%; Analysis 1.2), of studies with a primary outcome of child fruit or vegetable consumption (SMD 0.45, 95% CI 0.19 to 0.70; participants = 1331; studies = 10; I2 = 73%; Analysis 1.3), and of studies with no or low attrition and studies with high attrition that undertook intention‐to‐treat analyses (SMD 0.29, 95% CI 0.10 to 0.48; participants = 757; studies = 8; I2 = 27%; Analysis 1.4).
One study that compared one or more child‐feeding practice interventions to a no‐treatment control did not report sufficient data to enable pooling. Harnack 2012 reported a significant increase in intake of fruit compared to a control group for an intervention where fruit and vegetables were served prior to a meal.
Twenty‐five trials compared the effectiveness of two or more child‐feeding interventions but we could not synthesise them in meta‐analyses due to variability in the compared interventions (Anzman‐Frasca 2012; Barends 2013; Blissett 2016; Caton 2013; Correia 2014; de Droog 2014; de Droog 2017; de Wild 2013; de Wild 2015a; de Wild 2015b; de Wild 2017; Fisher 2012; Forestell 2007; Gerrish 2001; Hausner 2012; Heath 2014; Kling 2016; Mennella 2008; Remy 2013; Roe 2013; Savage 2012; Spill 2010; Spill 2011a; Spill 2011b; Sullivan 1994). The interventions compared in these trials varied greatly; 10 of the 25 trials reported evidence of an increase in fruit or vegetable consumption for one intervention compared to another (de Droog 2014; de Droog 2017; de Wild 2013; Forestell 2007; Gerrish 2001; Heath 2014; Roe 2013; Spill 2010; Spill 2011a; Spill 2011b).
Long‐term impact (12 months or longer)
Two studies tested the long term effect of a child‐feeding practice intervention. One study reported no long‐term effect on either fruit or vegetable intake as measured by 24‐hour recall 3½ years after a complementary feeding intervention compared to usual care (Daniels 2014). The other study (Cohen 1995), which compared exclusive breastfeeding, complementary feeding with breastfeeding, and complementary feeding with breastfeeding on demand reported no difference between groups at 12 months' follow‐up compared to the positive effect that was reported at nine months' follow‐up.
Parent nutrition education interventions
Short‐term impact (less than 12 months)
Interventions targeting parent nutrition education were generally not effective. Meta‐analysis pooling post‐intervention data (follow‐up period range: immediate to six months) from trials comparing parent nutrition education interventions to no treatment (Campbell 2013; Duncanson 2013; Haire‐Joshu 2008; Martinez‐Andrade 2014; Roset‐Salla 2016; Sherwood 2015; Skouteris 2015; Tabak 2012; Verbestel 2014; Watt 2009; Wyse 2012) revealed no overall effect on child consumption of fruit and vegetables (SMD 0.12, 95% CI ‐0.03 to 0.28; participants = 3078; studies = 11; I2 = 69%; very low‐quality evidence; Analysis 2.1). Results were similar in sensitivity analyses of studies with a primary outcome of children's fruit or vegetable consumption (SMD 0.04, 95% CI ‐0.08 to 0.16; participants = 2792; studies = 8; I2 = 46%; Analysis 2.2), and of studies with no or low attrition and studies with high attrition that undertook intention‐to‐treat analyses (SMD 0.12, 95% CI ‐0.00 to 0.24; participants = 2518; studies = 7; I2 = 40%; Analysis 2.3). We did not conduct sensitivity analyses by risk of bias, as we judged all studies to be at high risk of bias in at least one domain.
We were unable to pool three trials in the meta‐analysis. Black 2011 found an intervention targeting parent responsivity and behaviour management to be effective in increasing total fruit intake compared to control. Hunsaker 2017 found a parent health report on fruit and vegetable consumption to be effective in increasing total vegetable intake (but not fruit intake) compared to control. Vazir 2013 reported both the parent complementary‐feeding intervention and a parent complementary‐feeding and home‐visit intervention to be effective in increasing both fruit and vegetable intake compared to control.
Long‐term impact (12 months or longer)
Four studies reported the long‐term impact of a parent nutrition education intervention (Duncanson 2013; Skouteris 2015; Watt 2009; Wyse 2012). Of these, only one trial reported a significant long‐term effect on children's fruit and vegetable consumption (Watt 2009). The trial examining the impact of a parent intervention targeting infant‐feeding practice found a short‐term effect at nine months and long‐term effect at 15‐month follow‐up on fruit and vegetable consumption compared to usual care (Watt 2009). The other three trials reporting long‐term impacts of parent interventions either reported a short‐term effect that was not sustained at long‐term follow‐up (Skouteris 2015; Wyse 2012), or no effect at either short‐ or long‐term follow‐up on children's fruit or vegetable consumption (Duncanson 2013).
Multicomponent interventions
Short‐term impact (less than 12 months)
The effects of multicomponent interventions were mixed. Meta‐analysis pooling post‐intervention data (follow‐up period range: immediate to one month) from multicomponent intervention trials (De Coen 2012; Namenek Brouwer 2013; Nicklas 2017; Smith 2017; Williams 2014) revealed an overall small positive effect on child consumption of fruit and vegetables (SMD 0.35, 95% CI 0.04 to 0.66; participants = 2009; studies = 5; I2 = 80%; low‐quality evidence; Analysis 3.1). This was equivalent to an increase of 0.37 cups of fruit and vegetables per day. Results were similar in sensitivity analyses of studies with no or low attrition or high attrition that undertook intention‐to‐treat analyses (SMD 0.65, 95% CI 0.43 to 0.88; participants = 413; studies = 3; I2 = 0%; Analysis 3.3). There was, however, no overall effect on child consumption of fruit and vegetables for studies with a primary outcome of children's fruit or vegetable consumption (SMD 0.44, 95% CI ‐0.00 to 0.87; participants = 1315; studies = 4; I2 = 85%; Analysis 3.2). We did not conduct a sensitivity analysis to examine the impact of high risk of bias, as all but one study had a high risk of bias in at least one domain.
We were unable to pool four studies in meta‐analysis, due to insufficient data (De Bock 2012; Natale 2014a; Vereecken 2009; Witt 2012). Three trials (De Bock 2012; Natale 2014a; Witt 2012) reported significant effects of the interventions tested on both fruit and vegetable consumption, and one trial reported significant effects of the intervention on fruit but not vegetable consumption (Vereecken 2009).
One of the studies (Smith 2017) that was pooled in the multicomponent intervention meta‐analysis additionally compared an intervention of provision of fruit and vegetables to a no‐intervention control group. The study reported a significant effect of the intervention on vegetable consumption.
Long‐term impact (12 months or longer)
No trials testing the multicomponent interventions reported long‐term impact.
Child nutrition education interventions
Short‐term impact (less than 12 months)
The one study that tested the effect of a nutrition education intervention targeting children (Baskale 2011) reported an increase in some of the fruits and vegetables assessed in the intervention group and no significant differences in the control group, but did not report analyses comparing treatment groups (low‐quality evidence).
Long‐term impact (12 months or longer)
The one study that tested the effect of a nutrition education intervention did not report long‐term impact.
Subgroup analyses
Interventions targeting boys and girls
All the included studies in this review covered both boys and girls. The impact of intervention on gender subgroups was not reported in any of the included trials, so subgroup analyses on this basis was not possible.
Interventions targeting minority groups and indigenous populations
Subgroup analysis of trials that targeted minority groups and indigenous populations was not possible, due to the limited number of included studies for each comparison; we therefore present them narratively. Nine of the 63 included trials examined the impact of interventions on predominantly disadvantaged populations (Black 2011; Cohen 1995; Cooke 2011; de Droog 2017; Haire‐Joshu 2008; Natale 2014a; Nicklas 2017; Smith 2017; Watt 2009). Three trials of child‐feeding interventions recruited predominantly disadvantaged populations (Cohen 1995; Cooke 2011; de Droog 2017). One trial recruited participants from low‐income neighbourhoods (Cohen 1995). The trial found that a complementary feeding with breastfeeding on demand intervention increased the consumption of vegetables compared to exclusive breastfeeding at short‐term follow‐up (nine months), but found no effect at long‐term follow‐up (12 months). One trial recruited participants through schools where the proportion of children who had English as a second language, came from minority ethnic backgrounds or were eligible for free school meals was above average (Cooke 2011). The study demonstrated that repeated food exposure coupled with reward significantly increased the consumption of a target vegetable. The third trial recruited participants predominantly from low socioeconomic status households (de Droog 2017). The study found an interactive‐reading intervention significantly increased the consumption of a target vegetable. Three trials of parent interventions recruited participants from disadvantaged communities including underserved families, single or minority parent homes, those living in poverty or low‐income families (Black 2011; Haire‐Joshu 2008; Watt 2009). Two trials found no improvement in overall child fruit or vegetable intake based on the primary trial outcome measures (Haire‐Joshu 2008; Watt 2009); the other trial found the intervention targeting parent responsivity and behaviour management to be effective in increasing total fruit intake (Black 2011). Three trials of multicomponent interventions recruited participants from subsidised childcare centres (Natale 2014a; Nicklas 2017; Smith 2017). One trial found an intervention targeting teachers, parents and childcare policies to increase both fruit and vegetable consumption (Natale 2014a), one trial found a theatre performance intervention involving both parents and teachers increased vegetable consumption (Nicklas 2017), and the other trial found both a fruit and vegetable provision intervention and an intervention involving parent and child nutrition education plus fruit and vegetable provision increased fruit and vegetable consumption (as assessed via skin carotenoid levels compared to a no intervention control (Smith 2017).
Interventions delivered in various settings
Subgroup analyses of child‐feeding practice interventions by setting revealed an overall positive effect on children's vegetable consumption for those interventions delivered in home settings (SMD 0.56, 95% CI 0.18 to 0.95; participants = 474; studies = 4) and in both home and laboratory settings (SMD 0.74, 95% CI 0.09 to 1.39; participants = 40; studies = 2), but no overall effect for those interventions delivered in school or preschool settings (SMD 0.20, 95% CI ‐0.01 to 0.41; participants = 591; studies = 4). Subgroup analyses for other settings (including one set in child health clinics, and one in home or health facilities) was not possible due to the limited number of studies for each setting.
Similar to the main analysis, subgroup analyses of parent nutrition education interventions by setting revealed no overall effect for those interventions delivered in a home setting (SMD 0.06, 95% CI ‐0.16 to 0.27; participants = 2047; studies = 5) or a preschool setting (SMD 0.43, 95% CI ‐0.27 to 1.13; participants = 243; studies = 2). Subgroup analyses for other settings (one each in parenting groups, primary care clinics or community health centres) was not possible, due to the limited number of studies for each setting.
In contrast to the main analysis, subgroup analyses of multicomponent interventions by setting revealed no overall effect for those interventions delivered in school or preschool settings (SMD 0.07, 95% CI ‐0.07 to 0.20; participants = 1608; studies = 3). Subgroup analyses for interventions delivered in either a preschool or a home setting, or clinic and home setting were not possible, due to the limited number of studies for each setting.
Interventions of varying intensities
We did not conduct subgroup analyses of trials based on interventions of varying intensities, due to the limited information across included studies about the number and duration of intervention contacts or components.
Interventions delivered in different modalities
Forty‐eight of the 63 trials used face‐to‐face intervention delivery only (Anzman‐Frasca 2012; Barends 2013; Baskale 2011; Black 2011; Blissett 2016; Caton 2013; Cohen 1995; Cooke 2011; Correia 2014; Cravener 2015; Daniels 2014; De Bock 2012; de Droog 2014; de Droog 2017; de Wild 2013; de Wild 2015a; de Wild 2015b; de Wild 2017; Fildes 2014; Fisher 2012; Forestell 2007; Gerrish 2001; Harnack 2012; Hausner 2012; Heath 2014; Hetherington 2015; Keller 2012; Kling 2016; Martinez‐Andrade 2014; Mennella 2008; Namenek Brouwer 2013; O'Connell 2012; Remington 2012; Remy 2013; Roe 2013; Roset‐Salla 2016; Savage 2012; Skouteris 2015; Spill 2010; Spill 2011a; Spill 2011b; Sullivan 1994; Vazir 2013; Verbestel 2014; Wardle 2003a; Watt 2009; Witt 2012; Zeinstra 2018), reporting mixed findings. Similar to the overall analyses, subgroup analysis of face‐to‐face‐delivered child‐feeding practice interventions versus control revealed an overall positive intervention effect on vegetable consumption (SMD 0.32, 95% CI 0.09 to 0.56; participants = 1489; studies = 11; Analysis 1.5).
Face‐to‐face‐delivered parent nutrition education interventions versus control revealed no overall intervention effect on children's fruit and vegetable consumption (SMD 0.12, 95% CI ‐0.20 to 0.45; participants = 826; studies = 5; Analysis 2.4). Face‐to‐face intervention delivery alone was used in only one multicomponent intervention (Namenek Brouwer 2013) and the only child nutrition education intervention (Baskale 2011), for which mixed results were reported.
Subgroup analysis for other modalities was not possible due to the limited number of included studies for each comparison. Ten trials used face‐to‐face in combination with other strategies: computer‐tailored newsletters and storybooks (Haire‐Joshu 2008); school‐based education, training, policy and environment change (Vereecken 2009); visual and written materials (Campbell 2013); educational materials, resources (posters, brochures) and letters (De Coen 2012); a leaflet (Fildes 2015); newsletters and menu modification (Natale 2014a); printed materials and resources (Williams 2014); telephone and written materials (Sherwood 2015), written materials and provision of fruit and vegetables (Smith 2017), and DVD (Nicklas 2017). Two trials used audio/visual only: DVDs (Staiano 2016) and DVD and CD (Duncanson 2013). A further two trials used telephone and mail (Tabak 2012; Wyse 2012). One trial used written materials only (Hunsaker 2017). Trials that incorporated other intervention modalities reported mixed findings.
Secondary outcome 1. Cost or cost effectiveness of interventions to increase the consumption of fruit or vegetables or both
Information about intervention costs was reported in one trial (Campbell 2013; very low‐quality evidence). The parent nutrition education trial reported the total estimated cost of delivering a parent intervention for infant feeding, physical activity and sedentary behaviours delivered by a dietitian as approximately AUD 500 per family.
Secondary outcome 2. Adverse effects of interventions to increase the consumption of fruit or vegetables or both
Two trials reported information on any adverse events or unintended adverse consequences of the intervention. One child‐feeding practice intervention trial (Spill 2011a; very low‐quality evidence) reported no adverse effects on the amount of the meal consumed following implementation of an intervention involving incorporation of vegetable puree into meals at three different levels of energy density. The other trial, on parent nutrition education, (Wyse 2012; very low‐quality evidence) reported no adverse effect on family food expenditure following implementation of a multicomponent intervention delivered over the telephone to improve parental knowledge and skills about the home food environment.
Discusión
Resumen de los resultados principales
En concordancia con la importancia de estimular el consumo de frutas y vegetales en los niños en la primera infancia, esta revisión actualizada ha identificado varios ECA nuevos de intervenciones que investigan este comportamiento de salud. Los resultados indican que las prácticas de alimentación infantil y las intervenciones de componentes múltiples dirigidas al consumo de frutas y vegetales en niños de cinco años de edad o menos son efectivas. La mayoría de los estudios incluidos examinaron prácticas específicas de alimentación infantil; aunque el metanálisis de 13 de los 39 ensayos indicó que estas intervenciones fueron efectivas, de manera colectiva los resultados de estas intervenciones fueron contradictorios. La segunda y tercera intervención más frecuente fue la educación nutricional de los padres y las intervenciones de componentes múltiples, para las que se encontró evidencia de efecto a corto plazo en los metanálisis para las intervenciones de componentes múltiples pero no para las intervenciones nutricionales en los padres. Solo un ensayo evaluó el efecto de una intervención de educación nutricional en niños. En general los análisis de subgrupos sobre la base del contexto y la modalidad fueron compatibles con los análisis principales para las prácticas de alimentación infantil, la educación nutricional de los padres y las intervenciones de componentes múltiples. No hubo evidencia suficiente disponible para determinar la efectividad a largo plazo de todos los enfoques, o la efectividad en función de los costos o cualquier consecuencia adversa de las intervenciones que se probaron.
Compleción y aplicabilidad general de las pruebas
La actualización de la revisión identificó algunos ECA recién publicados, que coinciden con los esfuerzos a nivel global para aumentar la ingesta de frutas y vegetales (World Health Organization 2003). Dichos estudios se centran predominantemente en los determinantes del consumo de frutas y vegetales, como el conocimiento y las aptitudes acerca de la nutrición, así como los ambientes alimentarios. Solo uno de los ensayos incluidos en esta revisión informó análisis de costos y solo dos informaron cualquier efecto adverso no intencional. Estos factores son consideraciones importantes para el personal de salud y los elaboradores de políticas, pero no se suelen informar en los ensayos aleatorios (Waters 2011), ni se examinan en las revisiones sistemáticas (Hopewell 2008; Wolfenden 2010b).
Además, el número limitado de ensayos relevantes identificados para inclusión también impidió el examen minucioso de la repercusión de las intervenciones según el género, las poblaciones indígenas o desfavorecidas, el contexto, la intensidad variable y la modalidad. Se encontraron varios protocolos de ensayos (ver Características de los estudios en curso) que pueden abordar algunas de estas brechas en la bibliografía, y que es probable que sean elegibles para inclusión en las actualizaciones futuras de la revisión, incluido un ensayo controlado aleatorio de una intervención domiciliaria de ocho lecciones a padres económica y educacionalmente desfavorecidos de niños con edades de uno a tres años (Horodynski 2011).
La validez externa de los resultados de la revisión es limitada. La mayoría de los ensayos se realizaron en los Estados Unidos, Europa occidental o el Reino Unido. El desgaste en los estudios varió del 0% al 68%.
Calidad de la evidencia
Se utilizó el enfoque GRADE para evaluar la calidad de la evidencia para el resultado primario ingesta de frutas y vegetales, que se realizó por separado para cada tipo de intervención. Ver Resumen de los hallazgos, tabla 1; Resumen de los hallazgos, tabla 2; Resumen de los hallazgos, tabla 3; Resumen de los hallazgos, tabla 4. La calidad de la evidencia para la ingesta de frutas y vegetales en los tipos de intervención varió de muy baja a baja. La calidad de la evidencia para las intervenciones específicas de alimentación infantil se valoró como muy baja, y se disminuyó por la heterogeneidad no explicada, las limitaciones metodológicas y la alta probabilidad de sesgo de publicación (Resumen de los hallazgos Tabla 1). Las limitaciones metodológicas relacionadas con la ocultación de la asignación y el informe selectivo tuvieron riesgo de sesgo incierto o alto en la mayoría de los ensayos. Hubo una alta probabilidad de sesgo de publicación relacionado con los relativamente pocos ensayos incluidos en el metanálisis (12 de 39 ensayos) y la inspección de los gráficos en embudo (Figura 4). La calidad de la evidencia para las intervenciones de educación nutricional de los padres se evaluó como muy baja, y se disminuyó por la heterogeneidad no explicada, las limitaciones metodológicas y la imprecisión (Resumen de los hallazgos Tabla 2; Figura 5). Las limitaciones metodológicas se relacionaron con que la mayoría de los ensayos tuvieron alto riesgo de sesgo por falta de cegamiento y riesgo incierto o alto para la ocultación de la asignación, las pérdidas durante el seguimiento y el informe selectivo. La imprecisión se relacionó con los intervalos de confianza que cruzaron el valor nulo de cero. La calidad de la evidencia para las intervenciones de componentes múltiples se consideró baja, y se disminuyó por la heterogeneidad no explicada y las limitaciones metodológicas (Resumen de los hallazgos Tabla 3; Figura 6). Las limitaciones metodológicas se relacionaron con que la mayoría de los ensayos tuvieron alto riesgo de sesgo por falta de cegamiento y riesgo incierto o alto para la ocultación de la asignación, las pérdidas durante el seguimiento y el informe selectivo. Estas evaluaciones indican que el efecto real puede ser significativamente diferente de los efectos de la intervención informados en la revisión, y que es muy probable que los estudios de investigación futuros cambien la estimación para la alimentación infantil específica y la educación nutricional de los padres, y que es probable que cambien la estimación para las intervenciones de componentes múltiples. La calidad de la evidencia para las intervenciones nutricionales en niños del único estudio incluido se consideró baja, y se disminuyó por las limitaciones metodológicas y la imprecisión (Resumen de los hallazgos Tabla 4). Las limitaciones metodológicas se relacionaron con el alto riesgo de sesgo debido a la falta de cegamiento y las pérdidas durante el seguimiento, y la imprecisión se relacionó con el tamaño de la muestra de menos de 400 participantes. Es probable que los estudios de investigación futuros cambien la estimación para las intervenciones de nutrición infantil.
Sesgos potenciales en el proceso de revisión
La revisión utilizó una metodología integral y rigurosa, e incluyó una estrategia de búsqueda amplia, el cribado de los ensayos y la extracción de los datos por dos autores de la revisión independientes y la evaluación del riesgo de sesgo en los estudios incluidos. Además, la revisión no limitó las publicaciones por el idioma. Sin embargo, vale la pena señalar tres aspectos del sesgo de selección. Primero, se excluyeron los ensayos en los que la ingesta de frutas y vegetales no se consideró un resultado primario del ensayo para evitar cualquier posible efecto de confusión de otras intervenciones conductuales (como la actividad física). Esta limitación puede dar lugar a la sobrestimación de los efectos de la intervención si en la práctica se administra en el contexto de otras iniciativas de salud. Segundo, la inclusión de ensayos que no declararon explícitamente un resultado primario pero sí evaluaron la ingesta de frutas o vegetales en la revisión puede haber sesgado los resultados. Sin embargo, los análisis de sensibilidad que excluyeron los estudios que no declararon la ingesta de frutas y vegetales como un resultado primario indicaron que dicho sesgo fue limitado porque los resultados fueron similares. Tercero, los estudios que se realizaron predominantemente en poblaciones desfavorecidas se incluyeron en la síntesis general. Es posible que los efectos de las intervenciones probadas difieran entre las poblaciones desfavorecidas, lo que en general puede limitar la generalizabilidad de los resultados de la revisión. Finalmente, la revisión se limitó a ECA y ensayos cruzados, y los ensayos incluidos en la revisión tendieron a centrarse en las intervenciones dirigidas a los determinantes del consumo de frutas y vegetales como el conocimiento y las aptitudes acerca de la nutrición, o el ambiente alimentario de los contextos. Se pueden haber pasado por alto otros ensayos dirigidos a la ingesta de frutas y vegetales que pueden ser menos susceptibles a evaluación mediante diseños controlados aleatorios, como los que requieren cambios macroambientales.
Acuerdos y desacuerdos con otros estudios o revisiones
Los resultados contradictorios de las intervenciones de alimentación infantil, como la exposición repetida a los alimentos, son similares en parte a los de revisiones anteriores. Una revisión sistemática antigua de intervenciones de alimentación sana para niños de menos de cinco años de edad (Tedstone 1998), publicada por la Health Education Authority, concluyó que la exposición repetida a los alimentos es efectiva para mejorar la voluntad de los niños de consumir alimentos nuevos siempre que se incluya la degustación como parte de la exposición. La mejoría en la aceptación de los alimentos después de la exposición repetida a los alimentos también se ha informado en otras revisiones y ensayos controlados (Contento 1995). Como señala Cooke 2011 en la revisión de los antecedentes de los estudios de investigación para su ensayo aleatorio, la evidencia acerca del uso de recompensas para estimular el consumo de alimentos objetivo en los niños parece más contradictoria. Sin embargo, la repercusión positiva de las recompensas sociales e intangibles informadas en Cooke 2011, fue consistente con ensayos anteriores realizados en contextos comunitarios que utilizaron recompensas tangibles no alimentarias y recompensas sociales dirigidas a la ingesta de frutas o vegetales en niños en edad escolar (Hendy 1999). El gran número de ensayos que comparan intervenciones de prácticas de alimentación infantil alternativas y heterogéneas es difícil de interpretar porque no incluyeron un grupo control ningún tratamiento y pocos informaron que una intervención fue más efectiva que otra.
Los resultados en gran parte nulos de esta revisión para la repercusión de las intervenciones en los padres son consistentes con los informados en revisiones anteriores de intervenciones alimentarias. Por ejemplo, una revisión integral de la repercusión de los programas de visitas domiciliarias administrados a los padres concluyó que había poca evidencia para recomendar dichas intervenciones como una forma de mejorar la dieta de los niños, debido a los resultados contradictorios de los estudios examinados (Elkan 2000). Entre los ensayos con un efecto positivo de la intervención incluidos en la revisión Elkan 2000 estuvo un estudio pre‐post de una intervención intensiva proporcionada a madres de bajos ingresos de niños con edades entre uno y cuatro años (James 1992). En este estudio, los médicos generales adiestrados por dietistas y los visitantes sanitarios proporcionaron asesoría y apoyo como parte de una intervención de atención primaria de visita domiciliaria que duró hasta 20 semanas. Se informaron mejorías postintervención en la dieta, incluido el consumo de frutas y vegetales. De igual manera, una revisión sistemática que examinó la efectividad de las intervenciones en los padres sobre los regímenes de alimentación en los niños de dos a cinco años de edad encontró resultados contradictorios para los regímenes alimentarios o las prácticas de alimentación infantil o ambos (Peters 2012).
Los hallazgos positivos de las intervenciones de componentes múltiples son consistentes con algunas revisiones anteriores de intervenciones. Por ejemplo, una revisión sistemática de intervenciones para mejorar la dieta, la actividad física o para prevenir el aumento de peso en niños de cinco años o menos, y que incluyó diseños aleatorios y no aleatorios, identificó nueve estudios de intervenciones implementadas en el contexto prescolar o de atención infantil (Hesketh 2010). Tres estudios incluyeron alguna evaluación del resultado dietético. En el primero, centros prescolares de Head Start se asignaron a una intervención de menús para reducir el contenido de grasa de las comidas proporcionadas a los niños en el centro; la misma intervención de menús más educación nutricional; o una tercera condición control de atención habitual (Williams 2004). Ambos brazos de intervención del ensayo redujeron el contenido de grasa de los alimentos servidos a los niños en comparación con los centros prescolares en la condición control. Los otros dos ensayos evaluaron la repercusión de una alimentación sana y un programa de actividad física de prevención de la obesidad "‘Hip‐Hop to Health Jr", implementados en dos poblaciones diferentes que asistían a centros prescolares de Head Start (Fitzgibbon 2005; Fitzgibbon 2006). En Fitzgibbon 2005, los niños de la intervención informaron menos ingesta de grasas saturadas al seguimiento del año, pero no en la grasa total ni en la fibra dietética. No se informaron mejorías en la ingesta dietética en el segundo ensayo (Fitzgibbon 2006). De manera similar, las revisiones sistemáticas de intervenciones de frutas y vegetales en la escuela han concluido con frecuencia que las iniciativas de componentes múltiples son las más efectivas para aumentar el consumo de frutas y vegetales en los niños de más edad, pero estos efectos solo son moderados y se ha informado que están regidos en su mayoría por el aumento de la ingesta de frutas (Burchett 2003; Ciliska 2000; French 2003; Knai 2006). Una revisión sistemática de intervenciones en escuelas europeas también concluyó que las intervenciones de componentes múltiples son efectivas para mejorar la ingesta de frutas y vegetales en niños (Van Cauwenberghe 2010).
A diferencia de los resultados de esta revisión, algunas otras revisiones han encontrado que las intervenciones de componentes múltiples no son efectivas. Un metanálisis reciente no indicó diferencias significativas entre las intervenciones de componentes múltiples que promovieron el consumo de frutas y vegetales y las condiciones control en un contexto de escuela primaria (Delgado‐Noguera 2011). Otra revisión sistemática que se centró en la ingesta de frutas y vegetales en niños de cinco a 12 años de edad encontró que las intervenciones en la escuela solo tuvieron un efecto mínimo sobre el consumo de vegetales, a la vez que encontraron una repercusión moderada sobre la ingesta de frutas en niños (Evans 2012). Una revisión sistemática reciente que examinó intervenciones dirigidas a aumentar la ingesta de vegetales en niños (de dos a 12 años de edad) en contextos domiciliarios y comunitarios encontró que solo una minoría de las intervenciones dirigidas a la ingesta de vegetales sola en niños fueron efectivas a corto plazo (Hendrie 2017). Por el contrario, cuando la ingesta de vegetales se abordó como parte de una dieta saludable o una intervención en el estilo de vida, la mayoría de las intervenciones mostraron efectividad a corto plazo (Hendrie 2017). La comparación de los resultados de esta revisión con cada una de estas revisiones anteriores de intervenciones de componentes múltiples está limitada por la inclusión de niños de más edad, lo que puede explicar los resultados contradictorios.

Study flow diagram

Risk of bias graph: review authors' judgements about each risk of bias item presented as percentages across all included studies

Risk of bias summary: review authors' judgements about each risk of bias item for each included study

Funnel plot of comparison 1. Short‐term impact (< 12 months) of child‐feeding intervention versus no intervention on child consumption of target fruit or vegetable, outcome 1.1, fruit and/or vegetable intake

Funnel plot of comparison 3. Short‐term impact (< 12 months) of parent nutrition education intervention versus usual care, outcome 3.1, fruit and/or vegetable intake

Funnel plot of comparison 4. Short‐term impact (< 12 months) of multicomponent intervention versus usual care, outcome 4.1, fruit and/or vegetable intake

Comparison 1 Short‐term impact (< 12 months) of child‐feeding intervention versus no intervention, Outcome 1 Vegetable intake.

Comparison 1 Short‐term impact (< 12 months) of child‐feeding intervention versus no intervention, Outcome 2 Vegetable intake ‐ sensitivity analysis ‐ risk of bias.

Comparison 1 Short‐term impact (< 12 months) of child‐feeding intervention versus no intervention, Outcome 3 Vegetable intake ‐ sensitivity analysis ‐ primary outcome.

Comparison 1 Short‐term impact (< 12 months) of child‐feeding intervention versus no intervention, Outcome 4 Vegetable intake ‐ sensitivity analysis ‐ missing data.

Comparison 1 Short‐term impact (< 12 months) of child‐feeding intervention versus no intervention, Outcome 5 Vegetable intake ‐ subgroup analysis ‐ modality.

Comparison 1 Short‐term impact (< 12 months) of child‐feeding intervention versus no intervention, Outcome 6 Vegetable intake ‐ subgroup analysis ‐ setting.

Comparison 2 Short‐term impact (< 12 months) of parent nutrition education intervention versus no intervention, Outcome 1 Fruit and vegetable intake.

Comparison 2 Short‐term impact (< 12 months) of parent nutrition education intervention versus no intervention, Outcome 2 Fruit and vegetable intake ‐ sensitivity analysis ‐ primary outcome.

Comparison 2 Short‐term impact (< 12 months) of parent nutrition education intervention versus no intervention, Outcome 3 Fruit and vegetable intake ‐ sensitivity analysis ‐ missing data.

Comparison 2 Short‐term impact (< 12 months) of parent nutrition education intervention versus no intervention, Outcome 4 Fruit and vegetable intake ‐ subgroup analysis ‐ modality.

Comparison 2 Short‐term impact (< 12 months) of parent nutrition education intervention versus no intervention, Outcome 5 Fruit and vegetable intake ‐ subgroup analysis ‐ setting.
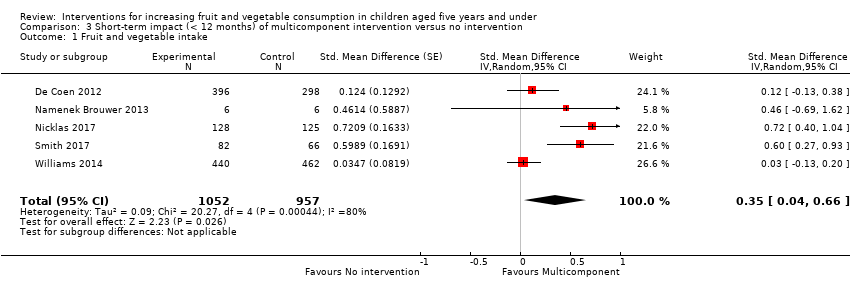
Comparison 3 Short‐term impact (< 12 months) of multicomponent intervention versus no intervention, Outcome 1 Fruit and vegetable intake.

Comparison 3 Short‐term impact (< 12 months) of multicomponent intervention versus no intervention, Outcome 2 Fruit and vegetable intake ‐ sensitivity analysis ‐ primary outcome.

Comparison 3 Short‐term impact (< 12 months) of multicomponent intervention versus no intervention, Outcome 3 Fruit and vegetable intake ‐ sensitivity analysis ‐ missing data.

Comparison 3 Short‐term impact (< 12 months) of multicomponent intervention versus no intervention, Outcome 4 Fruit and vegetable intake ‐ subgroup analysis ‐ setting.
| Child feeding interventions compared to no intervention for children aged five years and under | ||||||
| Patient or population: children aged five years and under | ||||||
| Outcomes | Anticipated absolute effects* (95% CI) | Relative effect | № of participants | Quality of the evidence | Comments | |
| Risk with no intervention | Risk with child‐feeding interventions | |||||
| Short‐term impact (< 12 months) child vegetable intake | The mean as‐desired vegetable intake was 7.7 grams1 | The mean as‐desired vegetable intake (grams) in the intervention group was 3.50 higher (1.38 higher to 5.73 higher) | ‐ | 1741 | ⊕⊝⊝⊝ | Scores estimated using a standardised mean difference of 0.33 (0.13 to 0.54) and a standard deviation of 10.61.1 The mean duration of follow‐up post‐intervention for studies included in the meta‐analysis was 6.2 weeks. Harnack 2012 compared ≥ 1 child‐feeding practice interventions to a no‐treatment control and reported a significant increase in intake of fruit but could not be synthesised in meta‐analysis. |
| Short‐term impact (< 12 months) cost effectiveness ‐ not reported | No child‐feeding interventions reported this outcome | ‐ | ‐ | ‐ | ‐ | |
| Short‐term impact (< 12 months) unintended adverse events | One trial (Spill 2011a) reported no adverse effects on amount of meals consumed | ‐ | 39 | ⊕⊝⊝⊝ | ‐ | |
| *The risk in the intervention group (and its 95% confidence interval) is based on the assumed risk in the comparison group and the relative effect of the intervention (and its 95% CI) | ||||||
| GRADE Working Group grades of evidence | ||||||
| 1We used the post‐intervention mean and standard deviation of the control group from Wardle 2003a for the risk with no intervention and to re‐express the SMD in terms of grams of intake. | ||||||
| Parent nutrition education interventions compared to no intervention for children aged 5 years and under | ||||||
| Patient or population: children aged 5 years and under | ||||||
| Outcomes | Anticipated absolute effects* (95% CI) | Relative effect | № of participants | Quality of the evidence | Comments | |
| Risk with no intervention | Risk with parent nutrition education interventions | |||||
| Short‐term impact (< 12 months) child fruit and vegetable intake | The mean servings of vegetables per day was 1.61 | The mean servings of vegetables per day in the intervention group was 0.12 higher (0.03 lower to 0.28 higher) | ‐ | 3078 | ⊕⊝⊝⊝ | Scores estimated using a standardised mean difference of 0.12 (‐0.03 to 0.28) and a standard deviation of 1.01 The mean duration of follow‐up post‐intervention for studies included in the meta‐analysis was 8.8 weeks. We were unable to pool results of three trials that reported mixed results in the meta‐analysis. One study found a parent‐responsivity and behaviour‐management intervention to be effective in increasing total fruit intake compared to control (Black 2011); one study found a parent health report on fruit and vegetable consumption to be effective in increasing total vegetable intake compared to control, but not fruit (Hunsaker 2017); and the other study found both a parent‐complementary feeding intervention and a parent‐complementary feeding and home‐visit intervention to be effective in increasing both fruit and vegetable intake compared to control (Vazir 2013). |
| Short‐term impact (< 12 months) cost effectiveness | Information regarding intervention costs was reported in 1 trial (Campbell 2013) | ‐ | 389 | ⊕⊝⊝⊝ | ‐ | |
| Short‐term impact (< 12 months) unintended adverse events | One trial (Wyse 2012) reported no adverse effect on family food expenditure | ‐ | 343 | ⊕⊝⊝⊝ | ||
| *The risk in the intervention group (and its 95% confidence interval) is based on the assumed risk in the comparison group and the relative effect of the intervention (and its 95% CI). | ||||||
| GRADE Working Group grades of evidence | ||||||
| 1We used the post‐intervention mean and standard deviation of the control group from Skouteris 2015 for the risk with no intervention and to re‐express the SMD in terms of servings of vegetables per day. | ||||||
| Multicomponent interventions compared to no intervention for children aged 5 years and under | ||||||
| Patient or population: children aged 5 years and under | ||||||
| Outcomes | Anticipated absolute effects* (95% CI) | Relative effect | № of participants | Quality of the evidence | Comments | |
| Risk with no intervention | Risk with multicomponent interventions | |||||
| Short‐term impact (< 12 months) child fruit and vegetable intake | The mean cups of vegetables per day was 1.081 | The mean cups of vegetables per day in the intervention group was 0.37 higher (0.04 higher to 0.69 higher) | ‐ | 2009 | ⊕⊕⊝⊝ | Scores estimated using a standardised mean difference of 0.35 (0.04 to 0.66) and a standard deviation of 1.051 The mean duration of follow‐up post‐intervention for studies included in the meta‐analysis was 1.1 weeks 4 studies could not be pooled in meta‐analysis. 3 reported significant increases in both fruit and vegetable consumption, and 1 significantly increased fruit but not vegetable consumption |
| Short‐term impact (< 12 months) cost effectiveness ‐ not reported | No studies reported this outcome | ‐ | ‐ | ‐ | ‐ | |
| Short‐term impact (< 12 months) unintended adverse events ‐ not reported | No studies reported this outcome | ‐ | ‐ | ‐ | ‐ | |
| *The risk in the intervention group (and its 95% confidence interval) is based on the assumed risk in the comparison group and the relative effect of the intervention (and its 95% CI). | ||||||
| GRADE Working Group grades of evidence | ||||||
| 1We used the post‐intervention mean and standard deviation of the control group from Williams 2014 for the risk with no intervention and to re‐express the SMD in terms of cups vegetables per day. | ||||||
| Child nutrition education interventions compared to no intervention for children aged 5 years and under | ||||||
| Patient or population: children aged 5 years and under | ||||||
| Outcomes | Anticipated absolute effects* (95% CI) | Relative effect | № of participants | Quality of the evidence | Comments | |
| Risk with no intervention | Risk with child nutrition education interventions | |||||
| Short‐term impact (< 12 months) child fruit and vegetable intake | The mean short‐term impact (< 12 months) child vegetable intake frequency score was 4 (a score of 4 corresponds to consumption of vegetables 3 ‐ 4 times per week) | MD 0 | ‐ | 238 | ⊕⊕⊝⊝ | The only study (Baskale 2011) reported an increase in some of the fruits and vegetables assessed in the intervention group and no significant differences in the control group The duration of follow‐up post‐intervention was 8 weeks |
| Cost or cost effectiveness ‐ not reported | No studies reported this outcome | ‐ | ‐ | ‐ | ‐ | |
| Unintended adverse events ‐ not reported | No studies reported this outcome | ‐ | ‐ | ‐ | ‐ | |
| *The risk in the intervention group (and its 95% confidence interval) is based on the assumed risk in the comparison group and the relative effect of the intervention (and its 95% CI). | ||||||
| GRADE Working Group grades of evidence | ||||||
| 1Downgraded one level for risk of bias: high risk of bias due to lack of blinding and loss to follow‐up. | ||||||
| Outcome or subgroup title | No. of studies | No. of participants | Statistical method | Effect size |
| 1 Vegetable intake Show forest plot | 13 | 1741 | Std. Mean Difference (Random, 95% CI) | 0.33 [0.13, 0.54] |
| 2 Vegetable intake ‐ sensitivity analysis ‐ risk of bias Show forest plot | 13 | 1670 | Std. Mean Difference (Random, 95% CI) | 0.33 [0.13, 0.54] |
| 2.1 Low/unclear risk of bias | 5 | 487 | Std. Mean Difference (Random, 95% CI) | 0.23 [0.03, 0.44] |
| 2.2 High risk of bias | 8 | 1183 | Std. Mean Difference (Random, 95% CI) | 0.37 [0.06, 0.68] |
| 3 Vegetable intake ‐ sensitivity analysis ‐ primary outcome Show forest plot | 13 | 1670 | Std. Mean Difference (Random, 95% CI) | 0.33 [0.13, 0.54] |
| 3.1 Primary outcome of child fruit or vegetable intake | 10 | 1331 | Std. Mean Difference (Random, 95% CI) | 0.45 [0.19, 0.70] |
| 3.2 Primary outcome unclear | 3 | 339 | Std. Mean Difference (Random, 95% CI) | 0.03 [‐0.19, 0.24] |
| 4 Vegetable intake ‐ sensitivity analysis ‐ missing data Show forest plot | 13 | 1670 | Std. Mean Difference (Random, 95% CI) | 0.33 [0.13, 0.54] |
| 4.1 Low attrition or high attrition with ITT analysis | 8 | 757 | Std. Mean Difference (Random, 95% CI) | 0.29 [0.10, 0.48] |
| 4.2 High attrition and no ITT analysis | 5 | 913 | Std. Mean Difference (Random, 95% CI) | 0.35 [‐0.10, 0.79] |
| 5 Vegetable intake ‐ subgroup analysis ‐ modality Show forest plot | 13 | 1670 | Std. Mean Difference (Random, 95% CI) | 0.33 [0.13, 0.54] |
| 5.1 Face‐to‐face | 11 | 1489 | Std. Mean Difference (Random, 95% CI) | 0.32 [0.09, 0.56] |
| 5.2 Other modality | 2 | 181 | Std. Mean Difference (Random, 95% CI) | 0.36 [0.06, 0.66] |
| 6 Vegetable intake ‐ subgroup analysis ‐ setting Show forest plot | 13 | 1670 | Std. Mean Difference (Random, 95% CI) | 0.33 [0.13, 0.54] |
| 6.1 School or preschool | 4 | 444 | Std. Mean Difference (Random, 95% CI) | 0.19 [‐0.02, 0.40] |
| 6.2 Home | 4 | 474 | Std. Mean Difference (Random, 95% CI) | 0.56 [0.18, 0.95] |
| 6.3 Home + Lab | 2 | 40 | Std. Mean Difference (Random, 95% CI) | 0.74 [0.09, 1.39] |
| 6.4 Other settings | 3 | 712 | Std. Mean Difference (Random, 95% CI) | 0.06 [‐0.14, 0.26] |
| Outcome or subgroup title | No. of studies | No. of participants | Statistical method | Effect size |
| 1 Fruit and vegetable intake Show forest plot | 11 | 3078 | Std. Mean Difference (Random, 95% CI) | 0.12 [‐0.03, 0.28] |
| 2 Fruit and vegetable intake ‐ sensitivity analysis ‐ primary outcome Show forest plot | 11 | 3078 | Std. Mean Difference (Random, 95% CI) | 0.12 [‐0.03, 0.28] |
| 2.1 Primary outcome of child fruit or vegetable intake | 8 | 2792 | Std. Mean Difference (Random, 95% CI) | 0.04 [‐0.08, 0.16] |
| 2.2 Primary outcome unclear | 3 | 286 | Std. Mean Difference (Random, 95% CI) | 0.52 [0.03, 1.00] |
| 3 Fruit and vegetable intake ‐ sensitivity analysis ‐ missing data Show forest plot | 11 | 3078 | Std. Mean Difference (Random, 95% CI) | 0.12 [‐0.03, 0.28] |
| 3.1 Low attrition or high attrition with ITT analysis | 7 | 2518 | Std. Mean Difference (Random, 95% CI) | 0.12 [‐0.00, 0.24] |
| 3.2 High attrition and no ITT analysis | 4 | 560 | Std. Mean Difference (Random, 95% CI) | 0.07 [‐0.45, 0.59] |
| 4 Fruit and vegetable intake ‐ subgroup analysis ‐ modality Show forest plot | 11 | 3078 | Std. Mean Difference (Random, 95% CI) | 0.12 [‐0.03, 0.28] |
| 4.1 Face‐to‐face only | 5 | 826 | Std. Mean Difference (Random, 95% CI) | 0.12 [‐0.20, 0.45] |
| 4.2 Audio visual only | 2 | 386 | Std. Mean Difference (Random, 95% CI) | 0.40 [‐0.04, 0.85] |
| 4.3 Other modality | 4 | 1866 | Std. Mean Difference (Random, 95% CI) | 0.03 [‐0.16, 0.21] |
| 5 Fruit and vegetable intake ‐ subgroup analysis ‐ setting Show forest plot | 11 | 3078 | Std. Mean Difference (Random, 95% CI) | 0.12 [‐0.03, 0.28] |
| 5.1 Home | 5 | 2047 | Std. Mean Difference (Random, 95% CI) | 0.06 [‐0.16, 0.27] |
| 5.2 Preschool | 2 | 243 | Std. Mean Difference (Random, 95% CI) | 0.43 [‐0.27, 1.13] |
| 5.3 Other settings | 4 | 788 | Std. Mean Difference (Random, 95% CI) | 0.09 [‐0.07, 0.25] |
| Outcome or subgroup title | No. of studies | No. of participants | Statistical method | Effect size |
| 1 Fruit and vegetable intake Show forest plot | 5 | 2009 | Std. Mean Difference (Random, 95% CI) | 0.35 [0.04, 0.66] |
| 2 Fruit and vegetable intake ‐ sensitivity analysis ‐ primary outcome Show forest plot | 5 | 2009 | Std. Mean Difference (Random, 95% CI) | 0.35 [0.04, 0.66] |
| 2.1 Primary outcome of child fruit or vegetable intake | 4 | 1315 | Std. Mean Difference (Random, 95% CI) | 0.44 [‐0.00, 0.87] |
| 2.2 Primary outcome unclear | 1 | 694 | Std. Mean Difference (Random, 95% CI) | 0.12 [‐0.13, 0.38] |
| 3 Fruit and vegetable intake ‐ sensitivity analysis ‐ missing data Show forest plot | 5 | 2009 | Std. Mean Difference (Random, 95% CI) | 0.35 [0.04, 0.66] |
| 3.1 Low attrition or high attrition with ITT analysis | 3 | 413 | Std. Mean Difference (Random, 95% CI) | 0.65 [0.43, 0.88] |
| 3.2 High attrition and no ITT analysis | 2 | 1596 | Std. Mean Difference (Random, 95% CI) | 0.06 [‐0.08, 0.20] |
| 4 Fruit and vegetable intake ‐ subgroup analysis ‐ setting Show forest plot | 5 | 2009 | Std. Mean Difference (Random, 95% CI) | 0.35 [0.04, 0.66] |
| 4.1 School or preschool | 3 | 1608 | Std. Mean Difference (Random, 95% CI) | 0.07 [‐0.07, 0.20] |
| 4.2 Other settings | 2 | 401 | Std. Mean Difference (Random, 95% CI) | 0.66 [0.43, 0.89] |