Interventions for increasing fruit and vegetable consumption in children aged five years and under
Abstract
Background
Insufficient consumption of fruits and vegetables in childhood increases the risk of future non‐communicable diseases, including cardiovascular disease. Interventions to increase consumption of fruit and vegetables, such as those focused on specific child‐feeding strategies and parent nutrition education interventions in early childhood may therefore be an effective strategy in reducing this disease burden.
Objectives
To assess the effectiveness, cost effectiveness and associated adverse events of interventions designed to increase the consumption of fruit, vegetables or both amongst children aged five years and under.
Search methods
We searched CENTRAL, MEDLINE, Embase and two clinical trials registries to identify eligible trials on 25 January 2018. We searched Proquest Dissertations and Theses in November 2017. We reviewed reference lists of included trials and handsearched three international nutrition journals. We contacted authors of included studies to identify further potentially relevant trials.
Selection criteria
We included randomised controlled trials, including cluster‐randomised controlled trials and cross‐over trials, of any intervention primarily targeting consumption of fruit, vegetables or both among children aged five years and under, and incorporating a dietary or biochemical assessment of fruit or vegetable consumption. Two review authors independently screened titles and abstracts of identified papers; a third review author resolved disagreements.
Data collection and analysis
Two review authors independently extracted data and assessed the risks of bias of included studies; a third review author resolved disagreements. Due to unexplained heterogeneity, we used random‐effects models in meta‐analyses for the primary review outcomes where we identified sufficient trials. We calculated standardised mean differences (SMDs) to account for the heterogeneity of fruit and vegetable consumption measures. We conducted assessments of risks of bias and evaluated the quality of evidence (GRADE approach) using Cochrane procedures.
Main results
We included 63 trials with 178 trial arms and 11,698 participants. Thirty‐nine trials examined the impact of child‐feeding practices (e.g. repeated food exposure) in increasing child vegetable intake. Fourteen trials examined the impact of parent nutrition education in increasing child fruit and vegetable intake. Nine studies examined the impact of multicomponent interventions (e.g. parent nutrition education and preschool policy changes) in increasing child fruit and vegetable intake. One study examined the effect of a nutrition education intervention delivered to children in increasing child fruit and vegetable intake.
We judged 14 of the 63 included trials as free from high risks of bias across all domains; performance, detection and attrition bias were the most common domains judged at high risk of bias for the remaining studies.
There is very low quality evidence that child‐feeding practices versus no intervention may have a small positive effect on child vegetable consumption equivalent to an increase of 3.50 g as‐desired consumption of vegetables (SMD 0.33, 95% CI 0.13 to 0.54; participants = 1741; studies = 13). Multicomponent interventions versus no intervention may have a very small effect on child consumption of fruit and vegetables (SMD 0.35, 95% CI 0.04 to 0.66; participants = 2009; studies = 5; low‐quality evidence), equivalent to an increase of 0.37 cups of fruit and vegetables per day. It is uncertain whether there are any short‐term differences in child consumption of fruit and vegetables in meta‐analyses of trials examining parent nutrition education versus no intervention (SMD 0.12, 95% CI ‐0.03 to 0.28; participants = 3078; studies = 11; very low‐quality evidence).
Insufficient data were available to assess long‐term effectiveness, cost effectiveness and unintended adverse consequences of interventions. Studies reported receiving governmental or charitable funds, except for four studies reporting industry funding.
Authors' conclusions
Despite identifying 63 eligible trials of various intervention approaches, the evidence for how to increase children's fruit and vegetable consumption remains limited. There was very low‐ and low‐quality evidence respectively that child‐feeding practice and multicomponent interventions may lead to very small increases in fruit and vegetable consumption in children aged five years and younger. It is uncertain whether parent nutrition education interventions are effective in increasing fruit and vegetable consumption in children aged five years and younger. Given that the quality of the evidence is very low or low, future research will likely change estimates and conclusions. Long‐term follow‐up is required and future research should adopt more rigorous methods to advance the field.
This is a living systematic review. Living systematic reviews offer a new approach to review updating, in which the review is continually updated, incorporating relevant new evidence as it becomes available. Please refer to the Cochrane Database of Systematic Reviews for the current status of this review.
PICO
Plain language summary
Interventions for increasing eating of fruit and vegetables in children aged five years and under
Background
Not eating enough fruit and vegetables is a considerable health burden in developed countries. Eating fruit and vegetables is associated with a reduced risk of future non‐communicable diseases (such as cardiovascular disease). Early childhood represents a critical period for the establishment of dietary habits. Interventions to increase consumption of fruit and vegetables in early childhood may therefore be an effective strategy in reducing this disease burden.
Review question
To assess the impact of interventions designed to increase eating of fruit or vegetables or both among children aged five years and under.
Methods
We searched various electronic databases and relevant journals to find trials. We contacted authors of included trials for additional potentially relevant trials. Any randomised trial (participants have the same chance of being assigned to treatment or control) of interventions aiming to increase the intake of fruit or vegetables or both by children aged five years and under that measured intake was eligible. Two review authors independently searched for and extracted information from studies. The evidence is current to January 2018.
Results
We included 63 trials with 11,698 people taking part. Thirty‐nine trials examined child‐feeding practice interventions (e.g. repeated exposure to vegetables), 14 examined parent nutrition education interventions, nine examined multicomponent interventions (e.g. combining preschool policy changes with parent education) and one examined a child nutrition education intervention. Child‐feeding practice and multicomponent interventions may lead to very small increases in children's intake of fruit and vegetable in the short term (less than 12 months). It is uncertain whether parent nutrition education interventions are effective in increasing children's eating of fruit and vegetables. There was not enough information to assess long‐term effectiveness, cost effectiveness and unintended harms. Studies reporting funding support received governmental or charitable funds, except for four studies that received industry funding.
Conclusions
Child‐feeding practice and multicomponent interventions may increase fruit and vegetable intake by children (by 3.50 g and 0.37 cups per day respectively). This conclusion is based on very low‐ and low‐quality evidence and is very likely to change when future research is undertaken. It is uncertain whether parent nutrition education interventions increase children's fruit and vegetable intake.
This is a living systematic review. Living systematic reviews offer a new approach to review updating, in which the review is continually updated, incorporating relevant new evidence as it becomes available. Please refer to the Cochrane Database of Systematic Reviews for the current status of this review.
Authors' conclusions
Summary of findings
| Child feeding interventions compared to no intervention for children aged five years and under | ||||||
| Patient or population: children aged five years and under | ||||||
| Outcomes | Anticipated absolute effects* (95% CI) | Relative effect | № of participants | Quality of the evidence | Comments | |
| Risk with no intervention | Risk with child‐feeding interventions | |||||
| Short‐term impact (< 12 months) child vegetable intake | The mean as‐desired vegetable intake was 7.7 grams1 | The mean as‐desired vegetable intake (grams) in the intervention group was 3.50 higher (1.38 higher to 5.73 higher) | ‐ | 1741 | ⊕⊝⊝⊝ | Scores estimated using a standardised mean difference of 0.33 (0.13 to 0.54) and a standard deviation of 10.61.1 The mean duration of follow‐up post‐intervention for studies included in the meta‐analysis was 6.2 weeks. Harnack 2012 compared ≥ 1 child‐feeding practice interventions to a no‐treatment control and reported a significant increase in intake of fruit but could not be synthesised in meta‐analysis. |
| Short‐term impact (< 12 months) cost effectiveness ‐ not reported | No child‐feeding interventions reported this outcome | ‐ | ‐ | ‐ | ‐ | |
| Short‐term impact (< 12 months) unintended adverse events | One trial (Spill 2011a) reported no adverse effects on amount of meals consumed | ‐ | 39 | ⊕⊝⊝⊝ | ‐ | |
| *The risk in the intervention group (and its 95% confidence interval) is based on the assumed risk in the comparison group and the relative effect of the intervention (and its 95% CI) | ||||||
| GRADE Working Group grades of evidence | ||||||
| 1We used the post‐intervention mean and standard deviation of the control group from Wardle 2003a for the risk with no intervention and to re‐express the SMD in terms of grams of intake. | ||||||
| Parent nutrition education interventions compared to no intervention for children aged 5 years and under | ||||||
| Patient or population: children aged 5 years and under | ||||||
| Outcomes | Anticipated absolute effects* (95% CI) | Relative effect | № of participants | Quality of the evidence | Comments | |
| Risk with no intervention | Risk with parent nutrition education interventions | |||||
| Short‐term impact (< 12 months) child fruit and vegetable intake | The mean servings of vegetables per day was 1.61 | The mean servings of vegetables per day in the intervention group was 0.12 higher (0.03 lower to 0.28 higher) | ‐ | 3078 | ⊕⊝⊝⊝ | Scores estimated using a standardised mean difference of 0.12 (‐0.03 to 0.28) and a standard deviation of 1.01 The mean duration of follow‐up post‐intervention for studies included in the meta‐analysis was 8.8 weeks. We were unable to pool results of three trials that reported mixed results in the meta‐analysis. One study found a parent‐responsivity and behaviour‐management intervention to be effective in increasing total fruit intake compared to control (Black 2011); one study found a parent health report on fruit and vegetable consumption to be effective in increasing total vegetable intake compared to control, but not fruit (Hunsaker 2017); and the other study found both a parent‐complementary feeding intervention and a parent‐complementary feeding and home‐visit intervention to be effective in increasing both fruit and vegetable intake compared to control (Vazir 2013). |
| Short‐term impact (< 12 months) cost effectiveness | Information regarding intervention costs was reported in 1 trial (Campbell 2013) | ‐ | 389 | ⊕⊝⊝⊝ | ‐ | |
| Short‐term impact (< 12 months) unintended adverse events | One trial (Wyse 2012) reported no adverse effect on family food expenditure | ‐ | 343 | ⊕⊝⊝⊝ | ||
| *The risk in the intervention group (and its 95% confidence interval) is based on the assumed risk in the comparison group and the relative effect of the intervention (and its 95% CI). | ||||||
| GRADE Working Group grades of evidence | ||||||
| 1We used the post‐intervention mean and standard deviation of the control group from Skouteris 2015 for the risk with no intervention and to re‐express the SMD in terms of servings of vegetables per day. | ||||||
| Multicomponent interventions compared to no intervention for children aged 5 years and under | ||||||
| Patient or population: children aged 5 years and under | ||||||
| Outcomes | Anticipated absolute effects* (95% CI) | Relative effect | № of participants | Quality of the evidence | Comments | |
| Risk with no intervention | Risk with multicomponent interventions | |||||
| Short‐term impact (< 12 months) child fruit and vegetable intake | The mean cups of vegetables per day was 1.081 | The mean cups of vegetables per day in the intervention group was 0.37 higher (0.04 higher to 0.69 higher) | ‐ | 2009 | ⊕⊕⊝⊝ | Scores estimated using a standardised mean difference of 0.35 (0.04 to 0.66) and a standard deviation of 1.051 The mean duration of follow‐up post‐intervention for studies included in the meta‐analysis was 1.1 weeks 4 studies could not be pooled in meta‐analysis. 3 reported significant increases in both fruit and vegetable consumption, and 1 significantly increased fruit but not vegetable consumption |
| Short‐term impact (< 12 months) cost effectiveness ‐ not reported | No studies reported this outcome | ‐ | ‐ | ‐ | ‐ | |
| Short‐term impact (< 12 months) unintended adverse events ‐ not reported | No studies reported this outcome | ‐ | ‐ | ‐ | ‐ | |
| *The risk in the intervention group (and its 95% confidence interval) is based on the assumed risk in the comparison group and the relative effect of the intervention (and its 95% CI). | ||||||
| GRADE Working Group grades of evidence | ||||||
| 1We used the post‐intervention mean and standard deviation of the control group from Williams 2014 for the risk with no intervention and to re‐express the SMD in terms of cups vegetables per day. | ||||||
| Child nutrition education interventions compared to no intervention for children aged 5 years and under | ||||||
| Patient or population: children aged 5 years and under | ||||||
| Outcomes | Anticipated absolute effects* (95% CI) | Relative effect | № of participants | Quality of the evidence | Comments | |
| Risk with no intervention | Risk with child nutrition education interventions | |||||
| Short‐term impact (< 12 months) child fruit and vegetable intake | The mean short‐term impact (< 12 months) child vegetable intake frequency score was 4 (a score of 4 corresponds to consumption of vegetables 3 ‐ 4 times per week) | MD 0 | ‐ | 238 | ⊕⊕⊝⊝ | The only study (Baskale 2011) reported an increase in some of the fruits and vegetables assessed in the intervention group and no significant differences in the control group The duration of follow‐up post‐intervention was 8 weeks |
| Cost or cost effectiveness ‐ not reported | No studies reported this outcome | ‐ | ‐ | ‐ | ‐ | |
| Unintended adverse events ‐ not reported | No studies reported this outcome | ‐ | ‐ | ‐ | ‐ | |
| *The risk in the intervention group (and its 95% confidence interval) is based on the assumed risk in the comparison group and the relative effect of the intervention (and its 95% CI). | ||||||
| GRADE Working Group grades of evidence | ||||||
| 1Downgraded one level for risk of bias: high risk of bias due to lack of blinding and loss to follow‐up. | ||||||
Background
Description of the condition
Insufficient consumption of fruit and vegetables is associated with a range of non‐communicable diseases, such as cancer and cardiovascular disease (Boeing 2012; Hartley 2013; Micha 2015; World Health Organization 2003; World Health Organization 2011). Globally, 2.8% of all deaths and 1.0% of all disability‐adjusted life years (DALYs) each year are attributable to inadequate fruit and vegetable intake (World Health Organization 2017). Low fruit and vegetable consumption is responsible for 14% of gastrointestinal cancer deaths, 11% of all ischaemic heart disease and 9% of all stroke deaths (World Health Organization 2017) and as a result is a public health priority.
The daily amount of fruit and vegetables recommended for children aged five years and younger varies internationally. For example, in the USA 1 and 1 to 1.5 cups each of fruit and vegetables is recommended respectively for children aged two to three years and four to eight years (U.S. Department of Health and Human Services). Whereas in Australia, 0.5 to 1.15 servings of fruit (75 g to 113 g) and 2 to 4.5 servings of vegetables (150 g to 338 g) are recommended for children aged one to two years, two to three years and four to eight years (National Health and Medical Research Council). Population surveys of children indicate that such recommendations are not met and there is a need to increase children's intake of fruit and vegetables (Australian Bureau of Statistics 2014; Inchley 2016; Lock 2005; National Cancer Institute 2015; World Health Organization 2004a; Yngve 2005). For example, just over a third of school‐aged children from European nations report consuming vegetables on a daily basis (Inchley 2016). Data from younger children are similar. A survey conducted in 2007 to 2010 in the USA reported that 33% of children aged one to three years met fruit recommendations and 13% met vegetable recommendations (National Cancer Institute 2015). A national survey in 2011 to 2012 in Australia reported that 90% of children aged two to eight years consumed the recommended number of fruit servings a day, and 49% of children aged two to three years consumed the recommended servings of vegetables (Australian Bureau of Statistics 2014). Globally, the mean intake of fruit and vegetables is below the World Health Organization (WHO) recommendations across all WHO regions. South American, African, and South East Asian nations report the lowest quantities of child fruit and vegetable intake, where school‐aged children typically consume less than 300 g a day (Lock 2005).
There is some evidence from longitudinal studies to suggest that eating behaviours established in childhood are likely to persist into adulthood (Craigie 2011; Lien 2001; Mikkilä 2004). Follow‐up data at 37 years from the Boyd Orr cohort study of British children, for example, found lower rates of all‐cause cardiovascular mortality among children with greater intake of vegetables in childhood (Ness 2005). Additionally, longitudinal studies have shown that fruit and vegetable consumption in childhood is associated with reductions in non‐communicable diseases in adulthood (Maynard 2003; Ness 2005). Encouraging healthy eating among children may therefore represent an effective primary prevention strategy for reducing the risk of non‐communicable diseases (Boeing 2012; Centers for Disease Control and Prevention 2011; Maynard 2003; Ness 2005; World Health Organization 2004b). Adequate fruit and vegetable intake during childhood may also have a number of immediate benefits, including reducing the risk of micronutrient deficiencies and a number of respiratory illnesses (Antova 2003; Boeing 2012; Forastiere 2005; World Health Organization 2003).
Description of the intervention
The aetiology of fruit and vegetable consumption is complex, involving the dynamic interaction of a variety of factors. Given such complexity, a number of frameworks have been produced to guide the development of interventions to increase fruit and vegetable intake (Centers for Disease Control and Prevention 2011; Klepp 2005; Miller 2000; World Health Organization 2004b). For example, the conceptual framework developed for the international Pro Children Project suggests that interventions targeting a variety of cultural, physical and social environment factors, as well as those targeting personal factors, may be effective in positively influencing fruit and vegetable intake among children (Klepp 2005).
Despite the range of potential intervention targets, including primordial prevention interventions that target the risk factors of non‐communicable diseases before they occur (compared to primary prevention interventions that treat risk factors of non‐communicable diseases), previous trials have tended to focus on those determinants more amenable to intervention, such as nutrition knowledge and skills, or the food environment of settings such as schools (Hector 2008). Among school‐aged children, systematic reviews suggest that the strongest evidence exists for the effectiveness of multicomponent interventions with elements such as curriculum, parental engagement, policy and food environment changes (Blanchette 2005; De Sa 2008; Jaime 2009; Knai 2006; Van Cauwenberghe 2010). Previous reviews in children aged five years and younger (Campbell 2007; Hesketh 2010; Tedstone 1998) have similarly found some evidence for multicomponent interventions. For example, an intervention aiming to prevent the onset of cardiovascular disease in preschoolers targeted multiple risk factors, including child fruit and vegetable consumption (Peñalvo 2013a; Peñalvo 2013b). The multicomponent intervention including curriculum, school environment and family components successfully improved preschoolers' fruit and vegetable habits, which were also maintained over time (Peñalvo 2013a; Peñalvo 2013b; Peñalvo 2015).
How the intervention might work
A number of theories have been used to explain the mechanisms by which interventions may influence children's fruit and vegetable consumption (Rasmussen 2006). In most instances, psychosocial theories such as Social Cognitive Theory (Bandura 1986), the Theory of Planned Behaviour (Ajzen 1991), or the Stages of Change Trans‐theoretical Model (Prochaska 1984) have been used to explain possible causal pathways to fruit and vegetable consumption (Rasmussen 2006). Collectively, such theories assert that changes in attitudes, knowledge and skills and perceived norms and expectancies are required for behavioural change. The international Pro Children Project incorporated Social‐Ecological Model in its conceptual theoretical framework of determinants of children's fruit and vegetable consumption (Klepp 2005). Interventions derived from Social‐Ecological Model recognise the importance of more structural influences on children's intake of fruit and vegetable consumption, for example, the availability or accessibility of fruit and vegetables in the home or in settings such as schools which children frequent.
Why it is important to do this review
Previous reviews have identified a number of factors associated with fruit and vegetable consumption among children (Blanchette 2005; Pearson 2008; Rasmussen 2006; Van der Horst 2007). While such reviews provide important information for the development of interventions, only systematic reviews of intervention trials can determine the effectiveness of strategies to increase child fruit and vegetable consumption. A number of such reviews have been published (Burchett 2003; Ciliska 2000; Delgado‐Noguera 2011; De Sa 2008; Evans 2012; French 2003; Hendrie 2017; Howerton 2007; Knai 2006; Savoie‐Roskos 2017; Van Cauwenberghe 2010). However, only a few have focused specifically on children aged five years and under (Campbell 2007; Hesketh 2010; Tedstone 1998), with the most recent of these conducted in 2010. Despite these reviews reporting a positive effect of such interventions (Hesketh 2010; Tedstone 1998), most lacked important information relevant to practice, such as the effectiveness of interventions for various subpopulations (such as minority groups), the cost effectiveness of interventions, or the presence of any unintended adverse effects of the intervention. Similarly, as positive impacts of health behaviour interventions may not be sustained, an examination of the longer‐term effectiveness of interventions (more than 12 months post‐intervention) is important for policy‐makers and practitioners to assess the potential health benefits of fruit and vegetable interventions (Fjeldsoe 2011; Jones 2011). Previous reviews have not specifically examined the impact of interventions based on the length of post‐intervention follow‐up. A comprehensive systematic review on this issue is therefore required to provide guidance for practitioners and policy‐makers interested in implementing strategies to promote the consumption of fruits and vegetables in early childhood.
Following the publication of the 2017 update of this review, we will maintain it as a living systematic review, as a pilot up until the end of March 2018. This means we will be continually running the searches and rapidly incorporating any newly‐identified evidence into the review (for more information about the living systematic review approach being piloted by Cochrane, see Appendix 1). We believe a living systematic review approach is appropriate for this review, for three reasons. First, the review addresses a particularly important public health issue; the growing burden of disease and mortality attributable to low fruit and vegetable intake. Insufficient consumption of fruits and vegetables is associated with a range of non‐communicable diseases such as cancer and cardiovascular disease, and in most regions of the globe current daily consumption of fruits and vegetables is well below the recommended intake to reduce the risk of non‐communicable diseases. Early childhood represents a critical period for the establishment of healthy eating behaviours, such as fruit and vegetable intake, as dietary habits developed early are likely to persist into adulthood. It is therefore important to better understand how to improve intake of fruits and vegetables during childhood. Secondly, there remains uncertainty in the existing evidence; despite searches including the current update (up to 25 January 2018) identifying 63 studies for inclusion in the review, no high‐quality evidence exists of effective interventions to increase the fruit and vegetable consumption of children. Thirdly, we are aware of multiple ongoing trials in this area of research that will be important to incorporate, and we expect that future research will have an impact on the conclusions.
Objectives
To assess the effectiveness, cost effectiveness and unintended adverse events of interventions designed to increase the consumption of fruit or vegetables or both among children aged five years and under.
Methods
Criteria for considering studies for this review
Types of studies
Eligible trials were randomised controlled trials (RCTs), including cluster‐randomised controlled trials (C‐RCTs) and cross‐over trials, that:
-
compared two or more alternative intervention programmes to increase the consumption of fruit or vegetables or both of children aged five years and under;
-
compared an intervention programme to increase the consumption of fruit or vegetables or both of children aged five years and under with a standard‐care or no‐intervention control group.
We excluded trials which did not include fruit or vegetable intake as a primary trial outcome, to avoid the potential confounding effects of other interventions, and because publication bias and selective outcome reporting are more predominant among secondary trial outcomes (or outcomes that were not otherwise stated). We included trials that did not state a primary trial outcome but did assess an eligible fruit or vegetable intake outcome. We included eligible cross‐over trials in the review, as we deemed them a suitable and common method for assessing the effect of interventions to increase the fruit and vegetable consumption of children.
Types of participants
Participants could include:
-
children aged five years and under. Trials including children older than five years were included only if the mean age of the study sample at baseline was five years or less;
-
parents, guardians and families responsible for the care of children aged five years and under;
-
professionals responsible for the care of children aged five years and under, including childcare staff and health professionals.
Types of interventions
We considered any educational, experiential, health promotion and/or psychological or family or behavioural therapy or counselling or management or structural or policy or legislative reform interventions, designed to increase consumption of fruit or vegetables or both in children aged five years and under (as defined in types of participants). Interventions could be conducted in any setting including the home, childcare/preschool services, health services, or community settings.
Comparison: Any alternative intervention to encourage fruit and vegetable consumption as described above, or a no‐intervention control, usual care, or attention control or wait‐list control. Attention controls in randomised trials for behavioural interventions are those that include clinical attention and induce the expectation of therapeutic benefit for control for non‐specific effects of the intervention (Freedland 2011). Wait‐list control groups that are also designed to control for non‐specific effects involve participants being allocated to receive an intervention at study conclusion (delayed start) (Whitehead 2004).
Types of outcome measures
We included studies with evaluated outcomes, measuring biomedical or dietary indices, or both, of the review's primary outcome.
Primary outcomes
The primary outcome was children's fruit and vegetable intake. Fruit and vegetable intake could be assessed using a variety of measures, including:
-
change in the number of portions or serves of daily fruit or vegetable or both at follow‐up, as measured by diet recalls, food diaries, food frequency questionnaires or diet records completed by an adult on behalf of the child. We grouped the interventions by short‐term effects (less than 12 months post‐intervention) and long‐term effects (at least 12 months post‐intervention);
-
change in grams of fruit or vegetables or both at follow‐up, as measured by diet recalls, food diaries, food frequency questionnaires or diet records completed by an adult on behalf of the child. We grouped them by short‐term effects (less than 12 months post‐intervention) and long‐term effects (at least 12 months post‐intervention);
-
changes in biomedical markers of consumption of fruit or vegetables or both, such as α‐carotene, β‐carotene, cryptoxanthin, lycopene and lutein. We grouped them by short‐term effects (less than 12 months post‐intervention) and long‐term effects (12 months or more post‐intervention).
Outcomes of fruit or vegetable juice intake alone were not eligible. Outcomes that included child fruit and vegetable juice intake as part of an aggregate measure of child fruit or vegetable intake were eligible.
Secondary outcomes
-
Estimates of absolute costs and cost effectiveness of interventions to increase the consumption of fruits and vegetables reported in identified studies.
-
Any reported adverse effects of an intervention to increase the consumption of fruits and vegetables reported in identified studies. This could include any physical, behavioural, psychological or financial impact on the child, parent or family, or the service or facility where an intervention may have been implemented.
Search methods for identification of studies
This review represents the third update of a review first published in 2012 (Wolfenden 2012) and updated in 2017 (Hodder 2017) and January 2018 (Hodder 2018).
Electronic searches
We searched the following electronic databases on 25 October 2017, 25 November 2017, 25 December 2017 and 25 January 2018 to identify any relevant trials added since the last published review (Hodder 2018):
-
Cochrane Central Register of Studies (CENTRAL, via CRS‐Web);
-
Epub Ahead of Print, In‐Process & Other Non‐Indexed Citations, MEDLINE Daily and MEDLINE (Ovid, 1946 to 25 January 2018);
-
Embase (Ovid, 1980 to 2018 Week 4).
As a living systematic review, we are conducting monthly searches of these databases, for which we have set up auto‐alerts to deliver monthly search yields, where possible.
We had previously conducted electronic searches of CINAHL (EBSCO, 1937 to 5 July 2016) (searched 5 July 2016) and PsycINFO (Ovid, 1806 to June week 5 2016) (searched 5 July 2016) (Hodder 2017) .
The search strategies are described in Appendix 2. We applied the sensitivity‐maximising version of the Cochrane RCT filter (Lefebvre 2011) to MEDLINE, and adaptations of it to the other databases except for CENTRAL. We imposed no restrictions by date or language of publication.
Searching other resources
We searched the reference lists of included articles and handsearched all articles published between September 2016 and September 2017 in three relevant international peer‐reviewed journals (Journal of Nutrition Education and Behavior, Public Health Nutrition, and Journal of the Academy of Nutrition and Dietetics (previously titled Journal of the American Dietetic Association)).
We are now running monthly trial registry searches of the WHO International Clinical Trials Registry Platform (www.who.int/ictrp/) and ClinicalTrials.gov (www.clinicaltrials.gov), which we last conducted in January 2018. In September 2016 we also searched a third clinical trials register, the metaRegister of clinical trials (www.isrctn.com/page/mrct).
We also searched a database of published dissertations (Proquest Dissertations and Theses) in November 2017 and GoogleScholar in December 2017.
We contacted the authors of included studies to try to obtain other eligible trials published in peer‐reviewed journals, as well as ongoing trials. We describe ongoing studies, where available, detailing the primary author, research question(s), methods and outcome measures (Characteristics of ongoing studies).
As this is a living systematic review, we will continue to handsearch the three journals listed above, the database of published dissertations and 'grey literature' in GoogleScholar manually every six months.
As additional steps to inform the living systematic review, we will contact corresponding authors of ongoing studies as they are identified and ask them to advise when results are available, or to share early or unpublished data. We will contact the corresponding authors of any newly‐included studies for advice as to other relevant studies. We will conduct citation tracking of included studies in Web of Science Core Collection on an ongoing basis. For that purpose, we have set up citation alerts in Web of Science Core Collection. We will manually screen the reference lists of any newly‐included studies and systematic reviews.
We will review search methods and strategies approximately yearly, to ensure they reflect any terminology changes in the topic area, or in the databases.
Data collection and analysis
Selection of studies
Pairs of review authors (from RH, KO, RW, FS, SY, NN) independently screened titles and abstracts of identified papers. Review authors were not blinded to the details of the study author or journal. Review authors applied a standardised screening tool to assess eligibility. We screened articles against the eligibility criteria of participants (mean age of children more than five years), outcome (primary outcome was not fruit and vegetable intake), comparator (was not a no‐intervention, usual care, attention or wait‐list control), intervention (did not aim to increase child fruit or vegetable intake) and study type (was not RCT, C‐RCT or cross‐over trial with random allocation to group). Based on the title and abstract, we excluded papers which clearly did not meet the eligibility criteria of the review. Pairs of review authors (from FS, RH, KO, NN, RS, SY) then independently examined the full text of all remaining articles. We documented Information regarding the reason for the ineligibility of any paper for which we reviewed the full text, and present it in the table 'Characteristics of excluded studies'. A third review author with expertise in review methodology (LW) resolved any disagreements between review authors on study eligibility. For those papers which did not provide sufficient information to determine eligibility, we contacted the study authors for clarification.
We will immediately screen any new citations retrieved by the monthly searches. As the first step of monthly screening, we will apply the machine learning classifier (RCT model) (Wallace 2017), available in the Cochrane Register of Studies (CRS‐Web) (Cochrane 2017a). The classifier assigns a probability (from 0 to 100) to each citation of being a true RCT. For citations that are assigned a probability score of less than 10, the machine learning classifier currently has a specificity/recall of 99.987% (Wallace 2017). We will screen in duplicate and independently all citations that have been assigned a score from 10 to 100. Cochrane Crowd will screen citations that score 9 or less (Cochrane 2017b) and will return any citations that they deem to be potential RCTs to the review authors for screening.
Data extraction and management
Pairs of review authors (from EJ, RW, RH, KB, KO, ER, TCM, RS, NN) independently extracted data from each included trial. Review authors were not blinded to the details of the study author or journal. We recorded data on data extraction forms designed and piloted specifically for this review. Consultation with a third review author with expertise in review methodology (LW) resolved discrepancies between review authors about data extraction. We tried to contact authors of included papers in instances where the information required for data extraction was not available from the published report, or was unclear. One review author entered extracted data into the systematic review software Review Manager 5 (RevMan 5) (RH) and another review author checked it (KO). Where available, we extracted the following information from included trials:
-
Information on the study, research design and methods, such as the study authors; date of publication; date of study initiation; study duration; setting; number of participants; participants' age, gender, ethnicity, and socioeconomic position;
-
Information on the experimental conditions of the trial, such as the number of experimental conditions; intervention and comparator components; duration; number of contacts; modalities; interventionist; and integrity;
-
Information on the trial outcomes and results, such as rates of recruitment and attrition; sample size; number of participants per experimental condition; mean and standard deviation of the primary or secondary outcomes described above; any subgroup analyses by gender, population group or intervention characteristics; and analyses (including whether studies appropriately adjusted for clustering).
Assessment of risk of bias in included studies
Working in pairs, review authors FS, FT and TCM independently assessed the risks of bias in the included studies. We consulted a fourth review author (RH) with expertise in review methodology to resolve any disagreements between review authors. Review authors used the tool outlined in the Cochrane Handbook for Systematic Reviews of Interventions (Higgins 2011) to assess the risks of bias. The tool requires an explicit judgement by the review authors, based on trial information, about the risks of bias attributable to the generation of the random sequence, the allocation concealment, the blinding of participants, personnel and outcome assessors, the completeness of outcome data, selective reporting, and any other potential threats to validity. We also judged recruitment bias, baseline imbalance, loss of clusters and incorrect analysis for C‐RCTs. Judgements on the risks of bias for each trial are recorded in the ‘Risk of bias’ tables accompanying the review.
Measures of treatment effect
Where meta‐analyses were performed, we expressed the intervention effect as a mean difference (MD) where outcomes were reported using a standard metric (such as grams), and as a standardised mean difference (SMD) where outcomes were reported using different methods or metrics of fruit and vegetable intake (such as grams, grams per kilogram of body weight, and serves per day).
Unit of analysis issues
We assessed cluster‐randomised trials in the review for unit‐of‐analysis errors. Where cluster‐randomised studies did not account for clustering, we contacted study authors to provide intra‐class correlation coefficients (ICCs) to allow calculation of design effects and effective sample sizes to enable individual‐level pooling. Where ICCs were not available, we estimated a mean ICC from reported ICCs of included studies, and used it to calculate effective sample sizes.
Dealing with missing data
Where available, we reported outcomes of trials using an intention‐to‐treat analysis. If studies did not report intention‐to‐treat analyses, we reported as‐treated analysis of trial outcomes. We explored the impact of including as‐treated trial outcomes in meta‐analysis for studies with a high rate of attrition (more than 20% for short‐term outcomes) in sensitivity analyses (see below Sensitivity analysis). We contacted study authors to obtain any missing data (e.g. standard deviations).
Assessment of heterogeneity
We assessed statistical heterogeneity by visual inspection of forest plots of the included trials, and calculation of the I2 statistic where we were able to pool data from included trials (Higgins 2003). Due to the similarity in trial characteristics (e.g. type of participants, intervention or outcomes), we could not conduct subgroup analyses by trial characteristics to identify the source of substantial heterogeneity (defined as I2 greater than 50%).
Assessment of reporting biases
We checked for reporting bias by visual inspection of the funnel plots.
Data synthesis
We assessed trial outcomes using a variety of dietary assessment tools and reported in various metrics, including vitamin C from fruit, fruit or vegetable serves, and grams of fruit and/or vegetable consumption. We calculated standardised mean differences (SMDs; to account for variable outcome measures) for each comparison, using the generic inverse variance method in a fixed‐effect meta‐analysis model (where there was no or low statistical heterogeneity in the primary analysis) or a random‐effects meta‐analysis model (where there was unexplained heterogeneity in the primary analysis), using the RevMan 5 software. We selected post‐intervention values over change‐from‐baseline data for inclusion in meta‐analysis, to reduce the risk of selective reporting and to maximise the number of studies that could be pooled.
We synthesised studies that provided data suitable for pooling in meta‐analyses grouped by intervention type (infant feeding, parent nutrition education, and multicomponent interventions). When studies reported multiple fruit or vegetable outcomes, we selected the stated primary trial outcome for inclusion in our meta‐analyses, or if a primary outcome was not stated we selected the first reported outcome for inclusion. For studies which reported multiple follow‐up points, we extracted data from the longest follow‐up period for inclusion in meta‐analyses.
We selected reported study estimates that adjusted for potential confounding variables for inclusion in meta‐analysis over reported estimates that did not adjust for potential confounding variables. Similarly, for C‐RCTs that reported study estimates that were unadjusted and adjusted for clustering, we preferred estimates that adjusted for clustering for inclusion in meta‐analyses. For C‐RCTs that did not report post‐intervention study estimates (and a relevant measure of variance) that accounted for clustering, we calculated a design effect and effective sample size using study data (number of clusters, number of participants analysed) and a reported ICC from one of the included studies (vegetable intake: ICC 0.014, fruit intake: ICC 0.016; De Bock 2012). For such C‐RCTs (De Coen 2012; Martinez‐Andrade 2014; Namenek Brouwer 2013; Nicklas 2017; O'Connell 2012; Roset‐Salla 2016; Smith 2017; Verbestel 2014; Williams 2014; Zeinstra 2018), we entered the reported post‐intervention outcome data (e.g. mean and standard deviation) and author‐calculated effective sample sizes into RevMan 5 to calculate individual‐level adjusted study estimates to enable inclusion in meta‐analyses. We tried to pool studies separately that compared two or more alternative interventions.
For cross‐over trials, we tried to synthesise results separately from parallel RCTs, by pooling results from paired analyses that adjust for within‐individual comparisons. If such data were not available, we combined results by pooling data from the first cross‐over period (i.e. essentially a parallel RCT) with parallel RCTs.
In all instances where we could not combine data in a meta‐analysis, we have provided a narrative summary of the trial findings according to the review objectives.
Whenever we find new evidence (i.e. studies, data or information) meeting the review inclusion criteria, we will extract the data, assess risks of bias and incorporate it into the synthesis every three months, as appropriate.
We will incorporate any new study data into existing meta‐analyses using the standard approaches outlined in the Data synthesis section.
We will not adjust the meta‐analyses to account for multiple testing, given that the methods related to frequent updating of meta‐analyses are under development (Simmonds (in press)).
Summary of Findings table and GRADE
We created 'Summary of findings' tables using the following outcomes:
-
Child fruit and vegetable intake. This could include changes in the number of portions or serves or grams of daily fruit or vegetable or both at follow‐up, as measured by diet recalls, food diaries, food frequency questionnaires or diet records completed by an adult on behalf of the child; or changes in biomedical markers of consumption of fruit or vegetables or both, such as α‐carotene, β‐carotene, cryptoxanthin, lycopene and lutein.
-
Estimates of absolute costs and cost effectiveness of interventions to increase the consumption of fruit and vegetables reported in the included studies;
-
Any reported adverse events of an intervention to increase the consumption of fruit and vegetables reported in the included studies. This could include any physical, behavioural, psychological or financial impact on the child, parent or family, or the service or facility where an intervention may have been implemented.
We have produced four 'Summary of findings' tables, one for each of the following comparisons:
-
Child‐feeding interventions compared to no‐intervention control;
-
Parent nutrition education interventions compared to no‐intervention control;
-
Multicomponent interventions compared to no‐intervention control;
-
Child nutrition education interventions compared to no‐intervention control.
We used the five GRADE considerations (study limitations, consistency of effect, imprecision, indirectness and publication bias) to assess the quality of a body of evidence as it relates to the studies which contribute data to the meta‐analyses for the prespecified outcomes. We used methods and recommendations described in Section 8.5 and Chapter 12 of the Cochrane Handbook for Systematic Reviews of Interventions (Higgins 2011), using GRADEpro software (gradepro.org/). We justified all decisions to downgrade the quality of studies using footnotes, and made comments to aid the reader's understanding of the review where necessary. For each comparison where we had calculated a SMD, we re‐expressed it based on the instrument used in the lowest risk of bias in that comparison (e.g. grams of vegetable intake or serves of vegetables a day), by multiplying the post‐intervention standard deviation of the control group by the pooled SMD.
Two review authors (RH and NN), working independently, judged the quality of the evidence, with disagreements resolved by discussion or by involving a third review author (LW). We justified, documented and incorporated the judgements into the reporting of results for each outcome.
We extracted study data, formatted our comparisons in data tables and prepared a 'Summary of findings' table before writing the results and conclusions of our review.
Subgroup analysis and investigation of heterogeneity
Where possible, we conducted subgroup analyses of interventions for the following subgroups, which we had planned a priori:
-
Interventions targeting boys and girls (not conducted);
-
Interventions targeting minority groups including indigenous populations (not conducted, described narratively);
-
Interventions delivered in various settings including health and children’s services (conducted where possible for some comparisons and settings);
-
Interventions of varying intensities, defined in terms of the number and duration of intervention contacts or components (not conducted);
-
Interventions delivered in different modes, such as by telephone, the Internet or face‐to‐face (conducted for some comparisons and modalities, otherwise described narratively).
Sensitivity analysis
Where possible, we conducted sensitivity analyses to explore the impact on the overall assessment of treatment effects:
-
Excluding studies at high risk of bias (defined a priori);
-
Excluding studies not reporting an intention‐to‐treat analysis, with high rates of participant attrition defined as greater than 20% (defined a priori);
-
Excluding studies that did not have a primary outcome of child fruit and vegetable, fruit or vegetable consumption (post hoc).
For the sensitivity analysis excluding studies that did not have a primary outcome of child fruit and vegetable, fruit or vegetable consumption, we considered studies to have a primary outcome of children's fruit and vegetable intake even when this was not explicitly stated if: children's fruit and vegetable intake was the only reported outcome, a sample size calculation for children's fruit and vegetable intake was reported, or children's fruit and vegetable intake was the first reported outcome.
Other
We will review our scope and methods if appropriate in the light of potential changes in the topic area, or the evidence being included in the review (e.g. additional comparisons, interventions or outcomes, or new review methods available).
We are piloting this review as a living systematic review up until March 2018.
Results
Description of studies
See: Characteristics of included studies; Characteristics of excluded studies; Characteristics of ongoing studies.
Results of the search
We ran searches for the previous reviews (Wolfenden 2012; Hodder 2017; Hodder 2018) and this review update, which together generated a total of 25,480 citations (24,661 previous reviews; 819 this review update). Screening of titles and abstracts for the review update identified 91 records (737 in total, including 646 from the previous reviews) for formal inclusion or exclusion (See Figure 1). Of these, 63 trials (Anzman‐Frasca 2012; Barends 2013; Baskale 2011; Black 2011; Blissett 2016; Campbell 2013; Caton 2013; Cohen 1995; Cooke 2011; Correia 2014; Cravener 2015; Daniels 2014; De Bock 2012; De Coen 2012; de Droog 2014; de Droog 2017; de Wild 2013; de Wild 2015a; de Wild 2015b; de Wild 2017; Duncanson 2013; Fildes 2014; Fildes 2015; Fisher 2012; Forestell 2007; Gerrish 2001; Haire‐Joshu 2008; Harnack 2012; Hausner 2012; Heath 2014; Hetherington 2015; Hunsaker 2017; Keller 2012; Kling 2016; Martinez‐Andrade 2014; Mennella 2008; Namenek Brouwer 2013; Natale 2014a; Nicklas 2017; O'Connell 2012; Remington 2012; Remy 2013; Roe 2013; Roset‐Salla 2016; Savage 2012; Sherwood 2015; Skouteris 2015; Smith 2017; Spill 2010; Spill 2011a; Spill 2011b; Staiano 2016; Sullivan 1994; Tabak 2012; Vazir 2013; Verbestel 2014; Vereecken 2009; Wardle 2003a; Watt 2009; Williams 2014; Witt 2012; Wyse 2012; Zeinstra 2018) met the inclusion criteria, eight of which were new studies identified in the most recent update (Cohen 1995; Forestell 2007; Gerrish 2001; Heath 2014; Kling 2016; Sherwood 2015; Smith 2017; Zeinstra 2018). We contacted authors of the included trials for any missing outcome data, to permit meta‐analysis.

Study flow diagram
Included studies
There were 178 trial arms and 11,698 participants randomised across the 63 included trials. We give full details of the trials in the Characteristics of included studies table. Twenty‐nine trials were undertaken in the USA, nine in the UK, eight in the Netherlands, five in Australia, three in Belgium, and one each in Turkey, Germany, Denmark, Mexico, France, Spain, Honduras and India, and one study that was undertaken in the UK, Greece and Portugal. Thirty‐two of the included studies were RCTs, of which 17 compared an intervention to a no‐treatment control group; 21 were C‐RCTs, of which 18 compared an intervention to a no‐treatment control group; and 10 were cross‐over trials. The unit of randomisation in C‐RCTs included childcare centres or preschools (n = 14), parent groups (n = 2), preschool classrooms (n = 1), primary schools (n = 1), primary school classrooms (n = 1), primary care clinics (n = 1) and villages (n = 1). Twenty‐nine trials were conducted in a preschool or school setting; 14 in a home setting; five in a healthcare setting (e.g. primary care); six in a home and laboratory setting; two in a laboratory setting; three in a preschool and home setting; and four in a home and healthcare setting. Included studies examined the impact of various types of interventions to increase child fruit and vegetable consumption. Fifty‐nine of the included studies assessed intake of vegetables, and 31 assessed intake of fruit. Various objective and subjective measures were used to assess fruit and vegetable intake, such as as‐desired intake and mean daily intake as reported by parents. One trial reported information about intervention costs and two trials reported information on any adverse events or unintended adverse consequences of the intervention. Information on the reliability and validity of selected fruit and vegetable intake outcome measures in children were reported by 11 studies. Post‐intervention follow‐up periods ranged from immediate to 3.5 years. Of the 63 included studies, 13 did not report whether funding support was received to undertake the trial, one study reported no funding support (Baskale 2011), and the remaining 49 studies reported a source of funding. Funding support for such studies were governmental or charitable, with the exception of four studies that reported receiving funding from food industry sources (Fisher 2012; Gerrish 2001; Sullivan 1994; Tabak 2012).
Child‐feeding practice interventions
Thirty‐nine trials tested the impact of specific child feeding‐practice interventions (e.g. repeated exposure) in increasing children's intake of fruit or vegetables (Anzman‐Frasca 2012; Barends 2013; Blissett 2016; Caton 2013; Cohen 1995; Cooke 2011; Correia 2014; Cravener 2015; Daniels 2014; de Droog 2014; de Droog 2017; de Wild 2013; de Wild 2015a; de Wild 2015b; de Wild 2017; Forestell 2007; Fildes 2014; Fildes 2015; Fisher 2012; Gerrish 2001; Harnack 2012; Hausner 2012; Heath 2014; Hetherington 2015; Keller 2012; Kling 2016; Mennella 2008; O'Connell 2012; Remington 2012; Remy 2013; Roe 2013; Savage 2012; Spill 2010; Spill 2011a; Spill 2011b; Staiano 2016; Sullivan 1994; Wardle 2003a; Zeinstra 2018). Of the trials testing the impact of specific feeding‐practice interventions, 25 compared the effectiveness of two or more interventions and 14 trials compared one or more interventions with a no‐treatment control group; eleven of these were cross‐over trials.
Fourteen trials examined the effect of repeated exposure compared to an alternate or no intervention. Five compared the effect of a repeated exposure intervention to one or more alternative interventions (including associative conditioning, flavour‐flavour learning, flavour‐nutrient learning, choice of vegetable versus no choice) (Anzman‐Frasca 2012; Barends 2013; Caton 2013; Hausner 2012; Remy 2013), one compared the effect of repeated exposure choice offering of vegetable to no choice (de Wild 2015a), one study compared the effect of repeated exposures and variety (Mennella 2008), and one study compared the effect of repeated exposure to a target vegetable using different preparation methods compared to a control vegetable (de Wild 2017). The other six trials examined the effect of a repeated exposure intervention compared to no‐treatment control, of which one trial each examined the effect of repeated exposure alone (O'Connell 2012), taste exposure plus rewards (Fildes 2014), exposure plus social reward and exposure plus tangible reward (Remington 2012), exposure and nutrition information (Wardle 2003a), exposure plus tangible reward, exposure plus social reward and exposure alone (Cooke 2011), and repeated exposure over five months within a childcare setting (Zeinstra 2018).
Two trials examined the effect of flavour nutrient learning, of which one trial compared the effects of low‐energy vegetable soup versus high‐energy vegetable soup (de Wild 2013), and the other trial compared incorporation of vegetable puree into meals at three different levels of energy density (Spill 2011a). A further trial examined the effect of six different levels of portion size and energy density on vegetable intake (Kling 2016).
Five trials examined the effect of parent‐feeding interventions. One trial compared the effects of advice to the parent about introducing vegetables to no‐treatment control (Fildes 2015), one trial compared the effects of an early feeding intervention targeting complementary feeding practices to a no‐treatment control (Daniels 2014), one trial compared the effects of early and repeated exposure to vegetables during complementary feeding to a no‐treatment control (Hetherington 2015), one trial compared parent prompting and modelling, parent prompting alone and modelling alone (Blissett 2016), and the other trial compared exclusive breastfeeding, complementary feeding with breastfeeding, and complementary feeding with breastfeeding on demand (Cohen 1995).
Five trials examined the effect of pairing fruit and vegetables with positive stimuli. One trial compared pairing vegetables with stimuli such as stickers and cartoon packaging to a no‐treatment control (Cravener 2015), one trial compared pairing fruit and vegetables with character branding to a no‐treatment control (Keller 2012), one trial compared pairing of vegetables with a modelling DVD to a non‐food DVD and a no‐DVD control group (Staiano 2016), one trial compared the effect of pairing passive and interactive story‐telling (about a character that eats carrots) featuring either a product‐congruent (a rabbit) or product‐incongruent (a turtle) character across four experimental groups compared to a control group (de Droog 2014), and the fifth trial compared the effects of passive and interactive story‐telling (about a rabbit that eats carrots) with or without the use of a hand puppet (de Droog 2017).
Four trials examined the effect of pairing target vegetables with liked foods (Correia 2014; de Wild 2015b; Fisher 2012; Forestell 2007). Two trials examined the effect of varying serving sizes (Savage 2012; Spill 2011b). One trial examined the effects of dietary experience (salted or unsalted vegetables) (Sullivan 1994). The remaining three trials examined the effect of different serving methods; one trial compared serving fruit and vegetables first before other menu items to a specific plate of prepared food (Harnack 2012), one trial compared three different portion sizes of vegetables served at the beginning of a meal to a control meal (Spill 2010), and the third trial of eight arms compared the impact of a single type of vegetable, a variety of vegetables, a single type of fruit, and a variety of fruits on consumption (Roe 2013). One trial compared the effect of repeated exposure to pureed green beans alone to pureed green beans and peaches on green bean consumption (Forestell 2007).
One trial examined the effect of introducing a variety of flavours when introducing vegetables, which compared exposure to target vegetable (carrot), an alternate vegetable (potato), and a variety of vegetables that did not include the target vegetable (Gerrish 2001). One trial compared exposure to a picture book of a liked, disliked and unfamiliar vegetable on vegetable consumption (Heath 2014).
Parent nutrition education interventions
Fourteen studies tested the impact of parent nutrition education interventions in increasing children's intake of fruit or vegetables (Black 2011; Campbell 2013; Duncanson 2013; Haire‐Joshu 2008; Hunsaker 2017; Martinez‐Andrade 2014; Roset‐Salla 2016; Sherwood 2015; Skouteris 2015; Tabak 2012; Vazir 2013; Verbestel 2014; Watt 2009; Wyse 2012). Four trials were conducted in a healthcare setting: one trial compared a parenting practices intervention to a maternal diet and physical activity intervention to control (Black 2011), one trial compared a dietitian‐delivered intervention in a first‐time parents' group regarding infant feeding, physical activity and sedentary behaviours to control (Campbell 2013), one trial compared a six‐week parent intervention on obesity awareness and prevention to control (Martinez‐Andrade 2014), and the fourth trial compared a multistrategy parent intervention including health snack exposure to control (Skouteris 2015). Five trials were conducted within a home setting: one trial compared the provision of an interactive nutrition education CD and parenting DVD to parents to wait‐list control (Duncanson 2013), one trial compared a parent intervention inclusive of a tailored newsletter, home visits and materials to usual care (Haire‐Joshu 2008), one trial compared a dietitian‐delivered parent intervention on vegetable availability, picky eating, modelling and family meals to control (Tabak 2012); one trial compared a parent health report on fruit and vegetable consumption compared to control (Hunsaker 2017) and the fifth compared a parent intervention on infant‐feeding practices to usual care (Watt 2009). Three trials were conducted in a preschool setting; one trial compared a parent education intervention on dietary knowledge and changing habits to control (Roset‐Salla 2016), one trial compared a parent intervention including a poster with guidelines and tips, and tailored feedback about child dietary behaviours versus control (Verbestel 2014), and the third trial compared a parent intervention including a resource kit and telephone calls to improve parent knowledge and skills about the home food environment versus control (Wyse 2012). One trial conducted in both a home and health setting compared a parent complementary feeding intervention to parent complementary feeding and home visit intervention to control (Vazir 2013). One trial compared a paediatrician counselling and home‐based programme delivered to parents of children at risk of obesity compared to a safety and injury prevention control (Sherwood 2015).
Multicomponent interventions
Nine studies tested the impact of multicomponent interventions (e.g. teacher and parent education, preschool policy changes) in increasing children's intake of fruit or vegetables (De Bock 2012; De Coen 2012; Namenek Brouwer 2013; Natale 2014a; Nicklas 2017; Smith 2017; Vereecken 2009; Williams 2014; Witt 2012). Four trials were conducted in a preschool setting; one trial compared an intervention combining familiarisation, preparation and cooking of meals with children, teachers and parents and parent education regarding modelling and nutrition needs of children to control (De Bock 2012); one trial compared a garden‐based intervention and curriculum materials about targeted fruits or vegetables to control (Namenek Brouwer 2013); one trial compared a teacher curriculum, parent curriculum, and preschool policy intervention to control (Natale 2014a); and the fourth trial compared a nutrition education intervention targeting children, parents and preschool staff to control (Williams 2014). Two trials were conducted in a school setting; one trial compared a community, school and parent intervention for nutrition and physical activity health targets to control (De Coen 2012); and the other trial compared a preschool environment, child, parent and teacher intervention to control (Vereecken 2009). One trial, conducted in both a school and a home setting, compared an interactive education intervention about physical activity and healthful eating inclusive of teacher guides and parent newsletters to control (Witt 2012). An additional trial, conducted in both a preschool and a home setting, compared a motivational theatre intervention which included the screening of four DVDs of a puppet show aimed at persuading children to increase vegetable consumption, and provision of resources to parents including ingredients for a vegetable snack, to a no‐intervention control (Nicklas 2017). One trial conducted in both a preschool and home setting compared provision of fruit and vegetables for consumption at home to a parent and child nutrition education with fruit and vegetable provision and a no‐intervention control (Smith 2017).
Child nutrition education interventions
One study tested the impact of an intervention involving the delivery of nutrition education to children within nursery classrooms in increasing child fruit and vegetable intake (Baskale 2011).
Excluded studies
Following an assessment of study titles and abstracts for the update, we sought the full texts of 92 records for further review for study eligibility (738 in total, when combined with 646 from previous reviews) (Figure 1). We were able to locate the full texts of 90 articles (708 in total, when combined with 618 from previous reviews). We considered 78 records from 64 studies (594 records from 507 studies in total) to be ineligible in this review update following the trial screening process (reasons for exclusion of records included participants n = 24; outcomes n = 31; comparator n = 2; study design n = 20; intervention n = 1). See Characteristics of excluded studies for further details.
Studies awaiting classification
We did not identify any new studies that we were unable to classify (we had identified two trials in previous reviews, as no full text was available). See Characteristics of studies awaiting classification.
Ongoing studies
We identified 11 ongoing trials with a published protocol (Characteristics of ongoing studies), for which neither published nor unpublished data were available (eight from the previous reviews and three new ongoing trials). These include: a C‐RCT (Belanger 2016) testing the effect of a multicomponent intervention involving community partnerships and healthy eating training for staff in early childcare centres compared to a no‐intervention control; a RCT (Horodynski 2011) testing the effect of a child‐feeding intervention focused on maternal self‐efficacy during feeding and appropriate feeding styles compared to usual care; a C‐RCT (Østbye 2015) testing the effect of a multicomponent home and childcare intervention compared to a no‐intervention control; a RCT (Sobko 2016) testing the effect of a multicomponent healthy lifestyle programme delivered to parent‐child dyads compared to a wait list or a no‐intervention control; a RCT(Watt 2014) testing the effect of a multicomponent intervention involving parents and childcare staff compared to a no‐intervention control; a RCT (Helle 2017) testing the effect of an eHealth intervention delivered to parents to promote healthy food habits to a no‐intervention control; a C‐RCT (Kobel 2017) testing the effect of a kindergarten‐based healthy lifestyle intervention delivered to parents and children to a no‐intervention control; a RCT (Seguin 2017) testing the effect of a community‐based and cost‐offset community‐supported agricultural intervention to a no‐intervention control; a factorial RCT (Brophy‐Herb 2017) testing the effect of 65 differing levels of support for family meals delivered to families recruited from disadvantaged preschools to a no‐intervention control; a C‐RCT (Hennink‐Kaminski 2017) testing the effect of a multicomponent intervention (including social marketing, child healthy eating and physical activity education, and home components) delivered to preschool teachers and parents to a wait‐list control; and a RCT (Mennella 2017) testing the effect of an intervention involving consumption of vegetables during breastfeeding delivered to mothers to a no‐intervention control.
We identified a further five new ongoing trials in trials registries (four from the previous review and one new ongoing trial), however no published protocol, nor published or unpublished data were available (Characteristics of ongoing studies). These include a RCT testing the effect of a repeated‐exposure intervention to an infant feeding‐schedule intervention to a repeated‐exposure and infant‐feeding intervention to attention‐control (NTR6572); a C‐RCT testing the effect of a taste‐exposure intervention to a nutritional‐education intervention to a taste‐exposure and nutritional‐education intervention to a no‐intervention control (NCT03003923); a RCT testing the effect of a parental‐cooking intervention to a no‐intervention control (ISRCTN45864056); a C‐RCT testing the effect of a warm lunch with a variety of vegetables to a sensory lesson, meal practice and feeding‐style intervention to a no‐intervention control (ISRCTN98064772); and a factorial RCT testing the effect of five interventions to increase complementary feeding behaviour by mothers to a no‐intervention control (NCT03229629).
Risk of bias in included studies
None of the 63 included studies were at low risk in all risk‐of‐bias domains (Figure 2; Figure 3).

Risk of bias graph: review authors' judgements about each risk of bias item presented as percentages across all included studies

Risk of bias summary: review authors' judgements about each risk of bias item for each included study
Random sequence generation
We rated 20 of the 63 studies at low risk of bias for random sequence generation, with all random‐number sequences created using various computer‐based software (Campbell 2013; Cooke 2011; Cravener 2015; Daniels 2014; Duncanson 2013; Fildes 2015; Haire‐Joshu 2008; Kling 2016; Martinez‐Andrade 2014; Namenek Brouwer 2013; Roe 2013; Skouteris 2015; Spill 2010; Spill 2011a; Spill 2011b; Staiano 2016; Vazir 2013; Vereecken 2009; Watt 2009; Wyse 2012). We rated one study (Cohen 1995) at high risk of bias for random sequence generation due to allocation being conducted according to infant's week of birth. The method of sequence generation in the remaining 42 studies was unclear (Anzman‐Frasca 2012; Barends 2013; Baskale 2011; Black 2011; Blissett 2016; Caton 2013; Correia 2014; De Bock 2012; De Coen 2012; de Droog 2014; de Droog 2017; de Wild 2013; de Wild 2015a; de Wild 2015b; de Wild 2017; Fildes 2014; Fisher 2012; Forestell 2007; Gerrish 2001; Harnack 2012; Hausner 2012; Heath 2014; Hetherington 2015; Hunsaker 2017; Keller 2012; Mennella 2008; Natale 2014a; Nicklas 2017; O'Connell 2012; Remington 2012; Remy 2013; Roset‐Salla 2016; Savage 2012; Sherwood 2015; Smith 2017; Sullivan 1994; Tabak 2012; Verbestel 2014; Wardle 2003a; Williams 2014; Witt 2012; Zeinstra 2018).
Allocation
Only five of the 63 studies reported that participant allocation to the experimental group was concealed from those conducting the research (De Bock 2012; Duncanson 2013; Remington 2012; Wardle 2003a; Watt 2009). We judged two studies to have a high risk of selection bias; in one study (de Droog 2017) those responsible for delivering the intervention conducted the allocation and in the other study (Haire‐Joshu 2008), as educators were aware of site allocation when they were enrolling participants to the trial. The remaining 56 studies had an unclear risk of selection bias (Anzman‐Frasca 2012; Barends 2013; Baskale 2011; Black 2011; Blissett 2016; Campbell 2013; Caton 2013; Cohen 1995; Cooke 2011; Correia 2014; Cravener 2015; Daniels 2014; De Coen 2012; de Droog 2014; de Wild 2013; de Wild 2015a; de Wild 2015b; de Wild 2017; Fildes 2014; Fildes 2015; Fisher 2012; Forestell 2007; Gerrish 2001; Harnack 2012; Hausner 2012; Heath 2014; Hetherington 2015; Hunsaker 2017; Keller 2012; Kling 2016; Martinez‐Andrade 2014; Mennella 2008; Namenek Brouwer 2013; Natale 2014a; Nicklas 2017; O'Connell 2012; Remy 2013; Roe 2013; Roset‐Salla 2016; Savage 2012; Sherwood 2015; Skouteris 2015; Smith 2017; Spill 2010; Spill 2011a; Spill 2011b; Staiano 2016; Sullivan 1994; Tabak 2012; Vazir 2013; Verbestel 2014; Vereecken 2009; Williams 2014; Witt 2012; Wyse 2012; Zeinstra 2018).
Blinding
Performance bias
In 28 of the studies, we judged the potential for trial outcomes to be influenced by participants or personnel delivering the intervention to be high, due to the lack of blinding and the method used for outcome assessment (e.g. self‐report) (Anzman‐Frasca 2012; Barends 2013; Baskale 2011; Black 2011; Campbell 2013; Cohen 1995; Daniels 2014; De Bock 2012; De Coen 2012; de Wild 2017; Fildes 2014; Fildes 2015; Gerrish 2001; Haire‐Joshu 2008; Hetherington 2015; Martinez‐Andrade 2014; Natale 2014a; Roset‐Salla 2016; Sherwood 2015; Skouteris 2015; Smith 2017; Tabak 2012; Vazir 2013; Verbestel 2014; Vereecken 2009; Watt 2009; Williams 2014; Wyse 2012). We rated 29 studies at low risk of performance bias, due to blinding or the use of objective outcome assessments, which were unlikely to be influenced by awareness of group allocation (e.g. weighing food on electronic scales) (Blissett 2016; Caton 2013; Cooke 2011; Correia 2014; Cravener 2015; de Droog 2014; de Droog 2017; de Wild 2013; de Wild 2015a; de Wild 2015b; Duncanson 2013; Fisher 2012; Hausner 2012; Heath 2014; Keller 2012; Kling 2016; Namenek Brouwer 2013; O'Connell 2012; Remington 2012; Remy 2013; Roe 2013; Savage 2012; Spill 2010; Spill 2011a; Spill 2011b; Sullivan 1994; Wardle 2003a; Witt 2012; Zeinstra 2018). For the six remaining studies the risk of performance bias was unclear (Forestell 2007; Harnack 2012; Hunsaker 2017; Mennella 2008; Nicklas 2017; Staiano 2016).
Detection bias
We rated 25 studies at high risk of detection bias, due to participants or assessors not being blind to group allocation and the use of self‐report measures (Baskale 2011; Black 2011; Campbell 2013; Cohen 1995; Daniels 2014; De Bock 2012; De Coen 2012; de Wild 2017; Fildes 2014; Forestell 2007; Heath 2014; Hunsaker 2017; Martinez‐Andrade 2014; Namenek Brouwer 2013; Natale 2014a; Roset‐Salla 2016; Sherwood 2015; Skouteris 2015; Smith 2017; Spill 2010; Tabak 2012; Verbestel 2014; Vereecken 2009; Williams 2014; Wyse 2012). Blinding of assessors, or the objective measurement of child's fruit and vegetable intake which is unlikely to be impacted by lack of blinding (e.g. the food was weighed or counted), meant that 31 studies had a low risk of detection bias (Anzman‐Frasca 2012; Blissett 2016; Caton 2013; Cooke 2011; Correia 2014; de Droog 2014; de Droog 2017; de Wild 2013; de Wild 2015a; de Wild 2015b; Duncanson 2013; Fisher 2012; Gerrish 2001; Haire‐Joshu 2008; Hausner 2012; Keller 2012; Kling 2016; Mennella 2008; Nicklas 2017; O'Connell 2012; Remy 2013; Remington 2012; Savage 2012; Spill 2011a; Spill 2011b; Sullivan 1994; Vazir 2013; Wardle 2003a; Watt 2009; Witt 2012; Zeinstra 2018). The remaining seven studies had an unclear risk of detection bias (Barends 2013; Cravener 2015; Fildes 2015; Harnack 2012; Hetherington 2015; Roe 2013; Staiano 2016).
Incomplete outcome data
Eight studies reported no attrition, and therefore had a very low risk of bias (Anzman‐Frasca 2012; Cravener 2015; Gerrish 2001; Nicklas 2017; O'Connell 2012; Savage 2012; Spill 2010; Staiano 2016). A further 22 studies reported a low loss of participants (usually less than 10%) and similar losses across arms and we considered them to be at low risk, too (Barends 2013; Cooke 2011; de Wild 2015a; Fildes 2015; Fisher 2012; Haire‐Joshu 2008; Hausner 2012; Heath 2014; Hetherington 2015; Kling 2016; Namenek Brouwer 2013; Remington 2012; Roe 2013; Sherwood 2015; Skouteris 2015; Smith 2017; Spill 2011b; Sullivan 1994; Tabak 2012; Vazir 2013; Wardle 2003a; Wyse 2012). Twenty‐seven studies had a high risk of bias due to high attrition rates, unequal attrition across experimental arms, or an intention‐to‐treat analysis not being used (Baskale 2011; Blissett 2016; Caton 2013; Correia 2014; Daniels 2014; De Bock 2012; De Coen 2012; de Droog 2017; de Wild 2013; de Wild 2015b; Duncanson 2013; Fildes 2014; Forestell 2007; Hausner 2012; Hunsaker 2017; Keller 2012; Martinez‐Andrade 2014; Mennella 2008; Natale 2014a; Remy 2013; Roset‐Salla 2016; Spill 2011a; Verbestel 2014; Watt 2009; Williams 2014; Witt 2012; Zeinstra 2018). Six studies had an unclear risk of attrition bias (Black 2011; Campbell 2013; Cohen 1995; de Droog 2014; de Wild 2017; Vereecken 2009).
Selective reporting
Most studies had an unclear risk of selective reporting (Anzman‐Frasca 2012; Barends 2013; Baskale 2011; Black 2011; Blissett 2016; Caton 2013; Cohen 1995; Cooke 2011; Correia 2014; Cravener 2015; De Bock 2012; De Coen 2012; de Droog 2014; de Wild 2015a; de Wild 2015b; Fildes 2014; Fildes 2015; Fisher 2012; Forestell 2007; Gerrish 2001; Haire‐Joshu 2008; Harnack 2012; Hausner 2012; Heath 2014; Hetherington 2015; Hunsaker 2017; Keller 2012; Mennella 2008; Natale 2014a; O'Connell 2012; Remington 2012; Roset‐Salla 2016; Savage 2012; Skouteris 2015; Smith 2017; Staiano 2016; Sullivan 1994; Tabak 2012; Vazir 2013; Verbestel 2014; Vereecken 2009; Wardle 2003a; Williams 2014; Witt 2012; Zeinstra 2018). We judged one trial (Campbell 2013) to be at high risk of bias due to outcomes referred to in the protocol not being reported. The remaining 17 studies reported all expected outcomes and we rated them at low risk of bias (Daniels 2014; de Droog 2017; de Wild 2013; de Wild 2017; Duncanson 2013; Kling 2016; Martinez‐Andrade 2014; Namenek Brouwer 2013; Nicklas 2017; Remy 2013; Roe 2013; Sherwood 2015; Spill 2010; Spill 2011a; Spill 2011bWatt 2009; Wyse 2012).
Other potential sources of bias
Of the 32 RCTs, 19 had a low risk of bias (Anzman‐Frasca 2012; Barends 2013; Caton 2013; Cravener 2015; de Droog 2014; de Droog 2017; de Wild 2017; Fildes 2015; Forestell 2007; Gerrish 2001; Heath 2014; Hunsaker 2017; Remington 2012; Savage 2012; Sherwood 2015; Skouteris 2015; Sullivan 1994; Wardle 2003a; Watt 2009), eight had an unclear risk of bias (Black 2011; Blissett 2016; Cohen 1995; Hetherington 2015; Keller 2012; Remy 2013; Staiano 2016; Tabak 2012) and five had a high risk of bias (Daniels 2014; de Wild 2015a; Duncanson 2013; Fildes 2014; Mennella 2008) for other potential sources of bias. One trial did not account for clustering in the analysis, even though the trial protocol said clustering would be accounted for (Daniels 2014). Four trials had a high risk of bias, as they reported baseline imbalances between study groups that were not accounted for in the analysis (de Wild 2015a; Duncanson 2013; Fildes 2014; Mennella 2008).
Of the 21 C‐RCTs, seven had a low risk of bias (Baskale 2011; Campbell 2013; Cooke 2011; Haire‐Joshu 2008; Vazir 2013; Vereecken 2009; Wyse 2012), 12 had unclear risk of bias (De Bock 2012; Fisher 2012; Hausner 2012; Martinez‐Andrade 2014; Namenek Brouwer 2013; Natale 2014a; Nicklas 2017; Roset‐Salla 2016; Smith 2017; Williams 2014; Witt 2012; Zeinstra 2018) and two had high risk of bias (De Coen 2012; Verbestel 2014). Both De Coen 2012 and Verbestel 2014 had high risk of bias due to recruitment bias, as communities were randomised first before schools, childcare centres and participants were invited to participate.
Of the 10 cross‐over trials, nine had a low risk of bias (Correia 2014; de Wild 2013; de Wild 2015b; Harnack 2012; Kling 2016; Roe 2013; Spill 2010; Spill 2011a; Spill 2011b), and one study had high risk of bias (O'Connell 2012), due to differences in baseline vegetable consumption that were not adjusted for in the analysis.
Effects of interventions
See: Summary of findings for the main comparison Child feeding interventions compared to no intervention for children aged five years and under; Summary of findings 2 Parent nutrition education interventions compared to no intervention for children aged five years and under; Summary of findings 3 Multicomponent interventions compared to no intervention for children aged five years and under; Summary of findings 4 Child nutrition education interventions compared to no intervention for children aged five years and under
Primary outcome. Effectiveness of interventions in increasing the consumption of fruit and/or vegetables
All the included trials reported the impact of the effectiveness of the intervention on a measure of children's fruit or vegetable intake. Variability in the measurement and reporting of intervention effects as change from baseline or final value scores precluded statistical examination of heterogeneity. Nonetheless, examination of the interventions tested, trial settings and study populations suggested that the included trials were heterogeneous and we conducted meta‐analyses pooling data from trials where we considered interventions to be similar. Otherwise, we have provided a narrative synthesis of trial findings.
Child‐feeding practice interventions
Short‐term impact (less than 12 months)
The effects of interventions targeting child‐feeding practices were mixed. Meta‐analysis pooling post‐intervention data (follow‐up period range: immediate to six months) from trials comparing child‐feeding practices to no treatment (Cohen 1995; Cooke 2011; Cravener 2015; Daniels 2014; Fildes 2014; Fildes 2015; Hetherington 2015; Keller 2012; O'Connell 2012; Remington 2012; Staiano 2016; Wardle 2003a; Zeinstra 2018) revealed an overall small positive effect on vegetable consumption (SMD 0.33, 95% CI 0.13 to 0.54; participants = 1741; studies = 13; I2 = 70%; very low‐quality evidence; Analysis 1.1), which was equivalent to an increase of 3.50 g as‐desired consumption of vegetables. Results were similar in sensitivity analyses of studies at low risk of bias (SMD 0.23, 95% CI 0.03 to 0.44; participants = 487; studies = 5; I2 = 14%; Analysis 1.2), of studies with a primary outcome of child fruit or vegetable consumption (SMD 0.45, 95% CI 0.19 to 0.70; participants = 1331; studies = 10; I2 = 73%; Analysis 1.3), and of studies with no or low attrition and studies with high attrition that undertook intention‐to‐treat analyses (SMD 0.29, 95% CI 0.10 to 0.48; participants = 757; studies = 8; I2 = 27%; Analysis 1.4).
One study that compared one or more child‐feeding practice interventions to a no‐treatment control did not report sufficient data to enable pooling. Harnack 2012 reported a significant increase in intake of fruit compared to a control group for an intervention where fruit and vegetables were served prior to a meal.
Twenty‐five trials compared the effectiveness of two or more child‐feeding interventions but we could not synthesise them in meta‐analyses due to variability in the compared interventions (Anzman‐Frasca 2012; Barends 2013; Blissett 2016; Caton 2013; Correia 2014; de Droog 2014; de Droog 2017; de Wild 2013; de Wild 2015a; de Wild 2015b; de Wild 2017; Fisher 2012; Forestell 2007; Gerrish 2001; Hausner 2012; Heath 2014; Kling 2016; Mennella 2008; Remy 2013; Roe 2013; Savage 2012; Spill 2010; Spill 2011a; Spill 2011b; Sullivan 1994). The interventions compared in these trials varied greatly; 10 of the 25 trials reported evidence of an increase in fruit or vegetable consumption for one intervention compared to another (de Droog 2014; de Droog 2017; de Wild 2013; Forestell 2007; Gerrish 2001; Heath 2014; Roe 2013; Spill 2010; Spill 2011a; Spill 2011b).
Long‐term impact (12 months or longer)
Two studies tested the long term effect of a child‐feeding practice intervention. One study reported no long‐term effect on either fruit or vegetable intake as measured by 24‐hour recall 3½ years after a complementary feeding intervention compared to usual care (Daniels 2014). The other study (Cohen 1995), which compared exclusive breastfeeding, complementary feeding with breastfeeding, and complementary feeding with breastfeeding on demand reported no difference between groups at 12 months' follow‐up compared to the positive effect that was reported at nine months' follow‐up.
Parent nutrition education interventions
Short‐term impact (less than 12 months)
Interventions targeting parent nutrition education were generally not effective. Meta‐analysis pooling post‐intervention data (follow‐up period range: immediate to six months) from trials comparing parent nutrition education interventions to no treatment (Campbell 2013; Duncanson 2013; Haire‐Joshu 2008; Martinez‐Andrade 2014; Roset‐Salla 2016; Sherwood 2015; Skouteris 2015; Tabak 2012; Verbestel 2014; Watt 2009; Wyse 2012) revealed no overall effect on child consumption of fruit and vegetables (SMD 0.12, 95% CI ‐0.03 to 0.28; participants = 3078; studies = 11; I2 = 69%; very low‐quality evidence; Analysis 2.1). Results were similar in sensitivity analyses of studies with a primary outcome of children's fruit or vegetable consumption (SMD 0.04, 95% CI ‐0.08 to 0.16; participants = 2792; studies = 8; I2 = 46%; Analysis 2.2), and of studies with no or low attrition and studies with high attrition that undertook intention‐to‐treat analyses (SMD 0.12, 95% CI ‐0.00 to 0.24; participants = 2518; studies = 7; I2 = 40%; Analysis 2.3). We did not conduct sensitivity analyses by risk of bias, as we judged all studies to be at high risk of bias in at least one domain.
We were unable to pool three trials in the meta‐analysis. Black 2011 found an intervention targeting parent responsivity and behaviour management to be effective in increasing total fruit intake compared to control. Hunsaker 2017 found a parent health report on fruit and vegetable consumption to be effective in increasing total vegetable intake (but not fruit intake) compared to control. Vazir 2013 reported both the parent complementary‐feeding intervention and a parent complementary‐feeding and home‐visit intervention to be effective in increasing both fruit and vegetable intake compared to control.
Long‐term impact (12 months or longer)
Four studies reported the long‐term impact of a parent nutrition education intervention (Duncanson 2013; Skouteris 2015; Watt 2009; Wyse 2012). Of these, only one trial reported a significant long‐term effect on children's fruit and vegetable consumption (Watt 2009). The trial examining the impact of a parent intervention targeting infant‐feeding practice found a short‐term effect at nine months and long‐term effect at 15‐month follow‐up on fruit and vegetable consumption compared to usual care (Watt 2009). The other three trials reporting long‐term impacts of parent interventions either reported a short‐term effect that was not sustained at long‐term follow‐up (Skouteris 2015; Wyse 2012), or no effect at either short‐ or long‐term follow‐up on children's fruit or vegetable consumption (Duncanson 2013).
Multicomponent interventions
Short‐term impact (less than 12 months)
The effects of multicomponent interventions were mixed. Meta‐analysis pooling post‐intervention data (follow‐up period range: immediate to one month) from multicomponent intervention trials (De Coen 2012; Namenek Brouwer 2013; Nicklas 2017; Smith 2017; Williams 2014) revealed an overall small positive effect on child consumption of fruit and vegetables (SMD 0.35, 95% CI 0.04 to 0.66; participants = 2009; studies = 5; I2 = 80%; low‐quality evidence; Analysis 3.1). This was equivalent to an increase of 0.37 cups of fruit and vegetables per day. Results were similar in sensitivity analyses of studies with no or low attrition or high attrition that undertook intention‐to‐treat analyses (SMD 0.65, 95% CI 0.43 to 0.88; participants = 413; studies = 3; I2 = 0%; Analysis 3.3). There was, however, no overall effect on child consumption of fruit and vegetables for studies with a primary outcome of children's fruit or vegetable consumption (SMD 0.44, 95% CI ‐0.00 to 0.87; participants = 1315; studies = 4; I2 = 85%; Analysis 3.2). We did not conduct a sensitivity analysis to examine the impact of high risk of bias, as all but one study had a high risk of bias in at least one domain.
We were unable to pool four studies in meta‐analysis, due to insufficient data (De Bock 2012; Natale 2014a; Vereecken 2009; Witt 2012). Three trials (De Bock 2012; Natale 2014a; Witt 2012) reported significant effects of the interventions tested on both fruit and vegetable consumption, and one trial reported significant effects of the intervention on fruit but not vegetable consumption (Vereecken 2009).
One of the studies (Smith 2017) that was pooled in the multicomponent intervention meta‐analysis additionally compared an intervention of provision of fruit and vegetables to a no‐intervention control group. The study reported a significant effect of the intervention on vegetable consumption.
Long‐term impact (12 months or longer)
No trials testing the multicomponent interventions reported long‐term impact.
Child nutrition education interventions
Short‐term impact (less than 12 months)
The one study that tested the effect of a nutrition education intervention targeting children (Baskale 2011) reported an increase in some of the fruits and vegetables assessed in the intervention group and no significant differences in the control group, but did not report analyses comparing treatment groups (low‐quality evidence).
Long‐term impact (12 months or longer)
The one study that tested the effect of a nutrition education intervention did not report long‐term impact.
Subgroup analyses
Interventions targeting boys and girls
All the included studies in this review covered both boys and girls. The impact of intervention on gender subgroups was not reported in any of the included trials, so subgroup analyses on this basis was not possible.
Interventions targeting minority groups and indigenous populations
Subgroup analysis of trials that targeted minority groups and indigenous populations was not possible, due to the limited number of included studies for each comparison; we therefore present them narratively. Nine of the 63 included trials examined the impact of interventions on predominantly disadvantaged populations (Black 2011; Cohen 1995; Cooke 2011; de Droog 2017; Haire‐Joshu 2008; Natale 2014a; Nicklas 2017; Smith 2017; Watt 2009). Three trials of child‐feeding interventions recruited predominantly disadvantaged populations (Cohen 1995; Cooke 2011; de Droog 2017). One trial recruited participants from low‐income neighbourhoods (Cohen 1995). The trial found that a complementary feeding with breastfeeding on demand intervention increased the consumption of vegetables compared to exclusive breastfeeding at short‐term follow‐up (nine months), but found no effect at long‐term follow‐up (12 months). One trial recruited participants through schools where the proportion of children who had English as a second language, came from minority ethnic backgrounds or were eligible for free school meals was above average (Cooke 2011). The study demonstrated that repeated food exposure coupled with reward significantly increased the consumption of a target vegetable. The third trial recruited participants predominantly from low socioeconomic status households (de Droog 2017). The study found an interactive‐reading intervention significantly increased the consumption of a target vegetable. Three trials of parent interventions recruited participants from disadvantaged communities including underserved families, single or minority parent homes, those living in poverty or low‐income families (Black 2011; Haire‐Joshu 2008; Watt 2009). Two trials found no improvement in overall child fruit or vegetable intake based on the primary trial outcome measures (Haire‐Joshu 2008; Watt 2009); the other trial found the intervention targeting parent responsivity and behaviour management to be effective in increasing total fruit intake (Black 2011). Three trials of multicomponent interventions recruited participants from subsidised childcare centres (Natale 2014a; Nicklas 2017; Smith 2017). One trial found an intervention targeting teachers, parents and childcare policies to increase both fruit and vegetable consumption (Natale 2014a), one trial found a theatre performance intervention involving both parents and teachers increased vegetable consumption (Nicklas 2017), and the other trial found both a fruit and vegetable provision intervention and an intervention involving parent and child nutrition education plus fruit and vegetable provision increased fruit and vegetable consumption (as assessed via skin carotenoid levels compared to a no intervention control (Smith 2017).
Interventions delivered in various settings
Subgroup analyses of child‐feeding practice interventions by setting revealed an overall positive effect on children's vegetable consumption for those interventions delivered in home settings (SMD 0.56, 95% CI 0.18 to 0.95; participants = 474; studies = 4) and in both home and laboratory settings (SMD 0.74, 95% CI 0.09 to 1.39; participants = 40; studies = 2), but no overall effect for those interventions delivered in school or preschool settings (SMD 0.20, 95% CI ‐0.01 to 0.41; participants = 591; studies = 4). Subgroup analyses for other settings (including one set in child health clinics, and one in home or health facilities) was not possible due to the limited number of studies for each setting.
Similar to the main analysis, subgroup analyses of parent nutrition education interventions by setting revealed no overall effect for those interventions delivered in a home setting (SMD 0.06, 95% CI ‐0.16 to 0.27; participants = 2047; studies = 5) or a preschool setting (SMD 0.43, 95% CI ‐0.27 to 1.13; participants = 243; studies = 2). Subgroup analyses for other settings (one each in parenting groups, primary care clinics or community health centres) was not possible, due to the limited number of studies for each setting.
In contrast to the main analysis, subgroup analyses of multicomponent interventions by setting revealed no overall effect for those interventions delivered in school or preschool settings (SMD 0.07, 95% CI ‐0.07 to 0.20; participants = 1608; studies = 3). Subgroup analyses for interventions delivered in either a preschool or a home setting, or clinic and home setting were not possible, due to the limited number of studies for each setting.
Interventions of varying intensities
We did not conduct subgroup analyses of trials based on interventions of varying intensities, due to the limited information across included studies about the number and duration of intervention contacts or components.
Interventions delivered in different modalities
Forty‐eight of the 63 trials used face‐to‐face intervention delivery only (Anzman‐Frasca 2012; Barends 2013; Baskale 2011; Black 2011; Blissett 2016; Caton 2013; Cohen 1995; Cooke 2011; Correia 2014; Cravener 2015; Daniels 2014; De Bock 2012; de Droog 2014; de Droog 2017; de Wild 2013; de Wild 2015a; de Wild 2015b; de Wild 2017; Fildes 2014; Fisher 2012; Forestell 2007; Gerrish 2001; Harnack 2012; Hausner 2012; Heath 2014; Hetherington 2015; Keller 2012; Kling 2016; Martinez‐Andrade 2014; Mennella 2008; Namenek Brouwer 2013; O'Connell 2012; Remington 2012; Remy 2013; Roe 2013; Roset‐Salla 2016; Savage 2012; Skouteris 2015; Spill 2010; Spill 2011a; Spill 2011b; Sullivan 1994; Vazir 2013; Verbestel 2014; Wardle 2003a; Watt 2009; Witt 2012; Zeinstra 2018), reporting mixed findings. Similar to the overall analyses, subgroup analysis of face‐to‐face‐delivered child‐feeding practice interventions versus control revealed an overall positive intervention effect on vegetable consumption (SMD 0.32, 95% CI 0.09 to 0.56; participants = 1489; studies = 11; Analysis 1.5).
Face‐to‐face‐delivered parent nutrition education interventions versus control revealed no overall intervention effect on children's fruit and vegetable consumption (SMD 0.12, 95% CI ‐0.20 to 0.45; participants = 826; studies = 5; Analysis 2.4). Face‐to‐face intervention delivery alone was used in only one multicomponent intervention (Namenek Brouwer 2013) and the only child nutrition education intervention (Baskale 2011), for which mixed results were reported.
Subgroup analysis for other modalities was not possible due to the limited number of included studies for each comparison. Ten trials used face‐to‐face in combination with other strategies: computer‐tailored newsletters and storybooks (Haire‐Joshu 2008); school‐based education, training, policy and environment change (Vereecken 2009); visual and written materials (Campbell 2013); educational materials, resources (posters, brochures) and letters (De Coen 2012); a leaflet (Fildes 2015); newsletters and menu modification (Natale 2014a); printed materials and resources (Williams 2014); telephone and written materials (Sherwood 2015), written materials and provision of fruit and vegetables (Smith 2017), and DVD (Nicklas 2017). Two trials used audio/visual only: DVDs (Staiano 2016) and DVD and CD (Duncanson 2013). A further two trials used telephone and mail (Tabak 2012; Wyse 2012). One trial used written materials only (Hunsaker 2017). Trials that incorporated other intervention modalities reported mixed findings.
Secondary outcome 1. Cost or cost effectiveness of interventions to increase the consumption of fruit or vegetables or both
Information about intervention costs was reported in one trial (Campbell 2013; very low‐quality evidence). The parent nutrition education trial reported the total estimated cost of delivering a parent intervention for infant feeding, physical activity and sedentary behaviours delivered by a dietitian as approximately AUD 500 per family.
Secondary outcome 2. Adverse effects of interventions to increase the consumption of fruit or vegetables or both
Two trials reported information on any adverse events or unintended adverse consequences of the intervention. One child‐feeding practice intervention trial (Spill 2011a; very low‐quality evidence) reported no adverse effects on the amount of the meal consumed following implementation of an intervention involving incorporation of vegetable puree into meals at three different levels of energy density. The other trial, on parent nutrition education, (Wyse 2012; very low‐quality evidence) reported no adverse effect on family food expenditure following implementation of a multicomponent intervention delivered over the telephone to improve parental knowledge and skills about the home food environment.
Discussion
Summary of main results
In line with the importance of encouraging fruit and vegetable consumption among children in early childhood, this updated review has identified a number of new RCTs of interventions investigating this health behaviour. The findings suggest that child‐feeding practice and multicomponent interventions targeting fruit and vegetable consumption by children aged five and younger are effective. Most of the included studies examined specific child‐feeding practices; whilst meta‐analysis of 13 of the 39 trials suggested these interventions were effective, collectively the findings for these interventions were equivocal. The second and third most common interventions were parent nutrition education and multicomponent interventions, for which we found evidence of effect in the short term in meta‐analyses for multicomponent interventions but not parent nutrition interventions. Only one trial assessed the effect of a child nutrition education intervention. Subgroup analyses on the basis of setting and modality were generally consistent with the main analyses for child‐feeding practices, parent nutrition education and multicomponent interventions. Insufficient evidence was available to determine the long‐term effectiveness of all approaches, or the cost effectiveness or any adverse consequences of the interventions tested.
Overall completeness and applicability of evidence
The review update identified a number of newly published RCTs, in line with efforts globally to increase fruit and vegetable intake (World Health Organization 2003). Such studies predominantly focused on fruit and vegetable consumption determinants such as nutrition knowledge and skills, and food environments. Only one of the included trials in this review reported cost analyses and only two reported any unintended adverse effects. These factors are important considerations for health practitioners and policy makers but are often not reported in randomised trials (Waters 2011) or examined in systematic reviews (Hopewell 2008; Wolfenden 2010b).
Furthermore, the limited number of relevant trials identified for inclusion also prevented thorough examination of the impact of the interventions by gender, indigenous or disadvantaged populations, setting, varying intensity and modality. We found a number of trial protocols (see Characteristics of ongoing studies) which may address some of these gaps in the literature, and are likely to be eligible for inclusion in future updates of the review, including a randomised controlled trial of an eight‐lesson in‐home intervention in economically and educationally disadvantaged parents of children aged one to three years (Horodynski 2011).
The external validity of the review findings are limited. Most of the trials were conducted in the USA, Western Europe or the United Kingdom. Study attrition varied between studies, ranging from 0% to 68%.
Quality of the evidence
We used the GRADE approach to assess the quality of the evidence for the primary outcome of fruit and vegetable intake, which was conducted separately for each intervention type. See summary of findings Table for the main comparison; summary of findings Table 2; summary of findings Table 3; summary of findings Table 4. The quality of the evidence for fruit and vegetable intake across intervention types varied from very low to low. We rated the quality of evidence for specific child‐feeding interventions as very low, downgraded for unexplained heterogeneity, methodological limitations and a high probability of publication bias (summary of findings Table for the main comparison). Methodological limitations related to allocation concealment and selective reporting being at unclear or high risk for most of the trials. A high probability of publication bias related to the relatively few trials being included in the meta‐analysis (12 of 39 trials) and inspection of funnels plots (Figure 4). We assessed the quality of evidence for parent nutrition education interventions as very low, downgraded for unexplained heterogeneity, methodological limitations and imprecision (summary of findings Table 2; Figure 5). The methodological limitations related to most of the trials being at high risk of bias for lack of blinding, and at unclear or high risk for allocation concealment, loss to follow‐up, and selective reporting. Imprecision related to the confidence intervals crossing the null value of zero. We rated the quality of evidence for multicomponent interventions as low, downgraded for unexplained heterogeneity, and methodological limitations (summary of findings Table 3; Figure 6). The methodological limitations related to most of the trials being at high risk of bias for lack of blinding, and at unclear or high risk for allocation concealment, loss to follow‐up, and selective reporting. Such assessments suggest that the true effect may be substantially different from the intervention effects reported in the review, with future research very likely to change the estimate for specific infant feeding and parent nutrition education, and likely to change the estimate for multicomponent interventions. We rated the quality of the evidence for child nutrition interventions for the single included study as low, downgraded for methodological limitations and imprecision (summary of findings Table 4). The methodological limitations related to a high risk of bias due to lack of blinding and loss to follow‐up, and imprecision related to a sample size of fewer than 400 participants. Future research is likely to change the estimate for child nutrition interventions.

Funnel plot of comparison 1. Short‐term impact (< 12 months) of child‐feeding intervention versus no intervention on child consumption of target fruit or vegetable, outcome 1.1, fruit and/or vegetable intake

Funnel plot of comparison 3. Short‐term impact (< 12 months) of parent nutrition education intervention versus usual care, outcome 3.1, fruit and/or vegetable intake

Funnel plot of comparison 4. Short‐term impact (< 12 months) of multicomponent intervention versus usual care, outcome 4.1, fruit and/or vegetable intake
Potential biases in the review process
The review used a comprehensive and rigorous methodology, including a broad search strategy, the screening of trials and extraction of data by two independent review authors, and the appraisal of risks of bias within the included studies. Furthermore, the review did not restrict publications by language. Three aspects of selection bias, however, are worth noting. First, we excluded trials where fruit and vegetable intake was not considered to be a primary trial outcome, to avoid any potential confounding effects of other behavioural interventions (such as physical activity). This restriction may lead to overestimates of intervention effects if in practice they are delivered in the context of other health initiatives. Second, the inclusion of trials that did not explicitly state a primary outcome but did assess fruit or vegetable intake in the review may have biased the results. However sensitivity analyses excluding studies that did not state fruit and vegetable intake as a primary outcome suggested this was limited, as results were similar. Third, studies that were conducted predominantly in disadvantaged populations were included within the overall synthesis. It is possible that effects of the interventions tested may differ between disadvantaged and general populations, which may limit the generalisability of the review findings. Finally, the review was restricted to RCTs and cross‐over trials, with trials included in the review tending to focus on interventions targeting fruit and vegetable consumption determinants, such as nutrition knowledge and skills, or the food environment of settings. Other trials targeting fruit and vegetable intake that may be less amenable to evaluation using randomised controlled designs, such as those requiring macro‐environmental changes, may have been overlooked.
Agreements and disagreements with other studies or reviews
The equivocal findings of the infant‐feeding interventions, such as repeated food exposure, are similar in part to previous reviews. An early systematic review of healthy eating interventions for children aged under five years (Tedstone 1998), published by the Health Education Authority, concluded that repeated food exposure is effective in enhancing children's willingness to consume novel foods provided tasting was included as a part of the exposure. Enhanced food acceptance following repeated food exposure has also been reported in other reviews and controlled trials (Contento 1995). As Cooke 2011 points out in the Background review of research for their randomised trial, evidence about the use of rewards to encourage children's consumption of targeted foods appears more equivocal. The positive impact of both social and non‐tangible rewards reported in Cooke 2011, were however consistent with previous trials in community settings using tangible non‐food rewards and social rewards targeting the fruit or vegetable intake of school‐aged children (Hendy 1999). The large number of trials comparing alternative and heterogenous child‐feeding practice interventions are difficult to interpret, given that they did not include a no‐treatment control group, and few reported one intervention to be more effective than another.
The largely null findings of this review for the impact of parent interventions are consistent with those reported in previous reviews of dietary interventions. For example, a comprehensive review of the impact of home‐visiting programmes delivered to parents concluded that there was little evidence to recommend such interventions as means of improving children's diet, given the mixed findings of the reviewed studies (Elkan 2000). Among the trials with a positive intervention effect included in the Elkan 2000 review was a pre‐post study of an intensive intervention provided to low‐income mothers of children aged one to four years (James 1992). In this study, dietician‐trained general practitioners and health visitors provided advice and support as part of a primary‐care home‐visiting intervention lasting up to 20 weeks. Post‐intervention improvements in diet were reported, including the consumption of fruits and vegetables. Similarly, a systematic review that examined the effectiveness of parental interventions on the diets of children aged two to five found mixed results for children’s diets or feeding practices or both (Peters 2012).
The positive findings for multicomponent interventions are consistent with some previous reviews of interventions. For example, a systematic review of interventions to improve diet, physical activity or to prevent weight gain for children of five years or under, and which included both randomised and non‐randomised designs, identified nine studies of interventions implemented in preschool or childcare settings (Hesketh 2010). Three studies included some assessment of dietary outcome. In the first, Head Start preschools were assigned to either a menu intervention to reduce the fat content of meals provided to children in care; the same menu intervention plus nutrition education; or a third usual‐care control condition (Williams 2004). Both intervention arms of the trial reduced the fat content of foods served to children compared with the preschools in the control condition. The remaining two trials assessed the impact of a healthy eating and physical activity obesity‐prevention programme ‘Hip‐Hop to Health Jr’, implemented in two different populations attending Head Start preschools (Fitzgibbon 2005; Fitzgibbon 2006). In Fitzgibbon 2005, intervention children reported less saturated fat intake at the one‐year follow‐up, but not total fat or dietary fibre. No improvements in dietary intake were reported in the second trial (Fitzgibbon 2006). Similarly, systematic reviews of school‐based fruit and vegetable interventions have frequently concluded that multicomponent initiatives are the most effective in increasing fruit and vegetable consumption in older children, but such effects are only modest and reported to be driven largely by increased fruit intake (Burchett 2003; Ciliska 2000; French 2003; Knai 2006). A systematic review of European school‐based interventions also concluded that multicomponent interventions are effective for improving children’s fruit and vegetable intakes (Van Cauwenberghe 2010).
In contrast to the findings of this review, a number of other reviews have found multicomponent interventions to not be effective. A recent meta‐analysis showed no significant differences between multicomponent interventions that promoted fruit and vegetable consumption and control conditions in a primary school setting (Delgado‐Noguera 2011). Another systematic review that focused on the fruit and vegetable intake of children aged five to 12 found that school‐based interventions had only a minimal effect on vegetable consumption, whereas they found a moderate impact on children’s fruit intake (Evans 2012). A recent systematic review that examined interventions aimed at increasing children’s (aged two to 12 years) vegetable intake in home and community settings found that only a minority of interventions that targeted children’s vegetable intake alone were effective in the short term (Hendrie 2017). In contrast, when vegetable intake was addressed as part of a healthy diet or lifestyle intervention, most interventions showed short‐term effectiveness (Hendrie 2017). The comparison of the findings of this review to each of these previous reviews of multicomponent interventions is limited by their inclusion of older children, which may explain the contrasting findings.

Study flow diagram

Risk of bias graph: review authors' judgements about each risk of bias item presented as percentages across all included studies

Risk of bias summary: review authors' judgements about each risk of bias item for each included study

Funnel plot of comparison 1. Short‐term impact (< 12 months) of child‐feeding intervention versus no intervention on child consumption of target fruit or vegetable, outcome 1.1, fruit and/or vegetable intake

Funnel plot of comparison 3. Short‐term impact (< 12 months) of parent nutrition education intervention versus usual care, outcome 3.1, fruit and/or vegetable intake

Funnel plot of comparison 4. Short‐term impact (< 12 months) of multicomponent intervention versus usual care, outcome 4.1, fruit and/or vegetable intake

Comparison 1 Short‐term impact (< 12 months) of child‐feeding intervention versus no intervention, Outcome 1 Vegetable intake.

Comparison 1 Short‐term impact (< 12 months) of child‐feeding intervention versus no intervention, Outcome 2 Vegetable intake ‐ sensitivity analysis ‐ risk of bias.

Comparison 1 Short‐term impact (< 12 months) of child‐feeding intervention versus no intervention, Outcome 3 Vegetable intake ‐ sensitivity analysis ‐ primary outcome.

Comparison 1 Short‐term impact (< 12 months) of child‐feeding intervention versus no intervention, Outcome 4 Vegetable intake ‐ sensitivity analysis ‐ missing data.

Comparison 1 Short‐term impact (< 12 months) of child‐feeding intervention versus no intervention, Outcome 5 Vegetable intake ‐ subgroup analysis ‐ modality.

Comparison 1 Short‐term impact (< 12 months) of child‐feeding intervention versus no intervention, Outcome 6 Vegetable intake ‐ subgroup analysis ‐ setting.

Comparison 2 Short‐term impact (< 12 months) of parent nutrition education intervention versus no intervention, Outcome 1 Fruit and vegetable intake.

Comparison 2 Short‐term impact (< 12 months) of parent nutrition education intervention versus no intervention, Outcome 2 Fruit and vegetable intake ‐ sensitivity analysis ‐ primary outcome.

Comparison 2 Short‐term impact (< 12 months) of parent nutrition education intervention versus no intervention, Outcome 3 Fruit and vegetable intake ‐ sensitivity analysis ‐ missing data.

Comparison 2 Short‐term impact (< 12 months) of parent nutrition education intervention versus no intervention, Outcome 4 Fruit and vegetable intake ‐ subgroup analysis ‐ modality.

Comparison 2 Short‐term impact (< 12 months) of parent nutrition education intervention versus no intervention, Outcome 5 Fruit and vegetable intake ‐ subgroup analysis ‐ setting.
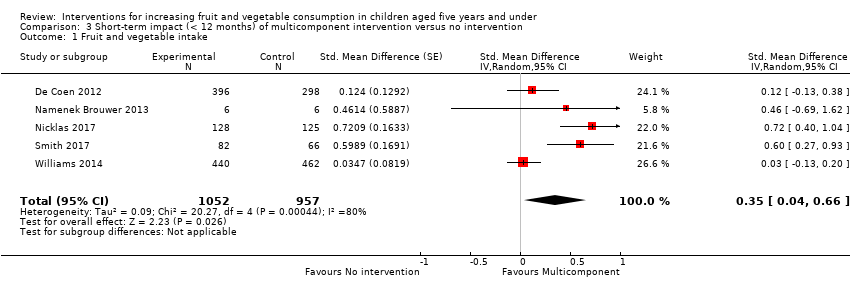
Comparison 3 Short‐term impact (< 12 months) of multicomponent intervention versus no intervention, Outcome 1 Fruit and vegetable intake.

Comparison 3 Short‐term impact (< 12 months) of multicomponent intervention versus no intervention, Outcome 2 Fruit and vegetable intake ‐ sensitivity analysis ‐ primary outcome.

Comparison 3 Short‐term impact (< 12 months) of multicomponent intervention versus no intervention, Outcome 3 Fruit and vegetable intake ‐ sensitivity analysis ‐ missing data.

Comparison 3 Short‐term impact (< 12 months) of multicomponent intervention versus no intervention, Outcome 4 Fruit and vegetable intake ‐ subgroup analysis ‐ setting.
| Child feeding interventions compared to no intervention for children aged five years and under | ||||||
| Patient or population: children aged five years and under | ||||||
| Outcomes | Anticipated absolute effects* (95% CI) | Relative effect | № of participants | Quality of the evidence | Comments | |
| Risk with no intervention | Risk with child‐feeding interventions | |||||
| Short‐term impact (< 12 months) child vegetable intake | The mean as‐desired vegetable intake was 7.7 grams1 | The mean as‐desired vegetable intake (grams) in the intervention group was 3.50 higher (1.38 higher to 5.73 higher) | ‐ | 1741 | ⊕⊝⊝⊝ | Scores estimated using a standardised mean difference of 0.33 (0.13 to 0.54) and a standard deviation of 10.61.1 The mean duration of follow‐up post‐intervention for studies included in the meta‐analysis was 6.2 weeks. Harnack 2012 compared ≥ 1 child‐feeding practice interventions to a no‐treatment control and reported a significant increase in intake of fruit but could not be synthesised in meta‐analysis. |
| Short‐term impact (< 12 months) cost effectiveness ‐ not reported | No child‐feeding interventions reported this outcome | ‐ | ‐ | ‐ | ‐ | |
| Short‐term impact (< 12 months) unintended adverse events | One trial (Spill 2011a) reported no adverse effects on amount of meals consumed | ‐ | 39 | ⊕⊝⊝⊝ | ‐ | |
| *The risk in the intervention group (and its 95% confidence interval) is based on the assumed risk in the comparison group and the relative effect of the intervention (and its 95% CI) | ||||||
| GRADE Working Group grades of evidence | ||||||
| 1We used the post‐intervention mean and standard deviation of the control group from Wardle 2003a for the risk with no intervention and to re‐express the SMD in terms of grams of intake. | ||||||
| Parent nutrition education interventions compared to no intervention for children aged 5 years and under | ||||||
| Patient or population: children aged 5 years and under | ||||||
| Outcomes | Anticipated absolute effects* (95% CI) | Relative effect | № of participants | Quality of the evidence | Comments | |
| Risk with no intervention | Risk with parent nutrition education interventions | |||||
| Short‐term impact (< 12 months) child fruit and vegetable intake | The mean servings of vegetables per day was 1.61 | The mean servings of vegetables per day in the intervention group was 0.12 higher (0.03 lower to 0.28 higher) | ‐ | 3078 | ⊕⊝⊝⊝ | Scores estimated using a standardised mean difference of 0.12 (‐0.03 to 0.28) and a standard deviation of 1.01 The mean duration of follow‐up post‐intervention for studies included in the meta‐analysis was 8.8 weeks. We were unable to pool results of three trials that reported mixed results in the meta‐analysis. One study found a parent‐responsivity and behaviour‐management intervention to be effective in increasing total fruit intake compared to control (Black 2011); one study found a parent health report on fruit and vegetable consumption to be effective in increasing total vegetable intake compared to control, but not fruit (Hunsaker 2017); and the other study found both a parent‐complementary feeding intervention and a parent‐complementary feeding and home‐visit intervention to be effective in increasing both fruit and vegetable intake compared to control (Vazir 2013). |
| Short‐term impact (< 12 months) cost effectiveness | Information regarding intervention costs was reported in 1 trial (Campbell 2013) | ‐ | 389 | ⊕⊝⊝⊝ | ‐ | |
| Short‐term impact (< 12 months) unintended adverse events | One trial (Wyse 2012) reported no adverse effect on family food expenditure | ‐ | 343 | ⊕⊝⊝⊝ | ||
| *The risk in the intervention group (and its 95% confidence interval) is based on the assumed risk in the comparison group and the relative effect of the intervention (and its 95% CI). | ||||||
| GRADE Working Group grades of evidence | ||||||
| 1We used the post‐intervention mean and standard deviation of the control group from Skouteris 2015 for the risk with no intervention and to re‐express the SMD in terms of servings of vegetables per day. | ||||||
| Multicomponent interventions compared to no intervention for children aged 5 years and under | ||||||
| Patient or population: children aged 5 years and under | ||||||
| Outcomes | Anticipated absolute effects* (95% CI) | Relative effect | № of participants | Quality of the evidence | Comments | |
| Risk with no intervention | Risk with multicomponent interventions | |||||
| Short‐term impact (< 12 months) child fruit and vegetable intake | The mean cups of vegetables per day was 1.081 | The mean cups of vegetables per day in the intervention group was 0.37 higher (0.04 higher to 0.69 higher) | ‐ | 2009 | ⊕⊕⊝⊝ | Scores estimated using a standardised mean difference of 0.35 (0.04 to 0.66) and a standard deviation of 1.051 The mean duration of follow‐up post‐intervention for studies included in the meta‐analysis was 1.1 weeks 4 studies could not be pooled in meta‐analysis. 3 reported significant increases in both fruit and vegetable consumption, and 1 significantly increased fruit but not vegetable consumption |
| Short‐term impact (< 12 months) cost effectiveness ‐ not reported | No studies reported this outcome | ‐ | ‐ | ‐ | ‐ | |
| Short‐term impact (< 12 months) unintended adverse events ‐ not reported | No studies reported this outcome | ‐ | ‐ | ‐ | ‐ | |
| *The risk in the intervention group (and its 95% confidence interval) is based on the assumed risk in the comparison group and the relative effect of the intervention (and its 95% CI). | ||||||
| GRADE Working Group grades of evidence | ||||||
| 1We used the post‐intervention mean and standard deviation of the control group from Williams 2014 for the risk with no intervention and to re‐express the SMD in terms of cups vegetables per day. | ||||||
| Child nutrition education interventions compared to no intervention for children aged 5 years and under | ||||||
| Patient or population: children aged 5 years and under | ||||||
| Outcomes | Anticipated absolute effects* (95% CI) | Relative effect | № of participants | Quality of the evidence | Comments | |
| Risk with no intervention | Risk with child nutrition education interventions | |||||
| Short‐term impact (< 12 months) child fruit and vegetable intake | The mean short‐term impact (< 12 months) child vegetable intake frequency score was 4 (a score of 4 corresponds to consumption of vegetables 3 ‐ 4 times per week) | MD 0 | ‐ | 238 | ⊕⊕⊝⊝ | The only study (Baskale 2011) reported an increase in some of the fruits and vegetables assessed in the intervention group and no significant differences in the control group The duration of follow‐up post‐intervention was 8 weeks |
| Cost or cost effectiveness ‐ not reported | No studies reported this outcome | ‐ | ‐ | ‐ | ‐ | |
| Unintended adverse events ‐ not reported | No studies reported this outcome | ‐ | ‐ | ‐ | ‐ | |
| *The risk in the intervention group (and its 95% confidence interval) is based on the assumed risk in the comparison group and the relative effect of the intervention (and its 95% CI). | ||||||
| GRADE Working Group grades of evidence | ||||||
| 1Downgraded one level for risk of bias: high risk of bias due to lack of blinding and loss to follow‐up. | ||||||
| Outcome or subgroup title | No. of studies | No. of participants | Statistical method | Effect size |
| 1 Vegetable intake Show forest plot | 13 | 1741 | Std. Mean Difference (Random, 95% CI) | 0.33 [0.13, 0.54] |
| 2 Vegetable intake ‐ sensitivity analysis ‐ risk of bias Show forest plot | 13 | 1670 | Std. Mean Difference (Random, 95% CI) | 0.33 [0.13, 0.54] |
| 2.1 Low/unclear risk of bias | 5 | 487 | Std. Mean Difference (Random, 95% CI) | 0.23 [0.03, 0.44] |
| 2.2 High risk of bias | 8 | 1183 | Std. Mean Difference (Random, 95% CI) | 0.37 [0.06, 0.68] |
| 3 Vegetable intake ‐ sensitivity analysis ‐ primary outcome Show forest plot | 13 | 1670 | Std. Mean Difference (Random, 95% CI) | 0.33 [0.13, 0.54] |
| 3.1 Primary outcome of child fruit or vegetable intake | 10 | 1331 | Std. Mean Difference (Random, 95% CI) | 0.45 [0.19, 0.70] |
| 3.2 Primary outcome unclear | 3 | 339 | Std. Mean Difference (Random, 95% CI) | 0.03 [‐0.19, 0.24] |
| 4 Vegetable intake ‐ sensitivity analysis ‐ missing data Show forest plot | 13 | 1670 | Std. Mean Difference (Random, 95% CI) | 0.33 [0.13, 0.54] |
| 4.1 Low attrition or high attrition with ITT analysis | 8 | 757 | Std. Mean Difference (Random, 95% CI) | 0.29 [0.10, 0.48] |
| 4.2 High attrition and no ITT analysis | 5 | 913 | Std. Mean Difference (Random, 95% CI) | 0.35 [‐0.10, 0.79] |
| 5 Vegetable intake ‐ subgroup analysis ‐ modality Show forest plot | 13 | 1670 | Std. Mean Difference (Random, 95% CI) | 0.33 [0.13, 0.54] |
| 5.1 Face‐to‐face | 11 | 1489 | Std. Mean Difference (Random, 95% CI) | 0.32 [0.09, 0.56] |
| 5.2 Other modality | 2 | 181 | Std. Mean Difference (Random, 95% CI) | 0.36 [0.06, 0.66] |
| 6 Vegetable intake ‐ subgroup analysis ‐ setting Show forest plot | 13 | 1670 | Std. Mean Difference (Random, 95% CI) | 0.33 [0.13, 0.54] |
| 6.1 School or preschool | 4 | 444 | Std. Mean Difference (Random, 95% CI) | 0.19 [‐0.02, 0.40] |
| 6.2 Home | 4 | 474 | Std. Mean Difference (Random, 95% CI) | 0.56 [0.18, 0.95] |
| 6.3 Home + Lab | 2 | 40 | Std. Mean Difference (Random, 95% CI) | 0.74 [0.09, 1.39] |
| 6.4 Other settings | 3 | 712 | Std. Mean Difference (Random, 95% CI) | 0.06 [‐0.14, 0.26] |
| Outcome or subgroup title | No. of studies | No. of participants | Statistical method | Effect size |
| 1 Fruit and vegetable intake Show forest plot | 11 | 3078 | Std. Mean Difference (Random, 95% CI) | 0.12 [‐0.03, 0.28] |
| 2 Fruit and vegetable intake ‐ sensitivity analysis ‐ primary outcome Show forest plot | 11 | 3078 | Std. Mean Difference (Random, 95% CI) | 0.12 [‐0.03, 0.28] |
| 2.1 Primary outcome of child fruit or vegetable intake | 8 | 2792 | Std. Mean Difference (Random, 95% CI) | 0.04 [‐0.08, 0.16] |
| 2.2 Primary outcome unclear | 3 | 286 | Std. Mean Difference (Random, 95% CI) | 0.52 [0.03, 1.00] |
| 3 Fruit and vegetable intake ‐ sensitivity analysis ‐ missing data Show forest plot | 11 | 3078 | Std. Mean Difference (Random, 95% CI) | 0.12 [‐0.03, 0.28] |
| 3.1 Low attrition or high attrition with ITT analysis | 7 | 2518 | Std. Mean Difference (Random, 95% CI) | 0.12 [‐0.00, 0.24] |
| 3.2 High attrition and no ITT analysis | 4 | 560 | Std. Mean Difference (Random, 95% CI) | 0.07 [‐0.45, 0.59] |
| 4 Fruit and vegetable intake ‐ subgroup analysis ‐ modality Show forest plot | 11 | 3078 | Std. Mean Difference (Random, 95% CI) | 0.12 [‐0.03, 0.28] |
| 4.1 Face‐to‐face only | 5 | 826 | Std. Mean Difference (Random, 95% CI) | 0.12 [‐0.20, 0.45] |
| 4.2 Audio visual only | 2 | 386 | Std. Mean Difference (Random, 95% CI) | 0.40 [‐0.04, 0.85] |
| 4.3 Other modality | 4 | 1866 | Std. Mean Difference (Random, 95% CI) | 0.03 [‐0.16, 0.21] |
| 5 Fruit and vegetable intake ‐ subgroup analysis ‐ setting Show forest plot | 11 | 3078 | Std. Mean Difference (Random, 95% CI) | 0.12 [‐0.03, 0.28] |
| 5.1 Home | 5 | 2047 | Std. Mean Difference (Random, 95% CI) | 0.06 [‐0.16, 0.27] |
| 5.2 Preschool | 2 | 243 | Std. Mean Difference (Random, 95% CI) | 0.43 [‐0.27, 1.13] |
| 5.3 Other settings | 4 | 788 | Std. Mean Difference (Random, 95% CI) | 0.09 [‐0.07, 0.25] |
| Outcome or subgroup title | No. of studies | No. of participants | Statistical method | Effect size |
| 1 Fruit and vegetable intake Show forest plot | 5 | 2009 | Std. Mean Difference (Random, 95% CI) | 0.35 [0.04, 0.66] |
| 2 Fruit and vegetable intake ‐ sensitivity analysis ‐ primary outcome Show forest plot | 5 | 2009 | Std. Mean Difference (Random, 95% CI) | 0.35 [0.04, 0.66] |
| 2.1 Primary outcome of child fruit or vegetable intake | 4 | 1315 | Std. Mean Difference (Random, 95% CI) | 0.44 [‐0.00, 0.87] |
| 2.2 Primary outcome unclear | 1 | 694 | Std. Mean Difference (Random, 95% CI) | 0.12 [‐0.13, 0.38] |
| 3 Fruit and vegetable intake ‐ sensitivity analysis ‐ missing data Show forest plot | 5 | 2009 | Std. Mean Difference (Random, 95% CI) | 0.35 [0.04, 0.66] |
| 3.1 Low attrition or high attrition with ITT analysis | 3 | 413 | Std. Mean Difference (Random, 95% CI) | 0.65 [0.43, 0.88] |
| 3.2 High attrition and no ITT analysis | 2 | 1596 | Std. Mean Difference (Random, 95% CI) | 0.06 [‐0.08, 0.20] |
| 4 Fruit and vegetable intake ‐ subgroup analysis ‐ setting Show forest plot | 5 | 2009 | Std. Mean Difference (Random, 95% CI) | 0.35 [0.04, 0.66] |
| 4.1 School or preschool | 3 | 1608 | Std. Mean Difference (Random, 95% CI) | 0.07 [‐0.07, 0.20] |
| 4.2 Other settings | 2 | 401 | Std. Mean Difference (Random, 95% CI) | 0.66 [0.43, 0.89] |