Interventions for increasing fruit and vegetable consumption in children aged five years and under
Información
- DOI:
- https://doi.org/10.1002/14651858.CD008552.pub3Copiar DOI

- Base de datos:
-
- Cochrane Database of Systematic Reviews
- Versión publicada:
-
- 25 septiembre 2017see what's new
- Tipo:
-
- Intervention
- Etapa:
-
- Review
- Grupo Editorial Cochrane:
-
Grupo Cochrane de Corazón
- Copyright:
-
- Copyright © 2017 The Cochrane Collaboration. Published by John Wiley & Sons, Ltd.
Cifras del artículo
Altmetric:
Citado por:
Autores
Contributions of authors
All authors contributed to the conception of the research and were involved in the preparation of the review including providing critical comment on drafts.
RH led the review update and manuscript drafting.
RH and FS conducted searches of other sources.
RH, FS, RW, KO, NN, SY, EJ and KB screened titles and abstracts.
RH, FS, NN, RS, KO, RW, SY and LW screened full texts to determine study eligibility.
EJ, TCM, RW, KB, KO, ER, RH and RS extracted data from eligible trials.
FS, FT and TCM assessed risk of bias.
RH, NN and LW assessed quality of studies (GRADE).
Sources of support
Internal sources
-
Hunter Medical Research Institute, Australia.
Infrastructure support
-
The University of Newcastle, Australia.
Salary Support
-
Deakin University, Australia.
Salary Support
-
Hunter New England Area Health Service, Australia.
Salary Support
-
Cancer Council NSW, Australia.
Salary Support
-
Cancer Institute NSW, Australia.
Salary support
External sources
-
No sources of support supplied
Declarations of interest
Rebecca K Hodder: none known.
Fiona G Stacey: none known.
Kate M O'Brien: none known.
Tara Clinton‐McHarg: none known.
Flora Tzelepis: none known.
Nicole K Nathan: none known.
Erica L James: none known.
Kate M Bartlem: none known.
Rachel Sutherland: none known.
Emma Robson: none known.
Sze Lin Yoong: none known.
Rebecca J Wyse and Luke Wolfenden: are authors on an included randomised trial of an intervention to increase fruit and vegetable consumption (Wyse 2014); neither were involved in the determination of study eligibility, data extraction or risk of bias assessment for this study. The authors have not received any benefit, in cash or kind, any hospitality, or any subsidy derived from the food industry or any other source perceived to have an interest in the outcome of the review.
Acknowledgements
We would like to thank the authors who contributed to the original review: Ben Britton, Karen Campbell and Patrick McElduff. We would also like to acknowledge the contribution of health promotion practitioners, community dieticians, Children's Services staff who provided comment on the scope and focus of the review protocol, and authors of trials who provided further information to the review team to facilitate assessments of trial eligibility and analysis. We would also like to acknowledge the assistance of the Cochrane Heart Group for executing the search and Sarah Haley who provided translation services. We would also like to acknowledge the authors of all included studies for providing additional information regarding their trials for this review.
Version history
| Published | Title | Stage | Authors | Version |
| 2020 May 25 | Interventions for increasing fruit and vegetable consumption in children aged five years and under | Review | Rebecca K Hodder, Kate M O'Brien, Flora Tzelepis, Rebecca J Wyse, Luke Wolfenden | |
| 2019 Nov 07 | Interventions for increasing fruit and vegetable consumption in children aged five years and under | Review | Rebecca K Hodder, Kate M O'Brien, Fiona G Stacey, Flora Tzelepis, Rebecca J Wyse, Kate M Bartlem, Rachel Sutherland, Erica L James, Courtney Barnes, Luke Wolfenden | |
| 2018 May 17 | Interventions for increasing fruit and vegetable consumption in children aged five years and under | Review | Rebecca K Hodder, Kate M O'Brien, Fiona G Stacey, Rebecca J Wyse, Tara Clinton‐McHarg, Flora Tzelepis, Erica L James, Kate M Bartlem, Nicole K Nathan, Rachel Sutherland, Emma Robson, Sze Lin Yoong, Luke Wolfenden | |
| 2018 Jan 24 | Interventions for increasing fruit and vegetable consumption in children aged five years and under | Review | Rebecca K Hodder, Fiona G Stacey, Kate M O'Brien, Rebecca J Wyse, Tara Clinton‐McHarg, Flora Tzelepis, Erica L James, Kate M Bartlem, Nicole K Nathan, Rachel Sutherland, Emma Robson, Sze Lin Yoong, Luke Wolfenden | |
| 2017 Sep 25 | Interventions for increasing fruit and vegetable consumption in children aged five years and under | Review | Rebecca K Hodder, Fiona G Stacey, Rebecca J Wyse, Kate M O'Brien, Tara Clinton‐McHarg, Flora Tzelepis, Nicole K Nathan, Erica L James, Kate M Bartlem, Rachel Sutherland, Emma Robson, Sze Lin Yoong, Luke Wolfenden | |
| 2012 Nov 14 | Interventions for increasing fruit and vegetable consumption in children aged 5 years and under | Review | Luke Wolfenden, Rebecca J Wyse, Ben I Britton, Karen J Campbell, Rebecca K Hodder, Fiona G Stacey, Patrick McElduff, Erica L James | |
| 2010 Jun 16 | Interventions for increasing fruit and vegetable consumption in preschool aged children | Protocol | Luke Wolfenden, Rebecca J Wyse, Ben I Britton, Karen J Campbell, Rebecca K Hodder, Fiona G Stacey, Patrick McElduff, Erica L James | |
Differences between protocol and review
-
Consistent with the original review (Wolfenden 2012), we excluded trials if fruit or vegetable intake was not the primary trial outcome, to avoid potential confounding effects of other interventions and reduce the risk of publication bias and selective outcome reporting which is more predominate among secondary trial outcomes (or outcomes that were not otherwise stated). This included trials where fruit and vegetable outcomes were assessed within broader targeted interventions. The protocol stated that trials listing fruit and vegetable intake as a secondary trial outcome would also be included. We included trials that did not state a primary outcome, but did report intake of fruit or vegetables or both. We conducted sensitivity analyses to explore the impact on the overall assessment of treatment effects, excluding studies that did not state a primary outcome of children's fruit and vegetable consumption.
-
Consistent with the original review (Wolfenden 2012), we amended classification of intervention effects as 'short‐term' from 'three to less than 12 months' in the protocol to less than 12 months in the review.
-
Consistent with the original review (Wolfenden 2012), we did not contact professional associations as part of the review search strategy, nor did we search the National Institute of Health Randomized Trial Records Database.
-
Consistent with the original review (Wolfenden 2012), we amended the title and text throughout the review to ensure consistent terminology for the description of age. Specifically, we replaced the age description of children as 'preschool' with a more precise description of 'children aged five years and under', to more accurately reflect the scope of the review. We refer only to preschools when discussing the findings of trials conducted in that setting.
-
Consistent with the original review (Wolfenden 2012), as some trials included children across a range of ages, we included any trial where the mean age of the sample at baseline was five years or under.
-
For the review update, while two independent reviewers extracted data from each study, the extraction was undertaken by pairs of reviewers.
-
For the review update, risk of bias was assessed on published study information and authors of included studies were not contacted to clarify any aspects.
-
For the review update, we did not conduct planned subgroup analyses by interventions of varying intensities, due to insufficient information being reported across the included studies about the number and duration of intervention contacts or components.
-
For the review update, while articles were screened independently against all pre‐specified eligibility criteria by two reviewers, this was not conducted in a sequential manner (that is by order: participants, outcome, comparator, intervention, study type) as adopted in the original review.
-
Whilst not explicitly excluded from the original review, for the review update we specifically considered cross‐over trials to be an eligible study design. This was due to the many trials that adopt this design to investigate the effectiveness of interventions to increase the fruit and vegetable consumption of children aged five years and under, and the review authors deeming the study design to be appropriate in this context.
-
This update includes some new methods relevant for living systematic reviews, which are included in the Methods and also described in Appendix 3
Keywords
MeSH
Medical Subject Headings (MeSH) Keywords
Medical Subject Headings Check Words
Child, Preschool; Humans; Infant;
PICO

Study flow diagram.

Risk of bias graph: review authors' judgements about each risk of bias item presented as percentages across all included studies.

Risk of bias summary: review authors' judgements about each risk of bias item for each included study.
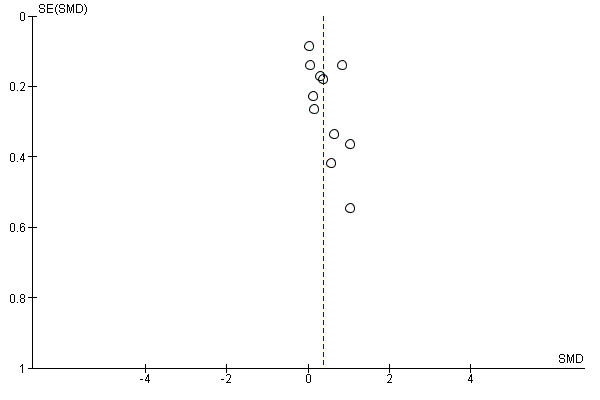
Funnel plot of comparison: 1 Short‐term impact (< 12 months) of child feeding intervention versus no intervention on child consumption of target fruit or vegetable, outcome: 1.1 Fruit and/or vegetable intake.

Funnel plot of comparison: 3 Short‐term impact (< 12 months) of parent nutrition education intervention versus usual care., outcome: 3.1 Fruit and/or vegetable intake.
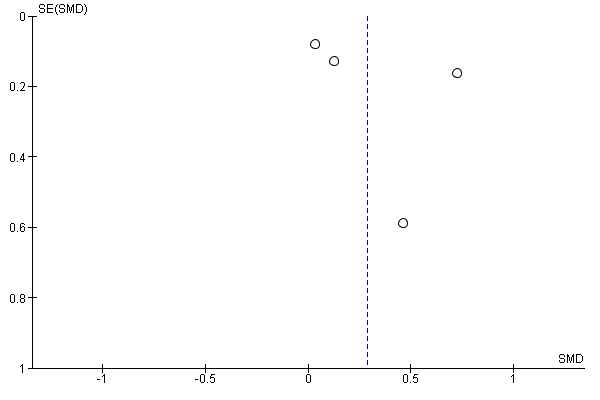
Funnel plot of comparison: 4 Short‐term impact (< 12 months) of multicomponent intervention versus usual care, outcome: 4.1 Fruit and/or vegetable intake.

Comparison 1 Short‐term impact (< 12 months) of child feeding intervention versus no intervention, Outcome 1 Vegetable intake.
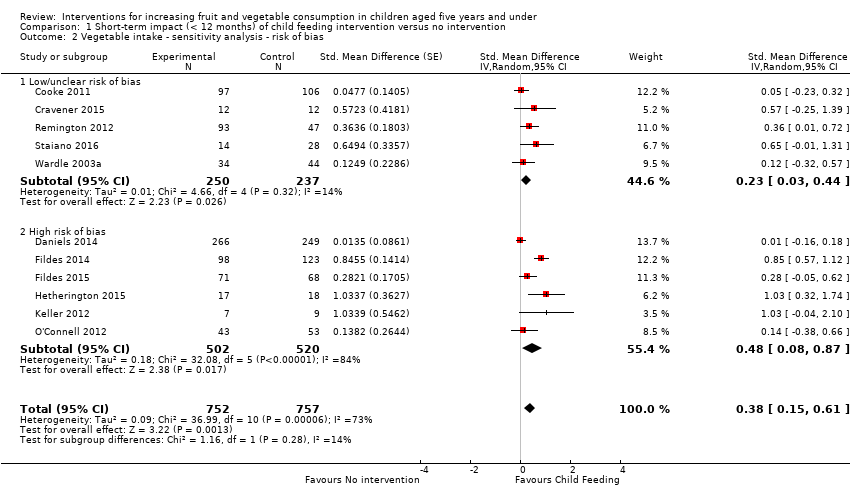
Comparison 1 Short‐term impact (< 12 months) of child feeding intervention versus no intervention, Outcome 2 Vegetable intake ‐ sensitivity analysis ‐ risk of bias.
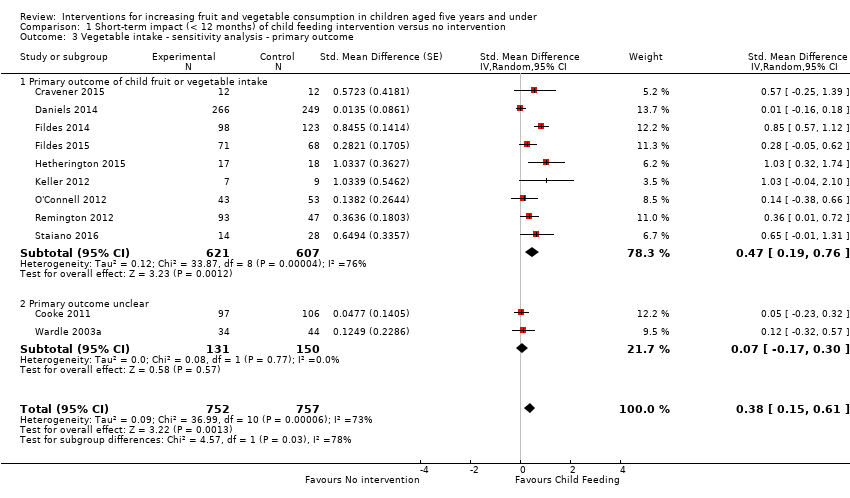
Comparison 1 Short‐term impact (< 12 months) of child feeding intervention versus no intervention, Outcome 3 Vegetable intake ‐ sensitivity analysis ‐ primary outcome.

Comparison 1 Short‐term impact (< 12 months) of child feeding intervention versus no intervention, Outcome 4 Vegetable intake ‐ sensitivity analysis ‐ missing data.
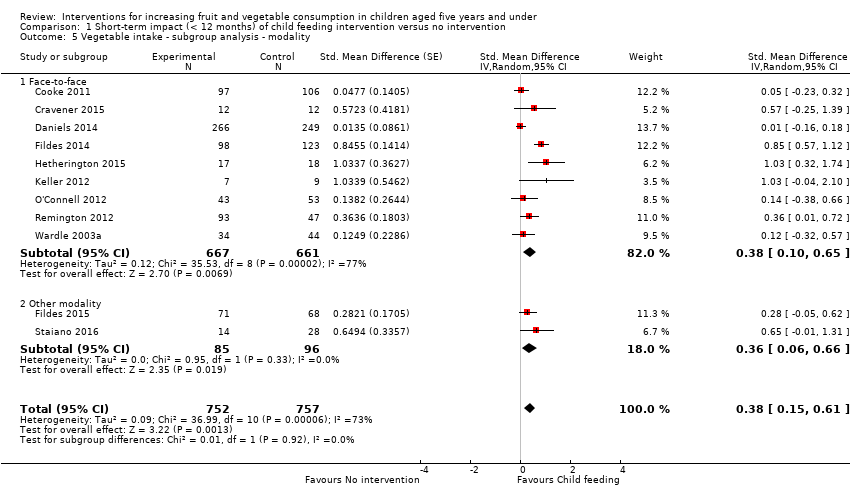
Comparison 1 Short‐term impact (< 12 months) of child feeding intervention versus no intervention, Outcome 5 Vegetable intake ‐ subgroup analysis ‐ modality.

Comparison 1 Short‐term impact (< 12 months) of child feeding intervention versus no intervention, Outcome 6 Vegetable intake ‐ subgroup analysis ‐ setting.
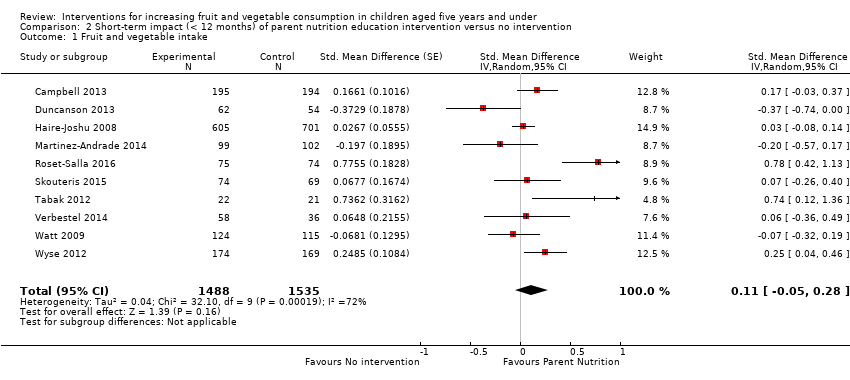
Comparison 2 Short‐term impact (< 12 months) of parent nutrition education intervention versus no intervention, Outcome 1 Fruit and vegetable intake.
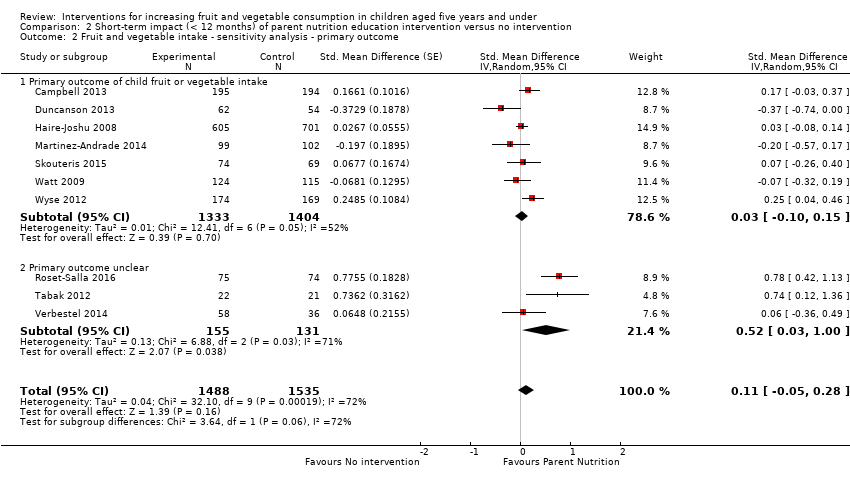
Comparison 2 Short‐term impact (< 12 months) of parent nutrition education intervention versus no intervention, Outcome 2 Fruit and vegetable intake ‐ sensitivity analysis ‐ primary outcome.

Comparison 2 Short‐term impact (< 12 months) of parent nutrition education intervention versus no intervention, Outcome 3 Fruit and vegetable intake ‐ sensitivity analysis ‐ missing data.

Comparison 2 Short‐term impact (< 12 months) of parent nutrition education intervention versus no intervention, Outcome 4 Fruit and vegetable intake ‐ subgroup analysis ‐ modality.

Comparison 2 Short‐term impact (< 12 months) of parent nutrition education intervention versus no intervention, Outcome 5 Fruit and vegetable intake ‐ subgroup analysis ‐ setting.

Comparison 3 Short‐term impact (< 12 months) of multicomponent intervention versus no intervention, Outcome 1 Fruit and vegetable intake.

Comparison 3 Short‐term impact (< 12 months) of multicomponent intervention versus no intervention, Outcome 2 Fruit and vegetable intake ‐ sensitivity analysis ‐ primary outcome.

Comparison 3 Short‐term impact (< 12 months) of multicomponent intervention versus no intervention, Outcome 3 Fruit and vegetable intake ‐ sensitivity analysis ‐ missing data.

Comparison 3 Short‐term impact (< 12 months) of multicomponent intervention versus no intervention, Outcome 4 Fruit and vegetable intake ‐ subgroup analysis ‐ setting.
| Child feeding interventions compared to no intervention for children aged 5 years and under | ||||||
| Patient or population: children aged 5 years and under | ||||||
| Outcomes | Anticipated absolute effects* (95% CI) | Relative effect | № of participants | Quality of the evidence | Comments | |
| Risk with no intervention | Risk with Child feeding interventions | |||||
| Short‐term impact (< 12 months) child vegetable intake | The mean vegetable intake was 7.7 grams1 | The mean vegetable intake (grams) in the intervention group was 4.03 higher (1.59 higher to 6.47 higher) | ‐ | 1509 | ⊕⊝⊝⊝ | Scores estimated using a standardised mean difference of 0.38 (0.15 to 0.61) and a standard deviation of 10.61.1 The mean duration of follow up post‐intervention for studies included in the meta‐analysis was 4.6 weeks. 2 studies that compared 1 or more child‐feeding practice interventions to a no‐treatment control could not be synthesised in meta‐analysis; both reported a significant increase in fruit or vegetables or both |
| Short‐term impact (< 12 months) cost effectiveness ‐ not reported | No child feeding interventions reported this outcome | ‐ | ‐ | ‐ | ‐ | |
| Short‐term impact (< 12 months) unintended adverse events | One trial (Spill 2011a) reported no adverse effects on amount of meal consumed | ‐ | 39 | ⊕⊝⊝⊝ | ‐ | |
| *The risk in the intervention group (and its 95% confidence interval) is based on the assumed risk in the comparison group and the relative effect of the intervention (and its 95% CI) | ||||||
| GRADE Working Group grades of evidence | ||||||
| 1We used the post‐intervention mean and standard deviation of the control group from Wardle 2003a for the risk with no intervention and to re‐express the SMD in terms of grams of intake. | ||||||
| Parent nutrition education interventions compared to no intervention for children aged 5 years and under | ||||||
| Patient or population: children aged 5 years and under | ||||||
| Outcomes | Anticipated absolute effects* (95% CI) | Relative effect | № of participants | Quality of the evidence | Comments | |
| Risk with no intervention | Risk with Parent nutrition education interventions | |||||
| Short‐term impact (< 12 months) child fruit and vegetable intake | The mean serves of vegetables per day was 1.61 | The mean serves of vegetables per day in the intervention group was 0.11 higher (0.05 lower to 0.28 higher) | ‐ | 3023 | ⊕⊝⊝⊝ | Scores estimated using a standardised mean difference of 0.11 (‐0.05 to 0.28) and a standard deviation of 1.01 The mean duration of follow up post‐intervention for studies included in the meta‐analysis was 9.8 weeks. 1 trial could not be pooled in the meta‐analysis; it found an intervention targeting parent responsivity and behaviour management to be effective in increasing total fruit intake compared to control |
| Short‐term impact (< 12 months) cost effectiveness | Information regarding intervention costs was reported in 1 trial (Campbell 2013) | ‐ | 389 | ⊕⊝⊝⊝ | ‐ | |
| Short‐term impact (< 12 months) unintended adverse events | One trial (Wyse 2012) reported no adverse effect on family food expenditure | ‐ | 343 | ⊕⊝⊝⊝ | ||
| *The risk in the intervention group (and its 95% confidence interval) is based on the assumed risk in the comparison group and the relative effect of the intervention (and its 95% CI). | ||||||
| GRADE Working Group grades of evidence | ||||||
| 1We used the post‐intervention mean and standard deviation of the control group from Skouteris 2015 for the risk with no intervention and to re‐express the SMD in terms of serves of vegetables per day. | ||||||
| Multicomponent interventions compared to no intervention for children aged 5 years and under | ||||||
| Patient or population: children aged 5 years and under | ||||||
| Outcomes | Anticipated absolute effects* (95% CI) | Relative effect | № of participants | Quality of the evidence | Comments | |
| Risk with no intervention | Risk with Multicomponent interventions | |||||
| Short‐term impact (< 12 months) child fruit and vegetable intake | The mean cups of vegetables per day was 1.081 | The mean cups of vegetables per day in the intervention group was 0.29 higher (0.06 lower to 0.66 higher) | ‐ | 1861 | ⊕⊝⊝⊝ | Scores estimated using a standardised mean difference of 0.28 (‐0.06 to 0.63) and a standard deviation of 1.051 The mean duration of follow up post‐intervention for studies included in the meta‐analysis was 1.3 weeks. 4 studies could not be pooled in meta‐analysis. 3 reported significant increases in both fruit and vegetable consumption, and 1 significantly increased fruit but not vegetable consumption |
| Short‐term impact (< 12 months) cost effectiveness ‐ not reported | No studies reported this outcome | ‐ | ‐ | ‐ | ‐ | |
| Short‐term impact (< 12 months) unintended adverse events ‐ not reported | No studies reported this outcome | ‐ | ‐ | ‐ | ‐ | |
| *The risk in the intervention group (and its 95% confidence interval) is based on the assumed risk in the comparison group and the relative effect of the intervention (and its 95% CI). | ||||||
| GRADE Working Group grades of evidence | ||||||
| 1We used the post‐intervention mean and standard deviation of the control group from Williams 2014 for the risk with no intervention and to re‐express the SMD in terms of cups vegetables per day. | ||||||
| Child nutrition education interventions compared to no intervention for children aged 5 years and under | ||||||
| Patient or population: children aged 5 years and under | ||||||
| Outcomes | Anticipated absolute effects* (95% CI) | Relative effect | № of participants | Quality of the evidence | Comments | |
| Risk with no intervention | Risk with Child nutrition education interventions | |||||
| Short‐term impact (< 12 months) child fruit and vegetable intake | The mean short‐term impact (< 12 months) child vegetable intake frequency score was 4 (a score of 4 corresponds to consumption of vegetables 3 ‐ 4 times per week) | MD 0 | ‐ | 238 | ⊕⊕⊝⊝ | The only study (Baskale 2011) reported an increase in some of the fruits and vegetables assessed in the intervention group and no significant differences in the control group The duration of follow up post‐intervention was 8 weeks. |
| Cost or cost effectiveness ‐ not reported | No studies reported this outcome | ‐ | ‐ | ‐ | ‐ | |
| Unintended adverse events ‐ not reported | No studies reported this outcome | ‐ | ‐ | ‐ | ‐ | |
| *The risk in the intervention group (and its 95% confidence interval) is based on the assumed risk in the comparison group and the relative effect of the intervention (and its 95% CI). | ||||||
| GRADE Working Group grades of evidence | ||||||
| 1Downgraded one level for risk of bias: high risk of bias due to lack of blinding and loss to follow‐up. | ||||||
| Outcome or subgroup title | No. of studies | No. of participants | Statistical method | Effect size |
| 1 Vegetable intake Show forest plot | 11 | 1509 | Std. Mean Difference (Random, 95% CI) | 0.38 [0.15, 0.61] |
| 2 Vegetable intake ‐ sensitivity analysis ‐ risk of bias Show forest plot | 11 | 1509 | Std. Mean Difference (Random, 95% CI) | 0.38 [0.15, 0.61] |
| 2.1 Low/unclear risk of bias | 5 | 487 | Std. Mean Difference (Random, 95% CI) | 0.23 [0.03, 0.44] |
| 2.2 High risk of bias | 6 | 1022 | Std. Mean Difference (Random, 95% CI) | 0.48 [0.08, 0.87] |
| 3 Vegetable intake ‐ sensitivity analysis ‐ primary outcome Show forest plot | 11 | 1509 | Std. Mean Difference (Random, 95% CI) | 0.38 [0.15, 0.61] |
| 3.1 Primary outcome of child fruit or vegetable intake | 9 | 1228 | Std. Mean Difference (Random, 95% CI) | 0.47 [0.19, 0.76] |
| 3.2 Primary outcome unclear | 2 | 281 | Std. Mean Difference (Random, 95% CI) | 0.07 [‐0.17, 0.30] |
| 4 Vegetable intake ‐ sensitivity analysis ‐ missing data Show forest plot | 11 | 1509 | Std. Mean Difference (Random, 95% CI) | 0.38 [0.15, 0.61] |
| 4.1 Low attrition or high attrition with ITT analysis | 8 | 757 | Std. Mean Difference (Random, 95% CI) | 0.29 [0.10, 0.48] |
| 4.2 High attrition and no ITT analysis | 3 | 752 | Std. Mean Difference (Random, 95% CI) | 0.55 [‐0.16, 1.27] |
| 5 Vegetable intake ‐ subgroup analysis ‐ modality Show forest plot | 11 | 1509 | Std. Mean Difference (Random, 95% CI) | 0.38 [0.15, 0.61] |
| 5.1 Face‐to‐face | 9 | 1328 | Std. Mean Difference (Random, 95% CI) | 0.38 [0.10, 0.65] |
| 5.2 Other modality | 2 | 181 | Std. Mean Difference (Random, 95% CI) | 0.36 [0.06, 0.66] |
| 6 Vegetable intake ‐ subgroup analysis ‐ setting Show forest plot | 11 | 1509 | Std. Mean Difference (Random, 95% CI) | 0.38 [0.15, 0.61] |
| 6.1 School or preschool | 3 | 341 | Std. Mean Difference (Random, 95% CI) | 0.18 [‐0.12, 0.47] |
| 6.2 Home | 4 | 474 | Std. Mean Difference (Random, 95% CI) | 0.56 [0.18, 0.95] |
| 6.3 Home + Lab | 2 | 40 | Std. Mean Difference (Random, 95% CI) | 0.74 [0.09, 1.39] |
| 6.4 Other settings | 2 | 654 | Std. Mean Difference (Random, 95% CI) | 0.11 [‐0.14, 0.36] |
| Outcome or subgroup title | No. of studies | No. of participants | Statistical method | Effect size |
| 1 Fruit and vegetable intake Show forest plot | 10 | 3023 | Std. Mean Difference (Random, 95% CI) | 0.11 [‐0.05, 0.28] |
| 2 Fruit and vegetable intake ‐ sensitivity analysis ‐ primary outcome Show forest plot | 10 | 3023 | Std. Mean Difference (Random, 95% CI) | 0.11 [‐0.05, 0.28] |
| 2.1 Primary outcome of child fruit or vegetable intake | 7 | 2737 | Std. Mean Difference (Random, 95% CI) | 0.03 [‐0.10, 0.15] |
| 2.2 Primary outcome unclear | 3 | 286 | Std. Mean Difference (Random, 95% CI) | 0.52 [0.03, 1.00] |
| 3 Fruit and vegetable intake ‐ sensitivity analysis ‐ missing data Show forest plot | 10 | 3023 | Std. Mean Difference (Random, 95% CI) | 0.11 [‐0.05, 0.28] |
| 3.1 Low attrition or high attrition with ITT analysis | 6 | 2463 | Std. Mean Difference (Random, 95% CI) | 0.11 [‐0.02, 0.24] |
| 3.2 High attrition and no ITT analysis | 4 | 560 | Std. Mean Difference (Random, 95% CI) | 0.07 [‐0.45, 0.59] |
| 4 Fruit and vegetable intake ‐ subgroup analysis ‐ modality Show forest plot | 10 | 3023 | Std. Mean Difference (Random, 95% CI) | 0.11 [‐0.05, 0.28] |
| 4.1 Face‐to‐face only | 5 | 826 | Std. Mean Difference (Random, 95% CI) | 0.12 [‐0.20, 0.45] |
| 4.2 Audio visual only | 2 | 386 | Std. Mean Difference (Random, 95% CI) | 0.40 [‐0.04, 0.85] |
| 4.3 Other modality | 3 | 1811 | Std. Mean Difference (Random, 95% CI) | ‐0.00 [‐0.22, 0.21] |
| 5 Fruit and vegetable intake ‐ subgroup analysis ‐ setting Show forest plot | 10 | 3023 | Std. Mean Difference (Random, 95% CI) | 0.11 [‐0.05, 0.28] |
| 5.1 Home | 5 | 2047 | Std. Mean Difference (Random, 95% CI) | 0.06 [‐0.16, 0.27] |
| 5.2 Preschool | 2 | 243 | Std. Mean Difference (Random, 95% CI) | 0.43 [‐0.27, 1.13] |
| 5.3 Other settings | 3 | 733 | Std. Mean Difference (Random, 95% CI) | 0.06 [‐0.14, 0.26] |
| Outcome or subgroup title | No. of studies | No. of participants | Statistical method | Effect size |
| 1 Fruit and vegetable intake Show forest plot | 4 | 1861 | Std. Mean Difference (Random, 95% CI) | 0.28 [‐0.06, 0.63] |
| 2 Fruit and vegetable intake ‐ sensitivity analysis ‐ primary outcome Show forest plot | 4 | 1861 | Std. Mean Difference (Random, 95% CI) | 0.28 [‐0.06, 0.63] |
| 2.1 Primary outcome of child fruit or vegetable intake | 3 | 1167 | Std. Mean Difference (Random, 95% CI) | 0.38 [‐0.20, 0.95] |
| 2.2 Primary outcome unclear | 1 | 694 | Std. Mean Difference (Random, 95% CI) | 0.12 [‐0.13, 0.38] |
| 3 Fruit and vegetable intake ‐ sensitivity analysis ‐ missing data Show forest plot | 4 | 1861 | Std. Mean Difference (Random, 95% CI) | 0.28 [‐0.06, 0.63] |
| 3.1 Low attrition or high attrition with ITT analysis | 2 | 265 | Std. Mean Difference (Random, 95% CI) | 0.70 [0.39, 1.01] |
| 3.2 High attrition and no ITT analysis | 2 | 1596 | Std. Mean Difference (Random, 95% CI) | 0.06 [‐0.08, 0.20] |
| 4 Fruit and vegetable intake ‐ subgroup analysis ‐ setting Show forest plot | 4 | 1861 | Std. Mean Difference (Random, 95% CI) | 0.28 [‐0.06, 0.63] |
| 4.1 School or preschool | 3 | 1608 | Std. Mean Difference (Random, 95% CI) | 0.07 [‐0.07, 0.20] |
| 4.2 Other settings | 1 | 253 | Std. Mean Difference (Random, 95% CI) | 0.72 [0.40, 1.04] |