Les interventions destinées à augmenter la consommation de fruits et légumes chez les enfants âgés de cinq ans ou moins
Résumé scientifique
Contexte
Une consommation insuffisante en fruits et légumes pendant l'enfance augmente le risque de développer des maladies chroniques telles que les maladies cardiovasculaires.
Objectifs
Évaluer l'efficacité, le rapport coût‐efficacité et les événements indésirables associés aux interventions destinées à augmenter la consommation de fruits et/ou de légumes, chez les enfants âgés de cinq ans ou moins.
Stratégie de recherche documentaire
Nous avons effectué des recherches dans le registre Cochrane des essais contrôlés (CENTRAL) dans la Bibliothèque Cochrane, sur MEDLINE, Embase Classic et Embase pour identifier des essais éligibles le 30 septembre 2016. Nous avons effectué des recherches dans CINAHL et sur PsycINFO en juillet 2016, sur Proquest Dissertations and Theses en novembre 2016 et dans trois registres d'essais cliniques en novembre 2016 et en juin 2017. Nous avons examiné les références bibliographiques des essais inclus et effectué une recherche manuelle dans trois journaux internationaux portant sur la nutrition. Nous avons contacté les auteurs des études incluses afin d'identifier d'autres essais potentiellement pertinents.
Critères de sélection
Nous avons inclus les essais contrôlés randomisés, y compris les essais contrôlés randomisés en grappes et les essais croisés, portant sur toute intervention ciblant principalement la consommation de fruits et/ou de légumes chez les enfants âgés de cinq ans ou moins comprenant une évaluation alimentaire ou biochimique de la consommation de fruits ou de légumes. Deux auteurs de la revue ont indépendamment passé au crible les titres et les résumés des articles identifiés ; un troisième auteur de la revue a résolu les divergences.
Recueil et analyse des données
Deux auteurs de la revue ont indépendamment extrait les données et évalué les risques de biais des études incluses ; un troisième auteur de la revue a résolu les divergences. En raison d'une hétérogénéité inexpliquée, nous avons utilisé des modèles à effets aléatoires dans les méta‐analyses pour les principaux résultats de cette revue lorsque nous avons identifié suffisamment d'essais. Nous avons calculé les différences moyennes standardisées (DMS) pour prendre en compte l'hétérogénéité au niveau des mesures de la consommation de fruits et de légumes. Nous avons réalisé des évaluations des risques de biais et nous avons évalué la qualité des preuves (en utilisant l'approche GRADE) en suivant les procédures Cochrane.
Résultats principaux
Nous avons inclus 50 essais avec 137 bras et 10 267 participants. Trente essais ont examiné l'impact des pratiques portant sur l'alimentation des enfants (par exemple l'exposition répétée à des aliments) sur l'augmentation de la consommation de légumes chez les enfants. Onze essais ont examiné l'impact de l'éducation parentale en nutrition sur l'augmentation de la consommation de fruits et légumes. Huit études ont examiné l'impact des interventions à composantes multiples (par ex. l'éducation parentale en nutrition et les changements des pratiques dans les écoles maternelles) sur l'augmentation de la consommation de fruits et légumes chez les enfants. Une étude a examiné l'effet d'une intervention en nutrition offerte à des enfants sur l'augmentation de la consommation de fruits et légumes chez les enfants.
Treize des 50 essais inclus ont été jugés comme étant exempts de risques élevés de biais dans tous les domaines ; les domaines présentant le plus fréquemment des risques de biais jugés élevés dans les autres études étaient les suivants : la performance, la détection et l'attrition.
La méta‐analyse des essais examinant les pratiques portant sur l'alimentation des enfants par rapport à l'absence d'intervention a révélé un effet positif sur la consommation de légumes (DMS 0,38, IC à 95 % 0,15 à 0,61 ; n = 1509 ; 11 études ; preuves de très faible qualité), ce qui équivaut à une différence moyenne de 4,03 grammes de légumes. Il n'y avait aucune différence à court terme au niveau de la consommation de fruits et de légumes dans les méta‐analyses des essais examinant l'éducation parentale en nutrition par rapport à l'absence d'intervention (DMS 0,11, IC à 95 % ‐0,05 à 0,28 ; n = 3023 ; 10 études ; preuves de très faible qualité) ou les interventions à composantes multiples par rapport à l'absence d'intervention (DMS 0,28, IC à 95 % ‐0,06 à 0,63 ; n = 1861 ; 4 études ; preuves de très faible qualité).
Les données disponibles étaient insuffisantes pour évaluer l'efficacité à long terme, la rentabilité et les conséquences indésirables inattendues. Les études ont rapporté avoir reçu un financement provenant de gouvernements ou de charités, sauf pour deux études rapportant un financement provenant de l'industrie.
Conclusions des auteurs
Bien que 50 essais éligibles portant sur différentes approches d'intervention aient été identifiés, les preuves concernant les stratégies visant à augmenter la consommation de fruits et légumes chez les enfants restent limitées. Il y avait des preuves de très faible qualité indiquant que les interventions portant sur l'alimentation des enfants sont efficaces pour augmenter la consommation de légumes parmi les enfants âgés de cinq ans ou moins, mais l'ampleur de l'effet était de très petite taille et un suivi à long terme est nécessaire. Il y avait des preuves de très faible qualité indiquant que l'éducation parentale en nutrition et les interventions à composantes multiples ne sont pas efficaces pour augmenter la consommation de fruits et légumes chez les enfants âgés de cinq ans ou moins. Tous les résultats doivent être considérés avec prudence, étant donné que la plupart des essais inclus n'ont pas pu être combinés dans des méta‐analyses. Compte tenu des preuves de très faible qualité, les futures recherches sont très susceptibles de modifier les estimations et les conclusions. Ces recherches devraient adopter des méthodes plus rigoureuses pour permettre une progression dans ce champ d'étude.
Cet article est une "revue systématique vivante" (living systematic review). Les revues systématiques vivantes sont une nouvelle approche de recherche impliquant des mises à jour régulières permettant d'intégrer les nouvelles preuves pertinentes au fur et à mesure de leur apparition. Veuillez consulter la base de données des revues systématiques Cochrane pour parcourir la dernière version de cette revue.
PICO
Résumé simplifié
Les interventions destinées à augmenter la consommation de fruits et légumes chez les enfants âgés de cinq ans ou moins
Contexte
La consommation insuffisante de fruits et légumes représente un fardeau sanitaire considérable dans les pays développés. La consommation de fruits et de légumes est associée à une réduction du risque de développer des maladies chroniques. La petite enfance est une période critique pour l'établissement des habitudes alimentaires. Les interventions destinées à augmenter la consommation de fruits et légumes lors de la petite enfance pourraient ainsi être efficaces pour réduire le fardeau lié à ces maladies.
Question de la revue
Évaluer les effets des interventions destinées à augmenter la consommation de fruits et/ou de légumes, chez les enfants âgés de cinq ans ou moins.
Méthodes
Nous avons effectué des recherches dans plusieurs bases de données électroniques ainsi que des recherches manuelles dans les journaux pertinents pour identifier des études éligibles. Nous avons contacté des chercheurs pour obtenir d'autres études potentiellement pertinentes. Tous les essais randomisés (dans lesquels les participants ont les mêmes chances d'être assignés à un groupe de traitement ou à un groupe de comparaison) portant sur des interventions visant à augmenter l'apport en fruits et/ou en légumes destinés à des enfants âgés de cinq ans ou moins mesurant l'apport alimentaire étaient éligibles. Deux auteurs de la revue ont indépendamment recherché et extrait les informations issues des études. Les preuves sont à jour jusqu'en septembre 2016.
Résultats
Nous avons inclus 50 essais comprenant un total de 10 267 participants. Trente essais ont examiné les interventions portant sur l'alimentation des enfants, 11 essais ont examiné les interventions éducatives auprès des parents, huit essais ont examiné les interventions à composantes multiples et une étude a examiné une intervention éducative auprès des enfants. Les interventions portant sur l'alimentation des enfants (par exemple, l'exposition répétée à des légumes) étaient efficaces pour accroître l'apport en légumes chez les enfants sur le court terme (moins de 12 mois). L'éducation parentale portant sur la nutrition et les interventions à composantes multiples (par ex. les modifications des pratiques dans les écoles maternelles et l'éducation parentale) n'étaient pas efficaces pour accroître la consommation de fruits et légumes chez les enfants. Il n'y avait pas suffisamment d'informations pour évaluer l'efficacité à long terme, la rentabilité et les effets délétères involontaires. Les études rapportant un soutien financier ont décrit des fonds provenant de sources gouvernementales ou caritatives, sauf pour deux études ayant reçu un financement provenant de l'industrie.
Conclusions
Les preuves portant sur l'efficacité des interventions visant à augmenter la consommation de fruits et légumes chez les enfants âgés de cinq ans ou moins restent limitées. Les interventions portant sur l'alimentation des enfants semblent augmenter la consommation de légumes (de 4,03 grammes), mais cette conclusion est basée sur des preuves de très faible qualité et est très susceptible de changer face aux résultats de futures études.
Cet article est une "revue systématique vivante" (living systematic review). Les revues systématiques vivantes sont une nouvelle approche de recherche impliquant des mises à jour régulières permettant d'intégrer les nouvelles preuves pertinentes au fur et à mesure de leur apparition. Veuillez consulter la base de données des revues systématiques Cochrane pour parcourir la dernière version de cette revue.
Authors' conclusions
Summary of findings
| Child feeding interventions compared to no intervention for children aged 5 years and under | ||||||
| Patient or population: children aged 5 years and under | ||||||
| Outcomes | Anticipated absolute effects* (95% CI) | Relative effect | № of participants | Quality of the evidence | Comments | |
| Risk with no intervention | Risk with Child feeding interventions | |||||
| Short‐term impact (< 12 months) child vegetable intake | The mean vegetable intake was 7.7 grams1 | The mean vegetable intake (grams) in the intervention group was 4.03 higher (1.59 higher to 6.47 higher) | ‐ | 1509 | ⊕⊝⊝⊝ | Scores estimated using a standardised mean difference of 0.38 (0.15 to 0.61) and a standard deviation of 10.61.1 The mean duration of follow up post‐intervention for studies included in the meta‐analysis was 4.6 weeks. 2 studies that compared 1 or more child‐feeding practice interventions to a no‐treatment control could not be synthesised in meta‐analysis; both reported a significant increase in fruit or vegetables or both |
| Short‐term impact (< 12 months) cost effectiveness ‐ not reported | No child feeding interventions reported this outcome | ‐ | ‐ | ‐ | ‐ | |
| Short‐term impact (< 12 months) unintended adverse events | One trial (Spill 2011a) reported no adverse effects on amount of meal consumed | ‐ | 39 | ⊕⊝⊝⊝ | ‐ | |
| *The risk in the intervention group (and its 95% confidence interval) is based on the assumed risk in the comparison group and the relative effect of the intervention (and its 95% CI) | ||||||
| GRADE Working Group grades of evidence | ||||||
| 1We used the post‐intervention mean and standard deviation of the control group from Wardle 2003a for the risk with no intervention and to re‐express the SMD in terms of grams of intake. | ||||||
| Parent nutrition education interventions compared to no intervention for children aged 5 years and under | ||||||
| Patient or population: children aged 5 years and under | ||||||
| Outcomes | Anticipated absolute effects* (95% CI) | Relative effect | № of participants | Quality of the evidence | Comments | |
| Risk with no intervention | Risk with Parent nutrition education interventions | |||||
| Short‐term impact (< 12 months) child fruit and vegetable intake | The mean serves of vegetables per day was 1.61 | The mean serves of vegetables per day in the intervention group was 0.11 higher (0.05 lower to 0.28 higher) | ‐ | 3023 | ⊕⊝⊝⊝ | Scores estimated using a standardised mean difference of 0.11 (‐0.05 to 0.28) and a standard deviation of 1.01 The mean duration of follow up post‐intervention for studies included in the meta‐analysis was 9.8 weeks. 1 trial could not be pooled in the meta‐analysis; it found an intervention targeting parent responsivity and behaviour management to be effective in increasing total fruit intake compared to control |
| Short‐term impact (< 12 months) cost effectiveness | Information regarding intervention costs was reported in 1 trial (Campbell 2013) | ‐ | 389 | ⊕⊝⊝⊝ | ‐ | |
| Short‐term impact (< 12 months) unintended adverse events | One trial (Wyse 2012) reported no adverse effect on family food expenditure | ‐ | 343 | ⊕⊝⊝⊝ | ||
| *The risk in the intervention group (and its 95% confidence interval) is based on the assumed risk in the comparison group and the relative effect of the intervention (and its 95% CI). | ||||||
| GRADE Working Group grades of evidence | ||||||
| 1We used the post‐intervention mean and standard deviation of the control group from Skouteris 2015 for the risk with no intervention and to re‐express the SMD in terms of serves of vegetables per day. | ||||||
| Multicomponent interventions compared to no intervention for children aged 5 years and under | ||||||
| Patient or population: children aged 5 years and under | ||||||
| Outcomes | Anticipated absolute effects* (95% CI) | Relative effect | № of participants | Quality of the evidence | Comments | |
| Risk with no intervention | Risk with Multicomponent interventions | |||||
| Short‐term impact (< 12 months) child fruit and vegetable intake | The mean cups of vegetables per day was 1.081 | The mean cups of vegetables per day in the intervention group was 0.29 higher (0.06 lower to 0.66 higher) | ‐ | 1861 | ⊕⊝⊝⊝ | Scores estimated using a standardised mean difference of 0.28 (‐0.06 to 0.63) and a standard deviation of 1.051 The mean duration of follow up post‐intervention for studies included in the meta‐analysis was 1.3 weeks. 4 studies could not be pooled in meta‐analysis. 3 reported significant increases in both fruit and vegetable consumption, and 1 significantly increased fruit but not vegetable consumption |
| Short‐term impact (< 12 months) cost effectiveness ‐ not reported | No studies reported this outcome | ‐ | ‐ | ‐ | ‐ | |
| Short‐term impact (< 12 months) unintended adverse events ‐ not reported | No studies reported this outcome | ‐ | ‐ | ‐ | ‐ | |
| *The risk in the intervention group (and its 95% confidence interval) is based on the assumed risk in the comparison group and the relative effect of the intervention (and its 95% CI). | ||||||
| GRADE Working Group grades of evidence | ||||||
| 1We used the post‐intervention mean and standard deviation of the control group from Williams 2014 for the risk with no intervention and to re‐express the SMD in terms of cups vegetables per day. | ||||||
| Child nutrition education interventions compared to no intervention for children aged 5 years and under | ||||||
| Patient or population: children aged 5 years and under | ||||||
| Outcomes | Anticipated absolute effects* (95% CI) | Relative effect | № of participants | Quality of the evidence | Comments | |
| Risk with no intervention | Risk with Child nutrition education interventions | |||||
| Short‐term impact (< 12 months) child fruit and vegetable intake | The mean short‐term impact (< 12 months) child vegetable intake frequency score was 4 (a score of 4 corresponds to consumption of vegetables 3 ‐ 4 times per week) | MD 0 | ‐ | 238 | ⊕⊕⊝⊝ | The only study (Baskale 2011) reported an increase in some of the fruits and vegetables assessed in the intervention group and no significant differences in the control group The duration of follow up post‐intervention was 8 weeks. |
| Cost or cost effectiveness ‐ not reported | No studies reported this outcome | ‐ | ‐ | ‐ | ‐ | |
| Unintended adverse events ‐ not reported | No studies reported this outcome | ‐ | ‐ | ‐ | ‐ | |
| *The risk in the intervention group (and its 95% confidence interval) is based on the assumed risk in the comparison group and the relative effect of the intervention (and its 95% CI). | ||||||
| GRADE Working Group grades of evidence | ||||||
| 1Downgraded one level for risk of bias: high risk of bias due to lack of blinding and loss to follow‐up. | ||||||
Background
Description of the condition
Chronic diseases are illnesses which are typically prolonged in duration, do not resolve spontaneously and are rarely cured completely (Australian Institute of Health and Welfare 2017). Insufficient consumption of fruits and vegetables is associated with a range of chronic diseases, such as cancer and cardiovascular disease (World Health Organization 2003; World Health Organization 2011). Globally, 2.8% of all deaths and 1.0% of all disability‐adjusted life years (DALYs) each year are attributable to inadequate fruit and vegetable intake (World Health Organization 2017). Low fruit and vegetable consumption is responsible for 14% of gastrointestinal cancer deaths, 11% of all ischaemic heart disease and 9% of all stroke deaths (World Health Organization 2017). Increasing global fruit and vegetable intake therefore represents a public health priority and has the capacity to reduce the burden of coronary heart disease by 31%, oesophageal cancer by 20%, and Ischaemic stroke by 19% (Lock 2005).
To reduce the risk of chronic diseases, consumption of at least 400 grams a day of fruit and vegetables is recommended (World Health Organization 1997; World Health Organization 2017). Nationally representative surveys, however, indicate that throughout most regions of the globe, daily consumption of fruits and vegetables is well below such recommendations (Lock 2005).
Population surveys of children indicate the need to increase the intake of fruits and vegetables (Lock 2005; World Health Organization 2004a; Yngve 2005). For example, less than a third of school‐aged children from European nations report consuming vegetables on a daily basis (World Health Organization 2004a). Data from younger children is similar. A survey conducted in 2007 to 2010 in the USA reported 33% of children aged one to three years met fruit recommendations and 13% met vegetable recommendations (National Cancer Institute 2015). A national survey in 2011 to 2012 in Australia reported 90% of children aged two to eight years consume the recommended number of fruit serves a day, and 49% of children aged two to three years consume the recommended serves of vegetables (Australian Bureau of Statistics 2014). Globally, the mean intake of fruit and vegetables is below the World Health Organization (WHO) recommendations across all WHO regions. South American, African, and South East Asian nations report the lowest quantities of child fruit and vegetable intake, where school‐aged children typically consume less than 300 grams a day (Lock 2005).
There is some evidence from longitudinal studies to suggest that eating behaviours established in childhood are likely to persist into adulthood (Lien 2001; Mikkilä 2004). Additionally, longitudinal studies have shown that fruit and vegetable consumption in childhood is associated with reductions in chronic diseases in adulthood (Maynard 2003; Ness 2005). Encouraging healthy eating among children may therefore represent an effective primary prevention strategy for reducing the risk of chronic diseases (Boeing 2012; Centers for Disease Control and Prevention 2011; Maynard 2003; Ness 2005; World Health Organization 2004b). Thirty‐seven‐year follow‐up data from the Boyd Orr cohort study of British children, for example, found lower rates of all‐cause cardiovascular mortality among children with greater intake of vegetables in childhood (Ness 2005). Adequate fruit and vegetable intake during childhood may also have a number of immediate benefits, including reducing the risk of micronutrient deficiencies and a number of respiratory illnesses (Antova 2003; Boeing 2012; Forastiere 2005; World Health Organization 2003).
Description of the intervention
The aetiology of fruit and vegetable consumption is complex, involving the dynamic interaction of a variety of factors. Given such complexity, a number of frameworks have been produced to guide the development of interventions to increase fruit and vegetable intake (Centers for Disease Control and Prevention 2011; Klepp 2005; Miller 2000; World Health Organization 2004b). The conceptual framework developed for the international Pro Children Project suggests that interventions targeting a variety of cultural, physical and social environment factors, as well as those targeting personal factors, may be effective in positively influencing fruit and vegetable intake among children (Klepp 2005).
Despite the range of potential intervention targets, including primordial prevention interventions that target the risk factors of chronic disease before they occur (compared to primary prevention interventions that treat risk factors of chronic disease), previous trials have tended to focus on those determinants more amenable to intervention, such as nutrition knowledge and skills, or the food environment of settings such as schools (Hector 2008). Among school‐aged children, systematic reviews suggest that the strongest evidence exists for the efficacy of multicomponent interventions with elements such as curriculum, parental engagement, policy and food environment changes (Blanchette 2005; De Sa 2008; Jaime 2009; Knai 2006; Van Cauwenberghe 2010). Previous reviews in children aged five years and younger (Campbell 2007; Hesketh 2010; Tedstone 1998) have similarly found some evidence for multicomponent interventions. Primordial prevention interventions targeting preschool‐aged children also demonstrate consistent evidence. For example, an intervention aiming to prevent the onset of cardiovascular disease in preschoolers targeted multiple risk factors, including child fruit and vegetable consumption (Peñalvo 2013a; Peñalvo 2013b). The multicomponent intervention including curriculum, school environment and family components successfully improved preschoolers' fruit and vegetable habits, which were also maintained over time (Peñalvo 2013a; Peñalvo 2013b; Peñalvo 2015).
How the intervention might work
A number of theories have been used to explain a mechanism by which interventions may influence children's fruit and vegetable consumption (Rasmussen 2006). In most instances, psychosocial theories such as Social Cognitive Theory (Bandura 1986), the Theory of Planned Behaviour (Ajzen 1991), or the Stages of Change Trans‐theoretical Model (Prochaska 1984) have been used to explain possible causal pathways to fruit and vegetable consumption (Rasmussen 2006). Collectively, such theories assert that changes in attitudes, knowledge and skills and perceived norms and expectancies are required for behavioural change. The international Pro Children Project incorporated Social‐Ecological Theory in its conceptual theoretical framework of determinants of children's fruit and vegetable consumption (Klepp 2005). Interventions derived from Social‐Ecological Theory recognise the importance of more structural influences on children's intake of fruit and vegetable consumption, for example, the availability or accessibility of fruit and vegetables in the home or in settings such as schools which children frequent.
Why it is important to do this review
Previous reviews have identified a number of factors associated with fruit and vegetable consumption among children (Blanchette 2005; Pearson 2008; Rasmussen 2006; Van der Horst 2007). While such reviews provide important information for the development of interventions, only systematic reviews of intervention trials can determine the efficacy of strategies to increase child fruit and vegetable consumption. A number of such reviews have been published (Burchett 2003; Ciliska 2000; Delgado‐Noguera 2011; De Sa 2008; Evans 2012; French 2003; Hendrie 2017; Howerton 2007; Knai 2006; Savoie‐Roskos 2017; Van Cauwenberghe 2010). However, only a few have focused specifically on children aged five years and under (Campbell 2007; Hesketh 2010; Tedstone 1998). Of these, most lacked important information relevant to practice, such as the effectiveness of interventions for various subpopulations (such as minority groups), the cost effectiveness of interventions, or the presence of any unintended adverse effects of the intervention. Similarly, as positive impacts of health behaviour interventions may not be sustained, an examination of the longer‐term effectiveness of interventions (more than 12 months post‐intervention) is important for policy‐makers and practitioners to assess the potential health benefits of fruit and vegetable interventions (Fjeldsoe 2011; Jones 2011). Previous reviews have not specifically examined the impact of interventions based on the length of post‐intervention follow‐up. A comprehensive systematic review on this issue is therefore required to provide guidance for practitioners and policy‐makers interested in implementing strategies to promote the consumption of fruits and vegetables in early childhood.
Following the publication of this 2017 update of the review, we will maintain it as a living systematic review, as a pilot up until the end of March 2018. This means we will be continually running the searches and rapidly incorporating any newly‐identified evidence into the review (for more information about the living systematic review approach being piloted by Cochrane, see Appendix 1). We believe a living systematic review approach is appropriate for this review, for three reasons. First, the review addresses a particularly important public health issue; the growing burden of disease and mortality attributable to low fruit and vegetable intake. Insufficient consumption of fruits and vegetables is associated with a range of chronic diseases such as cancer and cardiovascular disease, and in most regions of the globe current daily consumption of fruits and vegetables is well below the recommended intake to reduce the risk of chronic diseases. Early childhood represents a critical period for the establishment of healthy eating behaviours, such as fruit and vegetable intake, as dietary habits developed early are likely to persist into adulthood. It is therefore important to better understand how to improve intake of fruits and vegetables during childhood. Secondly, there remains uncertainty in the existing evidence; despite the 2017 update identifying a further 45 studies for the review, no high‐quality evidence exists of effective interventions to increase the fruit and vegetable consumption of children. Thirdly, we are aware of multiple ongoing trials in this area of research that will be important to incorporate, and we expect that future research will have impact on the conclusions.
Objectives
To assess the effectiveness, cost effectiveness and associated adverse events of interventions designed to increase the consumption of fruit or vegetables or both among children aged five years and under.
Methods
Criteria for considering studies for this review
Types of studies
Eligible trials were randomised controlled trials (RCTs), including cluster‐randomised controlled trials (C‐RCTs) and cross‐over trials, that:
1. Compared two or more alternative intervention programmes to increase the consumption of fruit or vegetables or both of children aged five years and under;
2. Compared an intervention programme to increase the consumption of fruit or vegetables or both of children aged five years and under with a standard‐care or no‐intervention control group.
We excluded trials which did not include fruit or vegetable intake as a primary trial outcome, to avoid the potential confounding effects of other interventions, and because publication bias and selective outcome reporting are more predominant among secondary trial outcomes (or outcomes that were not otherwise stated). We included trials that did not state a primary trial outcome but did assess an eligible fruit or vegetable intake outcome. We included eligible cross‐over trials in the review, as we deemed them a suitable and common method for assessing the effect of interventions to increase the fruit and vegetable consumption of children.
Types of participants
Participants could include:
1. Children aged five years and under. Trials including children older than five years were included only if the mean age of the study sample at baseline was five years or less;
2. Parents, guardians and families responsible for the care of children aged five years and under;
3. Professionals responsible for the care of children aged five years and under, including childcare staff and health professionals.
Types of interventions
We considered any educational, experiential, health promotion and/or psychological or family or behavioural therapy or counselling or management or structural or policy or legislative reform interventions, designed to increase consumption of fruit or vegetables or both in children aged five years and under (as defined in types of participants). Interventions could be conducted in any setting including the home, childcare/preschool services, health services, or community settings.
Comparison: Any alternative intervention to encourage fruit and vegetable consumption as described above, or a no‐intervention control, usual care, or attention control or wait‐list control. Attention controls in randomised trials for behavioural interventions are those that include clinical attention and induce the expectation of therapeutic benefit for control for non‐specific effects of the intervention (Freedland 2011). Wait‐list control groups that are also designed to control for non‐specific effects involve participants being allocated to receive an intervention at study conclusion (delayed start) (Whitehead 2004).
Types of outcome measures
We include studies with evaluated outcomes measuring biomedical or dietary indices or both.
Primary outcomes
The primary outcome was children's fruit and vegetable intake. Fruit and vegetable intake could be assessed using a variety of measures, including:
-
Change in the number of portions or serves of daily fruit or vegetable or both at follow‐up, as measured by diet recalls, food diaries, food frequency questionnaires or diet records completed by an adult on behalf of the child. We grouped the interventions by short‐term effects (less than 12 months post‐intervention) and long‐term effects (at least 12 months post‐intervention);
-
Change in grams of fruit or vegetables or both at follow‐up, as measured by diet recalls, food diaries, food frequency questionnaires or diet records completed by an adult on behalf of the child. We grouped them by short‐term effects (less than 12 months post‐intervention) and long‐term effects (at least 12 months post‐intervention);
-
Changes in biomedical markers of consumption of fruit or vegetables or both, such as α‐carotene, β‐carotene, cryptoxanthin, lycopene and lutein. We grouped them by short‐term effects (less than 12 months post‐intervention) and long‐term effects (12 months or more post‐intervention).
Outcomes of fruit or vegetable juice intake alone were not eligible. Outcomes that included child fruit and vegetable juice intake as part of an aggregate measure of child fruit or vegetable intake were eligible.
Secondary outcomes
-
Estimates of absolute costs and cost effectiveness of interventions to increase the consumption of fruits and vegetables reported in identified studies.
-
Any reported adverse effects of an intervention to increase the consumption of fruits and vegetables reported in identified studies. This could include any physical, behavioural, psychological or financial impact on the child, parent or family, or the service or facility where an intervention may have been implemented.
Search methods for identification of studies
This review represents the first update of a previously published review (Wolfenden 2012).
Electronic searches
We conducted a search of the following electronic databases:
-
Cochrane Central Register of Controlled Trials (CENTRAL) Issue 8, 2016 in the Cochrane Library (searched 30 September 2016);
-
Epub Ahead of Print, In‐Process & Other Non‐Indexed Citations, MEDLINE Daily and MEDLINE (Ovid, 1946 to 30 September 2016) (searched 30 September 2016);
-
Embase Classic and Embase (Ovid, 1947 to 2016 week 39) (searched 30 September 2016);
-
CINAHL (EBSCO, 1937 to 5 July 2016) (searched 5 July 2016);
-
PsycINFO (Ovid,1806 to June week 5 2016) (searched 5 July 2016).
The search strategies are described in Appendix 2. We applied the sensitivity‐maximising version of the Cochrane RCT filter (Lefebvre 2011) to MEDLINE, and adaptations of it to the other databases except for CENTRAL. We imposed no restrictions by date or language of publication.
As a living systematic review we will run the following electronic database searches monthly:
-
CENTRAL
-
Epub Ahead of Print, In‐Process & Other Non‐Indexed Citations, MEDLINE Daily and MEDLINE
-
Embase
We will set up auto‐alerts (where possible) to deliver a monthly search yield by email.
We will review search methods and strategies approximately yearly, to ensure they reflect any terminology changes in the topic area, or in the databases.
Searching other resources
We searched the reference lists of included articles and handsearched all articles published between 2006 and September 2016 in three relevant international peer‐reviewed journals (Journal of Nutrition Education and Behavior, Public Health Nutrition, and Journal of the Academy of Nutrition and Dietetics (previously titled Journal of the American Dietetic Association)).
We searched the metaRegister of clinical trials (www.controlled‐trials.com/mrct/) and the WHO International Clinical Trials Registry Platform (www.who.int/ictrp/) in November 2016, and www.clinicaltrials.gov on 14 June 2017. We searched a database of published dissertations, Proquest Dissertations and Theses, in November 2016, to identify eligible studies. We conducted a 'grey literature' search in GoogleScholar on 14 June 2017, of which we screened the first 200 citations for eligibility. We contacted the authors of included studies to try to obtain other eligible trials published in peer‐reviewed journals, as well as ongoing trials. We describe ongoing studies, where available, detailing the primary author, research question(s), methods and outcome measures (Characteristics of ongoing studies).
We are now running monthly trial registry searches of WHO International Clinical Trials Registry Platform and clinicaltrials.gov. We will set up auto‐alerts (where possible) to deliver a monthly search yield by email.
We will conduct selected searches of other resources (articles published in three relevant international peer‐reviewed journals: Journal of Nutrition Education and Behavior, Public Health Nutrition, and Journal of the Academy of Nutrition and Dietetics; database of published dissertations; and 'grey literature' in GoogleScholar) manually every six months.
As additional steps to inform the living systematic review, we will contact corresponding authors of ongoing studies as they are identified and ask them to advise when results are available, or to share early or unpublished data. We will contact the corresponding authors of any newly‐included studies for advice as to other relevant studies. We will conduct citation tracking of included studies in Web of Science Core Collection on an ongoing basis. For that purpose, we have set up citation alerts in Web of Science Core Collection. We will manually screen the reference lists of any newly‐included studies and systematic reviews. Also, we will use the 'Related citation' feature in PubMed to identify additional articles.
We will review search methods and strategies approximately yearly, to ensure they reflect any terminology changes in the topic area, or in the databases.
Data collection and analysis
Selection of studies
Pairs of review authors (from RH, RW, FS, SY, NN) independently screened titles and abstracts of identified papers. Review authors were not blinded to the details of the study author or journal. Review authors applied a standardised screening tool to assess eligibility. Articles were screened against the eligibility criteria of participants (mean age of children more than five years), outcome (primary outcome was not fruit and vegetable intake), comparator (was not a no‐intervention, usual care, attention or wait‐list control), intervention (did not aim to increase child fruit or vegetable intake) and study type (was not RCT, C‐RCT or cross‐over trial with random allocation to group). Based on the title and abstract, we excluded papers which clearly did not meet the eligibility criteria of the review. Pairs of review authors (from FS, RH, NN, RS, SY) then independently examined the full text of all remaining articles. We documented Information regarding the reason for the ineligibility of any paper for which we reviewed the full text, and present it in the table 'Characteristics of excluded studies'. A third review author with expertise in review methodology (LW) resolved any disagreements between review authors on study eligibility. For those papers which did not provide sufficient information to determine eligibility, we contacted the study authors for clarification.
We will immediately screen any new citations retrieved by the monthly searches. As the first step of monthly screening, we will apply the machine learning classifier (RCT model) (Wallace 2017), available in the Cochrane Register of Studies (CRS‐Web) (Cochrane 2017a). The classifier assigns a probability (from 0 to 100) to each citation of being a true RCT. For citations that are assigned a probability score of less than 10, the machine learning classifier currently has a specificity/recall of 99.987% (Wallace 2017). We will screen in duplicate and independently all citations assigned a score from 10 to 100 . Citations that score 9 or less will be screened by Cochrane Crowd (Cochrane 2017b). Any citations that are deemed to be potential RCTs by Cochrane Crowd will be returned to the authors for screening.
Data extraction and management
Pairs of review authors (from EJ, RW, RH, KB, KO, ER, TCM, RS) independently extracted data from each included trial. Review authors were not blinded to the details of the study author or journal. We recorded data on data extraction forms designed and piloted specifically for this review. Consultation with a third review author with expertise in review methodology (LW) resolved discrepancies between review authors about data extraction. We tried to contact authors of included papers in instances where the information required for data extraction was not available from the published report, or was unclear. One review author entered extracted data into the systematic review software Review Manager 5 (RevMan) (RH) and another review author checked it (KO). Where available, we extracted the following information from included trials:
1. Information on the study, research design and methods, such as the study authors; date of publication; date of study initiation; study duration; setting; number of participants; participants' age, gender, ethnicity, and socioeconomic position.
2. Information on the experimental conditions of the trial, such as the number of experimental conditions; intervention and comparator components; duration; number of contacts; modalities; interventionist; and integrity.
3. Information on the trial outcomes and results, such as rates of recruitment and attrition; sample size; number of participants per experimental condition; mean and standard deviation of the primary or secondary outcomes described above; any subgroup analyses by gender, population group or intervention characteristics; and analyses (including whether studies appropriately adjusted for clustering).
Assessment of risk of bias in included studies
Two review authors (FS and FT) independently assessed the risks of bias in the included studies. We consulted a third review author (RH) with expertise in review methodology to resolve any disagreements between review authors. Review authors used the tool outlined in the Cochrane Handbook for Systematic Reviews of Interventions (Higgins 2011) to assess the risks of bias. The tool requires an explicit judgement by the review authors, based on trial information, about the risks of bias attributable to the generation of the random sequence, the allocation concealment, the blinding of participants, personnel and outcome assessors, the completeness of outcome data, selective reporting, and any other potential threats to validity. We also judged recruitment bias, baseline imbalance, loss of clusters and incorrect analysis for C‐RCTs. Judgements on the risks of bias for each trial are recorded in the ‘Risk of bias’ tables accompanying the review.
Measures of treatment effect
Where meta‐analyses were performed, we expressed the intervention effect as a mean difference (MD) where outcomes were reported using a standard metric (such as grams), and as a standardised mean difference (SMD) where outcomes were reported using different methods or metrics of fruit and vegetable intake (such as grams, grams per kilogram of body weight, and serves per day).
Unit of analysis issues
We assessed cluster‐randomised trials in the review for unit‐of‐analysis errors. Where cluster‐randomised studies did not account for clustering, we contacted study authors to provide intra‐class correlation coefficients (ICCs) to allow calculation of design effects and effective sample sizes to enable individual‐level pooling. Where ICCs were not available, we estimated a mean ICC from reported ICCs of included studies, and used it to calculate effective sample sizes.
Dealing with missing data
Where available, we reported outcomes of trials using an intention‐to‐treat analysis. If studies did not report intention‐to‐treat analyses, we reported as‐treated analysis of trial outcomes. We explored the impact of including as‐treated trial outcomes in meta‐analysis for studies with a high rate of attrition (more than 20% for short‐term outcomes) in sensitivity analyses (see below Sensitivity analysis). We contacted study authors to obtain any missing data (e.g. standard deviations).
Assessment of heterogeneity
We assessed statistical heterogeneity by visual inspection of forest plots of the included trials, and calculation of the I2 statistic where data from included trials could be pooled. Subgroup analyses by trial characteristics (e.g. type of participants, intervention or outcomes) to identify the source of substantial heterogeneity (defined as I2 greater than 50%) was not able to be conducted due to the similarity in trial characteristics.
Assessment of reporting biases
We checked for reporting bias by visual inspection of the funnel plots.
Data synthesis
We assessed trial outcomes using a variety of dietary assessment tools and reported in various metrics, including vitamin C from fruit, fruit or vegetable serves, and grams of fruit and/or vegetable consumption. We calculated standardised mean differences (SMDs; to account for variable outcome measures) for each comparison, using the generic inverse variance method in a fixed‐effect meta‐analysis model (where there was no or low statistical heterogeneity in the primary analysis) or a random‐effects meta‐analysis model (where there was unexplained heterogeneity in the primary analysis), using the RevMan software. We selected post‐intervention values over change‐from‐baseline data for inclusion in meta‐analysis, to reduce the risk of selective reporting and to maximise the number of studies that could be pooled.
We synthesised studies that provided data suitable for pooling in meta‐analyses grouped by intervention type (infant feeding, parent nutrition education, and multicomponent interventions). When studies reported multiple fruit or vegetable outcomes, we selected the stated primary trial outcome for inclusion in our meta‐analyses, or if a primary outcome was not stated we selected the first reported outcome for inclusion. For studies which reported multiple follow‐up points, we extracted data from the longest follow‐up period for inclusion in meta‐analyses.
We selected reported study estimates that adjusted for potential confounding variables for inclusion in meta‐analysis over reported estimates that did not adjust for potential confounding variables. Similarly, for C‐RCTs that reported study estimates that were unadjusted and adjusted for clustering, we preferred estimates that adjusted for clustering for inclusion in meta‐analyses. For C‐RCTs that did not report post‐intervention study estimates (and a relevant measure of variance) that accounted for clustering, we calculated a design effect and effective sample size using study data (number of clusters, number of participants analysed) and a reported ICC from one of the included studies (vegetable intake: ICC 0.014, fruit intake: ICC 0.016; De Bock 2012). For such C‐RCTs (De Coen 2012; Martinez‐Andrade 2014; Namenek Brouwer 2013; Nicklas 2017; O'Connell 2012; Roset‐Salla 2016; Verbestel 2014; Williams 2014), we entered the reported post‐intervention outcome data (e.g. mean and standard deviation) and author‐calculated effective sample sizes into Revman to calculate individual‐level adjusted study estimates to enable inclusion in meta‐analyses. We tried to pool studies separately that compared two or more alternative interventions.
For cross‐over trials, we tried to synthesise results separately from parallel RCTs, by pooling results from paired analyses that adjust for within‐individual comparisons. If such data were not available, we combined results by pooling data from the first cross‐over period (i.e. essentially a parallel RCT) with parallel RCTs.
In all instances where we could not combine data in a meta‐analysis, we have provided a narrative summary of the trial findings according to the review objectives.
Whenever we find new evidence (i.e. studies, data or information) meeting the review inclusion criteria, we will extract the data, assess risks of bias and incorporate it into the synthesis every three months, as appropriate.
We will incorporate any new study data into existing meta‐analyses using the standard approaches outlined in the Data synthesis section.
We will not adjust the meta‐analyses to account for multiple testing, given that the methods related to frequent updating of meta‐analyses are under development (Simmonds (in press)).
Summary of Findings table and GRADE
We created 'Summary of findings' tables using the following outcomes:
-
Child fruit and vegetable intake. This could include changes in the number of portions or serves or grams of daily fruit or vegetable or both at follow‐up, as measured by diet recalls, food diaries, food frequency questionnaires or diet records completed by an adult on behalf of the child; or changes in biomedical markers of consumption of fruit or vegetables or both, such as α‐carotene, β‐carotene, cryptoxanthin, lycopene and lutein.
-
Estimates of absolute costs and cost effectiveness of interventions to increase the consumption of fruit and vegetables reported in the included studies;
-
Any reported adverse events of an intervention to increase the consumption of fruit and vegetables reported in the included studies. This could include any physical, behavioural, psychological or financial impact on the child, parent or family, or the service or facility where an intervention may have been implemented.
We have produced four 'Summary of findings' tables, one for each of the following comparisons:
-
Child‐feeding interventions compared to no‐intervention control;
-
Parent nutrition education interventions compared to no‐intervention control;
-
Multicomponent interventions compared to no‐intervention control;
-
Child nutrition education interventions compared to no‐intervention control.
We used the five GRADE considerations (study limitations, consistency of effect, imprecision, indirectness and publication bias) to assess the quality of a body of evidence as it relates to the studies which contribute data to the meta‐analyses for the prespecified outcomes. We used methods and recommendations described in Section 8.5 and Chapter 12 of the Cochrane Handbook for Systematic Reviews of Interventions (Higgins 2011), using GRADEpro software (gradepro.org/). We justified all decisions to downgrade the quality of studies using footnotes, and made comments to aid the reader's understanding of the review where necessary. For each comparison where we had calculated a SMD, we re‐expressed it based on the instrument used in the lowest risk of bias in that comparison (e.g. grams of vegetable intake or serves of vegetables a day), by multiplying the post‐intervention standard deviation of the control group by the pooled SMD.
Two review authors (RH and NN), working independently, judged the quality of the evidence, with disagreements resolved by discussion or by involving a third review author (LW). We justified, documented and incorporated the judgements into the reporting of results for each outcome.
We extracted study data, formatted our comparisons in data tables and prepared a 'Summary of findings' table before writing the results and conclusions of our review.
Subgroup analysis and investigation of heterogeneity
Where possible, we conducted subgroup analyses of interventions for the following subgroups, which we had planned a priori:
-
Interventions targeting boys and girls (not conducted);
-
Interventions targeting minority groups including indigenous populations (not conducted, described narratively);
-
Interventions delivered in various settings including health and children’s services (conducted where possible for some comparisons and settings);
-
Interventions of varying intensities, defined in terms of the number and duration of intervention contacts or components (not conducted);
-
Interventions delivered in different modes, such as by telephone, the Internet or face‐to‐face (conducted for some comparisons and modalities, otherwise described narratively).
Sensitivity analysis
Where possible, we conducted sensitivity analyses to explore the impact on the overall assessment of treatment effects:
-
Excluding studies at high risk of bias (defined a priori);
-
Excluding studies not reporting an intention‐to‐treat analysis, with high rates of participant attrition defined as greater than 20% (defined a priori);
-
Excluding studies that did not have a primary outcome of child fruit and vegetable consumption (post hoc).
For the sensitivity analysis excluding studies that did not have a primary outcome of child fruit and vegetable consumption, we considered studies to have a primary outcome of children's fruit and vegetable intake even when this was not explicitly stated if: children's fruit and vegetable intake was the only reported outcome, a sample size calculation for children's fruit and vegetable intake was reported, or children's fruit and vegetable intake was the first reported outcome.
Other
We will review our scope and methods if appropriate in the light of potential changes in the topic area, or the evidence being included in the review (e.g. additional comparisons, interventions or outcomes, or new review methods available).
We are piloting this review as a living systematic review up until March 2018.
Results
Description of studies
See: Characteristics of included studies; Characteristics of excluded studies; Characteristics of ongoing studies.
Results of the search
We ran searches for the original review (Wolfenden 2012) and for the review update, which together generated 22,953 citations (10,720 original review; 12,233 review update). Screening of titles and abstracts from the review update identified 414 papers (558 in total, including 144 from original review) for formal inclusion or exclusion. (See Figure 1). Of these, 50 trials (Anzman‐Frasca 2012; Barends 2013; Baskale 2011; Black 2011; Blissett 2016; Campbell 2013; Caton 2013; Cooke 2011; Correia 2014; Cravener 2015; Daniels 2014; De Bock 2012; De Coen 2012; De Droog 2014; De Wild 2013; De Wild 2015a; De Wild 2015b; Duncanson 2013; Fildes 2014; Fildes 2015; Fisher 2012; Haire‐Joshu 2008; Harnack 2012; Hausner 2012; Hetherington 2015; Keller 2012; Martinez‐Andrade 2014; Menella 2008; Namenek Brouwer 2013; Natale 2014a; Nicklas 2017; O'Connell 2012; Remington 2012; Remy 2013; Roe 2013; Roset‐Salla 2016; Savage 2012; Skouteris 2015; Spill 2010; Spill 2011a; Spill 2011b; Staiano 2016; Tabak 2012; Verbestel 2014; Vereecken 2009; Wardle 2003a; Watt 2009; Williams 2014; Witt 2012; Wyse 2012) met the inclusion criteria. We contacted authors of the included trials for any missing outcome data, to permit meta‐analysis.

Study flow diagram.
Included studies
There were 137 trial arms and 10,267 participants randomised across the 50 included trials. We give full details of the trials in the Characteristics of included studies table. Twenty‐two trials were undertaken in the USA, eight in the United Kingdom, five each in Australia and the Netherlands, three in Belgium, and one each in Turkey, Germany, Denmark, Mexico, France and Spain, and one study that was undertaken in the United Kingdom, Greece and Portugal. Twenty‐three of the included studies were RCTs, of which 14 compared an intervention to a no‐treatment control group; 18 were C‐RCTs, of which 15 compared an intervention to a no‐treatment control group; and nine were cross‐over trials. The unit of randomisation in C‐RCTs included childcare centres or preschools (n = 12), parent groups (n = 2), preschool classrooms (n = 1), primary schools (n = 1), primary school classrooms (n = 1), and primary care clinics (n = 1). Twenty‐six trials were conducted in a preschool or school setting; 11 in a home setting; five in a health setting (e.g. primary care); two in a laboratory setting; three in a home and laboratory setting; two in a preschool and home setting; and one in a home and health setting. Included studies examined the impact of various types of interventions to increase child fruit and vegetable consumption. Forty‐seven of the included studies assessed intake of vegetables, and 25 assessed intake of fruit. Various objective and subjective measures were used to assess fruit and vegetable intake, such as ad libitum intake and mean daily intake as reported by parents. Information on the reliability and validity of selected fruit and vegetable intake outcome measures were reported by 10 studies. Post‐intervention follow‐up periods ranged from immediate to 3½ years. Of the 50 included studies, 11 did not report whether funding support was received to undertake the trial, one study reported no funding support (Baskale 2011), and the remaining 38 studies reported a source of funding. Funding support for such studies were governmental or charitable, with the exception of two studies that reported receiving funding from food industry sources (Fisher 2012; Tabak 2012).
Thirty trials tested the impact of specific feeding‐practice interventions (e.g. repeated exposure) in increasing children's intake of fruits or vegetables (Anzman‐Frasca 2012; Barends 2013; Blissett 2016; Caton 2013; Cooke 2011; Correia 2014; Cravener 2015; Daniels 2014; De Droog 2014; De Wild 2013; De Wild 2015a; De Wild 2015b; Fildes 2014; Fildes 2015; Fisher 2012; Harnack 2012; Hausner 2012; Hetherington 2015; Keller 2012; Menella 2008; O'Connell 2012; Remington 2012; Remy 2013; Roe 2013; Savage 2012; Spill 2010; Spill 2011a; Spill 2011b; Staiano 2016; Wardle 2003a). Of the trials testing the impact of specific feeding‐practice interventions, 18 compared the effectiveness of two or more interventions and 12 trials compared one or more interventions with a no‐treatment control group; nine of these were cross‐over trials. Thirteen trials examined the effect of repeated exposure compared to alternative interventions, of which five compared the effect of a repeated exposure intervention to one or more alternative interventions (including associative conditioning, flavour‐flavour learning, flavour‐nutrient learning, choice of vegetable versus no choice) (Anzman‐Frasca 2012; Barends 2013; Caton 2013; Hausner 2012; Remy 2013), one compared the effect of repeated exposure choice offering of vegetable to no choice (De Wild 2015a), and one study compared the effect of repeated exposures and variety (Menella 2008). The other five trials examined the effect of a repeated exposure intervention compared to no‐treatment control, of which one trial each examined the effect of repeated exposure alone (O'Connell 2012), taste exposure plus rewards (Fildes 2014), exposure plus social reward and exposure plus tangible reward (Remington 2012), exposure and nutrition information (Wardle 2003a), and exposure plus tangible reward, exposure plus social reward and exposure alone (Cooke 2011). Two trials examined the effect of flavour nutrient learning, of which one trial compared the effects of low‐energy vegetable soup versus high‐energy vegetable soup (De Wild 2013), and the other trial compared incorporation of vegetable puree into meals at three different levels of energy density (Spill 2011a). Four trials examined the effect of parent feeding interventions, one trial compared the effects of advice to the parent about introducing vegetables to no‐treatment control (Fildes 2015), one trial compared the effects of an early feeding intervention targeting complementary feeding practices to a no‐treatment control (Daniels 2014), one trial compared the effects of early and repeated exposure to vegetables during complementary feeding to a no‐treatment control (Hetherington 2015), and the other trial compared parent prompting and modelling, parent prompting alone and modelling alone (Blissett 2016). Four trials examined the effect of pairing fruit and vegetables with positive stimuli; one trial compared pairing vegetables with stimuli such as stickers and cartoon packaging to a no‐treatment control (Cravener 2015), one trial compared pairing fruit and vegetables with character branding to a no‐treatment control (Keller 2012), one trial compared pairing of vegetable with a modelling DVD to a non‐food DVD and a no‐DVD control group (Staiano 2016), and the fourth trial compared the effect of pairing passive and interactive story‐telling (about a character that eats carrots) featuring either a product‐congruent (a rabbit) or product‐incongruent (a turtle) character across four experimental groups compared to a control group (De Droog 2014). Three trials examined the effect of pairing target vegetables with liked foods (Correia 2014; De Wild 2015b; Fisher 2012). Two trials examined the effect of varying serving sizes (Savage 2012; Spill 2011b). The remaining three trials examined the effect of different serving methods; one trial compared serving fruit and vegetables first before other menu items to a specific plate of prepared food (Harnack 2012), one trial compared three different portion sizes of vegetables served at the beginning of a meal to a control meal (Spill 2010), and the third trial of eight arms compared the impact of a single type of vegetable, a variety of vegetables, a single type of fruit, and a variety of fruits on consumption (Roe 2013).
Eleven studies tested the impact of parent nutrition education interventions in increasing children's intake of fruit or vegetables (Black 2011; Campbell 2013; Duncanson 2013; Haire‐Joshu 2008; Martinez‐Andrade 2014; Roset‐Salla 2016; Skouteris 2015; Tabak 2012; Verbestel 2014; Watt 2009; Wyse 2012). Four trials were conducted in a health setting: one trial compared a parenting practices intervention to a maternal diet and physical activity intervention to control (Black 2011), one trial compared a dietitian‐delivered intervention in a first‐time parents' group regarding infant feeding, physical activity and sedentary behaviours to control (Campbell 2013), one trial compared a six‐week parent intervention on obesity awareness and prevention to control (Martinez‐Andrade 2014), and the fourth trial compared a multistrategy parent intervention including health snack exposure to control (Skouteris 2015). Four trials were conducted within a home setting: one trial compared the provision of an interactive nutrition education CD and parenting DVD to parents to wait‐list control (Duncanson 2013), one trial compared a parent intervention inclusive of a tailored newsletter, home visits and materials to usual care (Haire‐Joshu 2008), one trial compared a dietitian‐delivered parent intervention on vegetable availability, picky eating, modelling and family meals to control (Tabak 2012); and the fourth compared a parent intervention on infant‐feeding practices to usual care (Watt 2009). Three trials were conducted in a preschool setting; one trial compared a parent education intervention on dietary knowledge and changing habits to control (Roset‐Salla 2016), one trial compared a parent intervention including a poster with guidelines and tips, and tailored feedback about child dietary behaviours versus control (Verbestel 2014), and the third trial compared a parent intervention including a resource kit and telephone calls to improve parent knowledge and skills about the home food environment versus control (Wyse 2012).
Eight studies tested the impact of multicomponent interventions (e.g. teacher and parent education, preschool policy changes) in increasing children's intake of fruit or vegetables (De Bock 2012; De Coen 2012; Namenek Brouwer 2013; Natale 2014a; Nicklas 2017; Vereecken 2009; Williams 2014; Witt 2012). Four trials were conducted in a preschool setting; one trial compared an intervention combining familiarisation, preparation and cooking of meals with children, teachers and parents and parent education regarding modelling and nutrition needs of children to control (De Bock 2012); one trial compared a garden‐based intervention and curriculum materials about targeted fruits or vegetables to control (Namenek Brouwer 2013); one trial compared a teacher curriculum, parent curriculum, and preschool policy intervention to control (Natale 2014a); and the fourth trial compared a nutrition education targeting children, parents and preschool staff to control (Williams 2014). Two trials were conducted in a school setting; one trial compared a community, school and parent intervention for nutrition and physical activity health targets to control (De Coen 2012); and the other trial compared a preschool environment, child, parent and teacher intervention to control (Vereecken 2009). One trial, conducted in both a school and a home setting, compared an interactive education intervention about physical activity and healthful eating inclusive of teacher guides and parent newsletters to control (Witt 2012). An additional trial, conducted in both a preschool and a home setting, compared a motivational theatre intervention which included the screening of four DVDs of a puppet show aimed at persuading children to increase vegetable consumption, and provision of resources to parents including ingredients for a vegetable snack, to a no‐intervention control (Nicklas 2017).
One study tested the impact of an intervention involving the delivery of nutrition education to children within nursery classrooms in increasing child fruit and vegetable intake (Baskale 2011).
Excluded studies
Following an assessment of study titles and abstracts, the full texts of 414 articles in the update were sought for further review for study eligibility (558 in total, when combined with 144 from the original review) (Figure 1). The full texts of 413 articles were able to be located (535 in total, when combined with 122 from the original review). We considered 329 studies to be ineligible for the review update following the trial screening process (reasons for exclusion included participants n = 127; outcomes n = 121; comparator n = 19; intervention n = 15; study design n = 47). See Characteristics of excluded studies for further details.
Studies awaiting classification
We could not determine the eligibility of one trial, as no full text was available. See Characteristics of studies awaiting classification.
Ongoing studies
We identified five ongoing trials with a published protocol (Characteristics of ongoing studies), for which neither published nor unpublished data were available. These include a C‐RCT (Belanger 2016) testing the effect of a multicomponent intervention involving community partnerships and healthy eating training for staff in early childcare centres compared to a no‐intervention control; a RCT (Horodynski 2011) testing the effect of a child‐feeding intervention focused on maternal self‐efficacy during feeding and appropriate feeding styles compared to usual care; a C‐RCT (Østbye 2015) testing the effect of a multicomponent home and childcare intervention compared to a no‐intervention control; a RCT (Sobko 2016) testing the effect of a multicomponent healthy lifestyle programme delivered to parent‐child dyads compared to a wait list or a no‐intervention control; and a RCT(Watt 2014) testing the effect of a multicomponent intervention involving parents and childcare staff compared to a no‐intervention control.
Risk of bias in included studies
None of the 50 included studies were at low risk in all risk‐of‐bias domains (Figure 2; Figure 3).
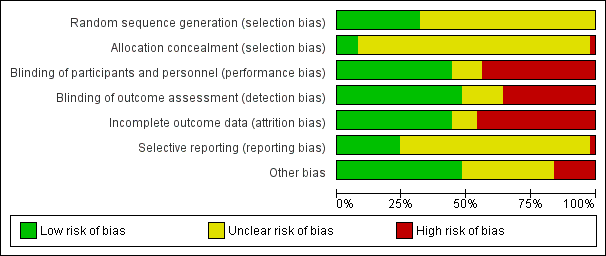
Risk of bias graph: review authors' judgements about each risk of bias item presented as percentages across all included studies.

Risk of bias summary: review authors' judgements about each risk of bias item for each included study.
Random sequence generation
We rated 16 of the 50 studies at low risk of bias for random sequence generation, with all random‐number sequences created using various computer‐based software (Campbell 2013; Cooke 2011; Cravener 2015; Daniels 2014; Duncanson 2013; Fildes 2015; Haire‐Joshu 2008; Martinez‐Andrade 2014; Namenek Brouwer 2013; Roe 2013; Skouteris 2015; Spill 2011a; Staiano 2016; Vereecken 2009; Watt 2009; Wyse 2012). The method of sequence generation in the remaining 34 studies was unclear (Anzman‐Frasca 2012; Barends 2013; Baskale 2011; Black 2011; Blissett 2016; Caton 2013; Correia 2014; De Bock 2012; De Coen 2012; De Droog 2014; De Wild 2013; De Wild 2015a; De Wild 2015b; Fildes 2014; Fisher 2012; Harnack 2012; Hausner 2012; Hetherington 2015; Keller 2012; Menella 2008; Natale 2014a; Nicklas 2017; O'Connell 2012; Remington 2012; Remy 2013; Roset‐Salla 2016; Savage 2012; Spill 2010; Spill 2011b; Tabak 2012; Verbestel 2014; Wardle 2003a; Williams 2014; Witt 2012).
Allocation
Only four of the 50 studies reported that participant allocation to the experimental group was concealed from those conducting the research (De Bock 2012; Duncanson 2013; Wardle 2003a; Watt 2009). We judged one study to have a high risk of selection bias (Haire‐Joshu 2008), as educators were aware of site allocation when they were enrolling participants to the trial. The remaining 45 studies had an unclear risk of selection bias (Anzman‐Frasca 2012; Barends 2013; Baskale 2011; Black 2011; Blissett 2016; Campbell 2013; Caton 2013; Cooke 2011; Correia 2014; Cravener 2015; Daniels 2014; De Coen 2012; De Droog 2014; De Wild 2013; De Wild 2015a; De Wild 2015b; Fildes 2014; Fildes 2015; Fisher 2012; Harnack 2012; Hausner 2012; Hetherington 2015Keller 2012; Martinez‐Andrade 2014; Menella 2008; Namenek Brouwer 2013; Natale 2014a; Nicklas 2017; O'Connell 2012; Remington 2012; Remy 2013; Roe 2013; Roset‐Salla 2016; Savage 2012; Skouteris 2015; Spill 2010; Spill 2011a; Spill 2011b; Staiano 2016; Tabak 2012; Verbestel 2014; Vereecken 2009; Williams 2014; Witt 2012; Wyse 2012).
Blinding
Performance bias
In 22 of the studies, we judged the potential for trial outcomes to be influenced by participants or personnel delivering the intervention to be high, due to the lack of blinding and the method used for outcome assessment (e.g. self‐report) (Anzman‐Frasca 2012; Barends 2013; Baskale 2011; Black 2011; Campbell 2013; Daniels 2014; De Bock 2012; De Coen 2012; Fildes 2014; Fildes 2015; Haire‐Joshu 2008; Hetherington 2015; Martinez‐Andrade 2014; Natale 2014a; Roset‐Salla 2016; Skouteris 2015; Tabak 2012; Verbestel 2014; Vereecken 2009; Watt 2009; Williams 2014; Wyse 2012).We rated 22 studies at low risk of performance bias, due to blinding or the use of objective outcome assessments which were unlikely to be influenced by awareness of group allocation (e.g. weighing food on electronic scales) (Blissett 2016; Caton 2013; Cooke 2011; Correia 2014; Cravener 2015; De Droog 2014; De Wild 2013; De Wild 2015a; De Wild 2015b; Duncanson 2013; Fisher 2012; Hausner 2012; Keller 2012; Namenek Brouwer 2013; O'Connell 2012; Remy 2013; Roe 2013; Savage 2012; Spill 2011a; Spill 2011b; Wardle 2003a; Witt 2012). For the six remaining studies the risk of performance bias was unclear (Harnack 2012; Menella 2008; Nicklas 2017; Remington 2012; Spill 2010; Staiano 2016).
Detection bias
We rated 18 studies at high risk of detection bias, due to participants or assessors not being blind to group allocation and the use of self‐report measures (Baskale 2011; Black 2011; Campbell 2013; Daniels 2014; De Bock 2012; De Coen 2012; Fildes 2014; Martinez‐Andrade 2014; Namenek Brouwer 2013; Natale 2014a; Roset‐Salla 2016; Skouteris 2015; Spill 2010; Tabak 2012; Verbestel 2014; Vereecken 2009; Williams 2014; Wyse 2012). Blinding of assessors, or the objective measurement of child fruit and vegetable intake which is unlikely to be impacted by lack of blinding (e.g. the food was weighed or counted), meant that 24 studies had a low risk of detection bias (Anzman‐Frasca 2012; Blissett 2016; Caton 2013; Cooke 2011; Correia 2014; De Droog 2014; De Wild 2013; De Wild 2015a; De Wild 2015b; Duncanson 2013; Fisher 2012; Haire‐Joshu 2008; Hausner 2012; Keller 2012; Menella 2008; Nicklas 2017; O'Connell 2012; Remy 2013; Savage 2012; Spill 2011a; Spill 2011b; Wardle 2003a; Watt 2009; Witt 2012). The remaining eight studies had an unclear risk of detection bias (Barends 2013; Cravener 2015; Fildes 2015; Harnack 2012; Hetherington 2015; Remington 2012; Roe 2013; Staiano 2016).
Incomplete outcome data
Seven studies reported no attrition, and therefore had a very low risk of bias (Anzman‐Frasca 2012; Cravener 2015; Nicklas 2017; O'Connell 2012; Savage 2012; Spill 2010; Staiano 2016). A further 15 studies reported a low loss of participants (usually less than 10%) and similar losses across arms for cohort studies, or otherwise used a cross‐sectional, pre‐post design and were also considered to be at low risk (Barends 2013; Cooke 2011; De Wild 2015a; Fildes 2015; Fisher 2012; Haire‐Joshu 2008; Hausner 2012; Hetherington 2015; Namenek Brouwer 2013; Roe 2013; Skouteris 2015; Spill 2011b; Tabak 2012; Wardle 2003a; Wyse 2012). Twenty‐three studies had a high risk of bias due to high attrition rates, unequal attrition across experimental arms, or an intention‐to‐treat analysis not being used (Baskale 2011; Blissett 2016; Caton 2013; Correia 2014; Daniels 2014; De Bock 2012; De Coen 2012; De Wild 2013; De Wild 2015b; Duncanson 2013; Fildes 2014; Hausner 2012; Keller 2012; Martinez‐Andrade 2014; Menella 2008; Natale 2014a; Remy 2013; Roset‐Salla 2016; Spill 2011a; Verbestel 2014; Watt 2009; Williams 2014; Witt 2012). Five studies had an unclear risk of attrition bias (Black 2011; Campbell 2013; De Droog 2014; Remington 2012; Vereecken 2009).
Selective reporting
Most studies had an unclear risk of selective reporting (Anzman‐Frasca 2012; Barends 2013; Baskale 2011; Black 2011; Blissett 2016; Caton 2013; Cooke 2011; Correia 2014; Cravener 2015; De Bock 2012; De Coen 2012; De Droog 2014; De Wild 2015a; De Wild 2015b; Fildes 2014; Fildes 2015; Fisher 2012; Haire‐Joshu 2008; Harnack 2012; Hausner 2012; Hetherington 2015; Keller 2012; Menella 2008; Natale 2014a; O'Connell 2012; Remington 2012; Roset‐Salla 2016; Savage 2012; Skouteris 2015; Spill 2010; Spill 2011b; Staiano 2016; Tabak 2012; Verbestel 2014; Vereecken 2009; Wardle 2003a; Williams 2014; Witt 2012). We judged one trial (Campbell 2013) to be at high risk of bias due to outcomes referred to in the protocol not being reported. The remaining 11 studies reported all expected outcomes (Daniels 2014; De Wild 2013; Duncanson 2013; Martinez‐Andrade 2014; Namenek Brouwer 2013; Nicklas 2017; Remy 2013; Roe 2013; Spill 2011a; Watt 2009; Wyse 2012).
Other potential sources of bias
Of the 23 RCTs, ten had a low risk of bias (Anzman‐Frasca 2012; Barends 2013; Caton 2013; Cravener 2015; De Droog 2014; Fildes 2015; Savage 2012; Skouteris 2015; Wardle 2003a; Watt 2009), eight had an unclear risk of bias (Black 2011; Blissett 2016; Hetherington 2015; Keller 2012; Remington 2012; Remy 2013; Staiano 2016; Tabak 2012) and five had a high risk of bias (Daniels 2014; De Wild 2015a; Duncanson 2013; Fildes 2014; Menella 2008) for other potential sources of bias. One trial did not account for clustering in the analysis, even though the trial protocol said clustering would be accounted for (Daniels 2014). Four trials had a high risk of bias, as they reported baseline imbalances between study groups that were not accounted for in the analysis (De Wild 2015a; Duncanson 2013; Fildes 2014; Menella 2008). Of the 18 C‐RCTs, six had a low risk of bias (Baskale 2011; Campbell 2013; Cooke 2011; Haire‐Joshu 2008; Vereecken 2009; Wyse 2012), 10 had unclear risk of bias (De Bock 2012; Fisher 2012; Hausner 2012; Martinez‐Andrade 2014; Namenek Brouwer 2013; Natale 2014a; Nicklas 2017; Roset‐Salla 2016; Williams 2014; Witt 2012) and two had high risk of bias (De Coen 2012; Verbestel 2014). Both the latter had high risk of bias due to recruitment bias as communities were randomised first before schools, childcare centres and participants were invited to participate (De Coen 2012; Verbestel 2014). Of the nine cross‐over trials, eight had a low risk of bias (Correia 2014; De Wild 2013; De Wild 2015b; Harnack 2012; Roe 2013; Spill 2010; Spill 2011a; Spill 2011b), and one study had high risk of bias (O'Connell 2012), due to differences in baseline vegetable consumption that were not adjusted for in the analysis.
Effects of interventions
See: Summary of findings for the main comparison Child feeding interventions compared to no intervention for children aged five years and under; Summary of findings 2 Parent nutrition education interventions compared to no intervention for children aged five years and under; Summary of findings 3 Multicomponent interventions compared to no intervention for children aged five years and under; Summary of findings 4 Child nutrition education interventions compared to no intervention for children aged five years and under
Primary outcome: Effectiveness of interventions in increasing the consumption of fruit and/or vegetables
All the included trials reported the impact of the effectiveness of the intervention on a measure of children's fruit or vegetable intake. Variability in the measurement and reporting of intervention effects as change from baseline or final value scores precluded statistical examination of heterogeneity. Nonetheless, examination of the interventions tested, trial settings and study populations suggested that the included trials were heterogeneous and we conducted meta‐analyses pooling data from trials where we considered interventions to be similar. Otherwise, we have provided a narrative synthesis of trial findings.
Child feeding practice interventions
Short‐term impact (less than 12 months)
The effects of interventions targeting child‐feeding practices were mixed. Meta‐analysis pooling post‐intervention data (follow‐up period range: immediate to six months) from trials comparing child‐feeding practices to no treatment (Cooke 2011; Cravener 2015; Daniels 2014; Fildes 2014; Fildes 2015; Hetherington 2015; Keller 2012; O'Connell 2012; Remington 2012; Staiano 2016; Wardle 2003a) revealed an overall positive intervention effect on vegetable consumption (SMD 0.38, 95% CI 0.15 to 0.61; n = 1509; 11 studies; I2 = 73%; very low‐quality evidence; Analysis 1.1), which was equivalent to a mean difference of 4.03 grams of vegetables. Results were similar in sensitivity analyses of studies at low risk of bias (SMD 0.23, 95% CI 0.03 to 0.44; n = 487; 5 studies; I2 = 14%; Analysis 1.2), of studies with a primary aim of child fruit or vegetable consumption (SMD 0.47, 95% CI 0.19 to 0.76; n = 1228; 9 studies; I2 = 76%; Analysis 1.3.), and of studies with no or low attrition and studies with high attrition that undertook intention‐to‐treat analyses (SMD 0.29, 95% CI 0.10 to 0.48; n = 757; 8 studies; I2 = 27%; Analysis 1.4).
One study that compared one or more child‐feeding practice interventions to a no‐treatment control did not report sufficient data to enable pooling. Harnack 2012 reported a significant increase in intake of fruit compared to a control group for an intervention where fruit and vegetables were served prior to a meal.
Eighteen trials compared the effectiveness of two or more child‐feeding interventions that could not be synthesised in meta‐analyses due to variability in the compared interventions (Anzman‐Frasca 2012; Barends 2013; Blissett 2016; Caton 2013; Correia 2014; De Droog 2014; De Wild 2013; De Wild 2015a; De Wild 2015b; Fisher 2012; Hausner 2012; Menella 2008; Remy 2013; Roe 2013; Savage 2012; Spill 2010; Spill 2011a; Spill 2011b).The interventions compared in these trials varied greatly; six of the 18 trials reported evidence of an increase in fruit or vegetable consumption for one intervention compared to another (De Droog 2014; De Wild 2013; Roe 2013; Spill 2010; Spill 2011a; Spill 2011b).
Long‐term impact (12 months or longer)
One study testing the effect of a child‐feeding practice intervention reported a long‐term effect 3½ years after a complementary feeding intervention compared to usual care. There was no long‐term effect of the intervention on either fruit or vegetable intake as measured by 24‐hour recall (Daniels 2014).
Parent nutrition education interventions
Short‐term impact (less than 12 months)
Interventions targeting parent nutrition education were generally not effective. Meta‐analysis pooling post‐intervention data (follow‐up period range: immediate to six months) from trials comparing parent nutrition education interventions to no treatment (Campbell 2013; Duncanson 2013; Haire‐Joshu 2008; Martinez‐Andrade 2014; Roset‐Salla 2016; Skouteris 2015; Tabak 2012; Verbestel 2014; Watt 2009; Wyse 2012) revealed no overall effect on child consumption of fruit and vegetables (SMD 0.11, 95% CI ‐0.05 to 0.28; n = 3023; 10 studies; I2 = 72%; very low‐quality evidence; Analysis 2.1). Results were similar in sensitivity analyses of studies with a primary aim of children's fruit or vegetable consumption (SMD 0.03, 95% CI ‐0.10 to 0.15; n = 2737; 7 studies; I2 = 52%; Analysis 2.2), and of studies with no or low attrition and studies with high attrition that undertook intention‐to‐treat analyses (SMD 0.11, 95% CI ‐0.02 to 0.24; n = 2463; 6 studies; I2 = 48%; Analysis 2.3). We did not conduct sensitivity analyses by risk of bias, as we judged all studies to be at high risk of bias in at least one domain.
One trial could not be pooled in the meta‐analysis. Black 2011 found an intervention targeting parent responsivity and behaviour management to be effective in increasing total fruit intake compared to control.
Long‐term impact (12 months or longer)
Four studies reported the long‐term impact of a parent nutrition education intervention (Duncanson 2013; Skouteris 2015; Watt 2009; Wyse 2012). Of these, only one trial reported a significant long‐term effect on children's fruit and vegetable consumption (Watt 2009). The trial examining the impact of a parent intervention targeting infant‐feeding practice found a short‐term effect at nine months and long‐term effect at 15‐month follow‐up on fruit and vegetable consumption compared to usual care (Watt 2009). The other three trials reporting long‐term impacts of parent interventions either reported a short‐term effect that was not sustained at long‐term follow‐up (Skouteris 2015; Wyse 2012), or no effect at either short‐ or long‐term follow‐up on children's fruit or vegetable consumption (Duncanson 2013).
Multicomponent interventions
Short‐term impact (less than 12 months)
The effects of multicomponent interventions were mixed. Meta‐analysis pooling post‐intervention data (follow‐up period range: immediate to one month) from multicomponent intervention trials (De Coen 2012; Namenek Brouwer 2013; Nicklas 2017; Williams 2014) revealed no overall effect on child consumption of fruit and vegetables (SMD 0.28, 95% CI ‐0.06 to 0.63; n = 1861; 4 studies; I2 = 79%; very low‐quality evidence; Analysis 3.1). Results were similar in sensitivity analyses of three studies with a primary aim of children's fruit or vegetable consumption (SMD 0.38, 95% CI ‐0.20 to 0.95; n = 1167; 3 studies; I2 = 86%; Analysis 3.2). There was, however, a positive overall effect on child consumption of fruit and vegetables sensitivity analysis of studies with no or low attrition or high attrition that undertook intention‐to‐treat analyses (SMD 0.70, 95% CI 0.39 to 1.01; n = 265; 2 studies; I2 = 0%; Analysis 3.3). We did not conduct a sensitivity analysis to examine the impact of high risk of bias, as all but one study had a high risk of bias in at least one domain.
Four studies could not be pooled in meta‐analysis, due to insufficient data (De Bock 2012; Natale 2014a; Vereecken 2009; Witt 2012). Three trials (De Bock 2012; Natale 2014a; Witt 2012) reported significant effects of the interventions tested on both fruit and vegetable consumption, and one trial reported significant effects of the intervention on fruit but not vegetable consumption (Vereecken 2009).
Long‐term impact (12 months or longer)
No trials testing the multicomponent interventions reported long‐term impact.
Child nutrition education interventions
Short‐term impact (less than 12 months)
The one study that tested the effect of a nutrition education intervention targeting children (Baskale 2011) reported an increase in some of the fruits and vegetables assessed in the intervention group and no significant differences in the control group, but did not report analyses comparing treatment groups (low‐quality evidence).
Long‐term impact (12 months or longer)
The one study that tested the effect of a nutrition education intervention did not report long‐term impact.
Subgroup analyses
Interventions targeting boys and girls
All the included studies in this review covered both boys and girls. The impact of intervention on gender subgroups was not reported in any of the included trials, so subgroup analyses on this basis was not possible.
Interventions targeting minority groups and indigenous populations
Subgroup analyses of trials that targeted minority groups and indigenous populations was not possible, due to the limited number of included studies for each comparison; we therefore present them narratively. Six of the 50 included trials examined the impact of interventions on predominantly disadvantaged populations (Black 2011; Cooke 2011; Haire‐Joshu 2008; Natale 2014a; Nicklas 2017; Watt 2009). One trial recruited participants through schools where the proportion of children who had English as a second language, came from minority ethnic backgrounds or were eligible for free school meals was above average (Cooke 2011). The study demonstrated that repeated food exposure coupled with reward significantly increased the consumption of a target vegetable. Three trials of parent interventions recruited participants from disadvantaged communities including underserved families, single or minority parent homes, those living in poverty or low‐income families (Black 2011; Haire‐Joshu 2008; Watt 2009). Two trials found no improvement in overall child fruit or vegetable intake based on the primary trial outcome measures (Haire‐Joshu 2008; Watt 2009); the other trial found the intervention targeting parent responsivity and behaviour management to be effective in increasing total fruit intake (Black 2011). Two trials of multicomponent interventions recruited participants from subsidised childcare centres (Natale 2014a; Nicklas 2017). One found an intervention targeting teachers, parents and childcare policies to increase both fruit and vegetable consumption (Natale 2014a) and the other found a theatre performance intervention involving both parents and teachers increased vegetable consumption (Nicklas 2017).
Interventions delivered in various settings
Subgroup analyses of child‐feeding practice interventions by setting revealed an overall positive effect on children's vegetable consumption for those interventions delivered in home settings (SMD 0.56, 95% CI 0.18 to 0.95; n = 474; 4 studies) and in both home and laboratory settings (SMD 0.74, 95% CI 0.09 to 1.39; n = 40; 2 studies), but no overall effect for those interventions delivered in school or preschool settings (SMD 0.18, 95% CI ‐0.12 to 0.47; n = 341; 3 studies). Subgroup analyses for other settings (including one set in child health clinics, and one in home or health facilities) was not possible due to the limited number of studies for each setting.
Similar to the main analysis, subgroup analyses of parent nutrition education interventions by setting revealed no overall effect for those interventions delivered in a home setting (SMD 0.06, 95% CI ‐0.16 to 0.27; n = 2047; 5 studies) or a preschool setting (SMD 0.43, 95% CI ‐0.27 to 1.13; n = 243; 2 studies). Subgroup analyses for other settings (one each in parenting groups, primary care clinics or community health centres) was not possible, due to the limited number of studies for each setting.
Similar to the main analysis, subgroup analyses of multicomponent interventions by setting revealed no overall effect for those interventions delivered in school or preschool settings (SMD 0.07, 95% CI ‐0.07 to 0.20; n = 1608; 3 studies). Subgroup analyses for interventions delivered in either a preschool or a home setting were not possible, due to the limited number of studies for each setting.
Interventions of varying intensities
We did not conduct subgroup analyses of trials based on interventions of varying intensities, due to the limited information across included studies about the number and duration of intervention contacts or components.
Interventions delivered in different modalities
Thirty‐eight of the 50 trials used face‐to‐face intervention delivery only (Anzman‐Frasca 2012; Barends 2013; Baskale 2011; Black 2011; Blissett 2016; Caton 2013; Cooke 2011; Correia 2014; Cravener 2015; Daniels 2014; De Bock 2012; De Droog 2014; De Wild 2013; De Wild 2015a; De Wild 2015b; Fildes 2014; Fisher 2012; Harnack 2012; Hausner 2012; Hetherington 2015; Keller 2012; Martinez‐Andrade 2014; Menella 2008; Namenek Brouwer 2013; O'Connell 2012; Remington 2012; Remy 2013; Roe 2013; Roset‐Salla 2016; Savage 2012; Skouteris 2015; Spill 2010; Spill 2011a; Spill 2011b; Verbestel 2014; Wardle 2003a; Watt 2009; Witt 2012), reporting mixed findings. Similar to the overall analyses, subgroup analysis of face‐to‐face‐delivered child‐feeding practice interventions versus control revealed an overall positive intervention effect on vegetable consumption (SMD 0.38, 95% CI 0.10 to 0.65; n = 1328; 9 studies; Analysis 1.5). Face‐to‐face‐delivered parent nutrition education interventions versus control revealed no overall intervention effect on children's fruit and vegetable consumption (SMD 0.12, 95% CI ‐0.20 to 0.45; n = 826; 5 studies; Analysis 2.4). Face‐to‐face intervention delivery was used in only one multicomponent intervention (Namenek Brouwer 2013) and the only child nutrition education intervention (Baskale 2011), for which mixed results were reported.
Subgroup analyses for other modalities was not possible due to the limited number of included studies for each comparison. Eight trials used face‐to‐face in combination with other strategies: computer‐tailored newsletters and storybooks (Haire‐Joshu 2008); school‐based education, training, policy and environment change (Vereecken 2009); visual and written materials (Campbell 2013); educational materials, resources (posters, brochures) and letters (De Coen 2012); a leaflet (Fildes 2015); newsletters and menu modification (Natale 2014a); printed materials and resources (Williams 2014); and DVD (Nicklas 2017). Two trials used audio/visual only: DVDs (Staiano 2016) and DVD and CD (Duncanson 2013). The remaining two trials used telephone and mail (Tabak 2012; Wyse 2012). Trials which incorporated other intervention modalities reported mixed findings.
Secondary outcome I: Cost or cost effectiveness of interventions to increase the consumption of fruit or vegetables or both
Information about intervention costs was reported in one trial (Campbell 2013; very low‐quality evidence). The parent nutrition education trial reported the total estimated cost of delivering a parent intervention for infant feeding, physical activity and sedentary behaviours delivered by a dietitian as approximately AUD 500 per family.
Secondary outcome II: Adverse effects of interventions to increase the consumption of fruit or vegetables or both
Two trials reported information on any adverse events or unintended adverse consequences of the intervention. One child‐feeding intervention trial (Spill 2011a; very low‐quality evidence) reported no adverse effects on the amount of the meal consumed following implementation of an intervention involving incorporation of vegetable puree into meals at three different levels of energy density. The other trial, on parent nutrition education, (Wyse 2012; very low‐quality evidence) reported no adverse effect on family food expenditure following implementation of a multicomponent intervention delivered over the telephone to improve parental knowledge and skills about the home food environment.
Discussion
Summary of main results
In line with the importance of encouraging fruit and vegetable consumption among children in early childhood, this updated review has identified many new RCTs of interventions investigating this health behaviour. The findings suggest that some types of interventions targeting fruit and vegetable consumption by children aged five and younger are effective. Most of the included studies examined specific child‐feeding practices; whilst meta‐analysis of 11 of the 30 trials suggested these interventions were effective, collectively the findings for these interventions were equivocal. The second and third most common interventions were parent nutrition education and multicomponent interventions, for which we found no evidence of effect in the short term in meta‐analyses. Only one trial assessed the effect of a child nutrition education intervention. Subgroup analyses on the basis of setting and modality were generally consistent with main analyses for child‐feeding practices, parent nutrition education and multicomponent interventions. Insufficient evidence was available to determine the long‐term effectiveness of all approaches, or the cost effectiveness or any adverse consequences of the interventions tested.
Overall completeness and applicability of evidence
The review update identified many newly published RCTs, in line with efforts globally to increase fruit and vegetable intake (World Health Organization 2003). Such studies predominantly focused on fruit and vegetable consumption determinants such as nutrition knowledge and skills, and food environments. Only one of the included trials in this review reported cost analyses and only two reported any unintended adverse effects. These factors are important considerations for health practitioners and policy makers but are often not reported in randomised trials (Waters 2011) or examined in systematic reviews (Hopewell 2008; Wolfenden 2010b).
Furthermore, the limited number of relevant trials identified for inclusion also prevented thorough examination of the impact of the interventions by gender, indigenous or disadvantaged populations, setting, varying intensity and modality. We found a number of trial protocols (see Characteristics of ongoing studies) which may address some of these gaps in the literature, and are likely to be eligible for inclusion in future updates of the review, including a randomised controlled trial of an eight‐lesson in‐home intervention in economically and educationally disadvantaged parents of children aged one to three years (Horodynski 2011).
The external validity of the review findings are limited. Most of the trials were conducted in the USA, Western Europe or the United Kingdom. Study attrition varied between studies, ranging from 0% to 68%.
Quality of the evidence
We used the GRADE approach to assess the quality of the evidence for the primary outcome of fruit and vegetable intake, which was conducted separately for each intervention type. See summary of findings Table for the main comparison; summary of findings Table 2; summary of findings Table 3; summary of findings Table 4. The quality of the evidence for fruit and vegetable intake across intervention types varied from very low to low. We rated the quality of evidence for specific infant‐feeding interventions as very low, downgraded for unexplained heterogeneity, methodological limitations and a high probability of publication bias (summary of findings Table for the main comparison). Methodological limitations related to allocation concealment and selective reporting being at unclear or high risk for most of the trials. A high probability of publication bias related to the relatively few trials being included in the meta‐analysis (11 of 30 trials) and inspection of funnels plots (Figure 4). We assessed the quality of evidence for parent nutrition education interventions as very low, downgraded for unexplained heterogeneity, methodological limitations and imprecision (summary of findings Table 2; Figure 5). The methodological limitations related to most of the trials being at high risk of bias for lack of blinding, and at unclear or high risk for allocation concealment, loss to follow‐up, and selective reporting. Imprecision related to the confidence intervals crossing the null value of zero.We rated the quality of evidence for multicomponent interventions as very low due, downgraded for unexplained heterogeneity, methodological limitations and imprecision (summary of findings Table 3; Figure 6). The methodological limitations related to most of the trials being at high risk of bias for lack of blinding, and at unclear or high risk for allocation concealment, loss to follow‐up, and selective reporting. Imprecision related to the confidence intervals crossing the null value of zero. Such assessments suggest that the true effect may be substantially different from the intervention effects reported in the review, with future research very likely to change the estimate for specific infant feeding, parent nutrition education and multicomponent interventions. We rated the quality of the evidence for child nutrition interventions for the single included study as low, downgraded for methodological limitations and imprecision (summary of findings Table 4). The methodological limitations related to a high risk of bias due to lack of blinding and loss to follow‐up, and imprecision related to a sample size of fewer than 400 participants. Future research is likely to change the estimate for child nutrition interventions.

Funnel plot of comparison: 1 Short‐term impact (< 12 months) of child feeding intervention versus no intervention on child consumption of target fruit or vegetable, outcome: 1.1 Fruit and/or vegetable intake.

Funnel plot of comparison: 3 Short‐term impact (< 12 months) of parent nutrition education intervention versus usual care., outcome: 3.1 Fruit and/or vegetable intake.

Funnel plot of comparison: 4 Short‐term impact (< 12 months) of multicomponent intervention versus usual care, outcome: 4.1 Fruit and/or vegetable intake.
Potential biases in the review process
The review used a comprehensive and rigorous methodology, including a broad search strategy, the screening of trials and extraction of data by two independent review authors, and the appraisal of risks of bias within the included studies. Furthermore, the review did not restrict publications by language. Three aspects of selection bias, however, are worth noting. First, we excluded trials where fruit and vegetable intake was not considered to be a primary trial outcome, to avoid any potential confounding effects of other behavioural interventions (such as physical activity). This restriction may lead to overestimates of intervention effects if in practice they are delivered in the context of other health initiatives. Secondly, the inclusion of trials that did not explicitly state a primary outcome but did assess fruit or vegetable intake in the review may have biased the results. However sensitivity analyses excluding studies that did not state fruit and vegetable intake as a primary outcome suggested this was limited, as results were similar. Thirdly, the review was restricted to RCTs with trials included in the review tending to focus on interventions targeting fruit and vegetable consumption determinants, such as nutrition knowledge and skills, or the food environment of settings. Other trials targeting fruit and vegetable intake that may be less amenable to evaluation using randomised controlled designs, such as those requiring macro‐environmental changes, may have been overlooked.
Agreements and disagreements with other studies or reviews
The equivocal findings of the infant‐feeding interventions, such as repeated food exposure, are similar in part to previous reviews. An early systematic review of healthy eating interventions for children aged under five years (Tedstone 1998), published by the Health Education Authority, concluded that repeated food exposure is effective in enhancing children's willingness to consume novel foods provided tasting was included as a part of the exposure. Enhanced food acceptance following repeated food exposure has also been reported in other reviews and controlled trials (Contento 1995). As Cooke 2011 points out in the Background review of research for their randomised trial, evidence about the use of rewards to encourage children's consumption of targeted foods appears more equivocal. The positive impact of both social and non‐tangible rewards reported in Cooke 2011, were however consistent with previous trials in community settings using tangible non‐food rewards and social rewards targeting the fruit or vegetable intake of school‐aged children (Hendy 1999). The large number of trials comparing alternative and heterogenous infant‐feeding practice interventions are difficult to interpret, given that they did not include a no‐treatment control group, and few reported one intervention to be more effective than another.
The largely null findings of this review for the impact of parent interventions are consistent with those reported in previous reviews of dietary interventions. For example, a comprehensive review of the impact of home‐visiting programmes delivered to parents concluded that there was little evidence to recommend such interventions as means of improving children's diet, given the mixed findings of the reviewed studies (Elkan 2000). Among the trials with a positive intervention effect included in the Elkan 2000 review was a pre‐post study of an intensive intervention provided to low‐income mothers of children aged one to four years (James 1992). In this study, dietician‐trained general practitioners and health visitors provided advice and support as part of a primary‐care home‐visiting intervention lasting up to 20 weeks. Post‐intervention improvements in diet were reported, including the consumption of fruits and vegetables. Similarly, a systematic review that examined the effectiveness of parental interventions on the diets of children aged two to five found mixed results for children’s diets or feeding practices or both (Peters 2012).
The negative findings for multicomponent interventions are consistent with some previous reviews of interventions. A recent meta‐analysis showed no significant differences between multicomponent interventions that promoted fruit and vegetable consumption and control conditions in a primary school setting (Delgado‐Noguera 2011). Another systematic review that focused on the fruit and vegetable intake of children aged five to 12 found that school‐based interventions had only a minimal effect on vegetable consumption, whereas they found a moderate impact on children’s fruit intake (Evans 2012). A recent systematic review that examined interventions aimed at increasing children’s (aged two to 12 years) vegetable intake in home and community settings found that only a minority of interventions that targeted children’s vegetable intake alone were effective in the short term (Hendrie 2017). In contrast, when vegetable intake was addressed as part of a healthy diet or lifestyle intervention, most interventions showed short‐term effectiveness (Hendrie 2017).
In contrast to the findings of this review, a number of other reviews have found multicomponent interventions to be effective. For example, a systematic review of interventions to improve diet, physical activity or to prevent weight gain for children of five years or under, and which included both randomised and non‐randomised designs, identified nine studies of interventions implemented in preschool or childcare settings (Hesketh 2010). Three studies included some assessment of dietary outcome. In the first, Head Start preschools were assigned to either a menu intervention to reduce the fat content of meals provided to children in care; the same menu intervention plus nutrition education; or a third usual‐care control condition (Williams 2004). Both intervention arms of the trial reduced the fat content of foods served to children compared with the preschools in the control condition. The remaining two trials assessed the impact of a healthy eating and physical activity obesity‐prevention programme ‘Hip‐Hop to Health Jr’, implemented in two different populations attending Head Start preschools (Fitzgibbon 2005; Fitzgibbon 2006). In Fitzgibbon 2005, intervention children reported less saturated fat intake at the one‐year follow‐up, but not total fat or dietary fibre. No improvements in dietary intake were reported in the second trial (Fitzgibbon 2006). Similarly, systematic reviews of school‐based fruit and vegetable interventions have frequently concluded that multicomponent initiatives are the most effective in increasing fruit and vegetable consumption in older children, but such effects are only modest and reported to be driven largely by increased fruit intake (Burchett 2003; Ciliska 2000; French 2003; Knai 2006). A systematic review of European school‐based interventions also concluded that multicomponent interventions are effective for improving children’s fruit and vegetable intakes (Van Cauwenberghe 2010).

Study flow diagram.

Risk of bias graph: review authors' judgements about each risk of bias item presented as percentages across all included studies.

Risk of bias summary: review authors' judgements about each risk of bias item for each included study.
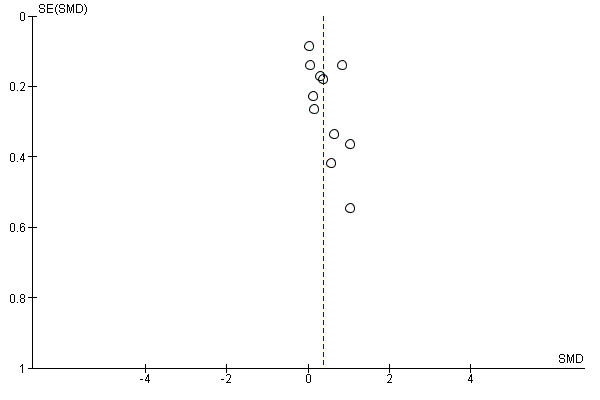
Funnel plot of comparison: 1 Short‐term impact (< 12 months) of child feeding intervention versus no intervention on child consumption of target fruit or vegetable, outcome: 1.1 Fruit and/or vegetable intake.

Funnel plot of comparison: 3 Short‐term impact (< 12 months) of parent nutrition education intervention versus usual care., outcome: 3.1 Fruit and/or vegetable intake.
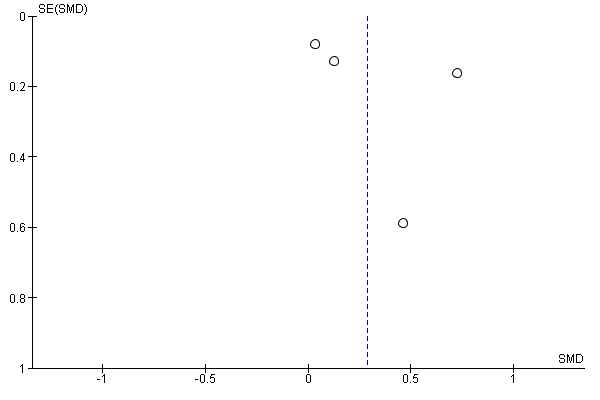
Funnel plot of comparison: 4 Short‐term impact (< 12 months) of multicomponent intervention versus usual care, outcome: 4.1 Fruit and/or vegetable intake.

Comparison 1 Short‐term impact (< 12 months) of child feeding intervention versus no intervention, Outcome 1 Vegetable intake.
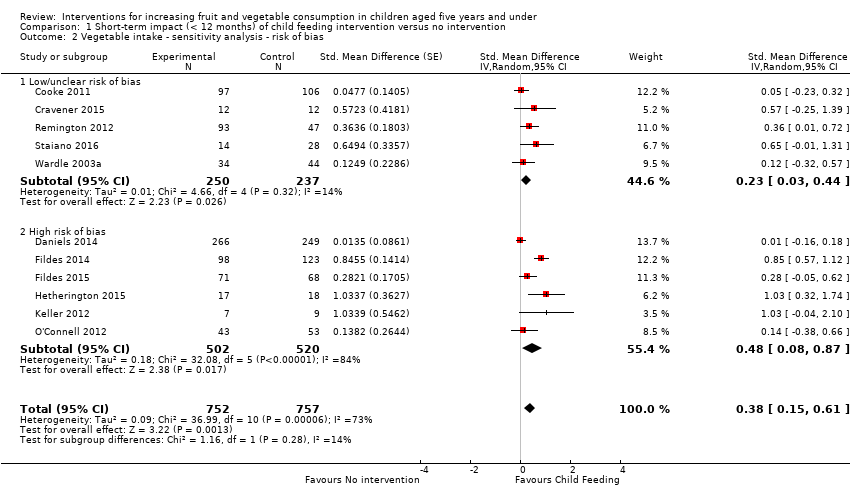
Comparison 1 Short‐term impact (< 12 months) of child feeding intervention versus no intervention, Outcome 2 Vegetable intake ‐ sensitivity analysis ‐ risk of bias.
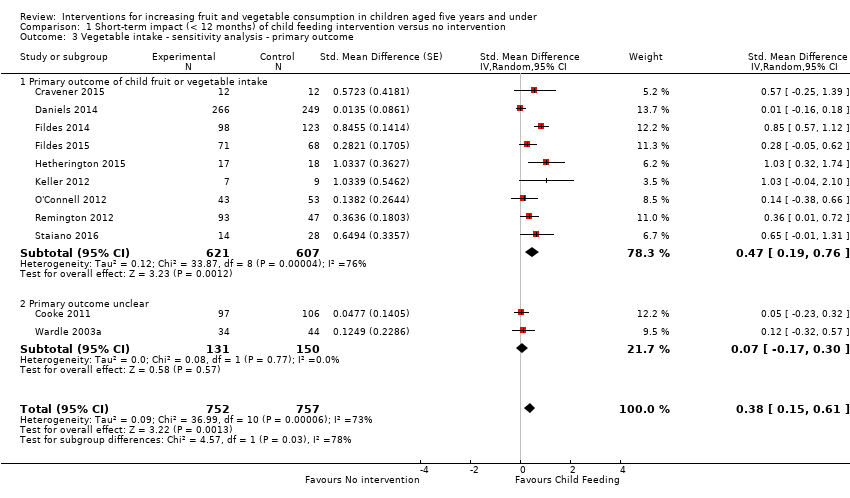
Comparison 1 Short‐term impact (< 12 months) of child feeding intervention versus no intervention, Outcome 3 Vegetable intake ‐ sensitivity analysis ‐ primary outcome.

Comparison 1 Short‐term impact (< 12 months) of child feeding intervention versus no intervention, Outcome 4 Vegetable intake ‐ sensitivity analysis ‐ missing data.
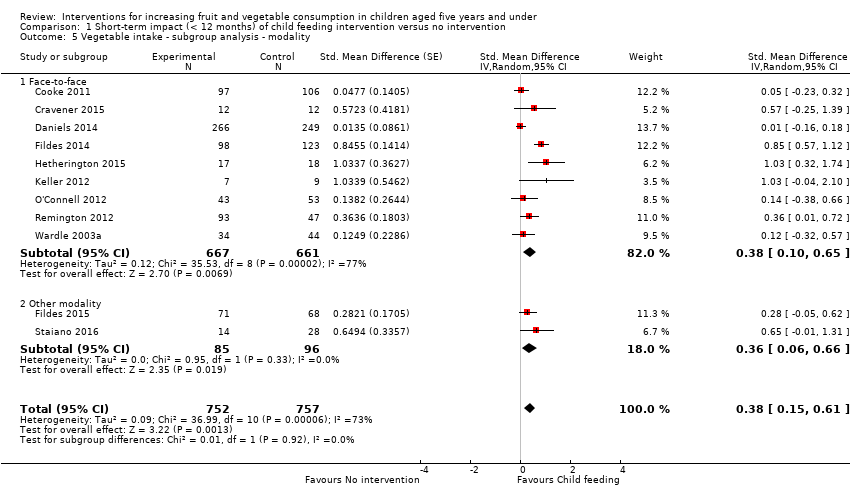
Comparison 1 Short‐term impact (< 12 months) of child feeding intervention versus no intervention, Outcome 5 Vegetable intake ‐ subgroup analysis ‐ modality.

Comparison 1 Short‐term impact (< 12 months) of child feeding intervention versus no intervention, Outcome 6 Vegetable intake ‐ subgroup analysis ‐ setting.
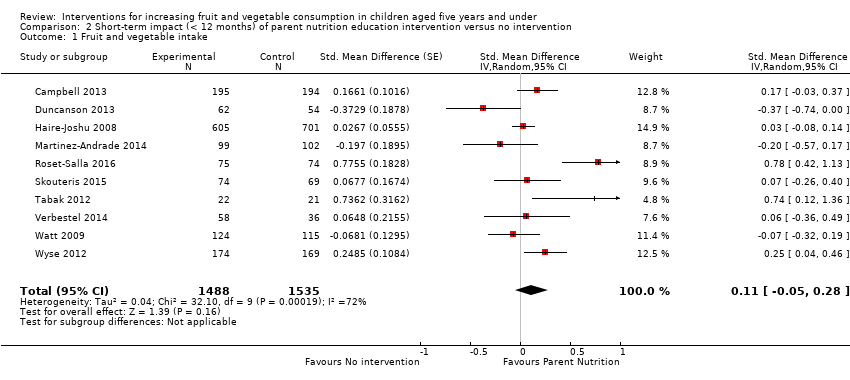
Comparison 2 Short‐term impact (< 12 months) of parent nutrition education intervention versus no intervention, Outcome 1 Fruit and vegetable intake.
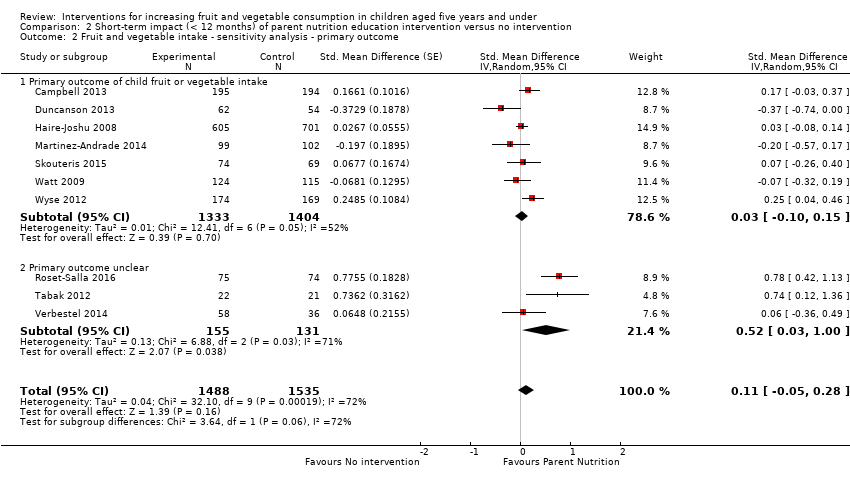
Comparison 2 Short‐term impact (< 12 months) of parent nutrition education intervention versus no intervention, Outcome 2 Fruit and vegetable intake ‐ sensitivity analysis ‐ primary outcome.

Comparison 2 Short‐term impact (< 12 months) of parent nutrition education intervention versus no intervention, Outcome 3 Fruit and vegetable intake ‐ sensitivity analysis ‐ missing data.

Comparison 2 Short‐term impact (< 12 months) of parent nutrition education intervention versus no intervention, Outcome 4 Fruit and vegetable intake ‐ subgroup analysis ‐ modality.

Comparison 2 Short‐term impact (< 12 months) of parent nutrition education intervention versus no intervention, Outcome 5 Fruit and vegetable intake ‐ subgroup analysis ‐ setting.

Comparison 3 Short‐term impact (< 12 months) of multicomponent intervention versus no intervention, Outcome 1 Fruit and vegetable intake.

Comparison 3 Short‐term impact (< 12 months) of multicomponent intervention versus no intervention, Outcome 2 Fruit and vegetable intake ‐ sensitivity analysis ‐ primary outcome.

Comparison 3 Short‐term impact (< 12 months) of multicomponent intervention versus no intervention, Outcome 3 Fruit and vegetable intake ‐ sensitivity analysis ‐ missing data.

Comparison 3 Short‐term impact (< 12 months) of multicomponent intervention versus no intervention, Outcome 4 Fruit and vegetable intake ‐ subgroup analysis ‐ setting.
| Child feeding interventions compared to no intervention for children aged 5 years and under | ||||||
| Patient or population: children aged 5 years and under | ||||||
| Outcomes | Anticipated absolute effects* (95% CI) | Relative effect | № of participants | Quality of the evidence | Comments | |
| Risk with no intervention | Risk with Child feeding interventions | |||||
| Short‐term impact (< 12 months) child vegetable intake | The mean vegetable intake was 7.7 grams1 | The mean vegetable intake (grams) in the intervention group was 4.03 higher (1.59 higher to 6.47 higher) | ‐ | 1509 | ⊕⊝⊝⊝ | Scores estimated using a standardised mean difference of 0.38 (0.15 to 0.61) and a standard deviation of 10.61.1 The mean duration of follow up post‐intervention for studies included in the meta‐analysis was 4.6 weeks. 2 studies that compared 1 or more child‐feeding practice interventions to a no‐treatment control could not be synthesised in meta‐analysis; both reported a significant increase in fruit or vegetables or both |
| Short‐term impact (< 12 months) cost effectiveness ‐ not reported | No child feeding interventions reported this outcome | ‐ | ‐ | ‐ | ‐ | |
| Short‐term impact (< 12 months) unintended adverse events | One trial (Spill 2011a) reported no adverse effects on amount of meal consumed | ‐ | 39 | ⊕⊝⊝⊝ | ‐ | |
| *The risk in the intervention group (and its 95% confidence interval) is based on the assumed risk in the comparison group and the relative effect of the intervention (and its 95% CI) | ||||||
| GRADE Working Group grades of evidence | ||||||
| 1We used the post‐intervention mean and standard deviation of the control group from Wardle 2003a for the risk with no intervention and to re‐express the SMD in terms of grams of intake. | ||||||
| Parent nutrition education interventions compared to no intervention for children aged 5 years and under | ||||||
| Patient or population: children aged 5 years and under | ||||||
| Outcomes | Anticipated absolute effects* (95% CI) | Relative effect | № of participants | Quality of the evidence | Comments | |
| Risk with no intervention | Risk with Parent nutrition education interventions | |||||
| Short‐term impact (< 12 months) child fruit and vegetable intake | The mean serves of vegetables per day was 1.61 | The mean serves of vegetables per day in the intervention group was 0.11 higher (0.05 lower to 0.28 higher) | ‐ | 3023 | ⊕⊝⊝⊝ | Scores estimated using a standardised mean difference of 0.11 (‐0.05 to 0.28) and a standard deviation of 1.01 The mean duration of follow up post‐intervention for studies included in the meta‐analysis was 9.8 weeks. 1 trial could not be pooled in the meta‐analysis; it found an intervention targeting parent responsivity and behaviour management to be effective in increasing total fruit intake compared to control |
| Short‐term impact (< 12 months) cost effectiveness | Information regarding intervention costs was reported in 1 trial (Campbell 2013) | ‐ | 389 | ⊕⊝⊝⊝ | ‐ | |
| Short‐term impact (< 12 months) unintended adverse events | One trial (Wyse 2012) reported no adverse effect on family food expenditure | ‐ | 343 | ⊕⊝⊝⊝ | ||
| *The risk in the intervention group (and its 95% confidence interval) is based on the assumed risk in the comparison group and the relative effect of the intervention (and its 95% CI). | ||||||
| GRADE Working Group grades of evidence | ||||||
| 1We used the post‐intervention mean and standard deviation of the control group from Skouteris 2015 for the risk with no intervention and to re‐express the SMD in terms of serves of vegetables per day. | ||||||
| Multicomponent interventions compared to no intervention for children aged 5 years and under | ||||||
| Patient or population: children aged 5 years and under | ||||||
| Outcomes | Anticipated absolute effects* (95% CI) | Relative effect | № of participants | Quality of the evidence | Comments | |
| Risk with no intervention | Risk with Multicomponent interventions | |||||
| Short‐term impact (< 12 months) child fruit and vegetable intake | The mean cups of vegetables per day was 1.081 | The mean cups of vegetables per day in the intervention group was 0.29 higher (0.06 lower to 0.66 higher) | ‐ | 1861 | ⊕⊝⊝⊝ | Scores estimated using a standardised mean difference of 0.28 (‐0.06 to 0.63) and a standard deviation of 1.051 The mean duration of follow up post‐intervention for studies included in the meta‐analysis was 1.3 weeks. 4 studies could not be pooled in meta‐analysis. 3 reported significant increases in both fruit and vegetable consumption, and 1 significantly increased fruit but not vegetable consumption |
| Short‐term impact (< 12 months) cost effectiveness ‐ not reported | No studies reported this outcome | ‐ | ‐ | ‐ | ‐ | |
| Short‐term impact (< 12 months) unintended adverse events ‐ not reported | No studies reported this outcome | ‐ | ‐ | ‐ | ‐ | |
| *The risk in the intervention group (and its 95% confidence interval) is based on the assumed risk in the comparison group and the relative effect of the intervention (and its 95% CI). | ||||||
| GRADE Working Group grades of evidence | ||||||
| 1We used the post‐intervention mean and standard deviation of the control group from Williams 2014 for the risk with no intervention and to re‐express the SMD in terms of cups vegetables per day. | ||||||
| Child nutrition education interventions compared to no intervention for children aged 5 years and under | ||||||
| Patient or population: children aged 5 years and under | ||||||
| Outcomes | Anticipated absolute effects* (95% CI) | Relative effect | № of participants | Quality of the evidence | Comments | |
| Risk with no intervention | Risk with Child nutrition education interventions | |||||
| Short‐term impact (< 12 months) child fruit and vegetable intake | The mean short‐term impact (< 12 months) child vegetable intake frequency score was 4 (a score of 4 corresponds to consumption of vegetables 3 ‐ 4 times per week) | MD 0 | ‐ | 238 | ⊕⊕⊝⊝ | The only study (Baskale 2011) reported an increase in some of the fruits and vegetables assessed in the intervention group and no significant differences in the control group The duration of follow up post‐intervention was 8 weeks. |
| Cost or cost effectiveness ‐ not reported | No studies reported this outcome | ‐ | ‐ | ‐ | ‐ | |
| Unintended adverse events ‐ not reported | No studies reported this outcome | ‐ | ‐ | ‐ | ‐ | |
| *The risk in the intervention group (and its 95% confidence interval) is based on the assumed risk in the comparison group and the relative effect of the intervention (and its 95% CI). | ||||||
| GRADE Working Group grades of evidence | ||||||
| 1Downgraded one level for risk of bias: high risk of bias due to lack of blinding and loss to follow‐up. | ||||||
| Outcome or subgroup title | No. of studies | No. of participants | Statistical method | Effect size |
| 1 Vegetable intake Show forest plot | 11 | 1509 | Std. Mean Difference (Random, 95% CI) | 0.38 [0.15, 0.61] |
| 2 Vegetable intake ‐ sensitivity analysis ‐ risk of bias Show forest plot | 11 | 1509 | Std. Mean Difference (Random, 95% CI) | 0.38 [0.15, 0.61] |
| 2.1 Low/unclear risk of bias | 5 | 487 | Std. Mean Difference (Random, 95% CI) | 0.23 [0.03, 0.44] |
| 2.2 High risk of bias | 6 | 1022 | Std. Mean Difference (Random, 95% CI) | 0.48 [0.08, 0.87] |
| 3 Vegetable intake ‐ sensitivity analysis ‐ primary outcome Show forest plot | 11 | 1509 | Std. Mean Difference (Random, 95% CI) | 0.38 [0.15, 0.61] |
| 3.1 Primary outcome of child fruit or vegetable intake | 9 | 1228 | Std. Mean Difference (Random, 95% CI) | 0.47 [0.19, 0.76] |
| 3.2 Primary outcome unclear | 2 | 281 | Std. Mean Difference (Random, 95% CI) | 0.07 [‐0.17, 0.30] |
| 4 Vegetable intake ‐ sensitivity analysis ‐ missing data Show forest plot | 11 | 1509 | Std. Mean Difference (Random, 95% CI) | 0.38 [0.15, 0.61] |
| 4.1 Low attrition or high attrition with ITT analysis | 8 | 757 | Std. Mean Difference (Random, 95% CI) | 0.29 [0.10, 0.48] |
| 4.2 High attrition and no ITT analysis | 3 | 752 | Std. Mean Difference (Random, 95% CI) | 0.55 [‐0.16, 1.27] |
| 5 Vegetable intake ‐ subgroup analysis ‐ modality Show forest plot | 11 | 1509 | Std. Mean Difference (Random, 95% CI) | 0.38 [0.15, 0.61] |
| 5.1 Face‐to‐face | 9 | 1328 | Std. Mean Difference (Random, 95% CI) | 0.38 [0.10, 0.65] |
| 5.2 Other modality | 2 | 181 | Std. Mean Difference (Random, 95% CI) | 0.36 [0.06, 0.66] |
| 6 Vegetable intake ‐ subgroup analysis ‐ setting Show forest plot | 11 | 1509 | Std. Mean Difference (Random, 95% CI) | 0.38 [0.15, 0.61] |
| 6.1 School or preschool | 3 | 341 | Std. Mean Difference (Random, 95% CI) | 0.18 [‐0.12, 0.47] |
| 6.2 Home | 4 | 474 | Std. Mean Difference (Random, 95% CI) | 0.56 [0.18, 0.95] |
| 6.3 Home + Lab | 2 | 40 | Std. Mean Difference (Random, 95% CI) | 0.74 [0.09, 1.39] |
| 6.4 Other settings | 2 | 654 | Std. Mean Difference (Random, 95% CI) | 0.11 [‐0.14, 0.36] |
| Outcome or subgroup title | No. of studies | No. of participants | Statistical method | Effect size |
| 1 Fruit and vegetable intake Show forest plot | 10 | 3023 | Std. Mean Difference (Random, 95% CI) | 0.11 [‐0.05, 0.28] |
| 2 Fruit and vegetable intake ‐ sensitivity analysis ‐ primary outcome Show forest plot | 10 | 3023 | Std. Mean Difference (Random, 95% CI) | 0.11 [‐0.05, 0.28] |
| 2.1 Primary outcome of child fruit or vegetable intake | 7 | 2737 | Std. Mean Difference (Random, 95% CI) | 0.03 [‐0.10, 0.15] |
| 2.2 Primary outcome unclear | 3 | 286 | Std. Mean Difference (Random, 95% CI) | 0.52 [0.03, 1.00] |
| 3 Fruit and vegetable intake ‐ sensitivity analysis ‐ missing data Show forest plot | 10 | 3023 | Std. Mean Difference (Random, 95% CI) | 0.11 [‐0.05, 0.28] |
| 3.1 Low attrition or high attrition with ITT analysis | 6 | 2463 | Std. Mean Difference (Random, 95% CI) | 0.11 [‐0.02, 0.24] |
| 3.2 High attrition and no ITT analysis | 4 | 560 | Std. Mean Difference (Random, 95% CI) | 0.07 [‐0.45, 0.59] |
| 4 Fruit and vegetable intake ‐ subgroup analysis ‐ modality Show forest plot | 10 | 3023 | Std. Mean Difference (Random, 95% CI) | 0.11 [‐0.05, 0.28] |
| 4.1 Face‐to‐face only | 5 | 826 | Std. Mean Difference (Random, 95% CI) | 0.12 [‐0.20, 0.45] |
| 4.2 Audio visual only | 2 | 386 | Std. Mean Difference (Random, 95% CI) | 0.40 [‐0.04, 0.85] |
| 4.3 Other modality | 3 | 1811 | Std. Mean Difference (Random, 95% CI) | ‐0.00 [‐0.22, 0.21] |
| 5 Fruit and vegetable intake ‐ subgroup analysis ‐ setting Show forest plot | 10 | 3023 | Std. Mean Difference (Random, 95% CI) | 0.11 [‐0.05, 0.28] |
| 5.1 Home | 5 | 2047 | Std. Mean Difference (Random, 95% CI) | 0.06 [‐0.16, 0.27] |
| 5.2 Preschool | 2 | 243 | Std. Mean Difference (Random, 95% CI) | 0.43 [‐0.27, 1.13] |
| 5.3 Other settings | 3 | 733 | Std. Mean Difference (Random, 95% CI) | 0.06 [‐0.14, 0.26] |
| Outcome or subgroup title | No. of studies | No. of participants | Statistical method | Effect size |
| 1 Fruit and vegetable intake Show forest plot | 4 | 1861 | Std. Mean Difference (Random, 95% CI) | 0.28 [‐0.06, 0.63] |
| 2 Fruit and vegetable intake ‐ sensitivity analysis ‐ primary outcome Show forest plot | 4 | 1861 | Std. Mean Difference (Random, 95% CI) | 0.28 [‐0.06, 0.63] |
| 2.1 Primary outcome of child fruit or vegetable intake | 3 | 1167 | Std. Mean Difference (Random, 95% CI) | 0.38 [‐0.20, 0.95] |
| 2.2 Primary outcome unclear | 1 | 694 | Std. Mean Difference (Random, 95% CI) | 0.12 [‐0.13, 0.38] |
| 3 Fruit and vegetable intake ‐ sensitivity analysis ‐ missing data Show forest plot | 4 | 1861 | Std. Mean Difference (Random, 95% CI) | 0.28 [‐0.06, 0.63] |
| 3.1 Low attrition or high attrition with ITT analysis | 2 | 265 | Std. Mean Difference (Random, 95% CI) | 0.70 [0.39, 1.01] |
| 3.2 High attrition and no ITT analysis | 2 | 1596 | Std. Mean Difference (Random, 95% CI) | 0.06 [‐0.08, 0.20] |
| 4 Fruit and vegetable intake ‐ subgroup analysis ‐ setting Show forest plot | 4 | 1861 | Std. Mean Difference (Random, 95% CI) | 0.28 [‐0.06, 0.63] |
| 4.1 School or preschool | 3 | 1608 | Std. Mean Difference (Random, 95% CI) | 0.07 [‐0.07, 0.20] |
| 4.2 Other settings | 1 | 253 | Std. Mean Difference (Random, 95% CI) | 0.72 [0.40, 1.04] |