Scolaris Content Display Scolaris Content Display

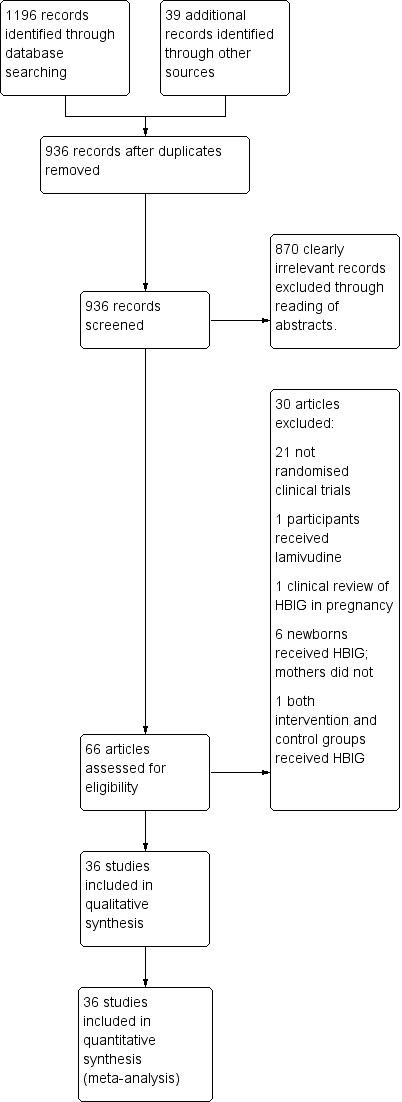
Study flow diagram for searches on hepatitis B Immunoglobulin (HBIG).
Figuras y tablas -
Figure 1

Study flow diagram for searches on hepatitis B Immunoglobulin (HBIG).

Risk of bias graph: review authors' judgements about each risk of bias item presented as percentages across all included studies.
Figuras y tablas -
Figure 2

Risk of bias graph: review authors' judgements about each risk of bias item presented as percentages across all included studies.

Risk of bias summary: review authors' judgements about each risk of bias item for each included study.
Figuras y tablas -
Figure 3

Risk of bias summary: review authors' judgements about each risk of bias item for each included study.

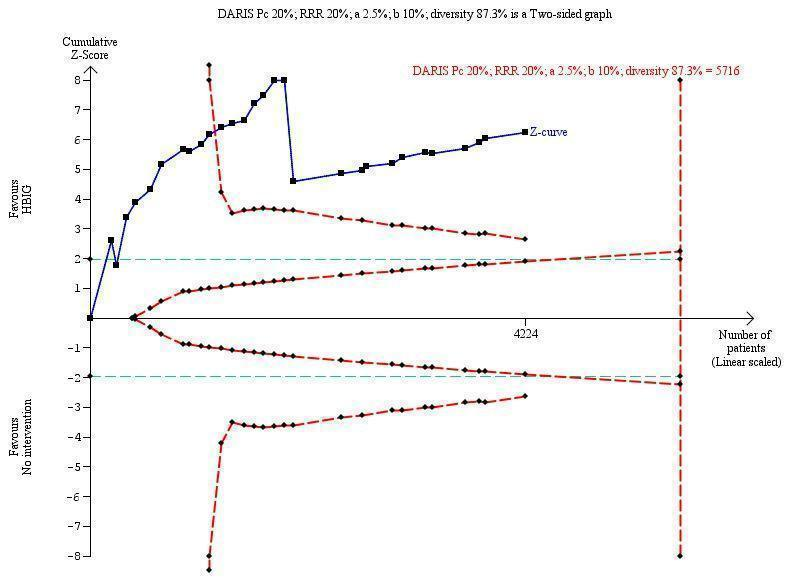
Trial Sequential Analysis (TSA) of the random‐effects meta‐analysis of the effect of hepatitis B immunoglobulin (HBIG) versus no intervention on the number of newborns with HBsAg‐positive results at end of follow‐up. The diversity‐adjusted required information size (DARIS) of 5716 participants was calculated based upon a proportion of 20% of babies tested positive for HBsAg in the control group, a relative risk reduction of a 20% in HBIG group, an alpha (type I error) of 2.5%, a beta (type II error) of 10%, and a diversity (D) of 87.3%. The actually accrued number of participants is 4224, which is 74% of the DARIS. The solid blue curve presents the cumulative meta‐analysis Z‐score and the inward sloping red curves present the adjusted threshold for statistical significance according to the two‐sided Lan‐DeMets trial sequential monitoring boundaries. The blue cumulative Z‐curve crosses the red trial sequential monitoring boundary for benefit during the 11th trial. This implies that there is no risk of random error in the estimate of a beneficial effect of HBIG versus no intervention on the number of newborns with HBsAg‐positive results at end of follow‐up. The TSA‐adjusted confidence interval is 0.20 to 0.52.
Figuras y tablas -
Figure 4

Trial Sequential Analysis (TSA) of the random‐effects meta‐analysis of the effect of hepatitis B immunoglobulin (HBIG) versus no intervention on the number of newborns with HBsAg‐positive results at end of follow‐up. The diversity‐adjusted required information size (DARIS) of 5716 participants was calculated based upon a proportion of 20% of babies tested positive for HBsAg in the control group, a relative risk reduction of a 20% in HBIG group, an alpha (type I error) of 2.5%, a beta (type II error) of 10%, and a diversity (D) of 87.3%. The actually accrued number of participants is 4224, which is 74% of the DARIS. The solid blue curve presents the cumulative meta‐analysis Z‐score and the inward sloping red curves present the adjusted threshold for statistical significance according to the two‐sided Lan‐DeMets trial sequential monitoring boundaries. The blue cumulative Z‐curve crosses the red trial sequential monitoring boundary for benefit during the 11th trial. This implies that there is no risk of random error in the estimate of a beneficial effect of HBIG versus no intervention on the number of newborns with HBsAg‐positive results at end of follow‐up. The TSA‐adjusted confidence interval is 0.20 to 0.52.

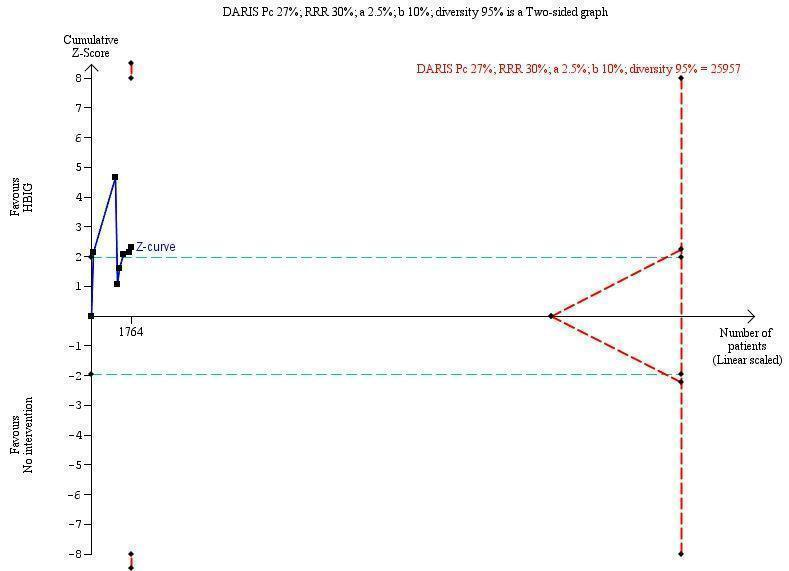
Trial Sequential Analysis (TSA) of the random‐effects meta‐analysis of the effect of hepatitis B immunoglobulin (HBIG) versus no intervention on the number of newborns with hepatitis B envelope antigen (HBeAg)‐positive results at end of follow‐up. The diversity‐adjusted required information size (DARIS) of 25,957 participants was calculated based upon a proportion of 27% of babies tested positive for HBeAg in the control group, a relative risk reduction of a 30% in HBIG group, an alpha (type I error) of 2.5%, a beta (type II error) of 10%, and a diversity (D) of 95%. The actually accrued number of participants is 1764, which is only 6.8% of the DARIS. (We planned to use a relative risk reduction of 20%, but this led to a DARIS of 60,715 participants and the TSA figure could not be drawn by the program; therefore, a relative risk reduction of 30% was adopted instead.) The solid blue curve presents the cumulative meta‐analysis Z‐score and the inward sloping red curves present the adjusted threshold for statistical significance according to the two‐sided Lan‐DeMets trial sequential monitoring boundaries. The blue cumulative Z‐curve does not cross the red inward sloping trial sequential monitoring boundaries for benefit or harm. Therefore, there is no evidence to support that HBIG influences number of newborns with HBeAg‐positive results at end of follow‐up. The cumulative Z‐curve does not reach the futility area, demonstrating that further trials are needed. The TSA‐adjusted confidence interval is wider than 0.04 to 6.37.
Figuras y tablas -
Figure 5

Trial Sequential Analysis (TSA) of the random‐effects meta‐analysis of the effect of hepatitis B immunoglobulin (HBIG) versus no intervention on the number of newborns with hepatitis B envelope antigen (HBeAg)‐positive results at end of follow‐up. The diversity‐adjusted required information size (DARIS) of 25,957 participants was calculated based upon a proportion of 27% of babies tested positive for HBeAg in the control group, a relative risk reduction of a 30% in HBIG group, an alpha (type I error) of 2.5%, a beta (type II error) of 10%, and a diversity (D) of 95%. The actually accrued number of participants is 1764, which is only 6.8% of the DARIS. (We planned to use a relative risk reduction of 20%, but this led to a DARIS of 60,715 participants and the TSA figure could not be drawn by the program; therefore, a relative risk reduction of 30% was adopted instead.) The solid blue curve presents the cumulative meta‐analysis Z‐score and the inward sloping red curves present the adjusted threshold for statistical significance according to the two‐sided Lan‐DeMets trial sequential monitoring boundaries. The blue cumulative Z‐curve does not cross the red inward sloping trial sequential monitoring boundaries for benefit or harm. Therefore, there is no evidence to support that HBIG influences number of newborns with HBeAg‐positive results at end of follow‐up. The cumulative Z‐curve does not reach the futility area, demonstrating that further trials are needed. The TSA‐adjusted confidence interval is wider than 0.04 to 6.37.

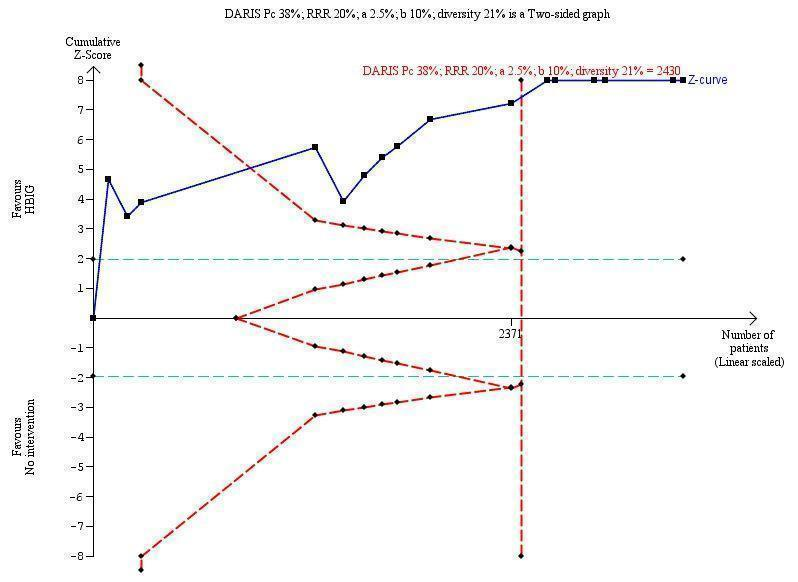
Trial Sequential Analysis (TSA) of the random‐effects meta‐analysis of the effect of hepatitis B immunoglobulin (HBIG) versus no intervention on the number of newborns with hepatitis B virus DNA (HBV‐DNA) positive results at end of treatment. The diversity‐adjusted required information size (DARIS) of n = 2430 participants was calculated based upon a proportion of 38% of babies tested positive for HBV‐DNA, a relative risk reduction of a 20% in HBIG group, an alpha (type I error) of 2.5%, a beta (type II error) of 10%, and a diversity (D) of 21%. The actually accrued number of participants is 2994, which is more than the DARIS of 2430 participants. The solid blue curve presents the cumulative meta‐analysis Z‐score and the inward sloping red curves present the adjusted threshold for statistical significance according to the two‐sided Lan‐DeMets trial sequential monitoring boundaries. The blue cumulative Z‐curve crosses the red trial sequential monitoring boundary for benefit during the fourth trial. This implies that there is no risk of random error in the estimate of a beneficial effect of HBIG versus no intervention on the number of newborns with HBV‐DNA positive results at end of treatment. The TSA‐adjusted and 95% confidence intervals is from 0.22 to 0.37.
Figuras y tablas -
Figure 6

Trial Sequential Analysis (TSA) of the random‐effects meta‐analysis of the effect of hepatitis B immunoglobulin (HBIG) versus no intervention on the number of newborns with hepatitis B virus DNA (HBV‐DNA) positive results at end of treatment. The diversity‐adjusted required information size (DARIS) of n = 2430 participants was calculated based upon a proportion of 38% of babies tested positive for HBV‐DNA, a relative risk reduction of a 20% in HBIG group, an alpha (type I error) of 2.5%, a beta (type II error) of 10%, and a diversity (D) of 21%. The actually accrued number of participants is 2994, which is more than the DARIS of 2430 participants. The solid blue curve presents the cumulative meta‐analysis Z‐score and the inward sloping red curves present the adjusted threshold for statistical significance according to the two‐sided Lan‐DeMets trial sequential monitoring boundaries. The blue cumulative Z‐curve crosses the red trial sequential monitoring boundary for benefit during the fourth trial. This implies that there is no risk of random error in the estimate of a beneficial effect of HBIG versus no intervention on the number of newborns with HBV‐DNA positive results at end of treatment. The TSA‐adjusted and 95% confidence intervals is from 0.22 to 0.37.

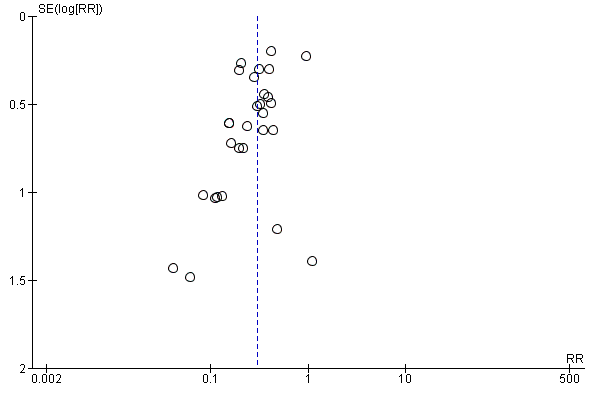
Funnel plot of comparison: 1 Hepatitis B immunoglobulin (HBIG) versus no intervention, outcome: 1.1 Newborn positive for HBsAg.
Figuras y tablas -
Figure 7

Funnel plot of comparison: 1 Hepatitis B immunoglobulin (HBIG) versus no intervention, outcome: 1.1 Newborn positive for HBsAg.

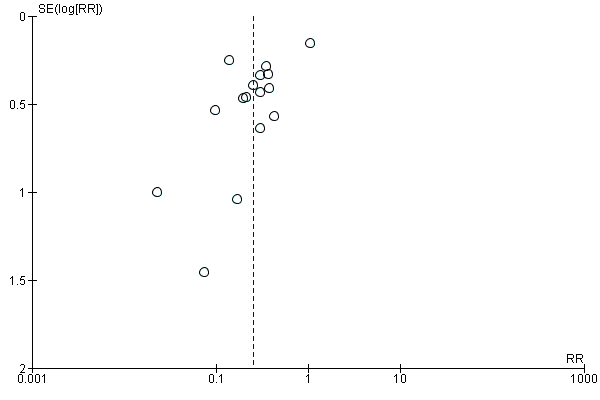
Funnel plot of comparison: 1 Hepatitis B immunoglobulin (HBIG) versus no intervention, outcome: 1.3 Newborn positive for HBV‐DNA.
Figuras y tablas -
Figure 8

Funnel plot of comparison: 1 Hepatitis B immunoglobulin (HBIG) versus no intervention, outcome: 1.3 Newborn positive for HBV‐DNA.

Comparison 1 Hepatitis B immunoglobulin (HBIG) versus no intervention, Outcome 1 Newborn positive for HBsAg.
Figuras y tablas -
Analysis 1.1

Comparison 1 Hepatitis B immunoglobulin (HBIG) versus no intervention, Outcome 1 Newborn positive for HBsAg.

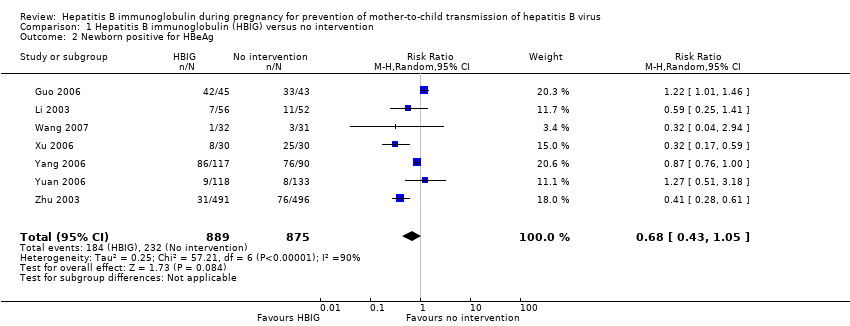
Comparison 1 Hepatitis B immunoglobulin (HBIG) versus no intervention, Outcome 2 Newborn positive for HBeAg.
Figuras y tablas -
Analysis 1.2

Comparison 1 Hepatitis B immunoglobulin (HBIG) versus no intervention, Outcome 2 Newborn positive for HBeAg.

Comparison 1 Hepatitis B immunoglobulin (HBIG) versus no intervention, Outcome 3 Newborn positive for HBV‐DNA.
Figuras y tablas -
Analysis 1.3

Comparison 1 Hepatitis B immunoglobulin (HBIG) versus no intervention, Outcome 3 Newborn positive for HBV‐DNA.

Comparison 2 Hepatitis B immunoglobulin (HBIG) versus no intervention according to dosing regimen of HBIG administration, Outcome 1 Newborn positive for HBsAg.
Figuras y tablas -
Analysis 2.1

Comparison 2 Hepatitis B immunoglobulin (HBIG) versus no intervention according to dosing regimen of HBIG administration, Outcome 1 Newborn positive for HBsAg.

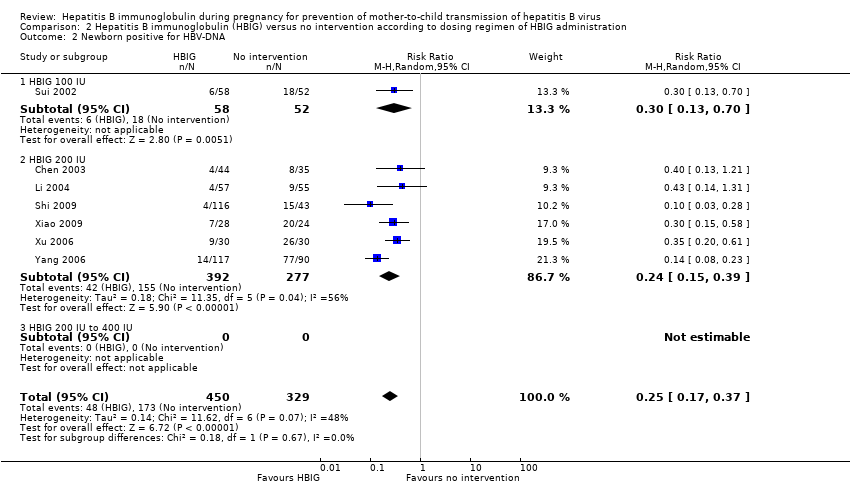
Comparison 2 Hepatitis B immunoglobulin (HBIG) versus no intervention according to dosing regimen of HBIG administration, Outcome 2 Newborn positive for HBV‐DNA.
Figuras y tablas -
Analysis 2.2

Comparison 2 Hepatitis B immunoglobulin (HBIG) versus no intervention according to dosing regimen of HBIG administration, Outcome 2 Newborn positive for HBV‐DNA.

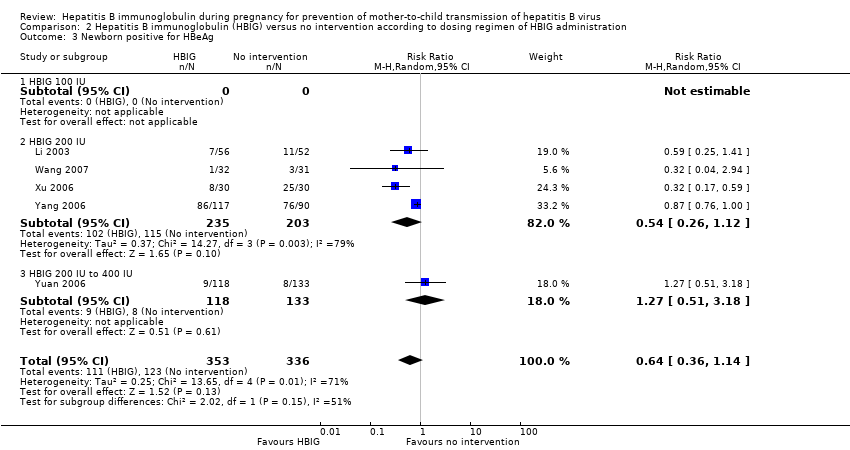
Comparison 2 Hepatitis B immunoglobulin (HBIG) versus no intervention according to dosing regimen of HBIG administration, Outcome 3 Newborn positive for HBeAg.
Figuras y tablas -
Analysis 2.3

Comparison 2 Hepatitis B immunoglobulin (HBIG) versus no intervention according to dosing regimen of HBIG administration, Outcome 3 Newborn positive for HBeAg.

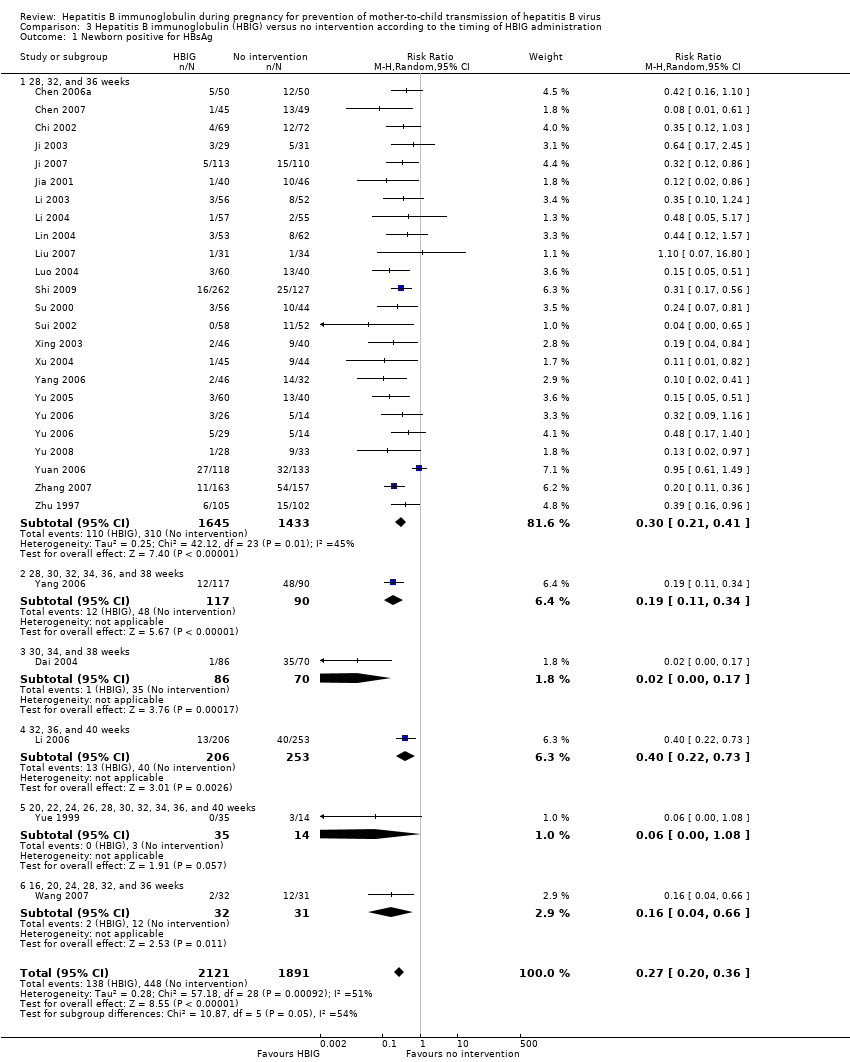
Comparison 3 Hepatitis B immunoglobulin (HBIG) versus no intervention according to the timing of HBIG administration, Outcome 1 Newborn positive for HBsAg.
Figuras y tablas -
Analysis 3.1

Comparison 3 Hepatitis B immunoglobulin (HBIG) versus no intervention according to the timing of HBIG administration, Outcome 1 Newborn positive for HBsAg.

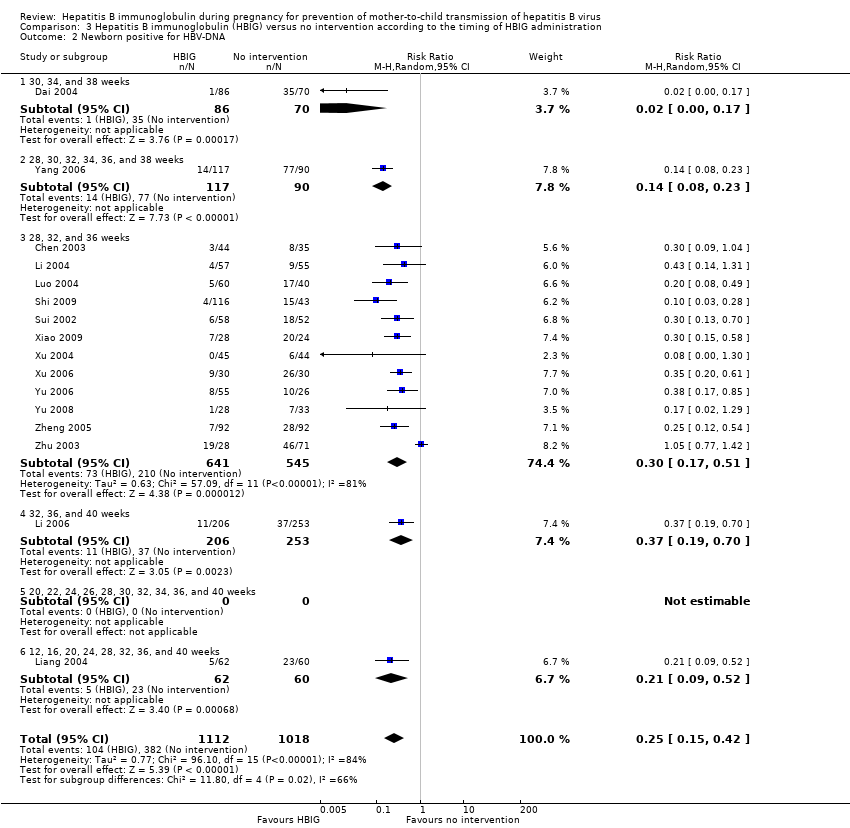
Comparison 3 Hepatitis B immunoglobulin (HBIG) versus no intervention according to the timing of HBIG administration, Outcome 2 Newborn positive for HBV‐DNA.
Figuras y tablas -
Analysis 3.2

Comparison 3 Hepatitis B immunoglobulin (HBIG) versus no intervention according to the timing of HBIG administration, Outcome 2 Newborn positive for HBV‐DNA.

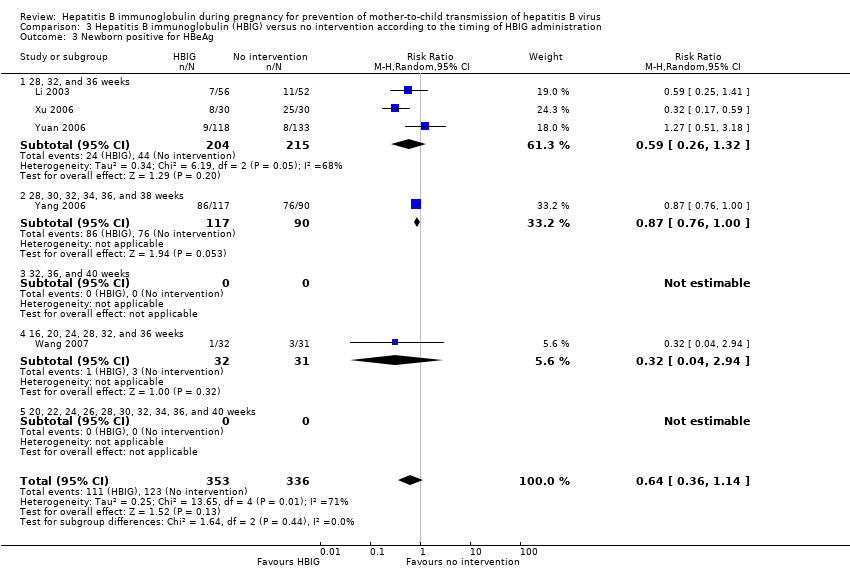
Comparison 3 Hepatitis B immunoglobulin (HBIG) versus no intervention according to the timing of HBIG administration, Outcome 3 Newborn positive for HBeAg.
Figuras y tablas -
Analysis 3.3

Comparison 3 Hepatitis B immunoglobulin (HBIG) versus no intervention according to the timing of HBIG administration, Outcome 3 Newborn positive for HBeAg.

Summary of findings for the main comparison. Hepatitis B immunoglobulin (HBIG) versus no intervention for prevention of mother‐to‐child transmission of hepatitis B virus

Hepatitis B immunoglobulin (HBIG) vs no intervention for prevention of mother‐to‐child transmission of hepatitis B virus

Participants: pregnant women positive for HBsAg or positive for HBeAg, or both.
Settings: hospitals in China.
Intervention: HBIG.

Comparison: no intervention.

Outcomes

Illustrative comparative risks* (95% CI)

Relative effect
(95% CI)

No of Participants
(studies)

Quality of the evidence
(GRADE)

Comments

Assumed risk

Corresponding risk

Control

HBIG versus no intervention

All‐cause mortality or other serous adverse events of the newborn

Study population

Not estimable

0
(01)

See comment

See comment

See comment

Moderate

All‐cause mortality or other serous adverse events of the mothers

Study population

Not estimable

0
(01)

See comment

See comment

See comment

Moderate

Newborn with HBsAg‐positive result
Follow‐up: median 1.2 months

Study population

RR 0.3
(0.24 to 0.38)

5310
(29 studies)

⊕⊝⊝⊝
very low2,3,4,5

211 per 1000

63 per 1000
(51 to 80)

Moderate

213 per 1000

64 per 1000
(51 to 81)

Newborn with HBeAg‐positive result
Follow‐up: median 1.1 months

Study population

RR 0.68
(0.43 to 1.05)

1764
(7 studies)

⊕⊝⊝⊝
very low2,3,4,5,6

265 per 1000

180 per 1000
(114 to 278)

Moderate

212 per 1000

144 per 1000
(91 to 223)

Newborn with HBV‐DNA‐positive result
Follow‐up: median 1.2 months

Study population

RR 0.25
(0.15 to 0.42)

2130
(16 studies)

⊕⊕⊝⊝
low2,3,4

375 per 1000

94 per 1000
(56 to 158)

Moderate

366 per 1000

91 per 1000
(55 to 154)

*The basis for the assumed risk (e.g. the median control group risk across studies) is provided in footnotes. The corresponding risk (and its 95% confidence interval) is based on the assumed risk in the comparison group and the relative effect of the intervention (and its 95% CI).
CI: Confidence interval; RR: Risk ratio;

GRADE Working Group grades of evidence
High quality: Further research is very unlikely to change our confidence in the estimate of effect.
Moderate quality: Further research is likely to have an important impact on our confidence in the estimate of effect and may change the estimate.
Low quality: Further research is very likely to have an important impact on our confidence in the estimate of effect and is likely to change the estimate.
Very low quality: We are very uncertain about the estimate.

1 Comment: Data for this outcome was not reported in any of the included trials.
2 Downgraded by 1 for serious risk of bias: There was unclear blinding in all studies.
3 Downgraded by 1 for serious risk of bias: There was unclear allocation concealment and high risk of selective reporting in all the studies.
4 The assumed risk is the control group risk.
5 Downgraded by 1 for serious indirectness: Surrogate outcome that is not itself important, but measured in the presumption that changes in the surrogate reflect changes in an outcome important to patients.
6 Downgraded by 1 for serious imprecision: The confidence intervals overlapped 1 and either 0.75 or 1.25 or both.

Figuras y tablas -
Summary of findings for the main comparison. Hepatitis B immunoglobulin (HBIG) versus no intervention for prevention of mother‐to‐child transmission of hepatitis B virus
Table 1. Randomised clinical trials of HBIG treatment of pregnant women to prevent mother‐to‐child transmission of hepatitis B

Study ID

Study location

Participants

Interventions

Outcomes

Funding

Chen 2003

Zhejiang

79 participants (44 intervention, 35 control)

Intervention: HBIG 200 IU.

Control: no intervention.

Newborn HBV‐DNA

Not stated.

Chen 2006a

Guangdong

100 participants (50 intervention, 50 control)

Intervention: HBIG 200 IU.

Control: no intervention.

Newborn HBsAg

Not stated.

Chen 2007

Shenzhen

94 participants (45 intervention, 49 control)

Intervention: HBIG 200 IU.

Control: no intervention.

Newborn HBsAg, anti‐HBs

Not stated.

Chi 2002

Zhejiang

141 participants (69 intervention, 72 control)

Intervention: HBIG 200 IU.

Control: no intervention.

Newborn HBsAg

Not stated.

Dai 2004

Zhejiang

156 participants (86 intervention, 70 control)

Intervention: HBIG 200 IU.

Control: no intervention.

Newborn HBV‐DNA, anti‐HBs

Not stated.

Guo 2006

Henan

88 participants (45 intervention, 43 control)

Intervention: HBIG 200 IU.

Control: no intervention.

Newborn HBsAg, HBeAg anti‐HBs.

Not stated

Han 2003

Guangdong

216 participants (126 intervention, 90 control)

Intervention: HBIG 200 IU.

Control: no intervention.

Newborn HBsAg.

Not stated.

Ji 2003

Zhejiang

60 participants (29 intervention, 31 control)

Intervention: HBIG 200 IU.

Control: no intervention.

Newborn HBsAg, anti‐HBs, adverse events.

Not stated

Ji 2007

Shanghai

223 participants (113 intervention, 110 control)

Intervention: HBIG 200 IU.

Control: no intervention.

Newborn HBsAg

Not stated.

Jia 2001

Jiangsu

86 participants (40 intervention, 46 control) aged 22 to 32 years.

Intervention: HBIG 200 IU.

Control: no intervention.

Newborn HBsAg

Not stated.

Li 2003

Guangdong

108 participants (56 intervention, 52 control)

Intervention: HBIG 200 IU.

Control: no intervention.

Newborn HBsAg or HBeAg, or both.

Not stated.

Li 2004

Guangdong

112 participants (57 intervention, 55 control)

Intervention: HBIG 200 IU.

Control: no intervention.

Newborn HBsAg or HBV‐DNA, or both.

Not stated.

Li 2006

Hubei

448 participants (202 intervention, 246 control) aged 18 to 38 years

Intervention: HBIG 200 IU.

Control: no intervention.

Newborn HBV‐DNA, HBsAg.

Not stated.

Liang 2004

Guangdong

122 participants (62 intervention, 60 control)

Intervention: HBIG 200 IU.

Control: no intervention.

Newborn HBV‐DNA.

Not stated.

Lin 2004

Shanghai

117 participants (55 intervention, 62 control)

Intervention: HBIG 200 IU.

Control: no intervention.

Newborn HBsAg.

Not stated.

Liu 2007

Henan

86 participants (43 intervention, 43 control)

Intervention: HBIG 200 IU.

Control: no intervention.

Newborn HBsAg.

Not stated.

Luo 2004

Jiangxi

100 participants (60 intervention, 40 control)

Intervention: HBIG 200 IU.

Control: no intervention.

Newborn HBV‐DNA, HBsAg.

Not stated.

Shi 2009

Guangzhou

389 participants (262 intervention, 127 control)

Intervention: HBIG 200 IU.

Control: no intervention.

Newborn HBsAg or HBV‐DNA, or both

Research supported by GlaxoSmithKline Research and Development Grant NUC30914; Science and Research Foundations of Sun Yat‐Sen University and Guangzhou Science Committee, No 1999‐J‐005‐01.

Su 2000

Henan

98 participants (55 intervention, 43 control)

Intervention: HBIG 200 IU.

Control: no intervention.

Newborn HBsAg

Not stated.

Sui 2002

Shandong

108 participants (56 intervention, 52 control)

Intervention: HBIG 100 IU.

Control: no intervention.

Newborn HBsAg, HBV‐DNA, and anti‐HBs.

Not stated.

Wang 2007

Shandong

63 participants (32 intervention, 31 control)

Intervention: HBIG 200 IU.

Control: no intervention.

Newborn HBsAg and HBeAg

Not stated.

Wang 2008

Taizhou

279 participants (159 intervention, 120 control)

Intervention: HBIG 200 IU.

Control: no intervention.

Newborn HBsAg

Not stated.

Xiao 2009

Xinjiang

52 participants (28 intervention, 24 control)

Intervention: HBIG 200 IU.

Control: no intervention.

newborn HBV‐DNA.

Not stated.

Xing 2003

Henan

86 participants (46 intervention, 40 control) aged 22 to 28 years

Intervention: HBIG 200 IU.

Control: no intervention.

Newborn HBsAg

Supported by Technology Research Fund Committee of Henan province (No. 981170112).

Xu 2004

Shandong

88 participants (44 intervention, 44 control)

Intervention: HBIG 200 IU.

Control: no intervention.

Newborn HBsAg, HBV‐DNA and anti‐HBs.

8‐month‐old babies positive for HBsAg, HBV‐DNA, and anti‐HBs.

Maximum duration of surveillance: 8 months.

Follow‐up time point: 8 months after birth.

Not stated.

Xu 2006

Xinjiang

52 participants (28 intervention, 24 control)

Intervention: HBIG 200 IU.

Control: no intervention.

newborn HBeAg and HBV‐DNA.

Not stated.

Yang 2006

Jiangsu

285 participants (163 intervention, 162 control)

Intervention: HBIG 200 IU.

Control: no intervention.

Newborn HBsAg, HBeAg and HBV‐DNA

Not stated.

Yu 2005

Guangdong

100 participants (60 intervention, 40 control)

Intervention: HBIG 200 IU.

Control: no intervention.

Newborn HBeAg, anti‐HBs

Not stated.

Yu 2006

Shanghai

83 participants (26 intervention I, 29 intervention II, 28 control) aged 20 to 33 years

Intervention: HBIG 200 IU.

Control: no intervention.

Newborn HBV‐DNA

Not stated.

Yu 2008

Guangxi

61 participants (28 intervention, 33 control) aged 22 to 39 years

Intervention: HBIG 200 IU.

Control: no intervention.

Newborn HBV‐DNA, HBsAg

Not stated.

Yuan 2006

Huizhou

250 participants (117 intervention, 113 control)

Intervention: HBIG 400 IU.

Control: no intervention.

Newborn HBsAg, HBeAg, antibodies to HBsAg, HBeAg, and HBcAg; adverse effects of the immunoglobulins to the neonates and mothers

Supported by Huizhou Municipal Central hospital and Huizhou Science and Technology Bureau.

Yue 1999

Shanxi

48 participants (34 intervention, 14 control) aged 20 to 33 years

Intervention: HBIG 100 IU.

Control: no intervention.

Newborn HBsAg, anti‐HBs

Not stated.

Zhang 2007

Guangdong

320 participants (163 intervention, 157 control) aged 19 to 36 years

Intervention: HBIG 200 IU.

Control: no intervention.

Newborn HBsAg

Not stated.

Zheng 2005

Guangdong

184 participants (92 intervention, 92 control) aged 22 to 39 years

Intervention: HBIG 200 IU.

Control: no intervention.

Newborn HBV‐DNA

Not stated.

Zhu 1997

Shanghai

204 participants (103 intervention, 101 control) aged 20 to 34 years

Intervention: HBIG 200 IU.

Control: no intervention.

Newborn HBsAg, HBeAg, antibodies to HBsAg, HBeAg, and HBcAg.

Not stated.

Zhu 2003

Shanghai

980 participants (487 intervention, 493 control) aged 19 to 35 years

Intervention: HBIG 200 IU or 400 IU.

Control: no intervention.

Newborn HBsAg, HBeAg, and HBV‐DNA.

Supported by a grant from the Ministry of Public Health China (No. 97030223).

anti‐HBc: anti‐hepatitis core; anti‐HBe: anti‐hepatitis B envelope; anti‐HBs: anti‐hepatitis B surface; HBIG: hepatitis B immunoglobulin; HBcAg: hepatitis B core antigen; HBeAg: hepatitis B envelope antigen; HBsAg: hepatitis B surface antigen; HBV‐DNA: hepatitis B virus DNA.

Figuras y tablas -
Table 1. Randomised clinical trials of HBIG treatment of pregnant women to prevent mother‐to‐child transmission of hepatitis B
Comparison 1. Hepatitis B immunoglobulin (HBIG) versus no intervention

Outcome or subgroup title

No. of studies

No. of participants

Statistical method

Effect size

1 Newborn positive for HBsAg Show forest plot

29

5310

Risk Ratio (M‐H, Random, 95% CI)

0.30 [0.24, 0.38]

2 Newborn positive for HBeAg Show forest plot

7

1764

Risk Ratio (M‐H, Random, 95% CI)

0.68 [0.43, 1.05]

3 Newborn positive for HBV‐DNA Show forest plot

16

2130

Risk Ratio (M‐H, Random, 95% CI)

0.25 [0.15, 0.42]

Figuras y tablas -
Comparison 1. Hepatitis B immunoglobulin (HBIG) versus no intervention
Comparison 2. Hepatitis B immunoglobulin (HBIG) versus no intervention according to dosing regimen of HBIG administration

Outcome or subgroup title

No. of studies

No. of participants

Statistical method

Effect size

1 Newborn positive for HBsAg Show forest plot

28

4281

Risk Ratio (M‐H, Random, 95% CI)

0.28 [0.21, 0.37]

1.1 HBIG 100 IU

2

159

Risk Ratio (M‐H, Random, 95% CI)

0.05 [0.01, 0.36]

1.2 HBIG 200 IU

25

3855

Risk Ratio (M‐H, Random, 95% CI)

0.26 [0.21, 0.33]

1.3 HBIG 400 IU

2

267

Risk Ratio (M‐H, Random, 95% CI)

0.67 [0.30, 1.53]

2 Newborn positive for HBV‐DNA Show forest plot

7

779

Risk Ratio (M‐H, Random, 95% CI)

0.25 [0.17, 0.37]

2.1 HBIG 100 IU

1

110

Risk Ratio (M‐H, Random, 95% CI)

0.30 [0.13, 0.70]

2.2 HBIG 200 IU

6

669

Risk Ratio (M‐H, Random, 95% CI)

0.24 [0.15, 0.39]

2.3 HBIG 200 IU to 400 IU

0

0

Risk Ratio (M‐H, Random, 95% CI)

0.0 [0.0, 0.0]

3 Newborn positive for HBeAg Show forest plot

5

689

Risk Ratio (M‐H, Random, 95% CI)

0.64 [0.36, 1.14]

3.1 HBIG 100 IU

0

0

Risk Ratio (M‐H, Random, 95% CI)

0.0 [0.0, 0.0]

3.2 HBIG 200 IU

4

438

Risk Ratio (M‐H, Random, 95% CI)

0.54 [0.26, 1.12]

3.3 HBIG 200 IU to 400 IU

1

251

Risk Ratio (M‐H, Random, 95% CI)

1.27 [0.51, 3.18]

Figuras y tablas -
Comparison 2. Hepatitis B immunoglobulin (HBIG) versus no intervention according to dosing regimen of HBIG administration
Comparison 3. Hepatitis B immunoglobulin (HBIG) versus no intervention according to the timing of HBIG administration

Outcome or subgroup title

No. of studies

No. of participants

Statistical method

Effect size

1 Newborn positive for HBsAg Show forest plot

27

4012

Risk Ratio (M‐H, Random, 95% CI)

0.27 [0.20, 0.36]

1.1 28, 32, and 36 weeks

23

3078

Risk Ratio (M‐H, Random, 95% CI)

0.30 [0.21, 0.41]

1.2 28, 30, 32, 34, 36, and 38 weeks

1

207

Risk Ratio (M‐H, Random, 95% CI)

0.19 [0.11, 0.34]

1.3 30, 34, and 38 weeks

1

156

Risk Ratio (M‐H, Random, 95% CI)

0.02 [0.00, 0.17]

1.4 32, 36, and 40 weeks

1

459

Risk Ratio (M‐H, Random, 95% CI)

0.40 [0.22, 0.73]

1.5 20, 22, 24, 26, 28, 30, 32, 34, 36, and 40 weeks

1

49

Risk Ratio (M‐H, Random, 95% CI)

0.06 [0.00, 1.08]

1.6 16, 20, 24, 28, 32, and 36 weeks

1

63

Risk Ratio (M‐H, Random, 95% CI)

0.16 [0.04, 0.66]

2 Newborn positive for HBV‐DNA Show forest plot

16

2130

Risk Ratio (M‐H, Random, 95% CI)

0.25 [0.15, 0.42]

2.1 30, 34, and 38 weeks

1

156

Risk Ratio (M‐H, Random, 95% CI)

0.02 [0.00, 0.17]

2.2 28, 30, 32, 34, 36, and 38 weeks

1

207

Risk Ratio (M‐H, Random, 95% CI)

0.14 [0.08, 0.23]

2.3 28, 32, and 36 weeks

12

1186

Risk Ratio (M‐H, Random, 95% CI)

0.30 [0.17, 0.51]

2.4 32, 36, and 40 weeks

1

459

Risk Ratio (M‐H, Random, 95% CI)

0.37 [0.19, 0.70]

2.5 20, 22, 24, 26, 28, 30, 32, 34, 36, and 40 weeks

0

0

Risk Ratio (M‐H, Random, 95% CI)

0.0 [0.0, 0.0]

2.6 12, 16, 20, 24, 28, 32, 36, and 40 weeks

1

122

Risk Ratio (M‐H, Random, 95% CI)

0.21 [0.09, 0.52]

3 Newborn positive for HBeAg Show forest plot

5

689

Risk Ratio (M‐H, Random, 95% CI)

0.64 [0.36, 1.14]

3.1 28, 32, and 36 weeks

3

419

Risk Ratio (M‐H, Random, 95% CI)

0.59 [0.26, 1.32]

3.2 28, 30, 32, 34, 36, and 38 weeks

1

207

Risk Ratio (M‐H, Random, 95% CI)

0.87 [0.76, 1.00]

3.3 32, 36, and 40 weeks

0

0

Risk Ratio (M‐H, Random, 95% CI)

0.0 [0.0, 0.0]

3.4 16, 20, 24, 28, 32, and 36 weeks

1

63

Risk Ratio (M‐H, Random, 95% CI)

0.32 [0.04, 2.94]

3.5 20, 22, 24, 26, 28, 30, 32, 34, 36, and 40 weeks

0

0

Risk Ratio (M‐H, Random, 95% CI)

0.0 [0.0, 0.0]

Figuras y tablas -
Comparison 3. Hepatitis B immunoglobulin (HBIG) versus no intervention according to the timing of HBIG administration