نقش آنتیبیوتیک درمانی در پیشگیری از بروز عفونتها در افراد مبتلا به استروک حاد
Referencias
منابع مطالعات واردشده در این مرور
منابع مطالعات در حال انجام
منابع اضافی
منابع دیگر نسخههای منتشرشده این مرور
Characteristics of studies
Characteristics of included studies [ordered by study ID]
Ir a:
| Methods | Randomised, double‐blind | |
| Participants | People older than 18 years with non‐septic ischaemic or haemorrhagic stroke enrolled within 24 hours from clinical onset | |
| Interventions | Intravenous levofloxacin 500 mg/100 mL/d, for 3 days | |
| Outcomes | Early infection (within the first 7 days after stroke), case fatality, favourable outcome at day 90 (mRS < 2, NIHSS < 2, BI 95 or 100) | |
| Notes | — | |
| Risk of bias | ||
| Bias | Authors' judgement | Support for judgement |
| Random sequence generation (selection bias) | Low risk | Participants were randomised via a computer‐generated number sheet |
| Allocation concealment (selection bias) | Low risk | Participants were randomly allocated to 1 of the 2 treatment groups; a pharmacist, nurse, or fellow opened a numbered sealed envelope. Study treatment was prepared at the central pharmacy of the institution and was kept within its premises until allocation. |
| Blinding (performance bias and detection bias) | Low risk | Double‐blind design, placebo controlled. Outcome assessment (e.g. occurrence of infections) was assessed blindly because physicians were not aware of treatment allocation. |
| Incomplete outcome data (attrition bias) | Low risk | Table 2 indicates that all participants were seen at 90 days. Counts of participants with secondary outcomes by treatment were not provided. |
| Selective reporting (reporting bias) | Low risk | All outcomes were reported (infections, case fatality, unfavourable functional outcome). |
| Other bias | Low risk | No other sources of bias were found. |
| Methods | Randomised, unblinded | |
| Participants | People with ischaemic stroke within 12 hours from clinical onset | |
| Interventions | Penicillin intramuscularly | |
| Outcomes | Infectious complications, case fatality, functional outcome (BI, CNS) | |
| Notes | — | |
| Risk of bias | ||
| Bias | Authors' judgement | Support for judgement |
| Random sequence generation (selection bias) | Unclear risk | The study was described as 'randomized'. |
| Allocation concealment (selection bias) | Unclear risk | Allocation concealment was not mentioned. |
| Blinding (performance bias and detection bias) | High risk | This study appears to have an open‐label design; blinding of outcome assessment was not described. |
| Incomplete outcome data (attrition bias) | High risk | Nothing was reported about completeness of follow‐up and outcome assessment. |
| Selective reporting (reporting bias) | High risk | Outcome assessment was performed at discharge instead of at a fixed time point. |
| Other bias | Low risk | No other sources of bias were found. |
| Methods | Randomised, double‐blind | |
| Participants | People older than 17 years with ischaemic stroke in MCA territory and NIHSS ≥ 12 within 9 to 36 hours after onset | |
| Interventions | Intravenous moxifloxacin 400 mg/d for 5 days | |
| Outcomes | Infection rate within 11 days after stroke onset, bacterial spectrum, moxifloxacin resistance, daily maximum body temperature, CRP, survival and functional outcome (BI) at day 180 after stroke (BI was dichotomised ≥ 60 and < 60) | |
| Notes | — | |
| Risk of bias | ||
| Bias | Authors' judgement | Support for judgement |
| Random sequence generation (selection bias) | Low risk | A computer‐generated allocation schedule was used. |
| Allocation concealment (selection bias) | Low risk | Trial pharmacists at each site labelled trial drugs with sequential study numbers according to randomisation lists prepared by the trial statistician and dispensed drugs. |
| Blinding (performance bias and detection bias) | Low risk | Study investigators and enrolling staff were masked to assignments. |
| Incomplete outcome data (attrition bias) | High risk | 7 participants were lost to follow‐up; no details were mentioned. |
| Selective reporting (reporting bias) | Low risk | All outcomes (infection, neurological outcome, adverse events, and case fatality) were reported at prespecified intervals. |
| Other bias | Low risk | No other sources of bias were found. |
| Methods | Cluster‐randomised, open‐label, blinded endpoint | |
| Participants | People aged older than 18 years, confirmed diagnosis of new stroke (ischaemic or haemorrhagic), onset of symptoms within 48 hours at recruitment, unsafe to swallow because of impaired consciousness, failed bedside swallow test, or presence of a nasogastric tube | |
| Interventions | Antibiotic choice conformed to local antibiotic policy by dose and by route according to local guidelines. Amoxicillin or co‐amoxiclav, together with clarithromycin for 7 days, was recommended if no restrictions were applied. | |
| Outcomes | Poststroke pneumonia was determined by a statistician masked to allocation using a criteria‐based hierarchical algorithm; pneumonia was diagnosed by the local treating physician. | |
| Notes | — | |
| Risk of bias | ||
| Bias | Authors' judgement | Support for judgement |
| Random sequence generation (selection bias) | Low risk | Minimisation algorithm, stratifying centres for number of stroke admissions per year and proportion admitted directly to specialist care. Randomisation was computer generated and was done away from the trial office. |
| Allocation concealment (selection bias) | Low risk | Participants, research staff obtaining data, and statisticians undertaking analyses of outcome data were unaware of stroke unit allocation. Randomisation was computer generated and was done away from the trial office. |
| Blinding (performance bias and detection bias) | Low risk | Participants, research staff obtaining data, and statisticians undertaking analyses of outcome data were unaware of stroke unit allocation. Detection bias for the primary outcome between groups was minimised by a criteria‐based algorithm for diagnosis of poststroke pneumonia, applied blind to the whole dataset. Outcomes at 90 days were assessed by trial office researchers masked to allocation. |
| Incomplete outcome data (attrition bias) | Low risk | No participants were lost to follow‐up at the primary endpoint; 2 participants in the antibiotic group withdrew consent, and 16 (3%) in the control group and 18 (3%) in the antibiotic group could not be contacted for the 90‐day follow‐up. |
| Selective reporting (reporting bias) | Low risk | All outcomes (poststroke pneumonia, neurological outcome, functional outcome, mortality, CDT‐positive diarrhoea, MRSA colonisation, EuroQoL scores, hospital stay) were reported at prespecified intervals. |
| Other bias | Low risk | No other sources of bias were found. |
| Methods | Quasi‐randomised (8th number of identity card), open‐label, blinded outcome assessment | |
| Participants | People older than 18 years with ischaemic stroke, NIHSS > 5, and onset of stroke 6 to 24 hours before start of treatment | |
| Interventions | Orally minocycline 200 mg/d for 5 days | |
| Outcomes | NIHSS on day 90; NIHSS, mRS, BI, and death on days 7, 30, and 90 | |
| Notes | — | |
| Risk of bias | ||
| Bias | Authors' judgement | Support for judgement |
| Random sequence generation (selection bias) | High risk | The 8th number on the participant's identity card was used. |
| Allocation concealment (selection bias) | High risk | After contacting the trial author by email, we received an email from the epidemiologist of this trial. Allocation concealment was described as follows. "A patient arrived at the emergency room with signs of stroke. Emergency room personnel were aware that the study was recruiting participants and identified patients who met study inclusion criteria. Once this identification was made, the attending physician in the emergency room phoned me regardless of the time, day or night. In the emergency room were sealed, numbered packages containing medication. The attending physician read me the eighth digit of the patient's National Identity number. I referred to a randomization list which had been computer‐generated prior to study onset, and based on whether the eighth digit was odd or even, the randomization list assigned the patient to a numbered package. The attending physician then provided the medication inside the appropriately numbered package to the patient. Thus, the attending physician in the emergency room was blind to the treatment assignment. I was not blind to the treatment assignment, however, and was aware of the patient's treatment assignment. I, therefore, consider this trial open label". In conclusion, we do not know for sure whether blinding was maintained on the ward of the hospital. It is possible that physicians were aware of the treatment because they knew that participants with even/odd NID numbers would get a certain treatment. |
| Blinding (performance bias and detection bias) | Low risk | Blinded study; outcomes were assessed blindly (although the adequacy of blind was not described) |
| Incomplete outcome data (attrition bias) | High risk | The number of participants lost to follow‐up was not reported. Scores on NIHSS, BI, and mRS were presented as means. |
| Selective reporting (reporting bias) | Low risk | All outcomes were reported. |
| Other bias | Low risk | No other sources of bias were found. |
| Methods | Randomised, unblinded | |
| Participants | People aged at least 18 years with ischaemic stroke and onset of symptoms less than 24 hours ago, bedridden (mRS > 3), with estimated premorbid mRS < 2 and stable deficits | |
| Interventions | Intravenous mezlocillin 2 g and sulbactam 1 g every 8 hours for 4 days (12 infusions in total) | |
| Outcomes | mRS at day 90, infection, daily temperature | |
| Notes | Infection was assessed by blinded observer; primary outcome (mRS at day 90) was assessed by telephone interview with unknown blinding procedure. | |
| Risk of bias | ||
| Bias | Authors' judgement | Support for judgement |
| Random sequence generation (selection bias) | Low risk | Randomisation was performed via a computer‐generated number sheet and a numbered, sealed envelope. |
| Allocation concealment (selection bias) | Low risk | Randomisation was performed via a computer‐generated number sheet and a numbered, sealed envelope. |
| Blinding (performance bias and detection bias) | High risk | This was an open‐label design. Assessment of infections during the study period was done by a blinded observer, but assessment of secondary outcomes, such as NIHSS and mRS, was not done in a blinded fashion. |
| Incomplete outcome data (attrition bias) | Low risk | Data show no losses to follow‐up. |
| Selective reporting (reporting bias) | Low risk | Data show no losses to follow‐up in this study, not even at 90 days. |
| Other bias | Low risk | No other sources of bias were found. |
| Methods | Randomised, open‐label with blinded outcome assessment | |
| Participants | People aged 18 years or older, with severe ischaemic stroke (score > 9 on the NIHSS) and clinical diagnosis of a stroke in the MCA territory | |
| Interventions | Standard stroke care plus daily ultrasensitive procalcitonin (PCTus)‐guided antibiotic treatment. If PCTus concentration was higher than 0.05 ng/mL, a bacterial infection was considered likely and use of antibiotics was recommended. Type and duration of antibiotic treatment ‐ focusing on stroke‐associated pneumonia ‐ were left to the treating physician. | |
| Outcomes | mRS at 7 days and 3 months, death at 7 and 30 days, infection rate, total antibiotic use, BI at 3 months | |
| Notes | — | |
| Risk of bias | ||
| Bias | Authors' judgement | Support for judgement |
| Random sequence generation (selection bias) | Low risk | Use of random number generator |
| Allocation concealment (selection bias) | Low risk | Numbered sealed, opaque envelopes |
| Blinding (performance bias and detection bias) | Low risk | This was an open‐label study. Outcome assessment of mRS at 3 months was adequately blinded: centrally assessed by structured telephone interviews conducted by trained staff members masked to allocation |
| Incomplete outcome data (attrition bias) | Low risk | Primary outcome was centrally assessed by structured telephone interviews conducted by staff members at the study centre. All secondary outcomes were reported, except for length of stay and use of antibiotics, owing to methodological restrictions. |
| Selective reporting (reporting bias) | Low risk | Figure 2 showing patient flow through the study was missing from the manuscript; cannot be sure if all participants were accounted for at follow‐up |
| Other bias | Low risk | No other sources of bias were found. |
| Methods | Randomised, open‐label, blinded endpoint | |
| Participants | People aged 18 years or older with clinical symptoms of stroke (ischaemic or haemorrhagic), onset of symptoms within less than 24 hours, score ≥ 1 on the NIHSS | |
| Interventions | Intravenous ceftriaxone 2 g/d for 4 days | |
| Outcomes | mRS at 3 months, death at discharge and 3 months after randomisation, infection rate, total antimicrobial use, length of hospital stay, volume of poststroke care, and quality‐adjusted life‐years and costs | |
| Notes | — | |
| Risk of bias | ||
| Bias | Authors' judgement | Support for judgement |
| Random sequence generation (selection bias) | Low risk | Online tool, stratified according to study centre (university hospital, large non‐university hospital, or small non‐university hospital) and stroke severity (score on NIHSS of 1 to 9 vs score ≥ 10), with permuted blocks of varying block size (with maximum block size of 6) |
| Allocation concealment (selection bias) | Low risk | Online tool within 24 hours after symptom onset. Local investigators and participants were not masked, but research nurses who did the follow‐up interviews were masked to treatment allocation. |
| Blinding (performance bias and detection bias) | Low risk | Local investigators and participants were not masked, but research nurses who did the follow‐up interviews were masked to treatment allocation. Trained and masked research nurses based at the Academic Medical Center assessed functional outcomes at 3 months using a validated structured telephone interview. |
| Incomplete outcome data (attrition bias) | Low risk | 24 participants were lost to follow‐up (11 in the ceftriaxone group and 13 in the control group); details are mentioned in the appendix of the manuscript. |
| Selective reporting (reporting bias) | Low risk | All outcomes were reported. |
| Other bias | Low risk | No other sources of bias were found. |
BI: Barthel Index.
CDT: Clostridium difficile toxin.
CNS: Canadian Neurologic Scale.
CRP: C‐reactive protein.
EuroQoL: measure of health‐related quality of life.
MCA: middle cerebral artery.
mRS: modified Rankin Scale.
MRSA: methicillin‐resistant Staphylococcus aureus.
NID: National Identity number.
NIHSS: National Institutes of Health Stroke Scale.
Characteristics of ongoing studies [ordered by study ID]
Ir a:
| Trial name or title | PRECIOUS: PREvention of Complications to Improve OUtcome in elderly patients with acute Stroke. A randomized, open, phase III, clinical trial with blinded outcome assessment |
| Methods | International, multi‐centre, multi‐factorial, randomised controlled, open‐label trial with blinded outcome assessment |
| Participants | Adults over 66 years of age with a clinical diagnosis of acute ischaemic stroke or intracerebral haemorrhage Inclusion criteria:
Exclusion criteria: All participants:
For the ceftriaxone arm:
For the paracetamol arm:
For the metoclopramide arm:
|
| Interventions | Participants will be randomly allocated in a 2*2*2 factorial design to any combination of open‐label oral or rectal metoclopramide (10 mg 3 times daily); intravenous ceftriaxone (2000 mg once daily); or oral, rectal, or intravenous paracetamol (1000 mg 4 times daily); or to usual care, started within 12 hours after symptom onset and continued for 4 days or until complete recovery or discharge from hospital, if earlier. Allocation will be based on proportional minimisation through a web‐based allocation service. Investigators will have the opportunity to censor a single specific randomisation arm in a specific participant before randomisation, for example in case of an allergy to 1 of the interventions. Participants will have follow‐up at 7 and 91 days. |
| Outcomes | Primary outcome: handicap as assessed by score on the mRS at 91 days (± 14), and analysed via ordinal logistical regression Secondary outcomes: At 7 days (± 1 day) or at discharge, if earlier:
At 91 days (± 14 days):
|
| Starting date | June 2015 |
| Contact information | Dr Bart van der Worp, Department of Neurology and Neurosurgery, Brain Center Rudolf Magnus, University Medical Center Utrecht, The Netherlands |
| Notes |
BI: Barthel Index.
CT: computerised tomography.
EQ‐5D‐5L: EuroQoL Group quality of life questionnaire based on a five‐level scale.
ESBL: extended‐spectrum beta‐lactamase.
MoCA: Montreal Cognitive Assessment.
MRI: magnetic resonance imaging.
mRS: modified Rankin Scale.
NIHSS: National Institutes of Health Stroke Scale.
PCR: polymerase chain reaction.
SAE: serious adverse event.
WHO: World Health Organization.
Data and analyses
| Outcome or subgroup title | No. of studies | No. of participants | Statistical method | Effect size |
| 1 Case fatality at the end of follow‐up Show forest plot | 8 | 4422 | Risk Ratio (M‐H, Random, 95% CI) | 1.03 [0.87, 1.21] |
| Analysis 1.1  Comparison 1 Forest plot of comparison: primary outcomes, Outcome 1 Case fatality at the end of follow‐up. | ||||
| 2 Death or dependency at the end of follow‐up Show forest plot | 7 | 4332 | Risk Ratio (M‐H, Random, 95% CI) | 0.99 [0.89, 1.10] |
| Analysis 1.2  Comparison 1 Forest plot of comparison: primary outcomes, Outcome 2 Death or dependency at the end of follow‐up. | ||||
| Outcome or subgroup title | No. of studies | No. of participants | Statistical method | Effect size |
| 1 Number of infections at the end of follow‐up Show forest plot | 7 | 4317 | Risk Ratio (M‐H, Random, 95% CI) | 0.71 [0.58, 0.88] |
| Analysis 2.1  Comparison 2 Forest plot of comparison: secondary outcomes, Outcome 1 Number of infections at the end of follow‐up. | ||||
| 2 Number of UTIs at the end of follow‐up Show forest plot | 6 | 4257 | Risk Ratio (M‐H, Random, 95% CI) | 0.40 [0.32, 0.51] |
| Analysis 2.2 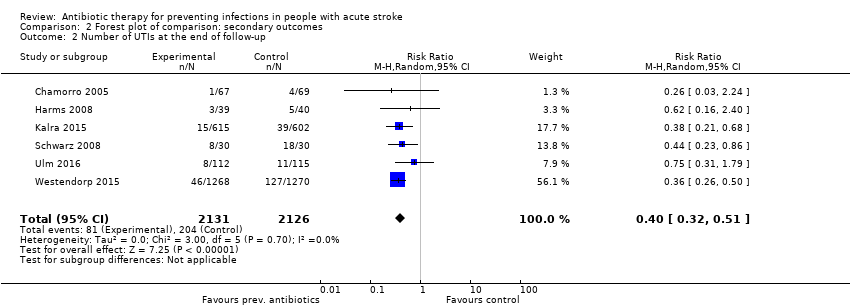 Comparison 2 Forest plot of comparison: secondary outcomes, Outcome 2 Number of UTIs at the end of follow‐up. | ||||
| 3 Number of pneumonias at the end of follow‐up Show forest plot | 6 | 4257 | Risk Ratio (M‐H, Random, 95% CI) | 0.95 [0.80, 1.13] |
| Analysis 2.3  Comparison 2 Forest plot of comparison: secondary outcomes, Outcome 3 Number of pneumonias at the end of follow‐up. | ||||
| Outcome or subgroup title | No. of studies | No. of participants | Statistical method | Effect size |
| 1 Functional outcome: low risk of bias studies Show forest plot | 6 | 4191 | Risk Ratio (M‐H, Random, 95% CI) | 1.02 [0.98, 1.06] |
| Analysis 3.1 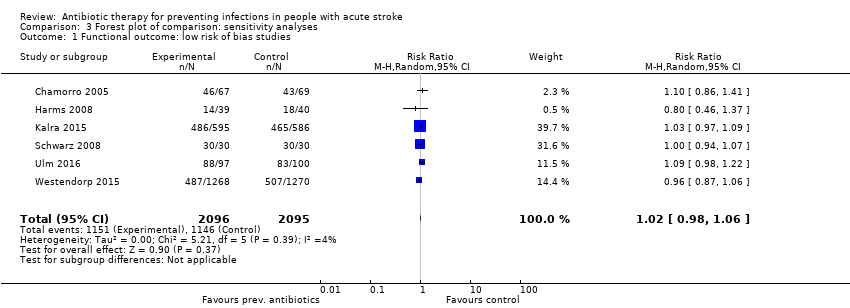 Comparison 3 Forest plot of comparison: sensitivity analyses, Outcome 1 Functional outcome: low risk of bias studies. | ||||
| 2 Number of infections: low risk of bias studies Show forest plot | 6 | 4257 | Risk Ratio (M‐H, Random, 95% CI) | 0.72 [0.58, 0.89] |
| Analysis 3.2 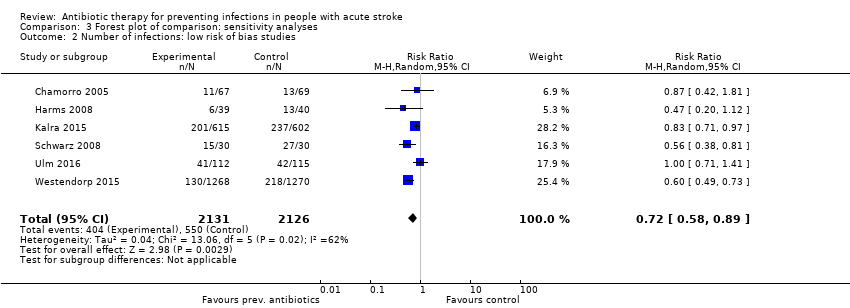 Comparison 3 Forest plot of comparison: sensitivity analyses, Outcome 2 Number of infections: low risk of bias studies. | ||||
| 3 Case fatality: double‐blind design Show forest plot | 2 | 215 | Risk Ratio (M‐H, Fixed, 95% CI) | 1.62 [0.87, 3.00] |
| Analysis 3.3 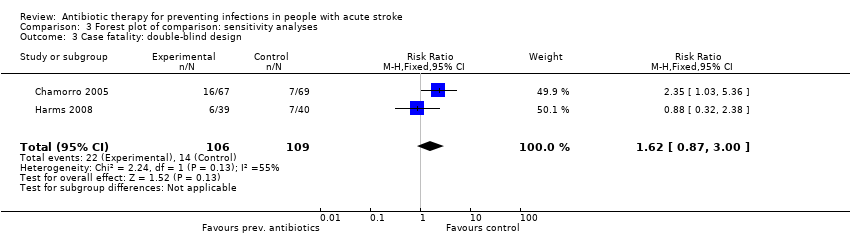 Comparison 3 Forest plot of comparison: sensitivity analyses, Outcome 3 Case fatality: double‐blind design. | ||||
| 4 Case fatality: open‐label design Show forest plot | 5 | 4127 | Risk Ratio (M‐H, Fixed, 95% CI) | 1.03 [0.90, 1.17] |
| Analysis 3.4 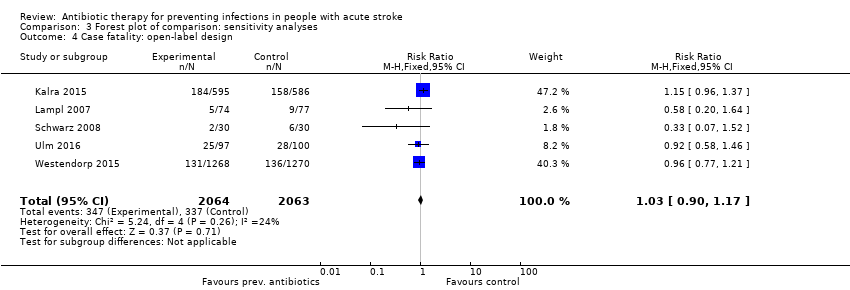 Comparison 3 Forest plot of comparison: sensitivity analyses, Outcome 4 Case fatality: open‐label design. | ||||
| 5 Functional outcome: double‐blind design Show forest plot | 2 | 215 | Risk Ratio (M‐H, Fixed, 95% CI) | 1.01 [0.80, 1.27] |
| Analysis 3.5 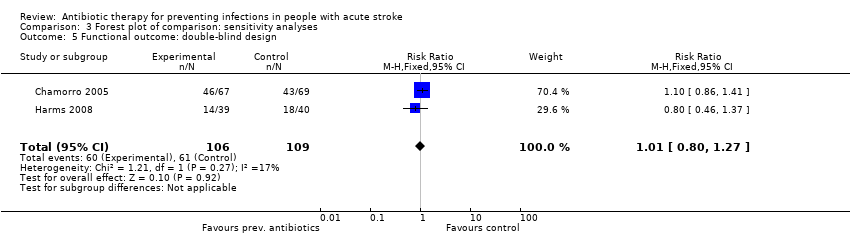 Comparison 3 Forest plot of comparison: sensitivity analyses, Outcome 5 Functional outcome: double‐blind design. | ||||
| 6 Functional outcome: open‐label design Show forest plot | 5 | 4117 | Risk Ratio (M‐H, Fixed, 95% CI) | 0.98 [0.93, 1.03] |
| Analysis 3.6  Comparison 3 Forest plot of comparison: sensitivity analyses, Outcome 6 Functional outcome: open‐label design. | ||||

Risk of bias summary: review authors' judgements about each risk of bias item for each included study, using the Cochrane 'Risk of bias' tool. '+' is defined as low risk of bias, '‐' as high risk of bias, '?' as unclear risk of bias.

Study flow diagram.
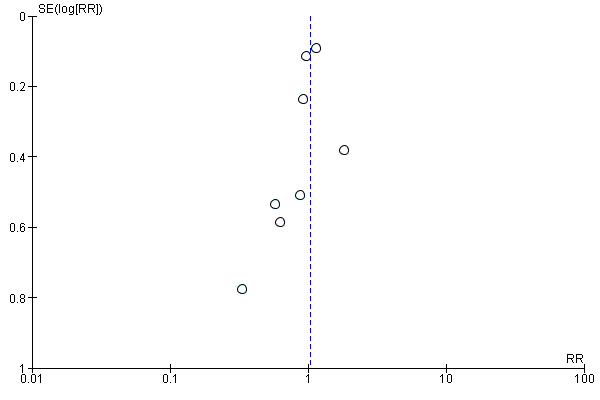
Funnel plot of comparison: 1 Forest plot of comparison: primary outcomes, outcome: 1.1 Case fatality at the end of follow‐up.

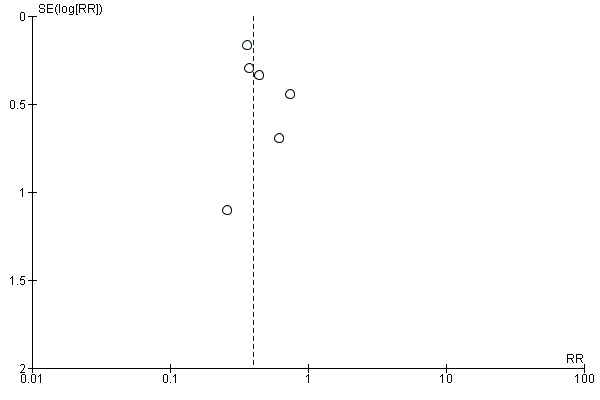
Funnel plot of comparison: 1 Forest plot of comparison: primary outcomes, outcome: 1.2 Death or dependency at the end of follow‐up.

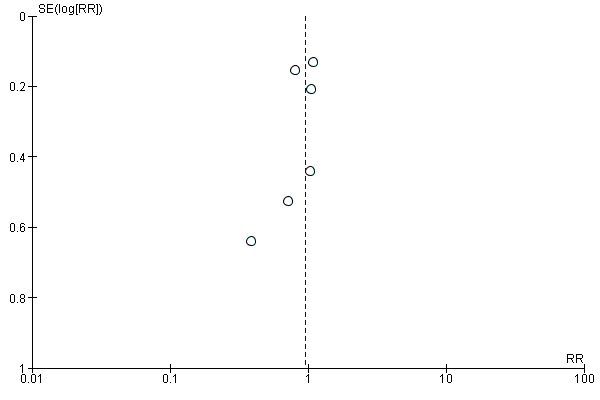
Funnel plot of comparison: 2 Forest plot of comparison: secondary outcomes, outcome: 2.1 Number of infections at the end of follow‐up.
Funnel plot of comparison: 2 Forest plot of comparison: secondary outcomes, outcome: 2.2 Number of UTIs at the end of follow‐up.
Funnel plot of comparison: 2 Forest plot of comparison: secondary outcomes, outcome: 2.3 Number of pneumonias at the end of follow‐up.

Comparison 1 Forest plot of comparison: primary outcomes, Outcome 1 Case fatality at the end of follow‐up.

Comparison 1 Forest plot of comparison: primary outcomes, Outcome 2 Death or dependency at the end of follow‐up.

Comparison 2 Forest plot of comparison: secondary outcomes, Outcome 1 Number of infections at the end of follow‐up.

Comparison 2 Forest plot of comparison: secondary outcomes, Outcome 2 Number of UTIs at the end of follow‐up.

Comparison 2 Forest plot of comparison: secondary outcomes, Outcome 3 Number of pneumonias at the end of follow‐up.

Comparison 3 Forest plot of comparison: sensitivity analyses, Outcome 1 Functional outcome: low risk of bias studies.

Comparison 3 Forest plot of comparison: sensitivity analyses, Outcome 2 Number of infections: low risk of bias studies.

Comparison 3 Forest plot of comparison: sensitivity analyses, Outcome 3 Case fatality: double‐blind design.

Comparison 3 Forest plot of comparison: sensitivity analyses, Outcome 4 Case fatality: open‐label design.

Comparison 3 Forest plot of comparison: sensitivity analyses, Outcome 5 Functional outcome: double‐blind design.

Comparison 3 Forest plot of comparison: sensitivity analyses, Outcome 6 Functional outcome: open‐label design.
| Preventive antibiotic therapy compared with placebo and/or conventional management in acute stroke | ||||||
| Patient or population: patients with acute ischaemic or haemorrhagic stroke Setting: acute stroke management Intervention: preventive antibiotic therapy for systemic use, at any dose or length of treatment Comparison: placebo and/or conventional acute stroke management | ||||||
| Outcomes | Absolute risk | Relative effect | No. of participants | Quality of the evidence | Comments | |
| Risk with placebo and/or conventional management | Risk with preventive antibiotic treatment | |||||
| Case fatality at the end of follow‐up | Study population | RR 1.03 (0.87 to 1.21) | 4422 (8) | ⊕⊕⊕⊕ | ||
| 163 per 1000 | 169 per 1000 | |||||
| Poor functional outcome at the end of follow‐up | Study population | RR 0.99 (0.89 to 1.10) | 4332 (7) | ⊕⊕⊕⊕ | ||
| 547 per 1000 | 535 per 1000 | |||||
| Number of infections at the end of follow‐up | Study population | RR 0.71 (0.58 to 0.88) | 4317 (7) | ⊕⊕⊕⊕ | ||
| 259 per 1000 | 189 per 1000 | |||||
| Number of UTIs at the end of follow‐up | Study population | RR 0.40 (0.32 to 0.51) | 4257 (6) | ⊕⊕⊕⊕ | ||
| 96 per 1000 | 39 per 1000 | |||||
| Number of pneumonias at the end of follow‐up | Study population | RR 0.95 (0.80 to 1.13) | 4257 (6) | ⊕⊕⊕⊕ | ||
| 111 per 1000 | 105 per 1000 | |||||
| Occurrence of elevated body temperature | Insufficient data. Assessed qualitatively in only 2 studies | |||||
| Rate of serious adverse events | No major side effects of preventive antibiotic therapy were reported. | |||||
| *The absolute risk is calculated using the absolute numbers of events in both study arms. | ||||||
| GRADE Working Group grades of evidence. | ||||||
| aLarge number of included studies, large number of participants, and small confidence interval (ultimately low risk of bias). Good applicability in clinical practice. bLimited publication bias cannot be excluded, as funnel plots for primary outcomes were skewed at the base, towards good outcomes. eDowngraded owing to multiple remarks on GRADE considerations, despite the fact that all remarks can be explained and rectified. | ||||||
| Outcome or subgroup title | No. of studies | No. of participants | Statistical method | Effect size |
| 1 Case fatality at the end of follow‐up Show forest plot | 8 | 4422 | Risk Ratio (M‐H, Random, 95% CI) | 1.03 [0.87, 1.21] |
| 2 Death or dependency at the end of follow‐up Show forest plot | 7 | 4332 | Risk Ratio (M‐H, Random, 95% CI) | 0.99 [0.89, 1.10] |
| Outcome or subgroup title | No. of studies | No. of participants | Statistical method | Effect size |
| 1 Number of infections at the end of follow‐up Show forest plot | 7 | 4317 | Risk Ratio (M‐H, Random, 95% CI) | 0.71 [0.58, 0.88] |
| 2 Number of UTIs at the end of follow‐up Show forest plot | 6 | 4257 | Risk Ratio (M‐H, Random, 95% CI) | 0.40 [0.32, 0.51] |
| 3 Number of pneumonias at the end of follow‐up Show forest plot | 6 | 4257 | Risk Ratio (M‐H, Random, 95% CI) | 0.95 [0.80, 1.13] |
| Outcome or subgroup title | No. of studies | No. of participants | Statistical method | Effect size |
| 1 Functional outcome: low risk of bias studies Show forest plot | 6 | 4191 | Risk Ratio (M‐H, Random, 95% CI) | 1.02 [0.98, 1.06] |
| 2 Number of infections: low risk of bias studies Show forest plot | 6 | 4257 | Risk Ratio (M‐H, Random, 95% CI) | 0.72 [0.58, 0.89] |
| 3 Case fatality: double‐blind design Show forest plot | 2 | 215 | Risk Ratio (M‐H, Fixed, 95% CI) | 1.62 [0.87, 3.00] |
| 4 Case fatality: open‐label design Show forest plot | 5 | 4127 | Risk Ratio (M‐H, Fixed, 95% CI) | 1.03 [0.90, 1.17] |
| 5 Functional outcome: double‐blind design Show forest plot | 2 | 215 | Risk Ratio (M‐H, Fixed, 95% CI) | 1.01 [0.80, 1.27] |
| 6 Functional outcome: open‐label design Show forest plot | 5 | 4117 | Risk Ratio (M‐H, Fixed, 95% CI) | 0.98 [0.93, 1.03] |