抗生素治疗预防急性脑卒中患者感染的发生
Appendices
Appendix 1. CENTRAL search strategy
We used the following search strategy for the Cochrane Stroke Group's Trials Register and the Cochrane Central Register of Controlled Trials (CENTRAL).
-
Stroke AND antibiotics.
-
Haemorrhage AND antibiotics.
-
Stroke AND prophylaxis.
-
Haemorrhage AND prophylaxis.
-
Stroke AND infection.
-
Haemorrhage AND infection.
Appendix 2. MEDLINE Ovid search strategy
We used the following search strategy for MEDLINE Ovid.
-
cerebrovascular disorders/ or exp basal ganglia cerebrovascular disease/ or exp brain ischemia/ or exp carotid artery diseases/ or exp cerebrovascular trauma/ or exp intracranial arterial diseases/ or exp intracranial arteriovenous malformations/ or exp "intracranial embolism and thrombosis"/ or exp intracranial hemorrhages/ or stroke/ or exp brain infarction/ or vasospasm, intracranial/ or vertebral artery dissection/
-
(stroke$ or poststroke$ or cva$ or cerebrovascular$ or cerebral vascular).tw.
-
((cerebral or cerebellar or brain$ or vertebrobasilar) adj5 (infarct$ or isch?emi$ or thrombo$ or apoplexy or emboli$)).tw.
-
((cerebral or intracerebral or intracranial or brain or cerebellar or subarachnoid) adj5 (haemorrhage or hemorrhage or haematoma or hematoma or bleeding or aneurysm)).tw.
-
1 or 2 or 3 or 4
-
Antibiotic Prophylaxis/
-
exp Anti‐Bacterial Agents/
-
(antibiotic$ or anti‐bacterial or anti bacterial or antibacterial or bacteriocid$ or anti‐mycobacterial or anti mycobacterial or antimycobacterial or anti‐infect$ or anti infect$).tw.
-
(amoxicillin or amphotericin b or ampicillin or calcimycin or cephalosporin$ or cephalothin or cephamycin$ or chloramphenicol or dactinomycin or doxycycline or erythromycin or fluoroquinolone$ or gentamicin$ or kanamycin or minocycline or neomycin or oxytetracycline or penicillin or streptomycin or tetracycline or vancomycin).tw.
-
7 or 8 or 9
-
exp infection/ or exp bacterial infections/ or exp infection control/ or exp fever/ or exp inflammation/
-
(infection$ or sepsis or septicaemia or septicemia or pneumonia or bacteremia or bacteraemia or inflammation or fever or blood poisoning).tw.
-
11 or 12
-
(prophyla$ or prevent$ or premedicat$ or incidence or occurrence).tw.
-
prevention control.fs.
-
15 or 14
-
10 and 13 and 16
-
6 or 17
-
5 and 18
Appendix 3. Embase Ovid search strategy
We used the following search strategy for Embase Ovid.
-
cerebrovascular disease/ or basal ganglion hemorrhage/ or exp brain hematoma/ or exp brain hemorrhage/ or exp brain infarction/ or exp brain ischemia/ or exp carotid artery disease/ or exp cerebral artery disease/ or cerebrovascular accident/ or exp cerebrovascular malformation/ or exp intracranial aneurysm/ or exp occlusive cerebrovascular disease/ or stroke/
-
stroke unit/ or stroke patient/
-
(stroke$ or poststroke$ or cva$ or cerebrovascular$ or cerebral vascular).tw.
-
((cerebral or cerebellar or brain$ or vertebrobasilar) adj5 (infarct$ or isch?emi$ or thrombo$ or apoplexy or emboli$)).tw.
-
((cerebral or intracerebral or intracranial or brain or cerebellar or subarachnoid) adj5 (haemorrhage or hemorrhage or haematoma or hematoma or bleeding or aneurysm)).tw.
-
1 or 2 or 3 or 4 or 5
-
antibiotic prophylaxis/
-
exp antibiotic agent/
-
(antibiotic$ or anti‐bacterial or anti bacterial or antibacterial or bacteriocid$ or anti‐mycobacterial or anti mycobacterial or antimycobacterial or anti‐infect$ or anti infect$).tw.
-
(amoxicillin or amphotericin b or ampicillin or calcimycin or cephalosporin$ or cephalothin or cephamycin$ or chloramphenicol or dactinomycin or doxycycline or erythromycin or fluoroquinolone$ or gentamicin$ or kanamycin or minocycline or neomycin or oxytetracycline or penicillin or streptomycin or tetracycline or vancomycin).tw.
-
8 or 9 or 10
-
exp infection/ or infection control/ or infection risk/ or fever/ or exp inflammation/
-
(infection$ or sepsis or septicaemia or septicemia or pneumonia or bacteremia or bacteraemia or inflammation or fever or blood poisoning).tw.
-
12 or 13
-
(prophyla$ or prevent$ or premedicat$ or incidence or occurrence).tw.
-
prophylaxis/
-
16 or 15
-
11 and 14 and 17
-
infection prevention/ or exp infection/pc
-
11 and 19
-
7 or 18 or 20
-
6 and 21
Appendix 4. Clinical trials and research registers search strategy
We used the following search strategy for ClinicalTrials.gov (www.clinicaltrials.gov).
-
Stroke AND antibiotics.
-
Stroke AND infection.
We used the following search strategy for the ISRCTN Registry (www.isrctn.com).
-
Stroke AND antibiotics.
-
Stroke AND infection.
We used the following search strategy for the Stroke Trials Registry (www.strokecenter.org/trials).
-
Antibiotics.
-
Infection.
We used the following search strategy for the WHO Registry Platform (apps.who.int/trialsearch).
-
Stroke AND antibiotics.
-
Stroke AND infection.
Appendix 5. Definitions used for infection
| Source | Definition |
| Temperature > 37.5°C in 2 determinations; or > 37.8°C in a single determination in participants with suggestive symptoms; white blood cell count > 11,000/mL or < 4000/mL; pulmonary infiltrate on chest x‐rays, or cultures positive for a pathogen. Early infection: within 7 days, late: 8 to 90 days | |
| Infectious complications: bronchopulmonary, urinary, or hyperthermia of unspecified origin. No definitions specified | |
| Pneumonia: > 1 of the following: abnormal respiratory examination, or pulmonary infiltrates in chest x‐rays; productive cough with purulent sputum; microbiological cultures from lower respiratory tract or blood cultures; leukocytosis and elevation of C‐reactive protein (CRP). Urinary tract infection (UTI): > 1 of the following: fever (temperature > 38.0°C), urine sample positive for nitrite, leukocyturia, and significant bacteriuria | |
| The algorithm for pneumonia was derived from criteria for pneumonia from the Centers for Disease Control and Prevention that assess 8 clinical or laboratory findings at 6 time points (baseline, 2, 7, 10, and 14 days) for patient’s temperature ≥ 37·5°C on 2 consecutive measurements, or 1 measurement ≥ 38·0°C and a respiratory rate ≥ 20 breaths per minute, or cough and breathlessness, or purulent sputum, and a white blood cell count > 11·0 × 10⁹/L, or chest infiltrates on radiograph, or positive sputum culture or microbiology, or positive blood culture | |
| Not evaluated | |
| Pneumonia: new infiltrate on chest x‐ray compatible with the diagnosis of infection plus ≥ 1 of the following: fever (temperature > 38°C), leukocytosis > 12,000/μL or leukopenia < 3000/μL, purulent tracheal secretions Tracheobronchitis: purulent tracheal secretions or sputum plus ≥ 1 of the following: fever (temperature > 38°C), leukocytosis > 12,000/μL, or leukopenia < 3000/μL UTI: > 25 leukocytes/μL in the urine if not explained by other findings. Bacteraemia: bacteria in blood cultures Sepsis: clinical evidence of an infection with ≥ 2 of the following: temperatures > 38°C or < 35°C, tachycardia > 90/min, tachypnoea > 20/min, leukocytosis > 12,000/μL, or leukopenia < 3000/μL Infection of unclear origin or other infections: clinical evidence of an infection of unknown origin or any other systemic infection | |
| Infection in the control group is diagnosed by the clinician. In the intervention group, presence of an infection is guided by ultrasensitive procalcitonin (PCTus) monitoring. In patients with a PCT concentration > 0·05 ng/mL, a bacterial infection is considered likely, and the use of antibiotics is recommended. The responsible physician will then decide on appropriate treatment based on the suspected type of infection according to CDC criteria. | |
| Infections were categorised as diagnosed by the clinician, and as judged by an independent adjudication committee (masked to treatment allocation) according to modified Centers for Disease Control and Prevention criteria. The scoring algorithms for infections used by this committee have been described previously. |

Risk of bias summary: review authors' judgements about each risk of bias item for each included study, using the Cochrane 'Risk of bias' tool. '+' is defined as low risk of bias, '‐' as high risk of bias, '?' as unclear risk of bias.

Study flow diagram.
Funnel plot of comparison: 1 Forest plot of comparison: primary outcomes, outcome: 1.1 Case fatality at the end of follow‐up.

Funnel plot of comparison: 1 Forest plot of comparison: primary outcomes, outcome: 1.2 Death or dependency at the end of follow‐up.

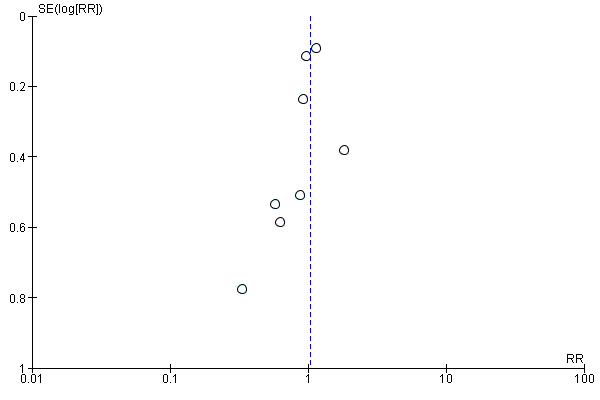
Funnel plot of comparison: 2 Forest plot of comparison: secondary outcomes, outcome: 2.1 Number of infections at the end of follow‐up.
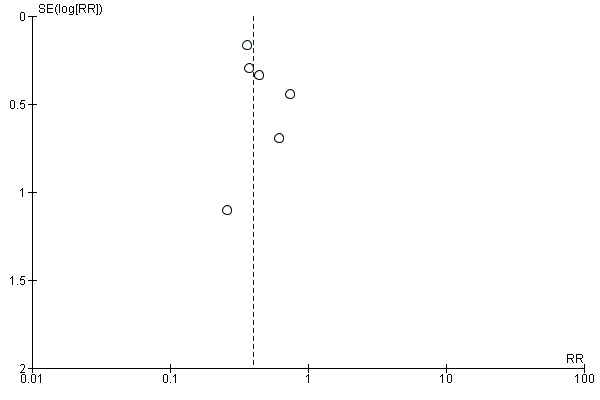
Funnel plot of comparison: 2 Forest plot of comparison: secondary outcomes, outcome: 2.2 Number of UTIs at the end of follow‐up.
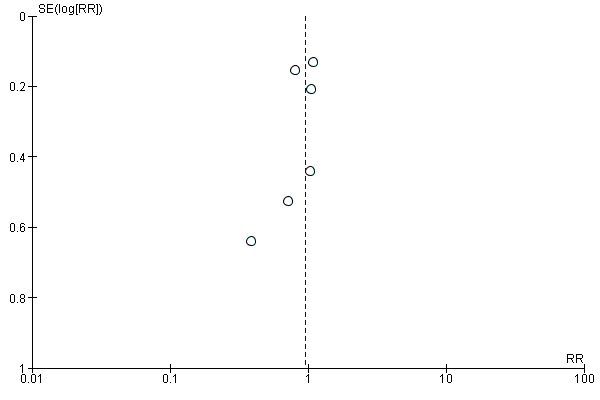
Funnel plot of comparison: 2 Forest plot of comparison: secondary outcomes, outcome: 2.3 Number of pneumonias at the end of follow‐up.

Comparison 1 Forest plot of comparison: primary outcomes, Outcome 1 Case fatality at the end of follow‐up.

Comparison 1 Forest plot of comparison: primary outcomes, Outcome 2 Death or dependency at the end of follow‐up.

Comparison 2 Forest plot of comparison: secondary outcomes, Outcome 1 Number of infections at the end of follow‐up.

Comparison 2 Forest plot of comparison: secondary outcomes, Outcome 2 Number of UTIs at the end of follow‐up.

Comparison 2 Forest plot of comparison: secondary outcomes, Outcome 3 Number of pneumonias at the end of follow‐up.

Comparison 3 Forest plot of comparison: sensitivity analyses, Outcome 1 Functional outcome: low risk of bias studies.
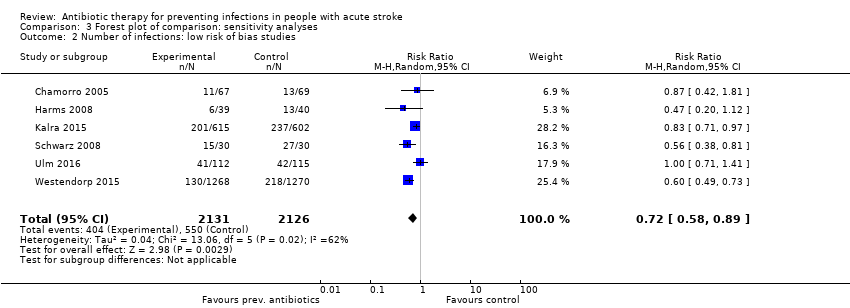
Comparison 3 Forest plot of comparison: sensitivity analyses, Outcome 2 Number of infections: low risk of bias studies.

Comparison 3 Forest plot of comparison: sensitivity analyses, Outcome 3 Case fatality: double‐blind design.

Comparison 3 Forest plot of comparison: sensitivity analyses, Outcome 4 Case fatality: open‐label design.

Comparison 3 Forest plot of comparison: sensitivity analyses, Outcome 5 Functional outcome: double‐blind design.

Comparison 3 Forest plot of comparison: sensitivity analyses, Outcome 6 Functional outcome: open‐label design.
| Preventive antibiotic therapy compared with placebo and/or conventional management in acute stroke | ||||||
| Patient or population: patients with acute ischaemic or haemorrhagic stroke Setting: acute stroke management Intervention: preventive antibiotic therapy for systemic use, at any dose or length of treatment Comparison: placebo and/or conventional acute stroke management | ||||||
| Outcomes | Absolute risk | Relative effect | No. of participants | Quality of the evidence | Comments | |
| Risk with placebo and/or conventional management | Risk with preventive antibiotic treatment | |||||
| Case fatality at the end of follow‐up | Study population | RR 1.03 (0.87 to 1.21) | 4422 (8) | ⊕⊕⊕⊕ | ||
| 163 per 1000 | 169 per 1000 | |||||
| Poor functional outcome at the end of follow‐up | Study population | RR 0.99 (0.89 to 1.10) | 4332 (7) | ⊕⊕⊕⊕ | ||
| 547 per 1000 | 535 per 1000 | |||||
| Number of infections at the end of follow‐up | Study population | RR 0.71 (0.58 to 0.88) | 4317 (7) | ⊕⊕⊕⊕ | ||
| 259 per 1000 | 189 per 1000 | |||||
| Number of UTIs at the end of follow‐up | Study population | RR 0.40 (0.32 to 0.51) | 4257 (6) | ⊕⊕⊕⊕ | ||
| 96 per 1000 | 39 per 1000 | |||||
| Number of pneumonias at the end of follow‐up | Study population | RR 0.95 (0.80 to 1.13) | 4257 (6) | ⊕⊕⊕⊕ | ||
| 111 per 1000 | 105 per 1000 | |||||
| Occurrence of elevated body temperature | Insufficient data. Assessed qualitatively in only 2 studies | |||||
| Rate of serious adverse events | No major side effects of preventive antibiotic therapy were reported. | |||||
| *The absolute risk is calculated using the absolute numbers of events in both study arms. | ||||||
| GRADE Working Group grades of evidence. | ||||||
| aLarge number of included studies, large number of participants, and small confidence interval (ultimately low risk of bias). Good applicability in clinical practice. bLimited publication bias cannot be excluded, as funnel plots for primary outcomes were skewed at the base, towards good outcomes. eDowngraded owing to multiple remarks on GRADE considerations, despite the fact that all remarks can be explained and rectified. | ||||||
| Outcome or subgroup title | No. of studies | No. of participants | Statistical method | Effect size |
| 1 Case fatality at the end of follow‐up Show forest plot | 8 | 4422 | Risk Ratio (M‐H, Random, 95% CI) | 1.03 [0.87, 1.21] |
| 2 Death or dependency at the end of follow‐up Show forest plot | 7 | 4332 | Risk Ratio (M‐H, Random, 95% CI) | 0.99 [0.89, 1.10] |
| Outcome or subgroup title | No. of studies | No. of participants | Statistical method | Effect size |
| 1 Number of infections at the end of follow‐up Show forest plot | 7 | 4317 | Risk Ratio (M‐H, Random, 95% CI) | 0.71 [0.58, 0.88] |
| 2 Number of UTIs at the end of follow‐up Show forest plot | 6 | 4257 | Risk Ratio (M‐H, Random, 95% CI) | 0.40 [0.32, 0.51] |
| 3 Number of pneumonias at the end of follow‐up Show forest plot | 6 | 4257 | Risk Ratio (M‐H, Random, 95% CI) | 0.95 [0.80, 1.13] |
| Outcome or subgroup title | No. of studies | No. of participants | Statistical method | Effect size |
| 1 Functional outcome: low risk of bias studies Show forest plot | 6 | 4191 | Risk Ratio (M‐H, Random, 95% CI) | 1.02 [0.98, 1.06] |
| 2 Number of infections: low risk of bias studies Show forest plot | 6 | 4257 | Risk Ratio (M‐H, Random, 95% CI) | 0.72 [0.58, 0.89] |
| 3 Case fatality: double‐blind design Show forest plot | 2 | 215 | Risk Ratio (M‐H, Fixed, 95% CI) | 1.62 [0.87, 3.00] |
| 4 Case fatality: open‐label design Show forest plot | 5 | 4127 | Risk Ratio (M‐H, Fixed, 95% CI) | 1.03 [0.90, 1.17] |
| 5 Functional outcome: double‐blind design Show forest plot | 2 | 215 | Risk Ratio (M‐H, Fixed, 95% CI) | 1.01 [0.80, 1.27] |
| 6 Functional outcome: open‐label design Show forest plot | 5 | 4117 | Risk Ratio (M‐H, Fixed, 95% CI) | 0.98 [0.93, 1.03] |