Estimulación cortical y cerebral profunda para la epilepsia
Información
- DOI:
- https://doi.org/10.1002/14651858.CD008497.pub3Copiar DOI

- Base de datos:
-
- Cochrane Database of Systematic Reviews
- Versión publicada:
-
- 18 julio 2017see what's new
- Tipo:
-
- Intervention
- Etapa:
-
- Review
- Grupo Editorial Cochrane:
-
Grupo Cochrane de Epilepsia
- Copyright:
-
- Copyright © 2017 The Cochrane Collaboration. Published by John Wiley & Sons, Ltd.
Cifras del artículo
Altmetric:
Citado por:
Autores
Contributions of authors
Mathieu Sprengers, Paul Boon, Evelien Carrette and Kristl Vonck co‐operated in the literature search, data extraction, data analysis and in writing the review. Anthony Marson contributed in the case of disagreements.
Sources of support
Internal sources
-
Dr. M. Miatton, Belgium.
Assistance in the interpretation of the neuropsychological data.
External sources
-
National Institute for Health Research, UK.
This review was supported by the National Institute for Health Research, via Cochrane Infrastructure funding to the Epilepsy Group. The views and opinions expressed therein are those of the authors and do not necessarily reflect those of the Systematic Reviews Programme, NIHR, NHS or the Department of Health.
Declarations of interest
Medtronic Inc has provided support in terms of free devices for a pilot study and an international multicentre randomized trial of hippocampal deep brain stimulation in epilepsy co‐ordinated by Ghent University Hospital.
AGM: A consortium of pharmaceutical companies (GSK, EISAI, UCB Pharma) funded the National Audit of Seizure Management in Hospitals (NASH) through grants paid to the University of Liverpool. Professor Tony Marson is Theme Leader for Managing Complex Needs at NIHR CLAHRC NWC.
Acknowledgements
We thank A Beamond and G Chan for their assistance in the literature search and Dr M Miatton (Ghent University Hospital) for her valuable assistance in the interpretation of the neuropsychological data. Dr M Sprengers is supported by an “FWO‐aspirant” grant (Research Foundation Flanders). Prof Dr K Vonck is supported by a BOF‐ZAP grant from Ghent University Hospital. Prof Dr P Boon is supported by grants from FWO‐Flanders, grants from BOF, and by the Clinical Epilepsy Grant from Ghent University Hospital.
Version history
| Published | Title | Stage | Authors | Version |
| 2017 Jul 18 | Deep brain and cortical stimulation for epilepsy | Review | Mathieu Sprengers, Kristl Vonck, Evelien Carrette, Anthony G Marson, Paul Boon | |
| 2014 Jun 17 | Deep brain and cortical stimulation for epilepsy | Review | Mathieu Sprengers, Kristl Vonck, Evelien Carrette, Anthony G Marson, Paul Boon | |
| 2010 Apr 14 | Deep brain and cerebellar stimulation for epilepsy | Protocol | Paul Boon, Annelies Van Dycke, Evelien Carrette, Anthony G Marson, Kristl Vonck | |
Differences between protocol and review
The title of the review was changed from 'Deep brain and cerebellar stimulation for epilepsy' to 'Deep brain and cortical stimulation for epilepsy' as we thought neocortical stimulation also fits the scope of this review (which may be particularly relevant for future updates of the review).
The percentage seizure frequency reduction was added as an additional outcome measure. This was done in a prespecified way after one author involved in the writing of the protocol (Annelies Van Dycke) was replaced by another author (MS). The reason to do so was to allow a more precise estimation of the efficacy of the different invasive intracranial neurostimulation treatments.
We planned to express the treatment effect for dichotomous outcome measures by risk ratio (RR). However, for reasons outlined in the Methods section, we used odds ratios (OR) and performed a sensitivity analysis with RRs to evaluate any possible influence of this change.
As we judged that (future) trials comparing deep brain or cortical stimulation versus other neurostimulation treatments (e.g. vagus nerve stimulation, other intracranial target,...) might also be relevant to the reader and fit the scope of this review, this type of control group was added to the selection criteria.
We performed various sensitivity analyses and not all of these were mentioned in the initial protocol, including several post‐hoc sensitivity analyses. See Methods section on Sensitivity analysis for more details.
Keywords
MeSH
Medical Subject Headings (MeSH) Keywords
Medical Subject Headings Check Words
Humans;
PICO

Study flow diagram.
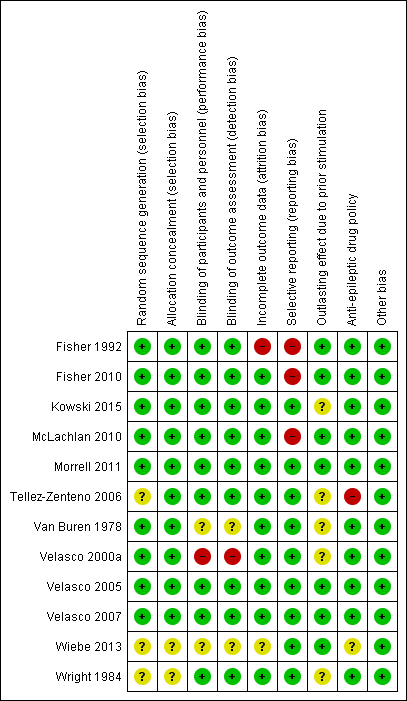
'Risk of bias' summary: review authors' judgements about each risk of bias item for each included study.

Forest plot of comparison: 1 Stimulation versus sham stimulation, outcome: 1.1 Seizure freedom.

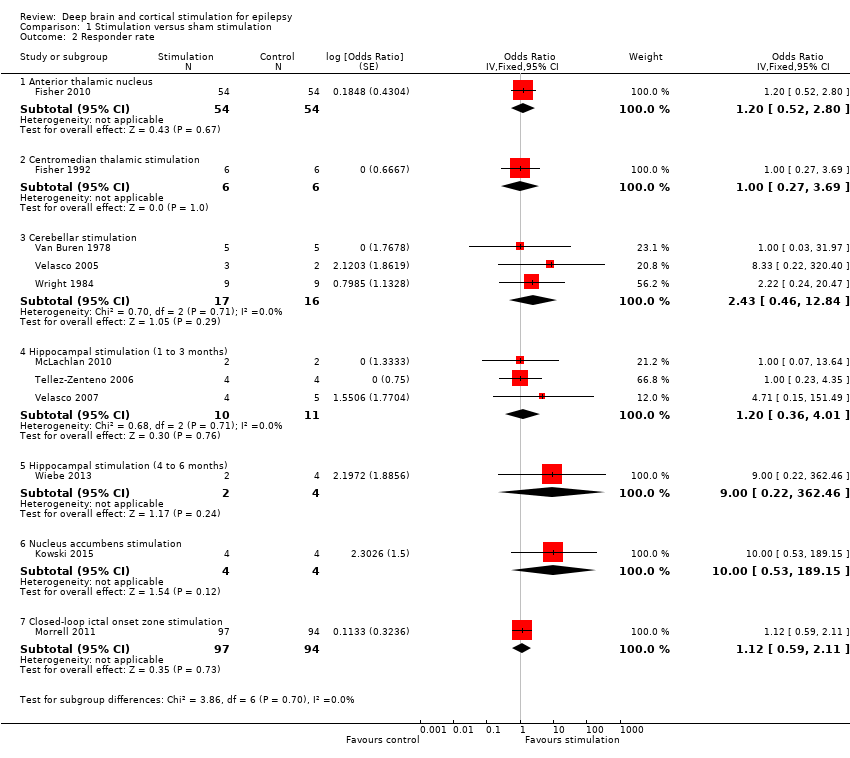
Forest plot of comparison: 1 Stimulation versus sham stimulation, outcome: 1.2 Responder rate.
![Forest plot of comparison: 1 Stimulation versus sham stimulation, outcome: 1.3 Seizure frequency reduction.Note: Fisher 2010 (anterior thalamic nucleus stimulation) and Morrell 2011 (closed‐loop ictal onset zone stimulation) estimated the treatment effect and its standard error on a logarithmic scale, using the generalized estimating equation (GEE) model. As in this figure standard errors could not be inputted on the logarithmic scale, the values for the 95% confidence interval presented here differ slightly from the (more correct) values mentioned in the text. These correct values are ‐17.4% with 95% CI [‐31.2;‐1.0] for Fisher 2010 and ‐24.9% with 95% CI [‐40.1;‐6.0] for Morrell 2011.](/es/cdsr/doi/10.1002/14651858.CD008497.pub3/media/CDSR/CD008497/image_n/nCD008497-AFig-FIG05.png)
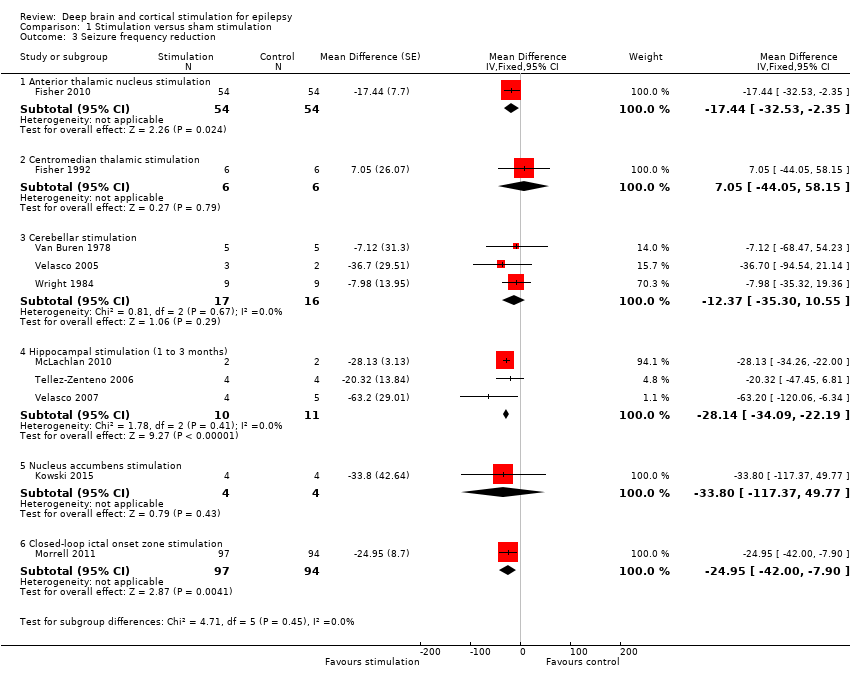
Forest plot of comparison: 1 Stimulation versus sham stimulation, outcome: 1.3 Seizure frequency reduction.
Note: Fisher 2010 (anterior thalamic nucleus stimulation) and Morrell 2011 (closed‐loop ictal onset zone stimulation) estimated the treatment effect and its standard error on a logarithmic scale, using the generalized estimating equation (GEE) model. As in this figure standard errors could not be inputted on the logarithmic scale, the values for the 95% confidence interval presented here differ slightly from the (more correct) values mentioned in the text. These correct values are ‐17.4% with 95% CI [‐31.2;‐1.0] for Fisher 2010 and ‐24.9% with 95% CI [‐40.1;‐6.0] for Morrell 2011.

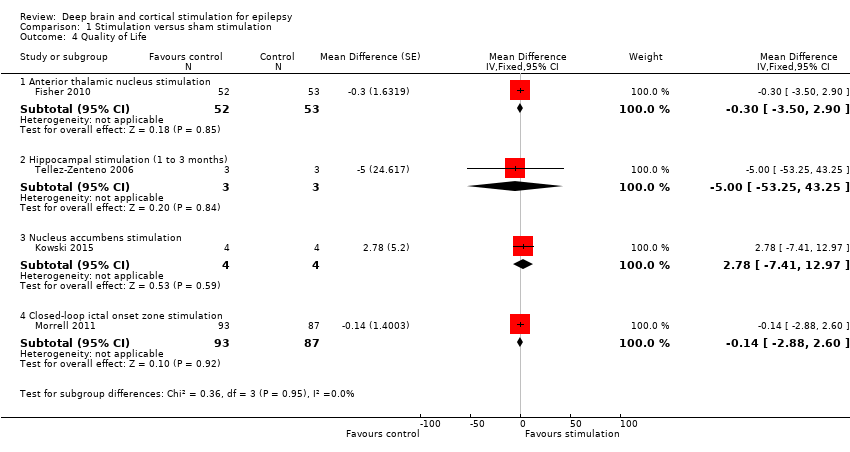
Forest plot of comparison: 1 Stimulation versus sham stimulation, outcome: 1.4 Quality of Life. To measure quality of life, Tellez‐Zenteno 2006 and Morrell 2011 used the QOLIE‐89 questionnaire, Fisher 2010 used the QOLIE‐31 questionnaire (= abbreviated form of the QOLIE‐89 questionnaire) and Kowski 2015 usde the QOLIE‐31‐P questionnaire (slightly modified version of the QOLIE‐31 questionnaire). These questionnaires have the same range and for the QOLIE‐89 and QOLIE‐31 questionnaires very similar means, standard deviations and minimum clinically important change values in the same population have been reported (Cramer 1998; Devinsky 1995; Wiebe 2002). For this reason results from the different trials are presented in one forest plot (see also Methods section). For the QOLIE‐89 and QOLIE‐31 questionnaires, improvements of 5‐11.7 have been defined in literature (Borghs 2012; Cramer 2004; Wiebe 2002) as being clinically meaningful, positive is better.

Comparison 1 Stimulation versus sham stimulation, Outcome 1 Seizure freedom.
Comparison 1 Stimulation versus sham stimulation, Outcome 2 Responder rate.
Comparison 1 Stimulation versus sham stimulation, Outcome 3 Seizure frequency reduction.
Comparison 1 Stimulation versus sham stimulation, Outcome 4 Quality of Life.
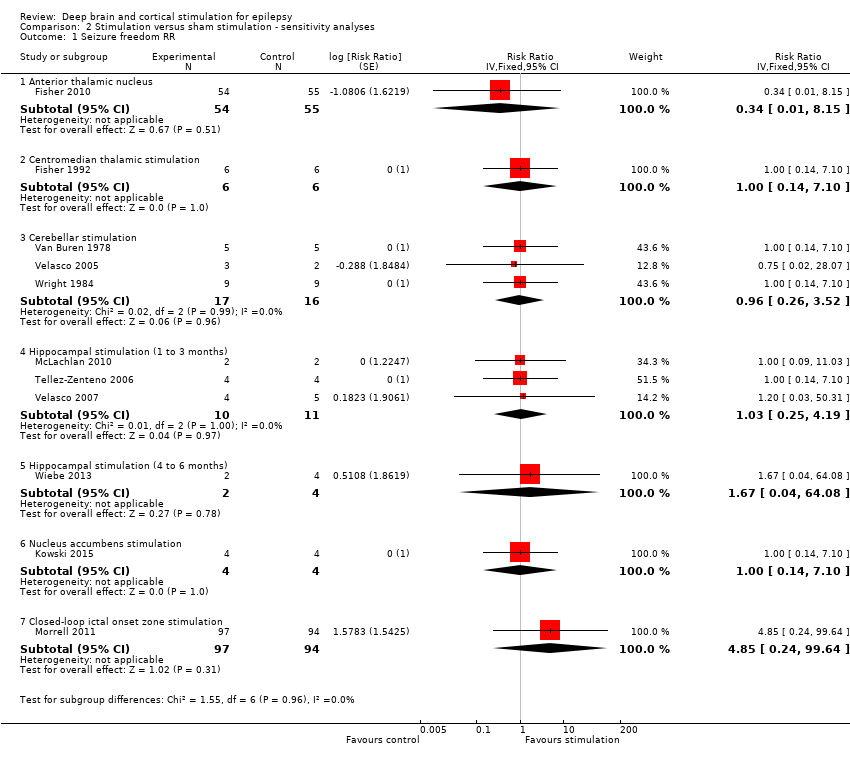
Comparison 2 Stimulation versus sham stimulation ‐ sensitivity analyses, Outcome 1 Seizure freedom RR.

Comparison 2 Stimulation versus sham stimulation ‐ sensitivity analyses, Outcome 2 Responder rate RR.

Comparison 2 Stimulation versus sham stimulation ‐ sensitivity analyses, Outcome 3 Seizure freedom OR 0.25.
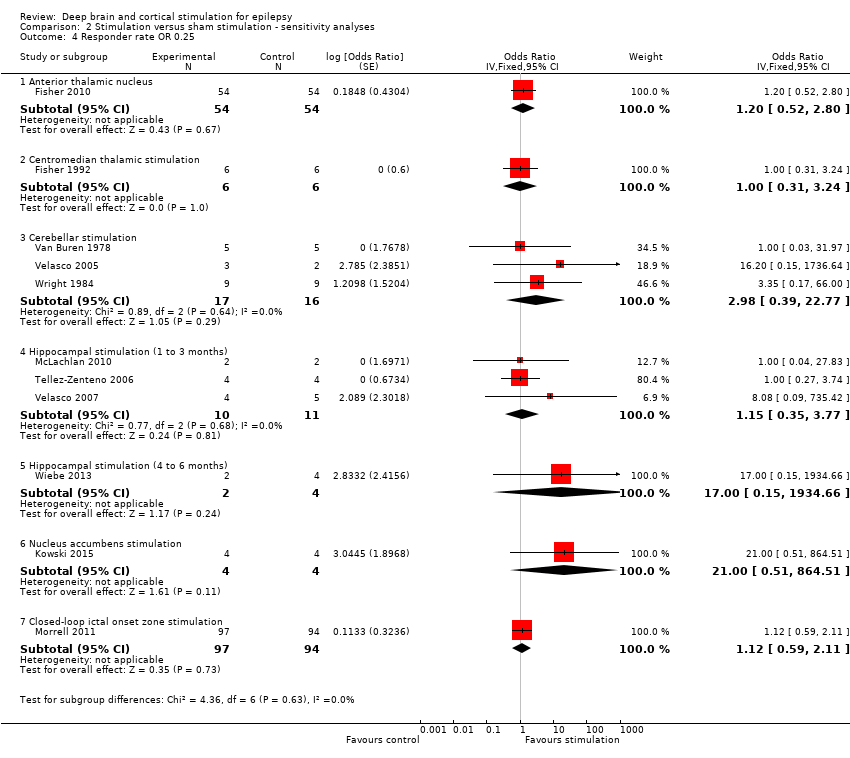
Comparison 2 Stimulation versus sham stimulation ‐ sensitivity analyses, Outcome 4 Responder rate OR 0.25.

Comparison 2 Stimulation versus sham stimulation ‐ sensitivity analyses, Outcome 5 Seizure freedom RR 0.25.
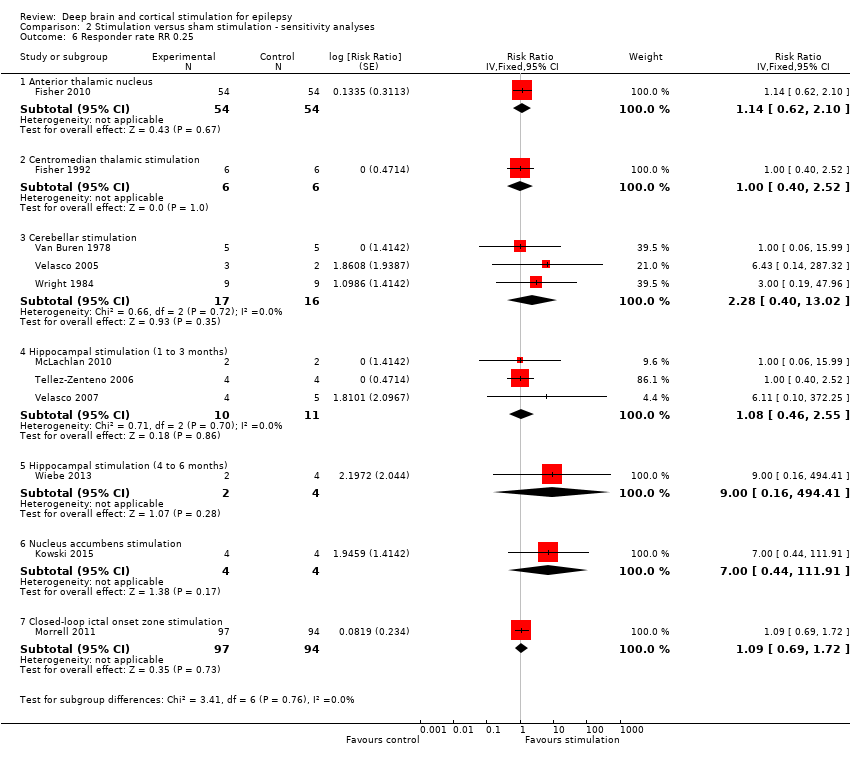
Comparison 2 Stimulation versus sham stimulation ‐ sensitivity analyses, Outcome 6 Responder rate RR 0.25.
| Anterior thalamic nucleus stimulation for refractory epilepsy | ||||||
| Patient or population: adults with IQ > 70 with refractory focal epilepsy Settings: epilepsy centres in the USA Intervention: anterior thalamic nucleus stimulation Comparison: sham stimulation | ||||||
| Outcomes | Illustrative comparative risks* (95% CI) | Relative effect | No of Participants | Quality of the evidence | Comments | |
| Assumed risk | Corresponding risk | |||||
| Sham stimulation | Anterior Thalamic Nucleus stimulation | |||||
| Seizure freedom (3‐month blinded evaluation period) | Observed inFisher 2010 | OR 0.33 (0.01 to 8.36) | 109 | ⊕⊕⊕⊝ | ||
| 1 per 55 | 0 per 54 | |||||
| Low risk population1 | ||||||
| 1 per 1000 | 0 per 1000 | |||||
| High risk population1 | ||||||
| 15 per 1000 | 5 per 1000 | |||||
| Responder rate (3‐month blinded evaluation period) | 26 per 100 | 30 per 100 (15 to 49) | OR 1.20 (0.52 to 2.80) | 108 | ⊕⊕⊕⊝ | |
| Seizure frequency reduction (%) (3‐month blinded evaluation period) | Median monthly seizure frequency reductions ranged from ‐14.5 to ‐28.7% | The mean seizure frequency in the intervention group was | 108 (1) | ⊕⊕⊕⊕ | A trend for increasing efficacy over time was observed during the blinded evaluation period and could result into an underestimation of the treatment effect (treatment effect of month 3: ‐29%). | |
| Adverse events | See comment | See comment | 109 (1) | ⊕⊕⊕⊝ | Stimulation‐related adverse events during the blinded evaluation period include (stimulation versus control): depression (14.8 versus 1.8%, P = 0.02), subjective memory impairment (13.8 versus 1.8%, P = 0.03) and epilepsy‐related injuries (7.4 versus 25.5%, P = 0.01). Standard stimulation parameters could be inappropriate and increase seizure frequency in a small minority of patients.4 Asymptomatic intracranial haemorrhages occurred in 3.7% of participants after the initial implant procedure. In 8.2% of participants leads had to be replaced after initial implantation outside the target. Postoperative implant site infections occurred in 4.5% of participants, increasing to 12.7% after 5 years of follow‐up urging (temporary) hardware removal in 8.2% of participants. Implant site pain was not uncommon (year 1: 10.9%, year 5: 20.9%). SUDEP rate during long‐term (including open‐label) follow‐up was 2.9 per 1000 p‐y which is comparable to rates reported in refractory epilepsy populations (2.2‐10 per 1000 p‐y) (Tellez‐Zenteno 2005; Tomson 2008). | |
| Neuropsychological outcome (3 months) | See comment | See comment | 96‐100 (1) | ⊕⊕⊕⊝ | Changes in neuropsychological test scores for cognition and mood were very similar in the treatment and control group and not significantly different. Individual patient data show worsening (> 1 SD) of Profile of Mood States Depression subscale (POMS‐D) in 3/8 stimulated participants with self‐reported depression and 0/7 patients with subjective memory impairment showed worsening (> 1 SD) of verbal or visual memory scores. | |
| Quality of life (QOLIE‐31) (3 months) | The mean improvement of the QOLIE‐31 score in the control group was +2.8 higher | The mean improvement in QOLIE‐31 score in the intervention group was | 105 (1) | ⊕⊕⊕⊕ | Positive changes in QOLIE‐31 (quality of life in epilepsy 31) scores indicate improvement. Changes of 5‐11.7 have been defined in literature as being clinically meaningful (Borghs 2012; Cramer 2004; Wiebe 2002). | |
| *The basis for the assumed risk (e.g. the median control group risk across studies) is provided in footnotes. The corresponding risk (and its 95% confidence interval) is based on the assumed risk in the comparison group and the relative effect of the intervention (and its 95% CI). | ||||||
| GRADE Working Group grades of evidence | ||||||
| 1 The assumed risks (low and high) are based on the range of the number of events observed in the sham stimulation control groups of all RCTs evaluating deep brain and cortical stimulation in refractory epilepsy patients 2 More trials and patients are needed to allow more precise estimation of stimulation effects (including more rare adverse effects) (GRADE ‐1). 3 The confidence interval includes clinically non‐significant changes (GRADE ‐1), however, the observed trend for increasing efficacy over time probably underestimates the treatment effect (GRADE +1). 4 One participant experienced a spectacular seizure frequency increase after initiation of stimulation, which was reversible after lowering output voltage. New or worse seizures occurred more frequently in the stimulation group compared to the control group but differences did not reach statistical significance. 5 Although clinically meaningful differences in formal neuropsychological testing results seem unlikely on the group level, the discrepancy between objective and subjective measures needs further clarification (GRADE ‐1). | ||||||
| Centromedian thalamic nucleus stimulation for refractory epilepsy | ||||||
| Patient or population: patients with refractory (multi)focal or generalized epilepsy Settings: epilepsy centres in the USA and in Mexico Intervention: centromedian thalamic nucleus stimulation Comparison: sham stimulation | ||||||
| Outcomes | Illustrative comparative risks* (95% CI) | Relative effect | No of Participants | Quality of the evidence | Comments | |
| Assumed risk | Corresponding risk | |||||
| Sham stimulation | Centromedian thalamic nucleus stimulation | |||||
| Seizure freedom (3‐month blinded evaluation period) | Observed inFisher 1992 | OR 1.00 (0.11 to 9.39) | 6 (1)2 | ⊕⊝⊝⊝ | ||
| 0 per 6 | 0 per 6 | |||||
| Low risk population1 | ||||||
| 1 per 1000 | 1 per 1000 | |||||
| High risk population1 | ||||||
| 15 per 1000 | 15 per 1000 | |||||
| Responder rate (3‐month blinded evaluation period) | Low risk population1 | OR 1.00 (0.27 to 3.69) | 6 (1)2 | ⊕⊝⊝⊝ | ||
| 10 per 100 | 10 per 1000 | |||||
| Medium‐high risk population1 | ||||||
| 25 per 100 | 25 per 1000 | |||||
| Seizure frequency reduction (3‐month blinded evaluation period) | The mean seizure frequency reduction in the control group was ‐0.4% | The mean seizure frequency in the intervention groups was | 6 (1)2 | ⊕⊝⊝⊝ | Also another trial (Velasco 2000a) (n = 13) could not demonstrate significant differences between stimulation ON and OFF periods. However, its cross‐over design without any washout period could mask a possible treatment effect. | |
| Adverse events | See comment | See comment | 19 (2)2 21 (2)2 | ⊕⊕⊝⊝ | Stimulation‐related adverse events did not occur. Postoperative CT revealed an asymptomatic and minimal haemorrhage in one patient, 1 patient required repair of the connection to the pulse generator and skin erosion urged device explantation in 3 other patients (including 2 young children). | |
| Neuropsychological outcome (3 months) | See comment | See comment | 6 (1)2 | ⊕⊝⊝⊝ | There were no significant differences in any of the neuropsychological tests between baseline, stimulation ON and OFF periods. | |
| Quality of life | See comment | See comment | 0 (0) | See comment | Impact of centromedian thalamic nucleus stimulation on quality of life has not been studied yet. | |
| *The basis for the assumed risk (e.g. the median control group risk across studies) is provided in footnotes. The corresponding risk (and its 95% confidence interval) is based on the assumed risk in the comparison group and the relative effect of the intervention (and its 95% CI). | ||||||
| GRADE Working Group grades of evidence | ||||||
| 1 The assumed risks (low, medium and high) are based on the range of the number of events observed in the sham stimulation control groups of all RCTs evaluating deep brain and cortical stimulation in refractory epilepsy patients 2 Cross‐over trial(s). 3 No more than one small RCT was identified, resulting into wide 95% confidence intervals (GRADE score ‐2). This is of particular concern for neuropsychological outcome, as no exact figures were reported or could be provided, so evaluation of certain statistically non‐significant trends is not possible. 4 Only 2 hours of intermittent stimulation per day in Fisher 1992 (GRADE score ‐1). 5 Incomplete outcome data may introduce bias (GRADE score ‐1). 6 Number of participants too low to identify less frequent adverse events (GRADE score ‐1) | ||||||
| Cerebellar stimulation for refractory epilepsy | ||||||
| Patient or population: patients with refractory (multi)focal or generalized epilepsy Settings: epilepsy centres in the USA and in Mexico Intervention: stimulation of the superomedial surface of the cerebellum Comparison: sham stimulation | ||||||
| Outcomes | Illustrative comparative risks* (95% CI) | Relative effect | No of Participants | Quality of the evidence | Comments | |
| Assumed risk | Corresponding risk | |||||
| Sham stimulation | Cerebellar stimulation | |||||
| Seizure freedom (1‐ to 3‐month blinded evaluation period) | Observed | OR 0.96 (0.22 to 4.12) | 22 (3)2 | ⊕⊕⊕⊝ | ||
| 0 per 19 | 0 per 20 (not estimable) | |||||
| Low risk population1 | ||||||
| 1 per 1000 | 1 per 1000 | |||||
| High risk population1 | ||||||
| 15 per 1000 | 14 per 1000 | |||||
| Responder rate (1‐ to 3‐month blinded evaluation period) | Low risk population1 | OR 2.43 (0.46 to 12.84) | 19 (3)2 | ⊕⊕⊝⊝ | ||
| 10 per 100 | 21 per 100 | |||||
| Medium‐high risk population1 | ||||||
| 25 per 100 | 45 per 100 | |||||
| Seizure frequency reduction (1‐ to 3‐month blinded evaluation period) | The mean seizure frequency reduction ranged across control groups from 0 to ‐18.8% | The mean seizure frequency in the intervention groups was | 19 (3)2 | ⊕⊕⊝⊝ | ||
| Adverse events | See comment | See comment | 22 (3)2 | ⊕⊕⊝⊝ | Stimulation‐related adverse events were not reported in any of the trials. In contrast, about half of the patients in every trial required repeated surgery due to electrode migration (n = 6), leakage of cerebrospinal fluid (n = 3), wound infection (n = 1), skin erosion (n = 2), lead problems (n = 1), subcutaneous seroma drainage (n = 1) and defective hardware (n = 1). Wound infections were solved with antibiotics only in 2 additional patients. In particular, electrode migration remains of specific concern, even in the most recent trial (Velasco 2005) (occurring in 3/5 patients). | |
| Neuropsychological outcome (1 to 2 months) | See comment | See comment | 16 (2)2 | ⊕⊝⊝⊝ | 'Psychometry' did not reveal any major change in any patient in any phase of the Wright 1984 trial. Comparing ON to OFF stimulation full scale intelligence and memory scores in Van Buren 1978 showed very similar results in two participants, a moderate increase in one patient and a moderate decrease in another. | |
| Quality of life (2 months) | See comment | See comment | 12 (1)7 | ⊕⊝⊝⊝ | Eleven out of 12 patients in Wright 1984 felt better for cerebellar stimulation, but only 5 chose one phase as being different from the others, being either the continuous (n = 2), contingent (n = 1) or no‐stimulation (n = 2) phase. | |
| *The basis for the assumed risk (e.g. the median control group risk across studies) is provided in footnotes. The corresponding risk (and its 95% confidence interval) is based on the assumed risk in the comparison group and the relative effect of the intervention (and its 95% CI). | ||||||
| GRADE Working Group grades of evidence | ||||||
| 1 The assumed risks (low, medium and high) are based on the range of the number of events observed in the sham stimulation control groups of all RCTs evaluating deep brain and cortical stimulation in refractory epilepsy patients 2 Including 2 cross‐over trials: Van Buren 1978 (n = 4‐5) and Wright 1984 (n = 9‐12) 3 The small number of patients leave a considerable amount of uncertainty with regards to stimulation effects (GRADE ‐1). 4Wright 1984 and Van Buren 1978 are cross‐over trials without any washout period which could mask or reduce potential benefits of cerebellar stimulation (and explain some heterogeneity) (GRADE ‐1). 5 Unclear if, how and to what extent stimulation‐related side effects were evaluated in Van Buren 1978 and Wright 1984 (GRADE ‐1). 6 Unclear what neuropsychological tests were performed in Wright 1984 ('psychometry'). Moreover, as testing scores were not published and could not be provided, evaluation of certain statistically non‐significant trends is not possible. Unclear if neuropsychological testing in Van Buren 1978 was done in blinded or unblinded evaluation periods (GRADE‐1). 7 Cross‐over trial: Wright 1984 (n = 12). 8 No formal scoring of quality of life but evaluation of patients' impressions on cerebellar stimulation (GRADE ‐1). | ||||||
| Hippocampal stimulation for refractory epilepsy | ||||||
| Patient or population: patients with refractory medial temporal lobe epilepsy Settings: epilepsy centres in Canada and in Mexico Intervention: hippocampal deep brain stimulation Comparison: sham stimulation | ||||||
| Outcomes | Illustrative comparative risks* (95% CI) | Relative effect | No of Participants | Quality of the evidence | Comments | |
| Assumed risk | Corresponding risk | |||||
| Sham stimulation | Hippocampal stimulation | |||||
| Seizure freedom (1‐ to 3‐month blinded evaluation periods) | Observed | OR 1.03 | 15 (3)2 | ⊕⊕⊕⊝ | Also in Wiebe 20134 no single patient achieved seizure freedom after six months of hippocampal active or sham stimulation. | |
| 0 per 11 | 0 per 10 | |||||
| Low risk population1 | ||||||
| 1 per 1000 | 1 per 1000 | |||||
| High risk population1 | ||||||
| 15 per 1000 | 15 per 1000 | |||||
| Responder rate (1‐ to 3‐month blinded evaluation periods) | Low risk population1 | OR 1.20 (0.36 to 4.01) | 15 (3)2 | ⊕⊕⊝⊝ | In Wiebe 20134there was one responder in the stimulation group (n = 2) compared to none in the sham group (n = 4) after six months of follow‐up. | |
| 10 per 100 | 12 per 100 | |||||
| Medium‐high risk population1 | ||||||
| 25 per 100 | 29 per 100 | |||||
| Seizure frequency (1‐ to 3‐month blinded evaluation periods) | The mean change in seizure frequency ranged across control groups from ‐4.7% to +33.7% | The mean seizure frequency in the intervention groups was | 15 (3)2 | ⊕⊕⊕⊝ | One trial (Tellez‐Zenteno 2006) has a cross‐over design without any washout period which could result into an underestimation of the true treatment effect. In Wiebe 20134 the sham stimulation group reported a median seizure frequency increase of 60% compared to a 45% decrease in the stimulation group after 6 months of follow‐up. | |
| Adverse events | See comment | See comment | 15 (3)2 | ⊕⊕⊝⊝ | There were neither stimulation‐related adverse events, nor early surgical complications. Skin erosion and local infection required explantation after >2 years in 3/9 patients in Velasco 2007. Wiebe 20134 also did not report any adverse event after 6 months of follow‐up. | |
| Neuropsychological outcome (1‐ to 3‐month periods) | See comment | See comment | 6 (2)2 | ⊕⊝⊝⊝ | Neuropsychological test results were the same or very similar during stimulation ON and OFF periods in Tellez‐Zenteno 2006 (n = 4) and in one patient in McLachlan 2010. The other patient in McLachlan 2010 showed worse verbal and visuospatial memory scores when stimulated, notwithstanding that he reported subjective memory improvement during the same period. At seven months in Wiebe 20134, scores of cognitive scales assessing recall (Rey Auditory Verbal Learning Test, Rey Complex Figure Test) were generally lower in the active stimulation compared to the sham group (p>0.05). | |
| Quality of life (QOLIE‐89) (1‐ to 3‐month periods) | The mean QOLIE‐89 score in the control group was 60 | The mean QOLIE‐89 in the intervention group was ‐5 lower (‐53 lower to +43 higher). | 3 (1)7 | ⊕⊝⊝⊝ | Positive changes in QOLIE‐89 (quality of life in epilepsy 89) scores indicate improvement. Changes of 5‐11.7 have been defined in literature as being clinically meaningful (Borghs 2012; Cramer 2004; Wiebe 2002). The overall QOLIE‐89 score at seven months in Wiebe 20134 worsened by 13 points with sham stimulation compared to an improvement of 3 points with active stimulation (p>0.05), and there was a trend for increased QOLIE‐89 subjective memory and attention/concentration scores. | |
| *The basis for the assumed risk (e.g. the median control group risk across studies) is provided in footnotes. The corresponding risk (and its 95% confidence interval) is based on the assumed risk in the comparison group and the relative effect of the intervention (and its 95% CI). | ||||||
| GRADE Working Group grades of evidence | ||||||
| 1 The assumed risks (low, medium and high) are based on the range of the number of events observed in the sham stimulation control groups of all RCTs evaluating deep brain and cortical stimulation in refractory epilepsy patients 2 Including two cross‐over trials: McLachlan 2010 (n = 2) and Tellez‐Zenteno 2006 (n = 4) 3 The small number of patients preclude more definitive judgements on effects of hippocampal stimulation (GRADE ‐1). 4Wiebe 2013 is a small parallel‐group RCT (n = 6) with a 6‐month blinded evaluation period. As there were no more than 2 participants in the active stimulation group and details needed for full methodological assessment are missing, the quality of the evidence is very low and we decided not to create separate 6‐month outcomes or a separate summary of findings table but only to describe the results. As the results of the first 3‐month epoch were not reported, the data of this trial could not be combined with the other trials evaluating one to three months of hippocampal stimulation. However, the reported six‐month results are generally compatible and in line with the estimated three‐month results. For more details and a sensitivity analysis combining all trials on hippocampal stimulation irrespective of the BEP duration, see text. 5 One trial (Tellez‐Zenteno 2006) had a cross‐over design without any washout period and allowed important changes in antiepileptic drugs, both of which could reduce or mask more important treatment effects. See also 'Sensitivity analyses' (GRADE ‐1). 6 Number of patients is too low to identify less frequent adverse events or changes in neuropsychological outcome or quality of life (GRADE‐score ‐2). 7 One cross‐over trial: Tellez‐Zenteno 2006 (n = 3) | ||||||
| Nucleus accumbens stimulation for refractory epilepsy | ||||||
| Patient or population: adults with IQ >70 with refractory focal epilepsy Settings: epilepsy centre in Germany Intervention: nucleus accumbens stimulation Comparison: sham stimulation | ||||||
| Outcomes | Illustrative comparative risks* (95% CI) | Relative effect | No of Participants | Quality of the evidence | Comments | |
| Assumed risk | Corresponding risk | |||||
| Sham stimulation | Nucleus accumbens stimulation | |||||
| Seizure freedom (3‐month blinded evaluation period) | Observed inKowski 2015 | OR 1.00 (0.07 to 13.64) | 4 (1)2 | ⊕⊕⊝⊝ | ||
| 0 per 4 | 0 per 4 (not estimable) | |||||
| Low risk population1 | ||||||
| 1 per 1000 | 1 per 1000 | |||||
| High risk population1 | ||||||
| 15 per 1000 | 15 per 1000 (0 to 172) | |||||
| Responder rate (3‐month blinded evaluation period) | Low risk population1 | OR 10.0 (0.53 to 189.15) | 4 (1)2 | ⊕⊕⊝⊝ | ||
| 10 per 100 | 53 per 100 | |||||
| Medium risk population1 | ||||||
| 25 per 100 | 77 per 100 | |||||
| Seizure frequency reduction (3‐month blinded evaluation period) | The mean change in seizure frequency in the control group was ‐13.8% | The mean seizure frequency in the intervention group was (‐100% lower to +49.8% higher) | 4 (1)2 | ⊕⊕⊝⊝ | When focusing on 'disabling seizures' only and excluding simple partial seizures (occurring in one patient), the mean change in seizure frequency in the control group was +8.2% with a ‐22.9% lower seizure frequency in the intervention group (‐100 lower to +94.0 higher) | |
| Adverse events | See comment | See comment | 4 (1)2 | ⊕⊕⊝⊝ | Except for one patient feeling sad for two weeks during the active stimulation period after a close relative had died, there were no adverse events that were exclusively linked to the active stimulation period (although various adverse events were reported in the sham and the active stimulation group, see text). One patient developed a local subcutaneous infection with colonization of the pulse generator and the leads 2 weeks post‐surgery urging antibiotic therapy and temporary hardware removal. | |
| Neuropsychological outcome (3 months) | See comment | See comment | 4 (1)2 | ⊕⊕⊝⊝ | Neurocognitive test scores were similar and not statistically significantly different during sham and active stimulation in this small trial. There were no categorical changes in Beck‐Depression‐Inventory scores during the BEP. However, the Mini International Neuropsychiatric Interview revealed a new‐onset major depression under nucleus accumbens stimulation in one patient, besides an ongoing low suicidal risk following one suicide attempt 10 years before the trial in another patient. | |
| Quality of Life (QOLIE‐31‐P) (3 months) | The mean change in the QOLIE‐31‐P score in the control group was ‐4.9 lower | The mean change in the QOLIE‐31‐P score in the intervention group was +2.8 higher (‐7.4 lower to +13.0 higher) | 4 (1)2 | ⊕⊕⊝⊝ | The QOLIE‐31‐P is a (slightly) modified version of the QOLIE‐31 questionnaire for which changes of 5 to 11.7 have been defined in the literature (Cramer 2004; Wiebe 2002; Borghs 2012) as being clinically meaningful; positive scores indicate improvement. | |
| *The basis for the assumed risk (e.g. the median control group risk across studies) is provided in footnotes. The corresponding risk (and its 95% confidence interval) is based on the assumed risk in the comparison group and the relative effect of the intervention (and its 95% CI). | ||||||
| GRADE Working Group grades of evidence | ||||||
| 1 The assumed risks (low, medium and high) are based on the range of the number of events observed in the sham stimulation control groups of all RCTs evaluating deep brain and cortical stimulation in refractory epilepsy patients 2 Cross‐over trial 3No more than one small RCT was identified which leaves a considerable amount of uncertainty with regards to stimulation effects (GRADE score ‐2). | ||||||
| Closed‐loop stimulation of the ictal onset zone for refractory epilepsy | ||||||
| Patient or population: adults with refractory focal epilepsy (1 or 2 epileptogenic regions) Settings: epilepsy centres in the USA Intervention: responsive stimulation of the ictal onset zone(s) Comparison: sham stimulation | ||||||
| Outcomes | Illustrative comparative risks* (95% CI) | Relative effect | No of Participants | Quality of the evidence | Comments | |
| Assumed risk | Corresponding risk | |||||
| Sham stimulation | Responsive ictal onset zone stimulation | |||||
| Seizure freedom (3‐month blinded evaluation period) | Observed inMorrell 2011 | OR 4.95 (0.23 to 104.44) | 191 (1) | ⊕⊕⊕⊝ | ||
| 0 per 94 | 2 per 97 (not estimable) | |||||
| Low risk population1 | ||||||
| 1 per 1000 | 5 per 1000 (0 to 95) | |||||
| High risk population1 | ||||||
| 15 per 1000 | 70 per 1000 | |||||
| Responder rate (3‐month blinded evaluation period) | 27 per 100 | 29 per 100 | OR 1.12 (0.59 to 2.11) | 191 (1) | ⊕⊕⊕⊝ | |
| Seizure frequency reduction (3‐month blinded evaluation period) | The mean estimated seizure frequency reduction in the control group was ‐17.3% | The mean seizure frequency in the intervention group was | 191 (1) | ⊕⊕⊕⊕ | A trend for increasing efficacy over time was observed during the blinded evaluation period and could result into an underestimation of the treatment effect (treatment effect of month 3: ‐32%). | |
| Adverse events | See comment | See comment | 191 (1) 256 (2) | ⊕⊕⊕⊝ | Adverse events during the blinded evaluation period were rare and there were no significant differences between the treatment and control group. Asymptomatic intracranial haemorrhages considered as serious adverse event were found postoperatively in 1.6% of participants. Postoperative implant or incision site infection occurred in 2.0% of participants, increasing to 9.4% of participants after 5 years of follow‐up (additional cases mainly upon battery replacement; urge for (temporary) explantation in the majority of cases). Cranial implantation of the neurostimulator was the probable cause of most adverse events, which include: implant site pain (16% during the first year of the trial), headache (11%), procedural headache (9%) and dysaesthesia (6%). Although the SUDEP rate (4 SUDEPs over 340 patient‐years = 11.8 per 1000 patient‐years) reported in the initial manuscript was slightly higher than those usually reported in refractory epilepsy patients (2.2 to 10 per 1000 p‐y) (Tellez‐Zenteno 2005; Tomson 2008), long‐term open‐label follow‐up has now reported reassuring figures (SUDEP rates of 3.5 per 1000 implant p‐y or 2.6 per 1000 stimulation p‐y). | |
| Neuropsychological outcome (3 months) | See comment | See comment | 160‐177 | ⊕⊕⊕⊕ | Changes in neuropsychological testing results were very similar in both groups and 95% confidence intervals did not include clinically meaningful differences. | |
| Quality of life (QOLIE‐89) (3 months) | The mean improvement of the QOLIE‐31 score in the control group was +2.18 higher | The mean improvement in QOLIE‐31 score in the intervention group was | 180 | ⊕⊕⊕⊕ | Positive changes in QOLIE‐89 (quality of life in epilepsy 89) scores indicate improvement. Changes of 5‐11.7 have been defined in literature as being clinically meaningful (Borghs 2012; Cramer 2004; Wiebe 2002). | |
| *The basis for the assumed risk (e.g. the median control group risk across studies) is provided in footnotes. The corresponding risk (and its 95% confidence interval) is based on the assumed risk in the comparison group and the relative effect of the intervention (and its 95% CI). | ||||||
| GRADE Working Group grades of evidence | ||||||
| 1 The assumed risks (low and high) are based on the range of the number of events observed in the sham stimulation control groups of all RCTs evaluating deep brain and cortical stimulation in refractory epilepsy patients 2 More trials and patients are needed to allow more precise estimation of stimulation effects (GRADE ‐1). 3 The confidence interval includes clinically non‐significant changes (GRADE ‐1), however, the observed trend for increasing efficacy over time probably underestimates the treatment effect (GRADE +1). | ||||||
| Outcome or subgroup title | No. of studies | No. of participants | Statistical method | Effect size |
| 1 Seizure freedom Show forest plot | 11 | Odds Ratio (Fixed, 95% CI) | Subtotals only | |
| 1.1 Anterior thalamic nucleus | 1 | 109 | Odds Ratio (Fixed, 95% CI) | 0.33 [0.01, 8.36] |
| 1.2 Centromedian thalamic stimulation | 1 | 12 | Odds Ratio (Fixed, 95% CI) | 1.0 [0.11, 9.39] |
| 1.3 Cerebellar stimulation | 3 | 39 | Odds Ratio (Fixed, 95% CI) | 0.96 [0.22, 4.12] |
| 1.4 Hippocampal stimulation (1 to 3 months) | 3 | 21 | Odds Ratio (Fixed, 95% CI) | 1.03 [0.21, 5.15] |
| 1.5 Hippocampal stimulation (4 to 6 months) | 1 | 6 | Odds Ratio (Fixed, 95% CI) | 1.80 [0.03, 121.68] |
| 1.6 Nucleus accumbens stimulation | 1 | 8 | Odds Ratio (Fixed, 95% CI) | 1.0 [0.07, 13.64] |
| 1.7 Closed‐loop ictal onset zone stimulation | 1 | 191 | Odds Ratio (Fixed, 95% CI) | 4.95 [0.23, 104.44] |
| 2 Responder rate Show forest plot | 11 | Odds Ratio (Fixed, 95% CI) | Subtotals only | |
| 2.1 Anterior thalamic nucleus | 1 | 108 | Odds Ratio (Fixed, 95% CI) | 1.20 [0.52, 2.80] |
| 2.2 Centromedian thalamic stimulation | 1 | 12 | Odds Ratio (Fixed, 95% CI) | 1.0 [0.27, 3.69] |
| 2.3 Cerebellar stimulation | 3 | 33 | Odds Ratio (Fixed, 95% CI) | 2.43 [0.46, 12.84] |
| 2.4 Hippocampal stimulation (1 to 3 months) | 3 | 21 | Odds Ratio (Fixed, 95% CI) | 1.20 [0.36, 4.01] |
| 2.5 Hippocampal stimulation (4 to 6 months) | 1 | 6 | Odds Ratio (Fixed, 95% CI) | 9.00 [0.22, 362.46] |
| 2.6 Nucleus accumbens stimulation | 1 | 8 | Odds Ratio (Fixed, 95% CI) | 10.00 [0.53, 189.15] |
| 2.7 Closed‐loop ictal onset zone stimulation | 1 | 191 | Odds Ratio (Fixed, 95% CI) | 1.12 [0.59, 2.11] |
| 3 Seizure frequency reduction Show forest plot | 10 | Mean Difference (Fixed, 95% CI) | Subtotals only | |
| 3.1 Anterior thalamic nucleus stimulation | 1 | 108 | Mean Difference (Fixed, 95% CI) | ‐17.44 [‐32.53, ‐2.35] |
| 3.2 Centromedian thalamic stimulation | 1 | 12 | Mean Difference (Fixed, 95% CI) | 7.05 [‐44.05, 58.15] |
| 3.3 Cerebellar stimulation | 3 | 33 | Mean Difference (Fixed, 95% CI) | ‐12.37 [‐35.30, 10.55] |
| 3.4 Hippocampal stimulation (1 to 3 months) | 3 | 21 | Mean Difference (Fixed, 95% CI) | ‐28.14 [‐34.09, ‐22.19] |
| 3.5 Nucleus accumbens stimulation | 1 | 8 | Mean Difference (Fixed, 95% CI) | ‐33.8 [‐117.37, 49.77] |
| 3.6 Closed‐loop ictal onset zone stimulation | 1 | 191 | Mean Difference (Fixed, 95% CI) | ‐24.95 [‐42.00, ‐7.90] |
| 4 Quality of Life Show forest plot | 4 | Mean Difference (Fixed, 95% CI) | Subtotals only | |
| 4.1 Anterior thalamic nucleus stimulation | 1 | 105 | Mean Difference (Fixed, 95% CI) | ‐0.3 [‐3.50, 2.90] |
| 4.2 Hippocampal stimulation (1 to 3 months) | 1 | 6 | Mean Difference (Fixed, 95% CI) | ‐5.0 [‐53.25, 43.25] |
| 4.3 Nucleus accumbens stimulation | 1 | 8 | Mean Difference (Fixed, 95% CI) | 2.78 [‐7.41, 12.97] |
| 4.4 Closed‐loop ictal onset zone stimulation | 1 | 180 | Mean Difference (Fixed, 95% CI) | ‐0.14 [‐2.88, 2.60] |
| Outcome or subgroup title | No. of studies | No. of participants | Statistical method | Effect size |
| 1 Seizure freedom RR Show forest plot | 11 | Risk Ratio (Fixed, 95% CI) | Subtotals only | |
| 1.1 Anterior thalamic nucleus | 1 | 109 | Risk Ratio (Fixed, 95% CI) | 0.34 [0.01, 8.15] |
| 1.2 Centromedian thalamic stimulation | 1 | 12 | Risk Ratio (Fixed, 95% CI) | 1.0 [0.14, 7.10] |
| 1.3 Cerebellar stimulation | 3 | 33 | Risk Ratio (Fixed, 95% CI) | 0.96 [0.26, 3.52] |
| 1.4 Hippocampal stimulation (1 to 3 months) | 3 | 21 | Risk Ratio (Fixed, 95% CI) | 1.03 [0.25, 4.19] |
| 1.5 Hippocampal stimulation (4 to 6 months) | 1 | 6 | Risk Ratio (Fixed, 95% CI) | 1.67 [0.04, 64.08] |
| 1.6 Nucleus accumbens stimulation | 1 | 8 | Risk Ratio (Fixed, 95% CI) | 1.0 [0.14, 7.10] |
| 1.7 Closed‐loop ictal onset zone stimulation | 1 | 191 | Risk Ratio (Fixed, 95% CI) | 4.85 [0.24, 99.64] |
| 2 Responder rate RR Show forest plot | 11 | Risk Ratio (Fixed, 95% CI) | Subtotals only | |
| 2.1 Anterior thalamic nucleus | 1 | 108 | Risk Ratio (Fixed, 95% CI) | 1.14 [0.62, 2.10] |
| 2.2 Centromedian thalamic stimulation | 1 | 12 | Risk Ratio (Fixed, 95% CI) | 1.0 [0.38, 2.66] |
| 2.3 Cerebellar stimulation | 3 | 33 | Risk Ratio (Fixed, 95% CI) | 2.00 [0.51, 7.86] |
| 2.4 Hippocampal stimulation (1 to 3 months) | 3 | 21 | Risk Ratio (Fixed, 95% CI) | 1.12 [0.47, 2.66] |
| 2.5 Hippocampal stimulation (4 to 6 months) | 1 | 6 | Risk Ratio (Fixed, 95% CI) | 5.00 [0.29, 87.54] |
| 2.6 Nucleus accumbens stimulation | 1 | 8 | Risk Ratio (Fixed, 95% CI) | 4.00 [0.56, 28.40] |
| 2.7 Closed‐loop ictal onset zone stimulation | 1 | 191 | Risk Ratio (Fixed, 95% CI) | 1.09 [0.69, 1.72] |
| 3 Seizure freedom OR 0.25 Show forest plot | 11 | Odds Ratio (Fixed, 95% CI) | Subtotals only | |
| 3.1 Anterior thalamic nucleus | 1 | 109 | Odds Ratio (Fixed, 95% CI) | 0.20 [0.00, 15.17] |
| 3.2 Centromedian thalamic stimulation | 1 | 12 | Odds Ratio (Fixed, 95% CI) | 1.0 [0.05, 19.79] |
| 3.3 Cerebellar stimulation | 3 | 33 | Odds Ratio (Fixed, 95% CI) | 0.96 [0.13, 6.83] |
| 3.4 Hippocampal stimulation (1 to 3 months) | 3 | 21 | Odds Ratio (Fixed, 95% CI) | 1.03 [0.13, 8.41] |
| 3.5 Hippocampal stimulation (4 to 6 months) | 1 | 6 | Odds Ratio (Fixed, 95% CI) | 1.89 [0.01, 608.05] |
| 3.6 Nucleus accumbens stimulation | 1 | 8 | Odds Ratio (Fixed, 95% CI) | 1.0 [0.04, 27.83] |
| 3.7 Closed‐loop ictal onset zone stimulation | 1 | 191 | Odds Ratio (Fixed, 95% CI) | 8.91 [0.14, 560.31] |
| 4 Responder rate OR 0.25 Show forest plot | 11 | Odds Ratio (Fixed, 95% CI) | Subtotals only | |
| 4.1 Anterior thalamic nucleus | 1 | 108 | Odds Ratio (Fixed, 95% CI) | 1.20 [0.52, 2.80] |
| 4.2 Centromedian thalamic stimulation | 1 | 12 | Odds Ratio (Fixed, 95% CI) | 1.0 [0.31, 3.24] |
| 4.3 Cerebellar stimulation | 3 | 33 | Odds Ratio (Fixed, 95% CI) | 2.98 [0.39, 22.77] |
| 4.4 Hippocampal stimulation (1 to 3 months) | 3 | 21 | Odds Ratio (Fixed, 95% CI) | 1.15 [0.35, 3.77] |
| 4.5 Hippocampal stimulation (4 to 6 months) | 1 | 6 | Odds Ratio (Fixed, 95% CI) | 17.00 [0.15, 1934.66] |
| 4.6 Nucleus accumbens stimulation | 1 | 8 | Odds Ratio (Fixed, 95% CI) | 21.00 [0.51, 864.51] |
| 4.7 Closed‐loop ictal onset zone stimulation | 1 | 191 | Odds Ratio (Fixed, 95% CI) | 1.12 [0.59, 2.11] |
| 5 Seizure freedom RR 0.25 Show forest plot | 11 | Risk Ratio (Fixed, 95% CI) | Subtotals only | |
| 5.1 Anterior thalamic nucleus | 1 | 109 | Risk Ratio (Fixed, 95% CI) | 0.21 [0.00, 14.95] |
| 5.2 Centromedian thalamic stimulation | 1 | 12 | Risk Ratio (Fixed, 95% CI) | 1.0 [0.06, 15.99] |
| 5.3 Cerebellar stimulation | 3 | 33 | Risk Ratio (Fixed, 95% CI) | 0.96 [0.15, 6.04] |
| 5.4 Hippocampal stimulation (1 to 3 months) | 3 | 21 | Risk Ratio (Fixed, 95% CI) | 1.02 [0.16, 6.46] |
| 5.5 Hippocampal stimulation (4 to 6 months) | 1 | 6 | Risk Ratio (Fixed, 95% CI) | 1.80 [0.01, 369.24] |
| 5.6 Nucleus accumbens stimulation | 1 | 8 | Risk Ratio (Fixed, 95% CI) | 1.0 [0.06, 15.99] |
| 5.7 Closed‐loop ictal onset zone stimulation | 1 | 191 | Risk Ratio (Fixed, 95% CI) | 8.72 [0.14, 538.18] |
| 6 Responder rate RR 0.25 Show forest plot | 11 | Risk Ratio (Fixed, 95% CI) | Subtotals only | |
| 6.1 Anterior thalamic nucleus | 1 | 108 | Risk Ratio (Fixed, 95% CI) | 1.14 [0.62, 2.10] |
| 6.2 Centromedian thalamic stimulation | 1 | 12 | Risk Ratio (Fixed, 95% CI) | 1.0 [0.40, 2.52] |
| 6.3 Cerebellar stimulation | 3 | 33 | Risk Ratio (Fixed, 95% CI) | 2.28 [0.40, 13.02] |
| 6.4 Hippocampal stimulation (1 to 3 months) | 3 | 21 | Risk Ratio (Fixed, 95% CI) | 1.08 [0.46, 2.55] |
| 6.5 Hippocampal stimulation (4 to 6 months) | 1 | 6 | Risk Ratio (Fixed, 95% CI) | 9.00 [0.16, 494.41] |
| 6.6 Nucleus accumbens stimulation | 1 | 8 | Risk Ratio (Fixed, 95% CI) | 7.00 [0.44, 111.91] |
| 6.7 Closed‐loop ictal onset zone stimulation | 1 | 191 | Risk Ratio (Fixed, 95% CI) | 1.09 [0.69, 1.72] |