Estimulação cerebral profunda e estimulação cortical na epilepsia
Resumo
Introdução
Apesar de receberem um tratamento otimizado, incluindo cirurgia para epilepsia, muitos pacientes com epilepsia têm convulsões incontroláveis. Desde a década de 1970, o interesse sobre a neuroestimulação invasiva intracraniana como uma opção de tratamento para esses pacientes vem aumentado. A estimulação intracraniana inclui a estimulação cerebral profunda (DBS, estimulação através de eletrodos profundos) e a estimulação cortical (eletrodos subdurais). Esta é uma atualização de uma revisão Cochrane publicada previamente em 2014.
Objetivos
Avaliar a eficácia, segurança e tolerabilidade da DBS e da estimulação cortical para epilepsia refratária a partir de ensaios clínicos randomizados controlados (RCTs).
Métodos de busca
Realizamos buscas no Cochrane Epilepsy Group Specialized Register em 29 de setembro de 2015, mas não foi necessário atualizar essa pesquisa porque os registros no Specialized Register estão incluídos no CENTRAL. Pesquisamos o Cochrane Central Register of Controlled Trials (CENTRAL) (Cochrane Library 2016, Edição 11, 5 de novembro de 2016), PubMed (5 de novembro de 2016), ClinicalTrials.gov (5 de novembro de 2016), a WHO International Clinical Trials Registry Platform ICTRP (5 de novembro de 2016) e as listas de referência dos artigos identificados. Também contatamos os fabricantes de aparelhos e outros pesquisadores da área. Não houve restrições de idiomas.
Critério de seleção
Incluímos RCTs que compararam a estimulação profunda ou a estimulação cortical versus estimulação simulada, cirurgia de ressecção, tratamento adicional com medicamentos antiepilépticos ou outros tratamentos de neuroestimulação (incluindo a estimulação do nervo vago).
Coleta dos dados e análises
Quatro revisores independentes selecionaram os estudos para inclusão. Dois revisores independentes extraíram os dados relevantes e avaliaram a qualidade dos estudos e a qualidade geral da evidência. Os desfechos investigados foram: ausência de convulsão, taxa de resposta, porcentagem de redução da frequência de convulsões, eventos adversos, desfecho neuropsicológico e qualidade de vida. Quando necessário, contatamos os autores dos estudos para obter dados adicionais. Devido à heterogeneidade clínica, analisamos e apresentamos os resultados separadamente de acordo com as diferentes regiões anatômicas intracranianas que receberam a neuroestimulação.
Principais resultados
Identificamos 12 RCTs; 11 compararam a neuroestimulação intracraniana por um a três meses versus estimulação simulada. Um estudo foi sobre DBS na região talâmica anterior (n = 109; 109 períodos de tratamento). Dois estudos foram sobre o DBS na região talâmica centromedial (n = 20; 40 períodos de tratamento), mas apenas um dos estudos (n = 7; 14 períodos de tratamento) trazia informação suficiente para inclusão na meta‐análise quantitativa. Três estudos foram com estimulação cerebelar (n = 22; 39 períodos de tratamento). Três estudos foram sobre DBS no hipocampo (n = 15; 21 períodos de tratamento). Um estudo foi sobre DBS no núcleo accumbens (n = 4; 8 períodos de tratamento). Um estudo foi sobre estimulação da zona ictal responsiva inicial (n = 191; 191 períodos de tratamento). Além disso, um pequeno RCT (n = 6) comparou seis meses de DBS no hipocampo versus estimulação simulada. Em quatro estudos, encontramos evidência de relato seletivo. Cinco estudos cross‐over não tinham nenhum período de intervalo (ou um período de intervalo insuficiente); esse fato complicou a interpretação dos resultados.Existe evidência de qualidade moderada de ausência de efeitos estatisticamente ou clinicamente significativos na proporção de pacientes que tiveram remissão das convulsões ou redução de 50% ou mais na freqüência de convulsões (desfechos primários avaliados) após um a três meses de DBS talâmica anterior em pacientes com epilepsia (multi)focal, após estimulação da zona ictal responsiva inicial em pacientes com epilepsia (multi) focal e após DBS do hipocampo em paciente com epilepsia do lobo temporal (medial). No entanto, verificou‐se uma redução estatisticamente significante na freqüência de convulsões após: a) DBS talalâmica anterior (diferença média (MD), ‐17,4% em comparação com a estimulação simulada; intervalo de confiança de 95% (IC95%) ‐31,2 a ‐1,0; evidência de alta qualidade), b) estimulação da zona ictal responsiva inicial (MD ‐24,9%; 95% CI ‐40,1 a ‐6,0; evidência de alta qualidade) e c) DBS do hipocampo (MD ‐28,1%; 95% CI ‐34,1 a ‐22,2; evidência de qualidade moderada). Tanto o DBS talalâmico anterior como a estimulação de zona ictal responsiva inicial não produziram impacto clinicamente significativo na qualidade de vida após três meses de estimulação (evidência de alta qualidade).O implante do eletrodo levou à hemorragia intracraniana assintomática pós‐operatória em 1,6% a 3,7% dos pacientes incluídos nos dois maiores estudos e 2,0% a 4,5% apresentaram infecções pós‐operatória de partes moles (9,4% a 12,7% após cinco anos); nenhum paciente teve sequelas sintomáticas permanentes. O DBS talâmico anterior produziu menos lesões associadas à epilepsia (7,4 versus 25,5%; P = 0,01), mas taxas mais altas de depressão auto‐relatada (14,8 versus 1,8%; P = 0,02) e comprometimento subjetivo da memória (13,8 versus 1,8%; P = 0,03). Não houve diferenças significativas entre os grupos nos resultados dos testes objetivos neuropsicológicos. A estimulação da zona ictal responsiva inicial parece ser bem tolerada com poucos efeitos colaterais. Devido ao pequeno número de pacientes, não é possível fazer afirmações definitivas quanto à segurança e tolerabilidade do DBS hipocampal.Não foram encontrados efeitos estatisticamente significativos para o DBS talalâmico centromedial, o DBS do nucleus accumbens e a estimulação cerebelar. Porém essa evidência é de qualidade baixa ou muito baixa.
Conclusão dos autores
Com exceção de um RCT muito pequeno, existem apenas RCTs de curto prazo sobre neuroestimulação intracraniana para o tratamento da epilepsia. Em comparação com a estimulação simulada, um a três meses de DBS talâmica anterior (epilepsia (multi)focal), estimulação da zona ictal responsiva inicial (epilepsia (multi)focal) e o DBS do hipocampo (epilepsia do lobo temporal) reduziram moderadamente a frequência de convulsão em pacientes com epilepsia refratária. O DBS talâmico anterior está associado a taxas mais elevadas de depressão auto‐relatada e comprometimento subjetivo da memória. Não há evidência suficiente para concluir sobre a eficácia e segurança do DBS no hipocampo, do DBS talâmico centromedial, do DBS no nucleus accumbens e da estimulação cerebelar. São necessários mais RCTs, maiores e bem desenhados, para validar a eficácia e segurança dos tratamentos invasivos de neuroestimulação intracraniana.
PICO
Resumo para leigos
Estimulação elétrica através de eletrodos implantados no cérebro para tratar pessoas com epilepsia resistente aos medicamentos
Contexto
Apesar de existirem muitos medicamentos antiepilépticos, cerca de 30% dos pacientes com epilepsia continuam tendo convulsões. Existem dois tipos de estimulação elétrica através de eletrodos implantados no cérebro (conhecida como estimulação elétrica intracraniana): a "estimulação cerebral profunda" e a "estimulação cerebral cortical". A estimulação elétrica intracraniana tem sido proposta como um tratamento alternativo para esses pacientes. Esta revisão teve como objetivo avaliar a eficácia, a segurança e a tolerabilidade desse tratamento.
Resultados
Diversas estruturas cerebrais receberam estimulação programada (independente de o paciente ter ou não convulsões), tais como o núcleo talâmico anterior (um estudo, 109 participantes), o núcleo talâmico centromedial (dois estudos, 20 participantes), o córtex cerebelar (três estudos, 22 participantes), o hipocampo (quatro estudos, 21 participantes) e o núcleo accumbens (um estudo, 4 participantes). Além disso, uma pesquisa (191 participantes) estudou a estimulação responsiva (que é feita apenas quando ocorre uma convulsão) da zona do cérebro de onde a convulsão surgiu. Há evidência de redução moderada (15% a 30%) na frequência de convulsões após a estimulação, durante um a três meses, do núcleo talâmico anterior em pessoas com epilepsia (multi)focal; após a estimulação do hipocampo em pessoas com epilepsia do lobo temporal e após a estimulação da zona de início da convulsão em pessoas com epilepsia (multi)focal. Porém, não há evidência de que a neuroestimulação produza um impacto significativo na remissão total das convulsões, na proporção de pacientes com uma redução de frequência de convulsão superior a 50% ou na qualidade de vida das pessoas que receberam esse tratamento.
Os efeitos adversos da estimulação talalâmica anterior incluem depressão auto‐relatada e comprometimento subjetivo da memória e, possivelmente, ansiedade e estado confusional. A estimulação responsiva da zona cerebral onde surgiu a convulsão parece ser bem tolerada com poucos efeitos colaterais.
A evidência sobre a estimulação talâmica anterior e da zona responsiva inicial é de qualidade moderada a alta. A qualidade da evidência sobre a estimulação do hipocampo é baixa a moderada. Não há evidência suficiente para concluir sobre a eficácia ou os efeitos adversos da estimulação do hipocampo, da região talâmica centromedial, do cortex cerebelar e do núcleo accumbens. O implante dos eletrodos dentro do crânio foi relativamente seguro e não produziu sequelas sintomáticas permanentes nos pacientes incluídos nos estudos.
Conclusões
São necessários mais estudos, maiores e bem desenhados, sobre a estimulação elétrica intracraniana, para ter certeza quanto à sua eficácia e segurança e comparar esse tratamento com tratamentos atualmente disponíveis (por exemplo, drogas antiepilépticas ou a estimulação do nervo vago).
A evidência é atualizada até 5 de novembro de 2016.
Authors' conclusions
Summary of findings
| Anterior thalamic nucleus stimulation for refractory epilepsy | ||||||
| Patient or population: adults with IQ > 70 with refractory focal epilepsy Settings: epilepsy centres in the USA Intervention: anterior thalamic nucleus stimulation Comparison: sham stimulation | ||||||
| Outcomes | Illustrative comparative risks* (95% CI) | Relative effect | No of Participants | Quality of the evidence | Comments | |
| Assumed risk | Corresponding risk | |||||
| Sham stimulation | Anterior Thalamic Nucleus stimulation | |||||
| Seizure freedom (3‐month blinded evaluation period) | Observed inFisher 2010 | OR 0.33 (0.01 to 8.36) | 109 | ⊕⊕⊕⊝ | ||
| 1 per 55 | 0 per 54 | |||||
| Low risk population1 | ||||||
| 1 per 1000 | 0 per 1000 | |||||
| High risk population1 | ||||||
| 15 per 1000 | 5 per 1000 | |||||
| Responder rate (3‐month blinded evaluation period) | 26 per 100 | 30 per 100 (15 to 49) | OR 1.20 (0.52 to 2.80) | 108 | ⊕⊕⊕⊝ | |
| Seizure frequency reduction (%) (3‐month blinded evaluation period) | Median monthly seizure frequency reductions ranged from ‐14.5 to ‐28.7% | The mean seizure frequency in the intervention group was | 108 (1) | ⊕⊕⊕⊕ | A trend for increasing efficacy over time was observed during the blinded evaluation period and could result into an underestimation of the treatment effect (treatment effect of month 3: ‐29%). | |
| Adverse events | See comment | See comment | 109 (1) | ⊕⊕⊕⊝ | Stimulation‐related adverse events during the blinded evaluation period include (stimulation versus control): depression (14.8 versus 1.8%, P = 0.02), subjective memory impairment (13.8 versus 1.8%, P = 0.03) and epilepsy‐related injuries (7.4 versus 25.5%, P = 0.01). Standard stimulation parameters could be inappropriate and increase seizure frequency in a small minority of patients.4 Asymptomatic intracranial haemorrhages occurred in 3.7% of participants after the initial implant procedure. In 8.2% of participants leads had to be replaced after initial implantation outside the target. Postoperative implant site infections occurred in 4.5% of participants, increasing to 12.7% after 5 years of follow‐up urging (temporary) hardware removal in 8.2% of participants. Implant site pain was not uncommon (year 1: 10.9%, year 5: 20.9%). SUDEP rate during long‐term (including open‐label) follow‐up was 2.9 per 1000 p‐y which is comparable to rates reported in refractory epilepsy populations (2.2‐10 per 1000 p‐y) (Tellez‐Zenteno 2005; Tomson 2008). | |
| Neuropsychological outcome (3 months) | See comment | See comment | 96‐100 (1) | ⊕⊕⊕⊝ | Changes in neuropsychological test scores for cognition and mood were very similar in the treatment and control group and not significantly different. Individual patient data show worsening (> 1 SD) of Profile of Mood States Depression subscale (POMS‐D) in 3/8 stimulated participants with self‐reported depression and 0/7 patients with subjective memory impairment showed worsening (> 1 SD) of verbal or visual memory scores. | |
| Quality of life (QOLIE‐31) (3 months) | The mean improvement of the QOLIE‐31 score in the control group was +2.8 higher | The mean improvement in QOLIE‐31 score in the intervention group was | 105 (1) | ⊕⊕⊕⊕ | Positive changes in QOLIE‐31 (quality of life in epilepsy 31) scores indicate improvement. Changes of 5‐11.7 have been defined in literature as being clinically meaningful (Borghs 2012; Cramer 2004; Wiebe 2002). | |
| *The basis for the assumed risk (e.g. the median control group risk across studies) is provided in footnotes. The corresponding risk (and its 95% confidence interval) is based on the assumed risk in the comparison group and the relative effect of the intervention (and its 95% CI). | ||||||
| GRADE Working Group grades of evidence | ||||||
| 1 The assumed risks (low and high) are based on the range of the number of events observed in the sham stimulation control groups of all RCTs evaluating deep brain and cortical stimulation in refractory epilepsy patients 2 More trials and patients are needed to allow more precise estimation of stimulation effects (including more rare adverse effects) (GRADE ‐1). 3 The confidence interval includes clinically non‐significant changes (GRADE ‐1), however, the observed trend for increasing efficacy over time probably underestimates the treatment effect (GRADE +1). 4 One participant experienced a spectacular seizure frequency increase after initiation of stimulation, which was reversible after lowering output voltage. New or worse seizures occurred more frequently in the stimulation group compared to the control group but differences did not reach statistical significance. 5 Although clinically meaningful differences in formal neuropsychological testing results seem unlikely on the group level, the discrepancy between objective and subjective measures needs further clarification (GRADE ‐1). | ||||||
| Centromedian thalamic nucleus stimulation for refractory epilepsy | ||||||
| Patient or population: patients with refractory (multi)focal or generalized epilepsy Settings: epilepsy centres in the USA and in Mexico Intervention: centromedian thalamic nucleus stimulation Comparison: sham stimulation | ||||||
| Outcomes | Illustrative comparative risks* (95% CI) | Relative effect | No of Participants | Quality of the evidence | Comments | |
| Assumed risk | Corresponding risk | |||||
| Sham stimulation | Centromedian thalamic nucleus stimulation | |||||
| Seizure freedom (3‐month blinded evaluation period) | Observed inFisher 1992 | OR 1.00 (0.11 to 9.39) | 6 (1)2 | ⊕⊝⊝⊝ | ||
| 0 per 6 | 0 per 6 | |||||
| Low risk population1 | ||||||
| 1 per 1000 | 1 per 1000 | |||||
| High risk population1 | ||||||
| 15 per 1000 | 15 per 1000 | |||||
| Responder rate (3‐month blinded evaluation period) | Low risk population1 | OR 1.00 (0.27 to 3.69) | 6 (1)2 | ⊕⊝⊝⊝ | ||
| 10 per 100 | 10 per 1000 | |||||
| Medium‐high risk population1 | ||||||
| 25 per 100 | 25 per 1000 | |||||
| Seizure frequency reduction (3‐month blinded evaluation period) | The mean seizure frequency reduction in the control group was ‐0.4% | The mean seizure frequency in the intervention groups was | 6 (1)2 | ⊕⊝⊝⊝ | Also another trial (Velasco 2000a) (n = 13) could not demonstrate significant differences between stimulation ON and OFF periods. However, its cross‐over design without any washout period could mask a possible treatment effect. | |
| Adverse events | See comment | See comment | 19 (2)2 21 (2)2 | ⊕⊕⊝⊝ | Stimulation‐related adverse events did not occur. Postoperative CT revealed an asymptomatic and minimal haemorrhage in one patient, 1 patient required repair of the connection to the pulse generator and skin erosion urged device explantation in 3 other patients (including 2 young children). | |
| Neuropsychological outcome (3 months) | See comment | See comment | 6 (1)2 | ⊕⊝⊝⊝ | There were no significant differences in any of the neuropsychological tests between baseline, stimulation ON and OFF periods. | |
| Quality of life | See comment | See comment | 0 (0) | See comment | Impact of centromedian thalamic nucleus stimulation on quality of life has not been studied yet. | |
| *The basis for the assumed risk (e.g. the median control group risk across studies) is provided in footnotes. The corresponding risk (and its 95% confidence interval) is based on the assumed risk in the comparison group and the relative effect of the intervention (and its 95% CI). | ||||||
| GRADE Working Group grades of evidence | ||||||
| 1 The assumed risks (low, medium and high) are based on the range of the number of events observed in the sham stimulation control groups of all RCTs evaluating deep brain and cortical stimulation in refractory epilepsy patients 2 Cross‐over trial(s). 3 No more than one small RCT was identified, resulting into wide 95% confidence intervals (GRADE score ‐2). This is of particular concern for neuropsychological outcome, as no exact figures were reported or could be provided, so evaluation of certain statistically non‐significant trends is not possible. 4 Only 2 hours of intermittent stimulation per day in Fisher 1992 (GRADE score ‐1). 5 Incomplete outcome data may introduce bias (GRADE score ‐1). 6 Number of participants too low to identify less frequent adverse events (GRADE score ‐1) | ||||||
| Cerebellar stimulation for refractory epilepsy | ||||||
| Patient or population: patients with refractory (multi)focal or generalized epilepsy Settings: epilepsy centres in the USA and in Mexico Intervention: stimulation of the superomedial surface of the cerebellum Comparison: sham stimulation | ||||||
| Outcomes | Illustrative comparative risks* (95% CI) | Relative effect | No of Participants | Quality of the evidence | Comments | |
| Assumed risk | Corresponding risk | |||||
| Sham stimulation | Cerebellar stimulation | |||||
| Seizure freedom (1‐ to 3‐month blinded evaluation period) | Observed | OR 0.96 (0.22 to 4.12) | 22 (3)2 | ⊕⊕⊕⊝ | ||
| 0 per 19 | 0 per 20 (not estimable) | |||||
| Low risk population1 | ||||||
| 1 per 1000 | 1 per 1000 | |||||
| High risk population1 | ||||||
| 15 per 1000 | 14 per 1000 | |||||
| Responder rate (1‐ to 3‐month blinded evaluation period) | Low risk population1 | OR 2.43 (0.46 to 12.84) | 19 (3)2 | ⊕⊕⊝⊝ | ||
| 10 per 100 | 21 per 100 | |||||
| Medium‐high risk population1 | ||||||
| 25 per 100 | 45 per 100 | |||||
| Seizure frequency reduction (1‐ to 3‐month blinded evaluation period) | The mean seizure frequency reduction ranged across control groups from 0 to ‐18.8% | The mean seizure frequency in the intervention groups was | 19 (3)2 | ⊕⊕⊝⊝ | ||
| Adverse events | See comment | See comment | 22 (3)2 | ⊕⊕⊝⊝ | Stimulation‐related adverse events were not reported in any of the trials. In contrast, about half of the patients in every trial required repeated surgery due to electrode migration (n = 6), leakage of cerebrospinal fluid (n = 3), wound infection (n = 1), skin erosion (n = 2), lead problems (n = 1), subcutaneous seroma drainage (n = 1) and defective hardware (n = 1). Wound infections were solved with antibiotics only in 2 additional patients. In particular, electrode migration remains of specific concern, even in the most recent trial (Velasco 2005) (occurring in 3/5 patients). | |
| Neuropsychological outcome (1 to 2 months) | See comment | See comment | 16 (2)2 | ⊕⊝⊝⊝ | 'Psychometry' did not reveal any major change in any patient in any phase of the Wright 1984 trial. Comparing ON to OFF stimulation full scale intelligence and memory scores in Van Buren 1978 showed very similar results in two participants, a moderate increase in one patient and a moderate decrease in another. | |
| Quality of life (2 months) | See comment | See comment | 12 (1)7 | ⊕⊝⊝⊝ | Eleven out of 12 patients in Wright 1984 felt better for cerebellar stimulation, but only 5 chose one phase as being different from the others, being either the continuous (n = 2), contingent (n = 1) or no‐stimulation (n = 2) phase. | |
| *The basis for the assumed risk (e.g. the median control group risk across studies) is provided in footnotes. The corresponding risk (and its 95% confidence interval) is based on the assumed risk in the comparison group and the relative effect of the intervention (and its 95% CI). | ||||||
| GRADE Working Group grades of evidence | ||||||
| 1 The assumed risks (low, medium and high) are based on the range of the number of events observed in the sham stimulation control groups of all RCTs evaluating deep brain and cortical stimulation in refractory epilepsy patients 2 Including 2 cross‐over trials: Van Buren 1978 (n = 4‐5) and Wright 1984 (n = 9‐12) 3 The small number of patients leave a considerable amount of uncertainty with regards to stimulation effects (GRADE ‐1). 4Wright 1984 and Van Buren 1978 are cross‐over trials without any washout period which could mask or reduce potential benefits of cerebellar stimulation (and explain some heterogeneity) (GRADE ‐1). 5 Unclear if, how and to what extent stimulation‐related side effects were evaluated in Van Buren 1978 and Wright 1984 (GRADE ‐1). 6 Unclear what neuropsychological tests were performed in Wright 1984 ('psychometry'). Moreover, as testing scores were not published and could not be provided, evaluation of certain statistically non‐significant trends is not possible. Unclear if neuropsychological testing in Van Buren 1978 was done in blinded or unblinded evaluation periods (GRADE‐1). 7 Cross‐over trial: Wright 1984 (n = 12). 8 No formal scoring of quality of life but evaluation of patients' impressions on cerebellar stimulation (GRADE ‐1). | ||||||
| Hippocampal stimulation for refractory epilepsy | ||||||
| Patient or population: patients with refractory medial temporal lobe epilepsy Settings: epilepsy centres in Canada and in Mexico Intervention: hippocampal deep brain stimulation Comparison: sham stimulation | ||||||
| Outcomes | Illustrative comparative risks* (95% CI) | Relative effect | No of Participants | Quality of the evidence | Comments | |
| Assumed risk | Corresponding risk | |||||
| Sham stimulation | Hippocampal stimulation | |||||
| Seizure freedom (1‐ to 3‐month blinded evaluation periods) | Observed | OR 1.03 | 15 (3)2 | ⊕⊕⊕⊝ | Also in Wiebe 20134 no single patient achieved seizure freedom after six months of hippocampal active or sham stimulation. | |
| 0 per 11 | 0 per 10 | |||||
| Low risk population1 | ||||||
| 1 per 1000 | 1 per 1000 | |||||
| High risk population1 | ||||||
| 15 per 1000 | 15 per 1000 | |||||
| Responder rate (1‐ to 3‐month blinded evaluation periods) | Low risk population1 | OR 1.20 (0.36 to 4.01) | 15 (3)2 | ⊕⊕⊝⊝ | In Wiebe 20134there was one responder in the stimulation group (n = 2) compared to none in the sham group (n = 4) after six months of follow‐up. | |
| 10 per 100 | 12 per 100 | |||||
| Medium‐high risk population1 | ||||||
| 25 per 100 | 29 per 100 | |||||
| Seizure frequency (1‐ to 3‐month blinded evaluation periods) | The mean change in seizure frequency ranged across control groups from ‐4.7% to +33.7% | The mean seizure frequency in the intervention groups was | 15 (3)2 | ⊕⊕⊕⊝ | One trial (Tellez‐Zenteno 2006) has a cross‐over design without any washout period which could result into an underestimation of the true treatment effect. In Wiebe 20134 the sham stimulation group reported a median seizure frequency increase of 60% compared to a 45% decrease in the stimulation group after 6 months of follow‐up. | |
| Adverse events | See comment | See comment | 15 (3)2 | ⊕⊕⊝⊝ | There were neither stimulation‐related adverse events, nor early surgical complications. Skin erosion and local infection required explantation after >2 years in 3/9 patients in Velasco 2007. Wiebe 20134 also did not report any adverse event after 6 months of follow‐up. | |
| Neuropsychological outcome (1‐ to 3‐month periods) | See comment | See comment | 6 (2)2 | ⊕⊝⊝⊝ | Neuropsychological test results were the same or very similar during stimulation ON and OFF periods in Tellez‐Zenteno 2006 (n = 4) and in one patient in McLachlan 2010. The other patient in McLachlan 2010 showed worse verbal and visuospatial memory scores when stimulated, notwithstanding that he reported subjective memory improvement during the same period. At seven months in Wiebe 20134, scores of cognitive scales assessing recall (Rey Auditory Verbal Learning Test, Rey Complex Figure Test) were generally lower in the active stimulation compared to the sham group (p>0.05). | |
| Quality of life (QOLIE‐89) (1‐ to 3‐month periods) | The mean QOLIE‐89 score in the control group was 60 | The mean QOLIE‐89 in the intervention group was ‐5 lower (‐53 lower to +43 higher). | 3 (1)7 | ⊕⊝⊝⊝ | Positive changes in QOLIE‐89 (quality of life in epilepsy 89) scores indicate improvement. Changes of 5‐11.7 have been defined in literature as being clinically meaningful (Borghs 2012; Cramer 2004; Wiebe 2002). The overall QOLIE‐89 score at seven months in Wiebe 20134 worsened by 13 points with sham stimulation compared to an improvement of 3 points with active stimulation (p>0.05), and there was a trend for increased QOLIE‐89 subjective memory and attention/concentration scores. | |
| *The basis for the assumed risk (e.g. the median control group risk across studies) is provided in footnotes. The corresponding risk (and its 95% confidence interval) is based on the assumed risk in the comparison group and the relative effect of the intervention (and its 95% CI). | ||||||
| GRADE Working Group grades of evidence | ||||||
| 1 The assumed risks (low, medium and high) are based on the range of the number of events observed in the sham stimulation control groups of all RCTs evaluating deep brain and cortical stimulation in refractory epilepsy patients 2 Including two cross‐over trials: McLachlan 2010 (n = 2) and Tellez‐Zenteno 2006 (n = 4) 3 The small number of patients preclude more definitive judgements on effects of hippocampal stimulation (GRADE ‐1). 4Wiebe 2013 is a small parallel‐group RCT (n = 6) with a 6‐month blinded evaluation period. As there were no more than 2 participants in the active stimulation group and details needed for full methodological assessment are missing, the quality of the evidence is very low and we decided not to create separate 6‐month outcomes or a separate summary of findings table but only to describe the results. As the results of the first 3‐month epoch were not reported, the data of this trial could not be combined with the other trials evaluating one to three months of hippocampal stimulation. However, the reported six‐month results are generally compatible and in line with the estimated three‐month results. For more details and a sensitivity analysis combining all trials on hippocampal stimulation irrespective of the BEP duration, see text. 5 One trial (Tellez‐Zenteno 2006) had a cross‐over design without any washout period and allowed important changes in antiepileptic drugs, both of which could reduce or mask more important treatment effects. See also 'Sensitivity analyses' (GRADE ‐1). 6 Number of patients is too low to identify less frequent adverse events or changes in neuropsychological outcome or quality of life (GRADE‐score ‐2). 7 One cross‐over trial: Tellez‐Zenteno 2006 (n = 3) | ||||||
| Nucleus accumbens stimulation for refractory epilepsy | ||||||
| Patient or population: adults with IQ >70 with refractory focal epilepsy Settings: epilepsy centre in Germany Intervention: nucleus accumbens stimulation Comparison: sham stimulation | ||||||
| Outcomes | Illustrative comparative risks* (95% CI) | Relative effect | No of Participants | Quality of the evidence | Comments | |
| Assumed risk | Corresponding risk | |||||
| Sham stimulation | Nucleus accumbens stimulation | |||||
| Seizure freedom (3‐month blinded evaluation period) | Observed inKowski 2015 | OR 1.00 (0.07 to 13.64) | 4 (1)2 | ⊕⊕⊝⊝ | ||
| 0 per 4 | 0 per 4 (not estimable) | |||||
| Low risk population1 | ||||||
| 1 per 1000 | 1 per 1000 | |||||
| High risk population1 | ||||||
| 15 per 1000 | 15 per 1000 (0 to 172) | |||||
| Responder rate (3‐month blinded evaluation period) | Low risk population1 | OR 10.0 (0.53 to 189.15) | 4 (1)2 | ⊕⊕⊝⊝ | ||
| 10 per 100 | 53 per 100 | |||||
| Medium risk population1 | ||||||
| 25 per 100 | 77 per 100 | |||||
| Seizure frequency reduction (3‐month blinded evaluation period) | The mean change in seizure frequency in the control group was ‐13.8% | The mean seizure frequency in the intervention group was (‐100% lower to +49.8% higher) | 4 (1)2 | ⊕⊕⊝⊝ | When focusing on 'disabling seizures' only and excluding simple partial seizures (occurring in one patient), the mean change in seizure frequency in the control group was +8.2% with a ‐22.9% lower seizure frequency in the intervention group (‐100 lower to +94.0 higher) | |
| Adverse events | See comment | See comment | 4 (1)2 | ⊕⊕⊝⊝ | Except for one patient feeling sad for two weeks during the active stimulation period after a close relative had died, there were no adverse events that were exclusively linked to the active stimulation period (although various adverse events were reported in the sham and the active stimulation group, see text). One patient developed a local subcutaneous infection with colonization of the pulse generator and the leads 2 weeks post‐surgery urging antibiotic therapy and temporary hardware removal. | |
| Neuropsychological outcome (3 months) | See comment | See comment | 4 (1)2 | ⊕⊕⊝⊝ | Neurocognitive test scores were similar and not statistically significantly different during sham and active stimulation in this small trial. There were no categorical changes in Beck‐Depression‐Inventory scores during the BEP. However, the Mini International Neuropsychiatric Interview revealed a new‐onset major depression under nucleus accumbens stimulation in one patient, besides an ongoing low suicidal risk following one suicide attempt 10 years before the trial in another patient. | |
| Quality of Life (QOLIE‐31‐P) (3 months) | The mean change in the QOLIE‐31‐P score in the control group was ‐4.9 lower | The mean change in the QOLIE‐31‐P score in the intervention group was +2.8 higher (‐7.4 lower to +13.0 higher) | 4 (1)2 | ⊕⊕⊝⊝ | The QOLIE‐31‐P is a (slightly) modified version of the QOLIE‐31 questionnaire for which changes of 5 to 11.7 have been defined in the literature (Cramer 2004; Wiebe 2002; Borghs 2012) as being clinically meaningful; positive scores indicate improvement. | |
| *The basis for the assumed risk (e.g. the median control group risk across studies) is provided in footnotes. The corresponding risk (and its 95% confidence interval) is based on the assumed risk in the comparison group and the relative effect of the intervention (and its 95% CI). | ||||||
| GRADE Working Group grades of evidence | ||||||
| 1 The assumed risks (low, medium and high) are based on the range of the number of events observed in the sham stimulation control groups of all RCTs evaluating deep brain and cortical stimulation in refractory epilepsy patients 2 Cross‐over trial 3No more than one small RCT was identified which leaves a considerable amount of uncertainty with regards to stimulation effects (GRADE score ‐2). | ||||||
| Closed‐loop stimulation of the ictal onset zone for refractory epilepsy | ||||||
| Patient or population: adults with refractory focal epilepsy (1 or 2 epileptogenic regions) Settings: epilepsy centres in the USA Intervention: responsive stimulation of the ictal onset zone(s) Comparison: sham stimulation | ||||||
| Outcomes | Illustrative comparative risks* (95% CI) | Relative effect | No of Participants | Quality of the evidence | Comments | |
| Assumed risk | Corresponding risk | |||||
| Sham stimulation | Responsive ictal onset zone stimulation | |||||
| Seizure freedom (3‐month blinded evaluation period) | Observed inMorrell 2011 | OR 4.95 (0.23 to 104.44) | 191 (1) | ⊕⊕⊕⊝ | ||
| 0 per 94 | 2 per 97 (not estimable) | |||||
| Low risk population1 | ||||||
| 1 per 1000 | 5 per 1000 (0 to 95) | |||||
| High risk population1 | ||||||
| 15 per 1000 | 70 per 1000 | |||||
| Responder rate (3‐month blinded evaluation period) | 27 per 100 | 29 per 100 | OR 1.12 (0.59 to 2.11) | 191 (1) | ⊕⊕⊕⊝ | |
| Seizure frequency reduction (3‐month blinded evaluation period) | The mean estimated seizure frequency reduction in the control group was ‐17.3% | The mean seizure frequency in the intervention group was | 191 (1) | ⊕⊕⊕⊕ | A trend for increasing efficacy over time was observed during the blinded evaluation period and could result into an underestimation of the treatment effect (treatment effect of month 3: ‐32%). | |
| Adverse events | See comment | See comment | 191 (1) 256 (2) | ⊕⊕⊕⊝ | Adverse events during the blinded evaluation period were rare and there were no significant differences between the treatment and control group. Asymptomatic intracranial haemorrhages considered as serious adverse event were found postoperatively in 1.6% of participants. Postoperative implant or incision site infection occurred in 2.0% of participants, increasing to 9.4% of participants after 5 years of follow‐up (additional cases mainly upon battery replacement; urge for (temporary) explantation in the majority of cases). Cranial implantation of the neurostimulator was the probable cause of most adverse events, which include: implant site pain (16% during the first year of the trial), headache (11%), procedural headache (9%) and dysaesthesia (6%). Although the SUDEP rate (4 SUDEPs over 340 patient‐years = 11.8 per 1000 patient‐years) reported in the initial manuscript was slightly higher than those usually reported in refractory epilepsy patients (2.2 to 10 per 1000 p‐y) (Tellez‐Zenteno 2005; Tomson 2008), long‐term open‐label follow‐up has now reported reassuring figures (SUDEP rates of 3.5 per 1000 implant p‐y or 2.6 per 1000 stimulation p‐y). | |
| Neuropsychological outcome (3 months) | See comment | See comment | 160‐177 | ⊕⊕⊕⊕ | Changes in neuropsychological testing results were very similar in both groups and 95% confidence intervals did not include clinically meaningful differences. | |
| Quality of life (QOLIE‐89) (3 months) | The mean improvement of the QOLIE‐31 score in the control group was +2.18 higher | The mean improvement in QOLIE‐31 score in the intervention group was | 180 | ⊕⊕⊕⊕ | Positive changes in QOLIE‐89 (quality of life in epilepsy 89) scores indicate improvement. Changes of 5‐11.7 have been defined in literature as being clinically meaningful (Borghs 2012; Cramer 2004; Wiebe 2002). | |
| *The basis for the assumed risk (e.g. the median control group risk across studies) is provided in footnotes. The corresponding risk (and its 95% confidence interval) is based on the assumed risk in the comparison group and the relative effect of the intervention (and its 95% CI). | ||||||
| GRADE Working Group grades of evidence | ||||||
| 1 The assumed risks (low and high) are based on the range of the number of events observed in the sham stimulation control groups of all RCTs evaluating deep brain and cortical stimulation in refractory epilepsy patients 2 More trials and patients are needed to allow more precise estimation of stimulation effects (GRADE ‐1). 3 The confidence interval includes clinically non‐significant changes (GRADE ‐1), however, the observed trend for increasing efficacy over time probably underestimates the treatment effect (GRADE +1). | ||||||
Background
This review is an update of a previously published review in The Cochrane Database of Systematic Reviews (the Cochrane Library, 2014, Issue 6; Sprenger 2014).
Description of the condition
Epilepsy is a common neurological disorder affecting 0.5% to 1% of the population (Forsgren 2005). More than 30% of all patients with epilepsy suffer from uncontrolled seizures or have unacceptable medication‐related side effects (Kwan 2000). Alternative treatment options are available for patients with refractory seizures. Addition of newly developed antiepileptic drugs to the treatment regimen may result in freedom from seizures in this population group. However, the chance of becoming seizure‐free with this strategy is limited and estimated to be around 6% when compared to placebo (Beyenburg 2009). Surgery for epilepsy leads to long‐term freedom from seizures in approximately 58% to 65% of suitable surgery candidates (Engel 2003; West 2015). For the remainder, few options are left and neurostimulation may provide an alternative treatment (Engel 2003).
Description of the intervention
Both extracranial (vagus nerve stimulation) and intracranial (deep brain stimulation (DBS) and cortical (neocortex and cerebellar cortex) stimulation) neurostimulation have been used as treatments for epilepsy (Boon 2007a). Intracranial stimulation is the direct application of an electrical current to central nervous system structures by means of implanted (DBS) or subdural (cortical stimulation) electrodes connected to an implantable pulse generator.
How the intervention might work
The precise mechanism of action of DBS still needs to be elucidated. Several mechanisms of action have been proposed. By continuous application of current via the electrodes, the targeted brain structures may be (functionally) inhibited. This is done in a reversible manner since the stimulation can be stopped at any time. The effect of the inhibition depends on the targeted structures, thus depending on the location of the implanted electrodes in the brain. Stimulation of electrodes placed in the epileptic onset region (for example, the hippocampus) may lead to 'local' inhibition of the hyperexcitable region and to seizure suppression. Stimulation of electrodes placed in key structures responsible for seizure propagation (for example, the thalamus) may additionally lead to suppression of seizure spread, based on the connections between the area of stimulation and other parts of the central nervous system. This may provide a likely hypothesis when crucial structures in the epileptogenic networks are involved (Boon 2007a).
Why it is important to do this review
For both deep brain and cortical stimulation, several uncontrolled and unblinded trials with discongruent results and high risk of bias exist. Randomized controlled trials have been performed but not systematically reviewed. Until now, no clear descriptions of the outcomes and side effects have been available. The aim of this systematic review is to give an overview of the current evidence for the use of DBS and cortical stimulation as treatments for refractory epilepsy.
Objectives
To assess the efficacy, safety and tolerability of deep brain and cortical stimulation for refractory epilepsy based on randomized controlled trials.
Methods
Criteria for considering studies for this review
Types of studies
Randomized controlled trials (RCTs) investigating deep brain or cortical stimulation in patients with refractory epilepsy were selected. Blinded as well as unblinded studies were considered for inclusion in this review.
Types of participants
Patients with refractory epilepsy with partial or generalized seizures, or both. Partial seizures are found in a localization‐related form of epilepsy in which seizure semiology or findings from investigations disclose a localized origin of the seizures. With generalized seizures the first clinical changes indicate involvement of both hemispheres (ILAE classification). Patients are considered to be refractory if they suffer from uncontrolled seizures despite adequate treatment with at least two first‐line antiepileptic drugs (either as monotherapy or in combination) that are appropriate for the epileptic syndrome, or they experience unacceptable medication‐related side effects. In adults, at least two years of treatment is recommended before drug‐resistant epilepsy can be diagnosed (Kwan 2010; Kwan 2009).
Both patients with normal and abnormal magnetic resonance imaging (MRI) were included. Patients who had undergone other treatments besides antiepileptic drugs (for example, resective surgery or vagus nerve stimulation) were also included.
Types of interventions
Deep brain stimulation (DBS) (in different intracranial regions) or cortical (neocortex or cerebellar cortex) stimulation. Both treatments could have been compared to a control patient group: 1) receiving sham stimulation, 2) undergoing resective surgery, 3) being further treated with antiepileptic drugs, or 4) other neurostimulation treatments (including vagus nerve stimulation), depending on the study protocol.
Types of outcome measures
Primary outcomes
(1) Seizure freedom: the proportion of participants that was free of seizures (complete absence of seizures, comparable with Engel classification class I (Jehi 2008)) during the randomized period, i.e. the phase of the trial during which, according to treatment allocation, one group of patients received the intracranial neurostimulation treatment and the other group the control treatment (in contrast to open‐label follow‐up periods of the same trials during which (nearly) all patients received the neurostimulation treatment under investigation in an unblinded manner, without any control group).
(2) Responder rate: proportion of patients with at least a 50% seizure frequency reduction, compared to the baseline period, throughout the randomized period.
Secondary outcomes
(1) Seizure frequency reduction: percentage reduction in seizure frequency during the randomized phase of the trial compared to baseline. When the needed data were not presented in the respective article, they were calculated (if raw data were present) or the authors were contacted. When necessary to avoid treatment effects > 100%, we directly compared 'on' to 'off' stimulation periods instead of referring to baseline seizure frequency (as for Van Buren 1978, see also Appendix 1).
(2) Adverse events: adverse events occurring throughout the randomized period; the primary focus is on the comparison of the different randomized groups; to inform the reader adverse events related to the surgical procedure or the chronic presence of an implanted device (e.g. infection, haemorrhage) occurring in trials comparing active to sham stimulation (and thus in both groups) are also reported (including open‐label data, if applicable).
(3) Neuropsychological testing: results of neuropsychological testing during or at the end of the randomized period.
(4) Quality of life: results of questionnaires concerning quality of life that were completed during or at the end of the randomized period.
Search methods for identification of studies
Cochrane Central Register of Controlled Trials (CENTRAL; 2015, Issue 1) in the Cochrane Library (searched 10 February 2015);
Electronic searches
We searched the following electronic databases, without any language restrictions:
(1) Cochrane Epilepsy Group Specialized Register (29 September 2015), using the search strategy outlined in Appendix 2. It is not necessary to update this search, because records in the Specialized Register are included in CENTRAL;
(2) Cochrane Central Register of Controlled Trials (CENTRAL; 2016, Issue 11), in the Cochrane Library2016, Issue 11 (searched 5 November 2016), using the search strategy outlined in Appendix 2;
(3) PubMed (5 November 2016), using the search strategy outlined in Appendix 2;
(4) ClinicalTrials.gov (5 November 2016), using the search strategy outlined in Appendix 2; and
(5) the WHO International Clinical Trials Registry Platform ICTRP (5 November), using the search strategy outlined in Appendix 2.
Searching other resources
We reviewed the reference lists of retrieved studies to search for additional reports of relevant studies.
We contacted authors of relevant trials identified by our search, other researchers in the field, and manufacturers of the devices to identify unpublished or ongoing studies, or studies published in non‐English journals.
Data collection and analysis
Selection of studies
Four review authors (Mathieu Sprengers (MS), Kristl Vonck (KV), Evelien Carrette (EC) and Paul Boon (PB)) independently assessed the identified trials for inclusion. Any disagreements were resolved by discussion and by involving another review author (Anthony Marson (AM)).
Data extraction and management
Relevant data were extracted into a prespecified data extraction form by two review authors (MS and KV). If additional data were needed, we contacted the investigators of the studies. Disagreements were resolved by discussion.
The following data were extracted.
(1) Methodological and trial design:
(a) method of randomization and sequence generation;
(b) method of allocation concealment;
(c) blinding methods (patient, physician, outcome assessor);
(d) information about sponsoring;
(e) whether any participants had been excluded from reported analyses;
(f) duration of period between implantation and start of the treatment period;
(g) duration of treatment period and, in the case of a cross‐over design, washout period;
(h) antiepileptic drug (AED) policy.
(2) Participants and demographic information:
(a) number of participants allocated to each treatment group;
(b) age and sex;
(c) information about type of epilepsy and seizures types;
(d) duration of epilepsy;
(e) additional information if applicable and available (intellectual capacities, neuroimaging results).
(3) Intervention:
(a) stimulation target;
(b) output voltage and current;
(c) stimulation frequency;
(d) pulse width;
(e) continuous, intermittent or responsive ('closed‐loop') stimulation.
(4) Outcomes:
(a) seizure freedom;
(b) responder rate;
(c) seizure frequency reduction;
(d) adverse events;
(e) neuropsychological outcome;
(f) quality of life.
Assessment of risk of bias in included studies
The methodological quality of the studies was independently evaluated by two review authors (MS and KV) according to the guidelines in the Cochrane Handbook for Systematic Reviews of Interventions (Higgins 2011)
-
The risk of bias was assessed for each individual study using the Cochrane Collaboration's tool for assessing risk of bias.
-
Randomization: only RCTs were included in this review. We planned to exclude studies with inadequate methods of allocation concealment.
-
Blinding of participants, personnel and outcome assessors: double‐blind studies were preferred but single‐blind and even unblinded (comparison to resective surgery or antiepileptic drugs) studies were also eligible for inclusion in the review.
-
Incomplete outcome data: this was evaluated separately for each study. We planned to exclude studies where losses to follow‐up differed significantly between the treatment and control groups.
-
Selective reporting: this was evaluated separately for each study (selective outcome reporting) and, furthermore, if sufficient studies were identified, we planned to explore if there was any evidence of publication bias using funnel plots.
Several studies have reported results that may be consistent with an outlasting effect after intracranial stimulation (Andrade 2006; Lim 2007; McLachlan 2010; Velasco 2007). Such an effect could mask or reduce any treatment effect if seizure frequency in the control group is evaluated after previous stimulation without an adequate washout period. As there is no general consensus concerning this outlasting effect, we judged the risk of bias in such studies as 'uncertain', whereas studies without prior stimulation or with an adequate washout period were classified as 'at low risk of bias'.
Finally, we also made judgements if antiepileptic drugs were changed during the trial as this could also influence observed treatment effects.
Measures of treatment effect
We planned to express results of categorical outcomes as risk ratios (RR) with 95% confidence intervals (CIs). However, to combine results from parallel‐group (unpaired data) and cross‐over trials (paired data), we used the method described by Curtin 2002, Elbourne 2002 and Stedman 2011. This method makes use of maximum likelihood estimate odds ratios (OR) (Mantel‐Haenszel ORs) for parallel trials and marginal Becker‐Balagtas ORs (Becker 1993) for cross‐over trials. Treatment effects of continuous outcomes were expressed as mean differences (MDs) with 95% CIs.
Although quality of life was evaluated using the QOLIE‐89, QOLIE‐31 (abbreviated version of QOLIE‐89) and QOLIE‐31‐P (slightly modified version of QOLIE‐31) questionnaires in different trials, we chose the MD approach instead of the standardized mean difference (SMD) approach. Firstly, all questionnaires have the same range, and for the QOLIE‐31 and QOLIE‐89 questionnaires, very similar means, standard deviations(SDs) and minimally clinically important change values in the same population have been reported (Cramer 1998; Devinsky 1995; Wiebe 2002); although we could not find similar studies also incorporating QOLIE‐31‐P scores, the QOLIE‐31‐P is an only slightly modified version of the QOLIE‐31 questionnaire. Secondly, we thought the MD approach would introduce less error then the SMD approach, which attributes differences in SDs entirely to differences in measurement scales and ignores real differences in variability among study populations. Finally, unlike the SMD approach, the MD approach allows us to combine final values and change scores. In view of the difficulty in combining neuropsychological data from various studies, we summarized the data for this outcome only qualitatively in the text. The same was true for adverse events, due to their diverse nature.
Unit of analysis issues
Results from cross‐over trials were analysed and incorporated in the meta‐analysis as paired data, using the approach proposed by Curtin 2002.
Dealing with missing data
Where data for our chosen outcomes were not provided in trial reports, we contacted the original investigators and further data were requested. If raw data were available, missing outcomes were calculated, if possible (for example, seizure frequency reduction). When losses to follow‐up differed significantly between the treatment and control groups and if sufficient individual patient data were available, we planned to perform sensitivity analyses using 'best case scenario' (treatment group: not seizure‐free, responder, 95% seizure frequency reduction, QOLIE‐score +20; control group: not seizure‐free, no responder, 95% seizure frequency increase, QOLIE‐score ‐20), 'worst case scenario' (the opposite of the best case scenario) and 'last observation carried forward' LOCF) data imputation.
Assessment of heterogeneity
We assessed clinical heterogeneity by comparing the clinical and trial characteristics, and a judgement was made as to whether significant clinical heterogeneity was present. Statistical inconsistency was assessed by visual inspection of the forest plots and by using the I² statistic (with an I² statistic of 30% or higher representing substantial heterogeneity) and the Chi² test (Q test, significance level set at a P value of 0.10).
Data synthesis
If neither clinical nor statistical heterogeneity were found, results were pooled using a fixed‐effect model. We planned to use the Mantel‐Haenszel method for dichotomous outcomes and the inverse variance method for continuous outcomes. However, to combine data from parallel and cross‐over trials we had to use the generic inverse variance method. This approach also allowed incorporation of treatment effects estimated by regression and other models.
Subgroup analysis and investigation of heterogeneity
Stimulation of different intracranial structures may not be equally effective and lead to different adverse events. Therefore, results were not pooled across different targets but were presented per individual target for reasons of clinical heterogeneity.
As there is some evidence that the efficacy of deep brain and cortical stimulation treatments may increase over time (see also Discussion), results were pooled per three‐month stimulation epochs (one to three months of stimulation, four to six months of stimulation etc) as planned in the previous version of this review.
Sensitivity analysis
Various sensitivity analyses were planned before any trial had been identified. First, if sufficient studies were found, we planned to assess the effect of study quality on the outcome. Second, because we initially planned to express results of categorical outcomes as RR instead of OR, we performed a sensitivity analysis using RR as described by Zou 2007. In summary, they show that, while two odds ratios (ORs) can be calculated in a pair‐matched study with binary outcome data (the conditional and the marginal OR), there is only one RR for such design. In their article, they provide formulae to directly estimate the RR and its variance from the raw data (instead of obtaining these by conversion of ORs). Third, an increasing efficacy over time has been suggested for various neurostimulation treatments, including intracranial cortical and DBS. Therefore we planned to analyze and pool the outcome data per three‐month stimulation epochs (see above). As separate data per three‐month epoch are not always available in trials with a longer duration of follow‐up, we planned to perform a sensitivity analysis pooling outcome data obtained after different durations of follow‐up, but only if there was no evidence of clinical heterogeneity. Fourth, if different strategies could be followed, we planned to analyse their consequences in a sensitivity analysis.
Some sensitivity analysis were planned in the context of general foreseeable problems after study identification but before any data analysis was done. First, empty cells hinder calculation of ORs or RRs. In these situations, it is customary to add +0.5 to each cell (Deeks 2011). Given the small number of included patients in most trials, we examined in a sensitivity analysis if adding + 0.25 instead of +0.5 would change our conclusions. Second, when necessary to avoid treatment effects > 100%, we directly compared 'on' to 'off' stimulation periods instead of referring to baseline seizure frequency (see above and see Appendix 1). We therefore performed an analysis taking baseline seizure frequency as a reference (and thus allowing treatment effects > 100%) as a sensitivity analysis.
Finally, several post‐hoc sensitivity analyses were only made after encountering some specific problems associated with particular trials or meta‐analyses: as the two participants in McLachlan 2010 experienced very similar treatment effects, the standard error (SE) associated with the MD in seizure frequency in this study was the lowest among all trials on hippocampal stimulation. In this way, this very small cross‐over study (n = 2) substantially influenced the pooled mean treatment effect. As its weight in the standard analysis appeared disproportionally high (94%), we checked the robustness of the conclusions to the other extreme situation in which the SE of this trial would be (equal to) the highest of all trials on hippocampal DBS.
In Fisher 1992 there was one patient who seemed to benefit from the stimulation but who was dropped from the blinded protocol due to a seizure frequency increase during the washout period. The absence of stimulation OFF data therefore prevented inclusion of the stimulation ON data of this patient in the paired data analysis. Besides 'best and worst case scenario' sensitivity analyses (see above), we also performed a sensitivity analysis with unpaired data analysis allowing us to include all available data, but without any data imputation.
'Summary of findings' tables
The data are summarized per stimulation target in 'Summary of findings' tables. All outcome parameters investigated in the review are incorporated into the tables. The quality of evidence contributing to these outcomes was judged using the GRADE (Grading of Recommendations Assessment, Development and Evaluation) criteria (Guyatt 2008).
Results
Description of studies
See: Characteristics of included studies; Characteristics of excluded studies; Characteristics of studies awaiting classification; Characteristics of ongoing studies.
Results of the search
See Figure 1 for a flow‐diagrammatic summary of the search results. One hundred and eighteen records were identified as potentially eligible for inclusion in this review. Seventy‐six records were excluded as they did not meet the eligibility criteria: 63 records were not randomized controlled trials (RCTs), 11 assessed intracranial stimulation for other purposes than treating refractory epilepsy, and in two articles, the efficacy of another intervention (transcranial direct current stimulation) was evaluated.

Study flow diagram.
Five records described four recent parallel‐group RCTs still recruiting participants. Boon 2007b is a trial comparing hippocampal stimulation, sham stimulation and amygdalohippocampectomy in refractory temporal lobe epilepsy patients. Chabardes 2014 aims to compare anterior thalamic nucleus stimulation to 'usual treatment'. Koubeissi 2015 is investigating 1 Hz versus 5 Hz low‐frequency stimulation of the fornix in patients with refractory medial temporal lobe epilepsy and in Zhang 2015, refractory focal epilepsy patients are randomized to anterior thalamic nucleus deep brain stimulation (DBS) or vagus nerve stimulation.
Two trials are still awaiting classification. Four records mentioned an RCT evaluating the efficacy and safety of DBS of the mammillary bodies and mammillothalamic tracts (van Rijckevorsel 2004). However, up to now the results have not been published. As for the previous version of this review, we again tried to contact the authors but additional information could not be gained. Chabardes 2005 was registered on ClinicalTrials.gov as a cross‐over trial evaluating subthalamic nucleus DBS in refractory focal epilepsy patients but had to be preliminarily terminated in 2010 due to insufficient patient recruitment (n = 4). As the preliminary results have not been published yet, we in vain tried to contact the authors. Further efforts to acquire these data will be undertaken by the next update of this review.
Thirty‐two records describing 12 studies fulfilled the criteria for inclusion in this review. As the results of two of these studies were only presented in a graph (no exact figures) (Velasco 2000a), or as an abstract (Wiebe 2013), and additional data could not be obtained, only 10 studies were fully included in the quantitative synthesis (meta‐analysis).
Included studies
See: Characteristics of included studies.
Eleven out of 12 included studies evaluated the safety and efficacy of open‐loop (scheduled) stimulation, the remaining study concerned closed‐loop (responsive) stimulation. Stimulation of the ictal onset zone (including the hippocampus (four studies) and the trial on responsive stimulation) as well as of more remote network structures has been studied. The latter included the cerebellar cortex (three studies), the anterior (one study) and centromedian (two studies) thalamic nucleus and the nucleus accumbens (one study).
1. Anterior thalamic nucleus stimulation
Fisher 2010, also known as the SANTE trial, is a parallel‐group RCT evaluating the efficacy and safety of bilateral anterior thalamic nucleus DBS in 109 patients (age 18 to 65 years) with refractory partial‐onset epilepsy (mean duration of epilepsy: 22.3 years, median baseline seizure frequency: 19.5 per month). After one month of postoperative recovery, patients entered a three‐month blinded randomized phase during which half of the participants received stimulation and half did not. This was followed by a nine‐month open‐label period during which all patients received stimulation in an unblinded way and stimulation parameters could be programmed on an individual basis but antiepileptic drugs (AED) were still kept constant. From the 13th month on, AEDs could vary freely ('long‐term follow‐up'). All outcomes considered for this review were examined.
2. Centromedian thalamic nucleus stimulation
1. Fisher 1992 is a cross‐over randomized trial in seven patients (age 16 to 41 years) who were found to be poor candidates for epilepsy surgery, two of them having (multi)focal epilepsy and five generalized epilepsy (2/5 had Lennox‐Gestaut syndrome). The patients had been suffering from epilepsy for 14 to 29 years and had a mean monthly baseline seizure frequency of 23.4 seizures. Patients were randomized one to two months postoperatively to first receive either bilateral centromedian thalamic nucleus (two hours per day) or sham stimulation. The two treatment blocks lasted three months with a three‐month washout phase between them. After this nine‐month randomized and blinded period, all patients were stimulated during the long‐term open‐label follow‐up period. All outcomes considered for this review were studied and reported except for quality of life.
2. Velasco 2000a is a cross‐over randomized trial in 13 patients (age 4 to 31 years) with refractory epilepsy for 4 to 33 years (eight with Lennox‐Gestaut syndrome and five with localization‐related epilepsy) and a median baseline seizure frequency of 119 seizures per month. After six to nine months of stimulation in all participants, patients entered a six‐month randomized double‐blind cross‐over protocol. In half of the patients, the stimulator was turned off for three months, between months six and nine, the other half underwent the same manoeuvre nine to 12 months postoperatively. Between months 13 and 15, stimulation was restarted in all patients in an unblinded manner. Two of the original 15 patients were explanted before initiation of the randomized double‐blind period due to skin erosions. Seizure frequency during the blinded three‐month period without stimulation was presented in a graph and compared to the preceding three months (with stimulation). As these three months only coincided with the three‐month stimulation 'on' period of the double‐blind protocol in half of patients, and furthermore no exact figures were provided, this study could not be included in the meta‐analysis but only in the qualitative synthesis.
3. Cerebellar stimulation
1. Van Buren 1978 reported their results of cerebellar stimulation (superior surface of the cerebellum parallel to and about 1 cm from either side of the midline) in five patients (age 18 to 34 years) with refractory epilepsy for eight to 23 years, with a mean baseline seizure frequency of 5.1 seizures per day. Presumably four had (multi)focal epilepsy and one had generalized epilepsy. Stimulation was initiated as soon as preoperative seizure frequency had resumed after electrode implantation. Over the ensuing 15 to 21 months, patients were hospitalized three or four times for four to six weeks. During these admissions, seizure frequency was evaluated with and without stimulation. This was performed in a blinded as well as an unblinded way. For this review, only the double‐blind data were considered (in total 26 days 'on' and 26 days 'off'). As four out of five patients' seizure frequency increased during the trial (with as well as without stimulation), we decided to directly compare seizure frequency during the stimulation 'on' and 'off' periods to avoid treatment effects with > 100% reductions in seizure frequency (see Appendix 1). The analysis expressing treatment effects with regard to baseline seizure frequency was performed as a sensitivity analysis.
2. Wright 1984 is a cross‐over randomized trial in 12 patients (age 20 to 38 years) who had had epilepsy for 10 to 32 years. Five patients had only generalized seizures, one only partial seizures, four partial and generalized seizures, and in two patients seizures were difficult to classify (complex partial seizures versus complex absences). The type of epilepsy was not reported. The six‐month randomized phase started several months after electrode implantation, after the patient had returned to his preoperative seizure frequency, and consisted of three two‐month periods: continuous, contingent (that is, patients received only stimulation when the 'seizure button' was depressed (during an aura or seizure) and for two minutes after it was released) and sham stimulation of the upper surface of the cerebellum (electrodes ± 2 cm parasagittally from the midline). As there was no baseline period, the sham stimulation period seizure frequency (mean: 62 seizures per month) served as reference data for the meta‐analysis. Apart from quality of life, all outcomes considered for this review were evaluated.
3. Velasco 2005 studied the efficacy and safety of bilateral stimulation of the superomedial surface of the cerebellum in five patients (age 16 to 35 years) with generalized (n = 3) or (multi)focal frontal lobe epilepsy (n = 2) for 11 to 27 years (mean baseline seizure frequency: 14.1 seizures per month). All patients had generalized tonic‐clonic seizures and 4/5 had tonic seizures. The three‐month parallel‐group randomized phase was initiated one month after electrode implantation and was followed by unblinded stimulation in all patients for 21 months. Seizure frequency and adverse events were evaluated.
4. Hippocampal stimulation
1. Tellez‐Zenteno 2006 is a multiple cross‐over RCT in four patients (age 24 to 37 years) with refractory left medial temporal lobe epilepsy with mesial temporal sclerosis on magnetic resonance imaging (MRI) whose risk of postoperative memory deficits prevented resective surgery. Duration of epilepsy ranged from 16 to 24 years and the mean monthly baseline seizure frequency was between two and four in three participants and 25 in another. Left hippocampal stimulation was compared to sham stimulation in three two‐month treatment pairs, each containing one month with and one month without stimulation. All outcomes considered for this review were studied. With regards to quality of life, see Appendix 3.
2. Velasco 2007 reported their results of uni‐ or bilateral hippocampal stimulation (according to seizure focus) in nine patients (age 14 to 43 years) with intractable temporal lobe epilepsy for three to 37 years (mean baseline seizure frequency: 37.9 seizures per month) who were poor surgery candidates. Five had a normal MRI and four had hippocampal sclerosis. Seizure frequency and adverse events were assessed in a double‐blind manner during the first postoperative month during which half of the participants received stimulation and half did not. After this, randomized one‐month period stimulation was turned on in all patients (follow‐up: 18 to 84 months).
3. McLachlan 2010 is another study evaluating hippocampal stimulation as a treatment for medically intractable epilepsy in two patients (age 45 to 54 years) with independent bitemporal originating seizures for 15 to 29 years (with 32 and 16 seizures per month, respectively). MRI was normal in one and showed bilateral hippocampal sclerosis in the other patient. A three‐month postoperative baseline period was followed by a cross‐over protocol which contained three months of bilateral hippocampal stimulation followed by a three‐month washout period and three months of sham stimulation (control). All outcomes considered for this review were evaluated except for quality of life.
4. Wiebe 2013 is a parallel‐group RCT in six patients (age 30 to 46 years) with uni‐ or bilateral drug‐resistant medial temporal lobe epilepsy treated with uni‐ or bilateral hippocampal stimulation, respectively (median baseline seizure frequency of 10 to 12 seizures per month). After hippocampal electrode implantation and one month for 'adjustments of interventions', patients were randomized to six months active or sham stimulation. The initial target sample of 57 participants could not be reached due to difficulties in patient recruitment despite the five‐centre participation.The results collected in these six patients (active stimulation n = 2; sham stimulation n = 4) have been published as an abstract. Many details on the methodology, participants, interventions and outcomes needed for a complete judgement of the methodology or for full incorporation into this review are missing. We tried to contact the authors but could not obtain additional information or data yet. Another attempt will be made by the next update of this review. Meanwhile, this trial is mainly incorporated into the qualitative (and not quantitative) synthesis.
5. Nucleus accumbens stimulation
Kowski 2015 is a cross‐over RCT in four patients (age 28 to 44 years) with pharmaco‐resistant partial‐onset epilepsy for nine to 15 years. The mean baseline frequency of 'disabling' seizures (complex partial or generalized tonic‐clonic seizures) ranged between four and 20 seizures per month, one patient additionally reported 99 simple partial seizures per month. Resection or further invasive assessment had been dismissed or surgery had been unsuccessful and patients preferred participation in the study above vagus nerve stimulation or standard anterior thalamic DBS treatment. After a three‐month baseline period, depth electrodes were bilaterally implanted in the nucleus accumbens and the anterior nucleus of the thalamus. One month after surgery, patients were randomized to receive first either nucleus accumbens stimulation or sham stimulation. These two treatment blocks lasted three months each and were both followed by a one‐month washout period. The blinded evaluation period (BEP) was followed by a three‐month open‐label period during which nucleus accumbens DBS was continued only in those patients who had experienced a ≥ 50% reduction in frequency of disabling seizures. Additionally, anterior thalamic DBS was switched on in all patients. All outcomes considered for this review were evaluated.
6. Closed‐loop ictal onset zone stimulation
Morrell 2011, also known as the Neuropace study, was a parallel‐group RCT in 191 patients (age 18 to 66 years) with intractable partial‐onset seizures for two to 57 years with one (45%) or two (55%) seizure foci. The mean daily baseline seizure frequency was 1.2. After a 12‐week baseline period, one or two recording and stimulating depth or subdural cortical strip leads, or both, were surgically placed in the brain according to the seizure focus or foci. A four‐week postoperative stabilization period (neurostimulator programmed to sense and record the electrocorticogram; all patients) and a four‐week stimulation optimization period (optimization of stimulation parameters; only patients randomized to treatment group) preceded the 12‐week BEP during which, in half of the participants, the seizure focus was stimulated in response to epileptiform electrographic events. This was followed by an open‐label evaluation period with stimulation 'on' in all patients. All outcomes considered for this review were evaluated in this trial. For the adverse events related to the surgical procedure, the permanent presence of an implanted device (e.g. infection) and sudden unexpected death in epilepsy patients (SUDEP) rate (adverse events for which the long‐term open‐label data were also taken into account), long‐term results in the published articles were often only reported together with those of a preceding open‐label trial (n = 65, for more details see Bergey et al. 2015 in Morrell 2011).
Excluded studies
Sixty‐one trials (63 records) were excluded because they were not randomized controlled trials. In 11 trials intracranial stimulation was not used to treat refractory epilepsy patients but served other purposes (Brown 2006; Esteller 2004; Fell 2013; Galvez‐Jimenez 1998; Huang 2008; Levy 2008; Miller 2015; Nguyen 1999; Pahwa 1999; Tanriverdi 2009; Torres 2013). Finally, Fregni and colleagues evaluated transcranial direct current stimulation instead of intracranial stimulation (Fregni 2005; Fregni 2006).
Risk of bias in included studies
Detailed assessments of each 'Risk of bias' item for each included study can be found in the 'Risk of bias' tables in the section 'Characteristics of included studies'. A summary of the review authors' judgements is shown in Figure 2.

'Risk of bias' summary: review authors' judgements about each risk of bias item for each included study.
Allocation
Methods for random sequence generation and treatment allocation concealment (selection bias) were often poorly described in the published articles. After personal communication with the authors, however, these were found to be adequate in all trials for which such additional information could be obtained. As some authors could not be contacted or provide any further explanation, there remained some uncertainty about three trials (Tellez‐Zenteno 2006; Wiebe 2013; Wright 1984).
Blinding
All 12 trials were reported to be double‐blind RCTs. However, only for nine out of the 12 included trials was the blinding of patients, personnel and outcome assessors assessed as adequate.Some uncertainty remained with regards to Van Buren 1978. For this RCT (which contained both double‐blind and unblinded evaluation periods, see above), it was not reported whether neuropsychological testing was performed during the blinded or unblinded evaluation period and if the sealed notes containing the treatment code for the double‐blind evaluation period were double‐opaque and by whom they were handled (for more details: see Characteristics of included studies). Although the double‐blinding procedure in Velasco 2000a seemed adequate, the authors compared seizure frequency between stimulation 'off' periods (blinded) and the three‐month periods preceding these. Only in about 50% of participants, these latter periods coincided with blinded stimulation 'on' periods. For the other half, these three months corresponded to unblinded stimulation 'on' periods, which could have resulted in performance or detection bias (the seizure frequency during blinded stimulation 'on' periods could not be obtained from the authors). Both the protocol and abstract of Wiebe 2013 described the trial to be double‐blind but the lack of further details hindered a more in‐depth judgement of the blinding procedure.
Morrell 2011 was the sole study where patients were asked at the end of the BEP if they knew or could guess if they had received 'real' or sham stimulation. This was of particular importance in this trial as stimulation parameters were determined individually after randomization and only in patients allocated to the stimulation group (for more details: see Characteristics of included studies).
Incomplete outcome data
Risk of bias arising from incomplete outcome data was assessed as high for Fisher 1992. In this study, one of the two patients who improved noticeably with stimulation experienced a marked seizure frequency increase in the washout period and, therefore, was dropped from the blinded protocol, after which stimulation was successfully reinstalled. As there were only seven patients (two responders), this one patient represented a significant proportion, especially when taking into consideration the reason for dropout and the fact that a paired analysis of outcome data did not allow inclusion of this patient in the (default) meta‐analysis. Although there is no evidence for incomplete outcome data leading to attrition bias in Wiebe 2013, insufficient details prevented full appreciation.
Selective reporting
Evidence suggesting selective reporting was present for a number of trials. Statistical analysis included only a subgroup of patients in Fisher 1992 (only patients with generalized tonic‐clonic seizures, not prespecified in the 'Methods' section), or a subset of available data in McLachlan 2010 (median monthly seizure frequency instead of total number of seizures). As raw data were published in the original articles or provided upon our request, this had no influence on the review.
Fisher 2010 did not report on or mention all available outcome measures in the published paper (for example, seizure‐free days and seizure‐free intervals), but only reported that 'changes in additional outcome measures did not show significant differences'. Again, this had no direct consequences for this review as these outcome variables were not taken into consideration.
Only for Kowski 2015 was a detailed study protocol available as the study had been registered beforehand in the German Trial Registry. All outcomes mentioned in the protocol were reported on in the published paper in a very detailed and extensive way. Such a detailed study protocol was not available for the other trials. However, as it is unusual for trial protocols to be available unless the trial is very recent, risk of reporting bias was judged as low when there was no strong evidence of selective reporting.
In various trials results were incompletely reported, however without strong evidence of selective reporting.
-
As mentioned above, the results of Wiebe 2013 were only published as an abstract, inherently associated with many missing details. This prevented full inclusion in our meta‐analysis so results were mainly incorporated in the qualitative synthesis.
-
Seizure frequency reduction in Velasco 2000a and Velasco 2007 was only presented in graphs. As exact figures could only be provided by Velasco 2007, this prevented inclusion of Velasco 2000a in our meta‐analysis.
-
Neuropsychological testing results were often only reported to be non‐significant (Fisher 1992; Wright 1984) or were incompletely published (Tellez‐Zenteno 2006). However, as: 1) neuropsychological testing yields too abundant data for publication in a journal article (and therefore not entirely reporting them does not necessarily reflect study quality), and 2) we did not attempt to incorporate these results into a meta‐analysis, but rather described them in a qualitative way; we think this is of less concern for this review.
-
Finally, as not all exact figures with regards to adverse events, neuropsychological outcome and quality of life could be reported in Morrell 2011 (too much data), the authors provided us with these data.
Outlasting effect after prior stimulation
Five trials with a parallel‐group design (Fisher 2010; Morrell 2011; Velasco 2005; Velasco 2007; Wiebe 2013) and two cross‐over trials with a three‐month washout period (Fisher 1992; McLachlan 2010) were judged as being at low risk of bias. Two cross‐over trials (Tellez‐Zenteno 2006; Wright 1984) did not contain any washout period, which could mask or reduce any treatment effect if stimulation had an outlasting effect. This was even more true for Van Buren 1978 and Velasco 2000a, two cross‐over trials for which the randomized evaluation took place only after six to 21 months of stimulation, without any washout period. Kowski 2015 was a cross‐over study with a one‐month washout period after three months of stimulation which might be too short, although we recognize that clear judgements on this issue are difficult to make and arbitrary (unclear risk of bias).
Antiepileptic drug (AED) policy
In all trials providing details on the AED policy, the AED regimen was kept unchanged except for Tellez‐Zenteno 2006 in which it was changed in three out of four patients during the trial. Morrell 2011 allowed benzodiazepines for seizure clusters or prolonged seizures, but it was unlikely this significantly influenced the reported results. Only for Wiebe 2013 were details on the AED policy not available.
Effects of interventions
See: Summary of findings for the main comparison Anterior thalamic nucleus stimulation; Summary of findings 2 Centromedian thalamic nucleus stimulation; Summary of findings 3 Cerebellar stimulation; Summary of findings 4 Hippocampal stimulation; Summary of findings 5 Nucleus accumbens stimulation; Summary of findings 6 Responsive ictal onset zone stimulation
See: Figure 3; Figure 4; Figure 5; Figure 6.
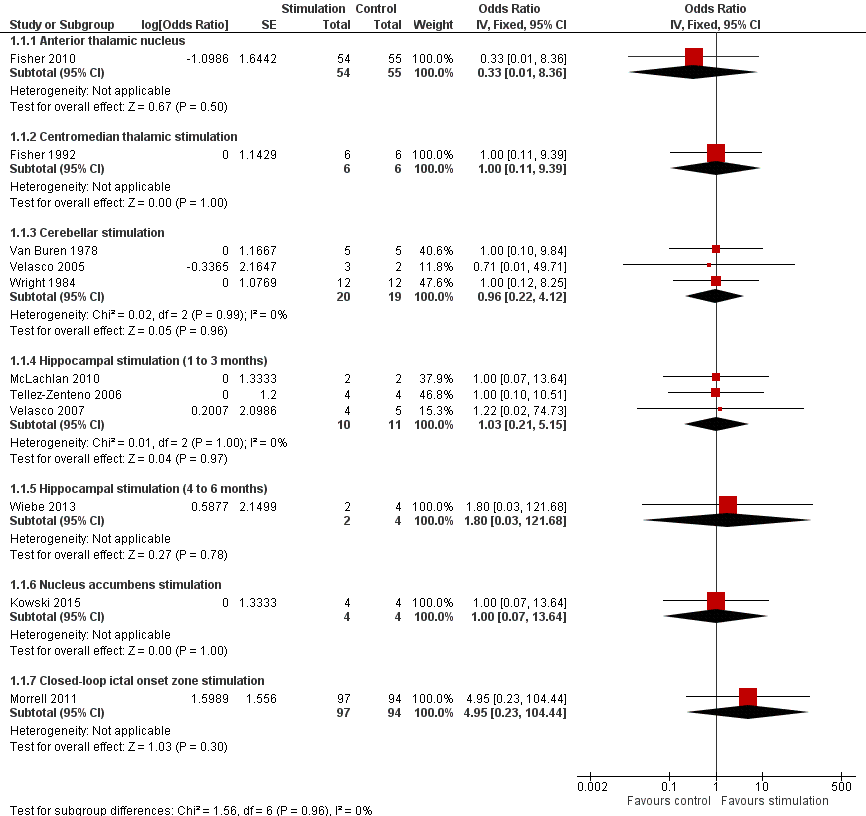
Forest plot of comparison: 1 Stimulation versus sham stimulation, outcome: 1.1 Seizure freedom.

Forest plot of comparison: 1 Stimulation versus sham stimulation, outcome: 1.2 Responder rate.
![Forest plot of comparison: 1 Stimulation versus sham stimulation, outcome: 1.3 Seizure frequency reduction.Note: Fisher 2010 (anterior thalamic nucleus stimulation) and Morrell 2011 (closed‐loop ictal onset zone stimulation) estimated the treatment effect and its standard error on a logarithmic scale, using the generalized estimating equation (GEE) model. As in this figure standard errors could not be inputted on the logarithmic scale, the values for the 95% confidence interval presented here differ slightly from the (more correct) values mentioned in the text. These correct values are ‐17.4% with 95% CI [‐31.2;‐1.0] for Fisher 2010 and ‐24.9% with 95% CI [‐40.1;‐6.0] for Morrell 2011.](/cdsr/doi/10.1002/14651858.CD008497.pub3/media/CDSR/CD008497/image_n/nCD008497-AFig-FIG05.png)
Forest plot of comparison: 1 Stimulation versus sham stimulation, outcome: 1.3 Seizure frequency reduction.
Note: Fisher 2010 (anterior thalamic nucleus stimulation) and Morrell 2011 (closed‐loop ictal onset zone stimulation) estimated the treatment effect and its standard error on a logarithmic scale, using the generalized estimating equation (GEE) model. As in this figure standard errors could not be inputted on the logarithmic scale, the values for the 95% confidence interval presented here differ slightly from the (more correct) values mentioned in the text. These correct values are ‐17.4% with 95% CI [‐31.2;‐1.0] for Fisher 2010 and ‐24.9% with 95% CI [‐40.1;‐6.0] for Morrell 2011.

Forest plot of comparison: 1 Stimulation versus sham stimulation, outcome: 1.4 Quality of Life. To measure quality of life, Tellez‐Zenteno 2006 and Morrell 2011 used the QOLIE‐89 questionnaire, Fisher 2010 used the QOLIE‐31 questionnaire (= abbreviated form of the QOLIE‐89 questionnaire) and Kowski 2015 usde the QOLIE‐31‐P questionnaire (slightly modified version of the QOLIE‐31 questionnaire). These questionnaires have the same range and for the QOLIE‐89 and QOLIE‐31 questionnaires very similar means, standard deviations and minimum clinically important change values in the same population have been reported (Cramer 1998; Devinsky 1995; Wiebe 2002). For this reason results from the different trials are presented in one forest plot (see also Methods section). For the QOLIE‐89 and QOLIE‐31 questionnaires, improvements of 5‐11.7 have been defined in literature (Borghs 2012; Cramer 2004; Wiebe 2002) as being clinically meaningful, positive is better.
1. Anterior thalamic nucleus stimulation
a. Seizure freedom
During the three‐month blinded randomized phase of Fisher 2010 1/55 patients in the control group was seizure‐free versus 0/54 in the stimulated group (odds ratio (OR) 0.33; 95% confidence interval (CI) 0.01 to 8.36; one study, 109 participants; moderate‐quality evidence ) (Analysis 1.1).
b. Responder rate
Responder rate was not significantly different in the stimulated (29.6%) compared to the control (25.9%) group (OR 1.20; 95% CI 0.52 to 2.80; one study, 108 participants; moderate‐quality evidence) (Analysis 1.2).
c. Seizure frequency reduction
Over the entire blinded randomized period anterior thalamic nucleus stimulation resulted in a significantly (mean difference (MD), ‐17.4%; 95% CI ‐31.2 to ‐1.0; one study, 108 participants; high‐quality evidence) higher seizure frequency reduction compared to sham stimulation (Analysis 1.3). The authors reported a trend for increasing differences in median monthly seizure frequency reduction over time between the groups (stimulation versus control: month one: ‐33.9% versus ‐25.3%, month two: ‐42.1% versus ‐28.7% and month three: ‐40.4% versus ‐14.5%; the adjusted treatment effects being ‐10% (P = 0.37), ‐11% (P = 0.34) and ‐29% (P = 0.002), respectively).
d. Adverse events
Adverse events were evaluated in one trial (109 participants, moderate‐quality evidence). During the blinded evaluation period (BEP), two self‐reported adverse events occurred significantly more frequently in the stimulated group compared to the control group: depression (14.8% versus 1.8%; P = 0.02, Fisher's Exact Test) and subjective memory impairment (13.0% versus 1.8%; P = 0.03). On the contrary, there were significantly fewer epilepsy‐related injuries (7.4% versus 25.5%; P = 0.01). Differences for other adverse events were not statistically significant and included: confusional state (7.4% versus 0.0%; P = 0.06), anxiety (9.3% versus 1.8%; P = 0.11), paraesthesia (9.3% versus 3.6%; P = 0.27), new or worse partial seizures with secondary generalization (9.3% versus 5.5%; P = 0.48) and new or worse simple (5.6% versus 1.8%; P = 0.36) or complex (9.3% versus 7.3%; P=0.74) partial seizures. One patient experienced 210 complex partial seizures in the three days after turning on the stimulator (baseline seizure frequency of 19 seizures per month), resolving with reprogramming of the stimulator.
Within the first year after implantation, five (4.5%) asymptomatic haemorrhage events were reported (four after the initial implant procedure, one following a seizure and a fall and remote from the lead tract). All were asymptomatic. Ten participants (9.1%; 4.5% within first postoperative month) developed implant site infections (12.7% after five years of follow‐up). There were no parenchymal brain infections. In five patients (4.5%), this eventually led to (temporary) hardware removal (8.2% after five years). Leads initially implanted outside the target structure had to be replaced in 8.2% of participants. Implant site pain was reported by 10.9% of participants during the first year of the trial (20.9% after five years). Five participants (4.5%) experienced status epilepticus during the first year after electrode implantation, two of them with stimulation 'on': one during month two of the blinded phase (complex partial status), and one when the stimulator was turned on after the blinded phase (complex partial status, resolving within five days after switching stimulation off) (6.4% after five years, 3.6% with stimulation ON). The first reported SUDEP (sudden unexpected death in epilepsy patients) rate during stimulation (two SUDEPs over 325 patient‐years with stimulation = 6.2 per 1000 patient‐years) fell within the range reported in comparable refractory epilepsy populations (2.2 to 10 per 1000 patient‐years) (Tellez‐Zenteno 2005; Tomson 2008) and long‐term open‐label follow‐up has now recently reported a SUDEP rate of 2.9 per 1000 patient‐years (95% CI 0.3 to 10.4).
e. Neuropsychological outcome
Although self‐reported depression and subjective memory impairment occurred significantly more frequently in the stimulated group (see above), changes in neuropsychological test scores for cognition and mood were very similar in the treatment and control groups and were not significantly different (one study, 96 to 100 participants; moderate‐quality evidence). The evaluated items can be found in Characteristics of included studies. Looking at the individual patients, worsening (> 1 standard deviation change (SD)) of Profile of Mood States Depression subscale (POMS‐D) was present in 3/8 stimulated participants with self‐reported depression. None of the seven patients with subjective memory impairment showed worsening (> 1 SD) of verbal or visual memory scores.
f. Quality of life
Changes from baseline in overall QOLIE‐31 scores were comparable for the treatment (+ 2.5) and control (+ 2.8) group. The MD in change score (‐0.30) was neither statistically (95% CI ‐3.50 to 2.90; one study, 105 participants; high‐quality evidence) nor clinically significant (positive is better, improvements of 5 to 11.7 have been defined in the literature (Borghs 2012; Cramer 2004; Wiebe 2002) as being clinically meaningful) (Analysis 1.4).
2. Centromedian thalamic nucleus stimulation
a. Seizure freedom
None of the patients in the Fisher 1992 trial (two hours of intermittent stimulation per day) achieved seizure freedom, neither with nor without stimulation (OR 1.00; 95% CI 0.11 to 9.39; one cross‐over trial, 12 treatment periods; very low‐quality evidence) (Analysis 1.1).
Although one patient was completely seizure‐free at the maximum open‐label follow‐up (minimum follow‐up of one year, mean 41.2 months), Velasco 2000a (24 hours of intermittent stimulation per day) did not report on differences in seizure freedom between stimulation 'on' versus 'off' periods in the double‐blind protocol performed between month six and month 12 of the trial. However, as mean seizure frequency reductions were very similar in both groups, major differences in seizure freedom seem unlikely.
b. Responder rate
Statistically significant differences in responder rate, favouring either the stimulation or the control group, could not be demonstrated by Fisher 1992 (OR 1.00; 95% CI 0.27 to 3.69; one cross‐over trial, 12 treatment periods; very low‐quality evidence) (Analysis 1.2). Two patients did experience ≥ 50% seizure frequency reductions with stimulation 'on' compared to baseline, but one of them had a similar reduction without stimulation and the other could not be included in a paired analysis as he was dropped from the blinded protocol due to a seizure frequency increase during the washout period (see also 'Sensitivity analyses').
Eleven out of 13 patients showed ≥ 50% seizure reductions at maximum follow‐up in Velasco 2000a, but again the authors did not report on differences in responder rates between stimulation 'on' versus 'off' periods. As for seizure freedom, however, important differences in responder rate were improbable as mean seizure frequency reductions were comparable for stimulation 'on' and 'off' periods.
c. Seizure frequency reduction
Paired analysis (thus excluding one patient) revealed a non‐significant 7.1% seizure frequency increase during stimulation 'on' compared to stimulation 'off' periods in Fisher 1992 (95% CI ‐44.1 to 58.2; one cross‐over trial, 12 treatment periods; very low‐quality evidence) (Analysis 1.3). Successive months of stimulation were not associated with a clear trend for increasing efficacy over time during the three‐month stimulation 'on' period.
Velasco 2000a found very similar and statistically not significantly different reductions in seizure frequency during stimulation 'off' periods in the double‐blind phase of the trial and the three‐month period preceding it (with stimulation 'on'). Graphs showed approximately a mean 75% reduction in total seizure frequency during stimulation 'on' as well as stimulation 'off' periods (P = 0.23).
Some open‐label trials have reported that complex partial seizures may be less prone to centromedian thalamic nucleus stimulation (Velasco 1993; Velasco 1995). Excluding patients with only complex partial seizures (n = 1) in a subgroup analysis of Fisher 1992 showed a non‐significant ‐8.9% MD in seizure frequency reduction (95% CI ‐79.0 to 61.3%). Although, compared to baseline seizure frequency, reductions in generalized tonic‐clonic seizures and atypical absences in Velasco 2000a were more pronounced than those found for complex partial seizures, very similar reductions in seizure frequency were found for any seizure type during stimulation 'on' and 'off' periods and statistically significant differences could not be demonstrated (P values being 0.27, 0.29 and 0.72, respectively).
d. Adverse events
Stimulation‐related side effects did not occur in Fisher 1992 or Velasco 2000a (two cross‐over trials, 38 treatment periods; low‐quality evidence). Fisher 1992 explicitly reported that no single patient had new seizures or worsening of seizures after initiation of stimulation.
However, various patients in both trials experienced some device‐ or procedure‐related adverse events (two cross‐over trials, 21 participants; low‐quality evidence). One patient in Fisher 1992 required repair of the connection to the pulse generator on one side because no stimulation effect was evident at any intensity, either behaviourally or by electroencephalogram (EEG) monitoring. A post implantation computed tomography (CT) scan in another patient revealed an asymptomatic and minimal haemorrhage in the vicinity of one depth electrode. Skin erosion forced explantation in three patients of the Velasco 2000a trial, including two children (five and six years old) whose stimulators had to be removed before the double‐blind protocol took place. Young children seemed particularly vulnerable to skin erosions because of the size of the hardware, which is designed for an adult population.
e. Neuropsychological outcome
Multivariate analysis with repeated measures showed no significant differences in any of the neuropsychological tests between baseline and stimulation 'on' and 'off' periods in Fisher 1992 (one cross‐over trial, 12 treatment periods; very low‐quality of evidence). The cognitive assessment battery can be found in Characteristics of included studies.
f. Quality of life
Neither of the two studies evaluated the impact of centromedian thalamic stimulation on quality of life.
3. Cerebellar stimulation
a. Seizure freedom
Regardless of stimulation status, seizure freedom could not be achieved in any of the trials evaluating cerebellar stimulation (pooled OR 0.96; 95% CI 0.22 to 4.12; three trials, 39 treatment periods; moderate‐quality evidence) (Analysis 1.1).
b. Responder rate
Cerebellar stimulation did not result in a statistically significantly higher responder rate compared to sham stimulation (pooled OR 2.43; 95% CI 0.46 to 12.84; three trials, 33 treatment periods; low‐quality evidence) (Analysis 1.2). In the treatment groups, there were 1/5 (Van Buren 1978), 1/9 (Wright 1984) and 2/3 (Velasco 2005) responders, whereas sham stimulation was associated with a ≥ 50% reduction in seizure frequency in 1/5, 0/9 and 0/2 patients, respectively.
There were no responders with contingent stimulation in Wright 1984 (OR 1.00; 95% CI 0.12 to 8.64).
c. Seizure frequency reduction
The pooled mean treatment effect was a MD ‐12.4% change in seizure frequency in favour of cerebellar stimulation, but this effect did not reach statistical significance (95% CI ‐35.3 to 10.6; three trials, 33 treatment periods; low‐quality evidence) (Analysis 1.3). Only Velasco 2005 reported enough details to evaluate a possible trend for increasing efficacy over successive months of stimulation. Although the treatment effect was most pronounced in the third month of stimulation (month one: ‐54% versus ‐29%, month two: ‐31% versus ‐14%, month three: ‐82% versus ‐14%), the small number of patients and the observed variability make it premature to draw any conclusions on this issue. Finally, Van Buren 1978 stated that no slow trends toward improvement could be noticed.
Contingent stimulation was not associated with changes in seizure frequency in Wright 1984 (treatment effect +0.9%; 95% CI ‐23.2 to 24.9%).
d. Adverse events
Stimulation‐related side effects were not reported in any of the trials (three trials, 39 treatment periods; low‐quality evidence). Psychiatric evaluation after completion of the Wright 1984 trial did not detect adverse psychiatric sequelae as a result of the stimulation trial.
In contrast, device‐ or procedure‐related adverse events were not uncommon (three trials, 22 participants; low‐quality evidence). Electrode migration necessitating repeated surgery occurred in 3/12 and 3/5 patients in Wright 1984 and Velasco 2005, respectively. An electrode lead causing pain needed to be repositioned in one patient and a receiver pocket that had burst open had to be resutured in another (Wright 1984). Leakage of cerebrospinal fluid into the subcutaneous apparatus tracts required resuturing in 3/5 patients of Van Buren 1978, and Wright 1984 reported that most patients experienced temporary swelling over one or both receiver sites, presumably due to cerebrospinal fluid accumulation, but that this spontaneously resolved. A subcutaneous seroma had to be drained in one of the patients in Velasco 2005. Wound infections could be settled with antibiotics in two patients but required total hardware removal in one patient (Velasco 2005; Wright 1984). Finally, repeated surgery was performed in another two patients due to a defective receiver and abdominal wound erosion (Wright 1984). Taken all together, in every trial about half of the patients required repeated surgery (3/5 in Van Buren 1978, 6/12 in Wright 1984 and 3/5 in Velasco 2005).
e. Neuropsychological outcome
Neuropsychological outcome was assessed in two cross‐over trials (32 treatment periods; very low‐quality evidence). Each patient in Wright 1984 was assessed by a clinical psychologist in every phase of the trial but 'psychometry' could not reveal any major change in any of the patients. More details were provided by Van Buren 1978. Consistent changes in full scale intelligence or memory quotients could not be detected, nor were there any significant changes in subtests (performance and oral intelligence quotient). Comparing 'on' to 'off' stimulation, the test scores of the four individuals they evaluated showed very similar results in two participants, a moderate increase in one patient, and a moderate decrease in another.
f. Quality of life
None of the trials on cerebellar stimulation formally evaluated impact on quality of life (very low‐quality evidence). However, Wright 1984 reported that all his patients but one felt better for cerebellar stimulation, thought it had helped them, and wished to continue it after completion of the trial. However, only five patients chose one phase of the trial as being different from the others: two singled out the continuous, one the contingent, and two others the no‐stimulation phase. Moreover, only one patient's subjective impression agreed with the authors' assessment and in this patient the no‐stimulation period was his best. Finally, one patient reported a reduction of episodes of incontinence with contingent but not continuous stimulation, which beneficially affected his social possibilities.
4. Hippocampal stimulation
Four trials evaluated hippocampal stimulation, three of these had a BEP with one to three months of active stimulation and one parallel‐group RCT (Wiebe 2013) had a six‐month BEP. As results of the first three‐month epoch of the latter were not reported and could not be obtained, we could not include this trial into the analyses on the effect of one to three months of hippocampal stimulation.
4.1 Hippocampal stimulation (one to three months of stimulation)
a. Seizure freedom
No single patient was seizure‐free for the duration of the RCT they had been included in (pooled OR 1.03; 95% CI 0.21 to 5.15; three trials, 21 treatment periods; moderate‐quality evidence) (Analysis 1.1).
b. Responder rate
Hippocampal stimulation was not associated with significantly higher responder rates compared to sham stimulation (pooled OR 1.20; 95% CI 0.36 to 4.01; three trials, 21 treatment periods; low‐quality evidence) (Analysis 1.2). There were no responders in McLachlan 2010, 1/4 patient experienced a ≥ 50% reduction in seizure frequency with as well as without stimulation in Tellez‐Zenteno 2006, and Velasco 2007 reported 1/4 responder in the treatment group compared to 0/5 in the control group.
c. Seizure frequency reduction
Hippocampal stimulation significantly reduced seizure frequency with a pooled mean treatment effect of ‐28.1% (95% CI ‐34.1 to ‐22.2; three trials, 21 treatment periods; moderate‐quality evidence) (Analysis 1.3). None of the authors provided enough data to allow evaluation for trends of increasing efficacy over time.
d. Adverse events
No adverse events occurred in relation to stimulation and there were no early surgical complications in any of the trials (McLachlan 2010; Tellez‐Zenteno 2006; Velasco 2007; 15 participants, 21 treatment periods; low‐quality evidence). However, skin erosion and local infection 24 months after implantation required explantation in 3/9 patients in Velasco 2007.
e. Neuropsychological outcome
Neuropscychological outcome was assessed in two cross‐over trials (12 treatment periods; very low‐ quality evidence). Neuropsychological testing in Tellez‐Zenteno 2006 could not reveal significant differences between baseline, 'on' and 'off' periods in any of the formal or subjective measures (see Characteristics of included studies for the different tests they performed). Moreover, reported mean scores were exactly or nearly the same for the 'on' and 'off' periods. Of particular interest was a patient who previously had a right temporal lobectomy and whose memory scores were not influenced by left hippocampal stimulation. The Center for Epidemiologic Studies Depression (CES‐D) scale could not demonstrate meaningful changes in mood states during baseline (19), 'on' (20) and 'off' (18) stimulation periods.
McLachlan 2010 assessed the objective and subjective memory of their two patients during baseline, 'on', washout and 'off' periods. They found no changes in one participant and contradictory results in the other. This latter patient reported improved subjective memory during the stimulation 'on' period (baseline second, 'off' third to sixth and 'on' 12th to 13th percentile (pc), higher was better) but formal testing pointed towards worsening of verbal (baseline first, 'off' 14th and 'on' second pc) as well as visuospatial (baseline 21st, 'off' 42nd and 'on' first pc) memory.
f. Quality of life
Only Tellez‐Zenteno 2006 evaluated the impact of hippocampal DBS on quality of life (six treatment periods; very low‐quality evidence). Repeated (once per month) testing in three patients could not demonstrate statistically significant differences between QOLIE‐89 scores during baseline (57), 'on' (55) and 'off' (60) periods (treatment effect ‐5.0; 95% CI ‐53.3 to 43.3), which was obviously not surprising given the small number of patients (Analysis 1.4). This five‐point difference was clinically of borderline significance (positive was better, improvements of 5 to 11.7 have been defined in the literature (Borghs 2012; Cramer 2004; Wiebe 2002) as being clinically meaningful).
4.2 Hippocampal stimulation (four to six months of stimulation)
a. Seizure freedom
None of the patients were seizure‐free during either sham (n = 0/4) or hippocampal (n = 0/2) stimulation (OR 1.80; 95% CI 0.03 to 121.68; one study, six participants; very low‐quality evidence) (Analysis 1.1).
b. Responder rate
One out of two patients in the active stimulation group experienced a ≥50% reduction in seizure frequency compared to 0/4 in the sham group (OR 9.00; 95% CI 0.22 to 362.46; one study, six participants; very low‐quality evidence) (Analysis 1.2).
c. Seizure frequency reduction
The sham stimulation group reported a median seizure frequency increase of 60% compared to a 45% decrease in the stimulation group (P > 0.05, no information on statistical dispersion available; one study, six participants; very low‐quality evidence). When only counting complex partial and generalized tonic‐clonic seizures, the sham stimulation group experienced a 31.3% increase compared to a 50% increase in the stimulation group.
d. Adverse events
Adverse events were not reported (one study, six participants; very low‐quality evidence).
e. Neuropyschological outcome
Scores of cognitive scales assessing recall (Rey Auditory Verbal Learning Test, Rey Complex Figure Test) were generally lower in the active stimulation compared to the sham group (P > 0.05; one study, six participants; very low‐quality evidence).
f. Quality of life
The overall QOLIE‐89 score at seven months was worse by 13 points with sham stimulation compared to an improvement of three points with active stimulation (P > 0.05; one study, six participants; very low‐quality evidence). Positive changes correspond to a better quality of life, improvements of 5 to 11.7 points have been defined in the literature (Borghs 2012; Cramer 2004; Wiebe 2002) as being clinically meaningful.
Subjective memory scores using QOLIE‐89 memory scales decreased by 34 points with sham stimulation and increased by 10 points with active stimulation (P > 0.05). The QOLIE‐89 attention/concentration scores decreased by four points with sham and increased by 20 points with active stimulation (borderline statistically significant difference, P < 0.06)
5. Nucleus accumbens stimulation
a. Seizure freedom
None of the four patients in Kowski 2015 was seizure‐free during either nucleus accumbens or sham stimulation (OR 1.00; 95% CI 0.07 to 13.64; one cross‐over trial, eight treatment periods; low‐quality evidence) (Analysis 1.1).
b. Responder rate
Three out of four patients experienced a ≥50% seizure reduction during nucleus accumbens stimulation, whereas there were no responders during sham stimulation (OR 10.00; 95% CI 0.53 to 189.15; one cross‐over trial, eight treatment periods; low‐quality evidence) (Analysis 1.2). The same figures are obtained when excluding simple partial seizures (these only occurred in the non‐responding patient) and only taking into account the 'disabling' seizures (sum of complex partial and generalized tonic‐clonic seizures).
c. Seizure frequency reduction
Nucleus accumbens stimulation was associated with a statistically non‐significant ‐33.8% lower frequency compared to sham stimulation (95% CI ‐117.4 to 49.8; one cross‐over trial, eight treatment periods; low‐quality evidence) (Analysis 1.3). Exclusion of the simple partial seizures of the non‐responding patient yielded a ‐22.9% lower frequency of disabling seizures during nucleus accumbens compared to sham stimulation (95% CI ‐139.8 to 94.0).
d. Adverse events
Three out of four patients reported adverse events during the BEP (one cross‐over trial, eight treatment periods; low‐quality evidence). However, except for one patient feeling sad for two weeks during the active stimulation period after a close relative had died, there were no adverse events that were exclusively linked to the active stimulation period. Reported adverse events included: an increased frequency of disabling seizures (n = 1, both during sham and active stimulation), loss of interests (n = 1, both during sham and active stimulation), sleep disturbance (n = 2, one both during sham and active stimulation, one only during sham stimulation), a first‐time generalized tonic‐clonic seizure (n = 1, sham stimulation), depressive mood (n = 1, sham stimulation) and listlessness (n = 1, sham stimulation). Device‐ or procedure‐related adverse events occurred in one patient who developed a local subcutaneous infection with colonization of the pulse generator and the leads two weeks post‐surgery urging antibiotic therapy and hardware removal. This patient consented to participate again nine months later.
e. Neuropsychological outcome
Neurocognitive test scores were similar and not statistically significantly different during sham and active stimulation in this small trial (one cross‐over trial, eight treatment periods; low‐quality evidence). There were no categorical changes in Beck‐Depression‐Inventory scores during the BEP. However, the Mini International Neuropsychiatric Interview revealed a new‐onset major depression under nucleus accumbens stimulation in one patient and an ongoing low suicidal risk following one suicide attempt 10 years before the trial in another patient.
f. Quality of life
Compared to baseline, mean QOLIE‐31‐P total score was ‐2.1 lower during active stimulation and ‐4.9 lower during sham stimulation (treatment effect +2.8; 95% CI ‐7.4 to 13.0; one cross‐over trial, eight treatment periods; low‐quality evidence) (Analysis 1.4). The QOLIE‐31‐P is a (slightly) modified version of the QOLIE‐31 questionnaire for which changes of 5 to 11.7 have been defined in the literature (Borghs 2012; Cramer 2004; Wiebe 2002) as being clinically meaningful; positive scores indicate improvement.
6. Closed‐loop ictal onset zone stimulation
a. Seizure freedom
There were no statistically significant differences in seizures freedom during the three‐month BEP of Morrell 2011, with 2/97 and 0/94 patients being seizure‐free in the treatment and control group, respectively (OR 4.95; 95% CI 0.23 to 104.44; one study, 191 participants; moderate‐quality evidence) (Analysis 1.1).
b. Responder rate
With 28.9% of participants experiencing ≥ 50% reductions in seizure frequency in the treatment group compared to 26.6% in the group receiving sham stimulation, stimulation status did not significantly influence responder rates (OR 1.12; 95% CI 0.59 to 2.11; one study, 191 participants; moderate‐quality evidence) (Analysis 1.2).
c. Seizure frequency reduction
Closed‐loop stimulation of the ictal onset zone significantly reduced seizure frequency, the treatment effect being ‐24.9% (95% CI ‐40.1% to ‐6.0%; one study, 191 participants; high‐quality evidence) (Analysis 1.3). A trend for increasing efficacy over time could be observed during the three‐month BEP, with statistically significant reductions in seizure frequency from the second month of stimulation on (treatment versus control group: month one: ‐34.2% versus ‐25.2% (P = 0.28), month two: ‐38.1% versus ‐17.2% (P = 0.016) and month three: ‐41.5% versus ‐9.4% (P = 0.008)).
d. Adverse events
There were no significant differences between the treatment and sham groups in the percentages of patients with mild or serious adverse events (overall or for any type) (one study, 191 participants; moderate‐quality evidence). In fact, with the exception of increased complex partial seizures (treatment versus sham: n = 2 versus n = 2), headache (n = 3 versus n = 1) and incision site infection (n = 2 versus n = 0), each individual type of device‐related (definite or uncertain) adverse event occurred in no more than one participant in the treatment group. Two participants had device‐related serious adverse events: one patient in the treatment group and another in the control group had one and three events related to a change in seizures, respectively.
Postoperative intracranial haemorrhage considered as serious adverse events occurred in 1.6% of patients but none of the patients had permanent neurologic sequelae. After five years, serious intracranial haemorrhages had occurred in 4.7% of patients (additional cases mainly due to seizure‐related trauma). Postoperative implant or incision site soft tissue infections occurred in 2.0% of patients, urging explantation in 0.5%. After five years, 9.4% of patients had experienced soft tissue infection (additional cases mainly upon battery replacement, explantation in the majority of cases). There were no parenchymal brain infections. The most frequently reported adverse events during the first year of the trial were related to the cranial implantation of the pulse generator and included implant site pain (15.7%), headache (10.5%), procedural headache (9.4%) and dysaesthesia (6.3%). Although the SUDEP rate reported in the first manuscript (four SUDEPs over 340 patient‐years = 11.8 per 1000 patient‐years) was slightly higher than that usually reported in refractory epilepsy patients (2.2 to 10 per 1000 patient‐years) (Tellez‐Zenteno 2005; Tomson 2008), longer follow‐up during the open‐label period has now reported reassuring figures: SUDEP rates of 3.5 per 1000 patient implant years (95% CI 1.5 to 8.5) and of 2.6 per 1000 patient stimulation years (95% CI 1.0 to 7.0).
e. Neuropsychological outcome
Neuropsychological assessment at the end of the BEP could not reveal any significant differences between the treatment and sham groups in any measure (one study, 160 to 177 participants; high‐quality evidence). In addition, there were no adverse changes in mood inventories at the end of the blinded phase of the trial. The neuropsychological and mood assessment batteries can be found in Characteristics of included studies. Self‐reported depression occurred in one patient in each group and subjective memory impairment was reported by one participant belonging to the treatment group.
f. Quality of life
Changes from baseline in overall QOLIE‐89 scores were comparable for the treatment (+2.04) and control (+2.18) groups. The MD in change score (‐0.14) was neither statistically (95% CI ‐2.88 to 2.60; one study, 180 participants; high‐quality evidence) nor clinically significant (positive was better, improvements of 5 to 11.7 have been defined in the literature (Borghs 2012; Cramer 2004; Wiebe 2002) as being clinically meaningful) (Analysis 1.4). These conclusions applied to the overall as well as any subscale QOLIE‐89 score.
Sensitivity analyses
Expressing treatment effects of dichotomous outcomes as risk ratios (RR) instead of odds ratios (OR) did not change our conclusions (Analysis 2.1; Analysis 2.2). For seizure freedom (Analysis 2.1), effect estimators were nearly identical however with slightly smaller CIs. With regards to the responder rate (Analysis 2.2), effect estimators were (discretely) lower and CIs smaller when using RR.
Empty cells hindered calculation of ORs or RRs. In these situations, it is customary to add +0.5 to each cell (Deeks 2011). Given the small number of included patients in most trials, we examined if adding +0.25 instead of +0.5 would change our conclusions (Analysis 2.3; Analysis 2.4; Analysis 2.5; Analysis 2.6). In general, this was not the case. Concerning seizure freedom (Analysis 2.3; Analysis 2.5), however, CIs were larger (for all targeted structures, for OR as well as RR) and the treatment effect seemed more pronounced (but with higher uncertainty) for closed‐loop stimulation of the ictal onset zone. With regards to the responder rate (,Analysis 2.4; Analysis 2.6) treatment effect estimators and CIs were generally comparable although effect estimators were higher, but with a greater degree of uncertainty for nucleus accumbens stimulation and hippocampal DBS (four to six months of stimulation) besides a larger 95% CI for cerebellar stimulation.
Including only trials with a low risk of bias due to an outlasting effect after prior stimulation (and thus excluding three cross‐over trials without washout periods) did not change our conclusions. For cerebellar stimulation only one trial remained (Velasco 2005); and for hippocampal stimulation (one to three months of stimulation), the following pooled effect estimates were calculated: seizure freedom OR 1.06 (95% CI 0.12 to 9.62), responder rate OR 1.75 (95% CI 0.22 to 14.13) and seizure frequency reduction ‐28.5% (95% CI ‐34.6 to ‐22.4). Risks of other types of bias which could have directly influenced our conclusions were mainly present in the three cross‐over trials.
As the two participants in McLachlan 2010 experienced very similar treatment effects, the standard error associated with the MD in seizure frequency in this study was the lowest (3.13) among all trials on hippocampal stimulation. In this way, this very small cross‐over study (n = 2) substantially influenced the pooled mean treatment effect. As its weight in the standard analysis appeared disproportionally high (94%), we checked the robustness of the conclusions to the other extreme situation in which the standard error of this trial would be (equal to) the highest of all trials on hippocampal DBS. The sensitivity analysis using 29.01 (the standard error of Velasco 2007) instead of 3.13 as the standard error for McLachlan 2010 yielded a similar ‐28.2% treatment effect, however with a higher degree of uncertainty (95% CI ‐50.7 to ‐5.8). Excluding Tellez‐Zenteno 2006 (a cross‐over trial without washout period) in this latter analysis resulted in a ‐45.7% treatment effect for hippocampal stimulation (95% CI ‐85.9 to ‐5.5).
To avoid treatment effects > 100%, we directly compared 'on' and 'off' stimulation periods for Van Buren 1978 (see Appendix 1). However, taking baseline seizure frequency as the reference also for Van Buren 1978 (responder rate OR 2.40; 95% CI 0.21 to 26.82; seizure frequency reduction ‐123.5%; 95% CI ‐280.3 to 33.3) did not change our conclusion regarding the efficacy of cerebellar stimulation (responder rate OR 2.85; 95% CI 0.64 to 12.68; seizure frequency reduction ‐15.9%; 95% CI ‐40.3 to 8.5).
An unpaired analysis of Fisher 1992, including the patient who seemed to benefit from stimulation but whose absence of stimulation 'off' data (see Characteristics of included studies) prevented inclusion in a paired analysis, could not demonstrate a significant responder rate increase (OR 2.00; 95% CI 0.13 to 29.81) or reduction in seizure frequency (‐6.6%; 95% CI ‐93.7 to 80.5), even after exclusion of a patient with only complex partial seizures (OR 2.00; 95% CI 0.13 to 31.98; ‐20.7% 95% CI ‐101.6 to 60.2). Also other sensitivity analyses using data imputation to allow paired analyses did not change the conclusions on centromedian thalamic DBS, irrespective whether data imputation was done with a 'best‐case scenario' (responder rate 1.75 with 95% CI 0.38 to 8.06; mean seizure frequency ‐20.2% with 95% CI ‐100 to +65.6%), a 'worst‐case scenario' (responder rate 1.00 with 95% CI 0.36 to 2.66; mean seizure frequency +6.9% with 95% CI ‐47.0 to 60.8%) or a 'last observation carried forward scenario' (responder rate 1.00 with 95% CI 0.36 to 2.66; mean seizure frequency +6.1 with 95% CI ‐47.9 to 60.0%).
As there is some evidence for increasing efficacy of intracranial neurostimulation treatments over time, we decided to pool results per three‐month stimulation epochs only. As we could only identify one small trial with a BEP with active stimulation longer than three months (Wiebe 2013), this was in practice only relevant for the estimated pooled treatment effect of hippocampal stimulation. Combining all trials on hippocampal stimulation irrespective of the duration of active stimulation period did not change the conclusions of this review but did result into slightly more favourable pooled treatment effects for seizure freedom (OR 1.11; 95% CI 0.25 to 4.98) and the 50% responder rate (OR 1.46; 95% 0.47 to 4.58) (sensitivity analysis not possible for other outcomes due to lack of details on statistical dispersion).
Discussion
More than 30% of all epilepsy patients have pharmacologically refractory epilepsy (Kwan 2000). Epilepsy surgery is the first treatment of choice for these patients. However, most patients are not suitable surgical candidates, some are reluctant to undergo brain surgery, and many do not achieve long‐term seizure freedom (de Tisi 2011; Engel 2003). Other treatment options include vagus nerve stimulation, the ketogenic diet or inclusion in trials with newly developed drugs. However, these options yield seizure freedom in only a small minority of patients. Invasive brain stimulation, including deep brain and cortical stimulation, may be an alternative treatment for these patients. Uncontrolled open‐label trials have often shown promising but at the same time mixed results, and in addition are at high risk of bias. To increase our understanding of the efficacy and safety of invasive brain stimulation we performed a systematic review of the literature selecting only randomized controlled trials (RCTs).
Summary of main results
For a more detailed summary, see summary of findings Table for the main comparison; summary of findings Table 2; summary of findings Table 3; summary of findings Table 4; summary of findings Table 5; summary of findings Table 6.
We identified 10 RCTs which met our eligibility criteria and could be fully included in the meta‐analysis, including one trial on anterior thalamic nucleus deep brain stimulation (DBS) for (multi)focal epilepsy (n = 109), one trial on centromedian thalamic DBS for (multi)focal or generalized epilepsy (n = 7; 14 treatment periods due to cross‐over design), three trials on cerebellar stimulation for (multi)focal or generalized epilepsy (n = 22; 39 treatment periods), three RCTs on hippocampal DBS for medial temporal lobe epilepsy (n = 15; 21 treatment periods), one trial on nucleus accumbens stimulation (n = 4; eight treatment periods) and one trial on responsive stimulation of the ictal onset zone (one or two epileptogenic regions) (n = 191). In addition, the results of two RCTs were mainly qualitatively described as the unavailability of at least some exact figures prevented full inclusion in the meta‐analysis: one trial investigated centromedian thalamic DBS for (multi)focal or generalized epilepsy (n = 13; 26 treatment periods), and another compared six months of hippocampal stimulation to sham stimulation (n = 6). All trials compared active versus sham stimulation. For reasons of clinical heterogeneity, we did not combine results across different stimulated targets but pooled data per individual target. As an increasing efficacy over time has been reported in various trials (see also below) results were pooled per three‐month stimulation epochs.
Statistically significant effects on seizure freedom during the blinded evaluation periods (BEPs) (one to three months except for Wiebe 2013) could not be demonstrated for any target. However, the small number of trials and patients cannot exclude the possibility of clinically meaningful improvements for any target. Nevertheless, it should be noticed that across all different trials only three patients were seizure‐free for the duration of the BEP. Two of these belonged to the treatment group of the RCT evaluating closed‐loop stimulation of the ictal onset zone (OR 4.95; 95% CI 0.23 to 104.44) and another to the sham group of the trial on anterior thalamic nucleus DBS (OR 0.33; 95% CI 0.01 to 8.36).
Besides seizure freedom, the 50% responder rate was our other primary outcome measure. Statistically significant effects on responder rates after one to three months of stimulation could not be observed for any target, but again the wide CIs cannot exclude clinically meaningful changes for either the stimulation or the control group. The fact that ORs were ≥ 1.00 in every single trial and > 1.00 for every target (except for centromedian thalamic DBS: OR 1.00; 95% CI 0.27 to 3.69) do not suggest equivalence. However, apart from cerebellar (OR 2.43; 95% CI 0.46 to 12.84), nucleus accumbens (OR 10.0; 95% CI 0.53 to 189.15) and six months of hippocampal stimulation (OR 9.00; 95% CI 0.22 to 362.46), the pooled effect estimates seem of little clinical importance for anterior thalamic nucleus DBS (OR 1.20; 95% CI 0.52 to 2.80), one to three months of hippocampal DBS (OR 1.20; 95% CI 0.36 to 4.01) and responsive ictal onset zone stimulation (OR 1.12; 95% CI 0.59 to 2.11).
Statistically significant seizure frequency reductions due to one to three months of active stimulation were demonstrated for anterior thalamic DBS (‐17.4%; 95% CI ‐31.2 to ‐1.0) hippocampal DBS (‐28.1%; 95% CI ‐34.1 to ‐22.2) and responsive ictal onset zone stimulation (‐24.9%; 95% CI ‐40.1 to ‐6.0). When interpreting these results, one should keep in mind that these effect estimates may be rather conservative due to observed trends for increasing efficacy over time for anterior thalamic DBS (month one: ‐10%, month three: ‐29%) and responsive ictal onset zone stimulation (month one: ‐9%, month three: ‐32%) and a possible outlasting effect in the stimulation 'off' period in Tellez‐Zenteno 2006, a cross‐over trial on hippocampal DBS without any washout period. Significant reductions could not be demonstrated for cerebellar (‐12.4%; 95% CI ‐35.3 to 10.6%), centromedian thalamic (+7.1%; 95% ‐44.1% to 58.2%; no effect in another cross‐over trial (Velasco 2000a), P = 0.23), nucleus accumbens (‐33.4%; 95% CI ‐100% to +49.8%) or six months of hippocampal (active ‐45% versus sham +60%, P > 0.05) stimulation, although the small number of patients and possible carryover effects in stimulation 'off' periods in Velasco 2000a (centromedian thalamic DBS), Van Buren 1978 and Wright 1984 (cerebellar stimulation) preclude more definitive judgements.
Only for anterior thalamic DBS were there statistically significant differences in stimulation‐related adverse events. These included (treatment versus control group) depression (14.8% versus 1.8%; P = 0.02), subjective memory impairment (13.8% versus 1.8%; P = 0.03) and epilepsy‐related injuries (7.4% versus 25.5%; P = 0.01). In addition, confusional state and anxiety were more frequent, and standard stimulation parameters could be inappropriate and increase seizure frequency in a small minority of patients. For the other targets, stimulation‐related adverse events did not occur (centromedian thalamic DBS, cerebellar and hippocampal stimulation), or were not more prevalent in the treatment group (responsive ictal onset zone and nucleus accumbens stimulation). In general, however, the size of the included studies (in particular those on centromedian thalamic DBS, cerebellar, hippocampal and nucleus accumbens stimulation) is too limited to make more conclusive statements, although responsive ictal onset zone stimulation seems to be well‐tolerated. After initial concerns about the slightly elevated sudden unexpected death in epilepsy patients (SUDEP) rate mentioned in the first paper on responsive ictal onset zone stimulation, long‐term open‐label follow‐up has now been reassuring both for anterior thalamic DBS and responsive ictal onset zone stimulation.
The invasive nature of direct brain stimulation treatments resulted in various surgery‐ or device‐related adverse events. In the two largest trials, asymptomatic intracranial haemorrhages were detected postoperatively in 1.6% to 3.7% of participants and postoperative implant or incision site infection occurred in 2.0% to 4.5% of participants, increasing to 9.4% to 12.7% after five years of follow‐up urging (temporary) hardware removal in the majority of cases (Fisher 2010; Morrell 2011). Inadequate stereotactic placement of electrodes needed repeated surgery in 8.2% of patients in Fisher 2010. Electrode migration seems of particular concern for cerebellar stimulation electrodes (n = 6/22). Other adverse events included skin erosions, defective hardware, leakage of cerebrospinal fluid, a lead causing pain and a subcutaneous seroma. Cranial implantation of the neurostimulator in Morrell 2011 was associated with implant site pain (16% in year one), headache (11%), procedural headache (9%) and dysaesthesia (6%).
Statistically significant differences in formal neuropsychological testing results could not be demonstrated on the group level for any target. However, only for responsive ictal onset zone stimulation is there reasonable evidence for the absence of adverse neuropsychological sequelae. In contrast, the higher prevalence of depression and subjective memory impairment with anterior thalamic DBS (see above) and the low number of (neuropsychologically tested) participants in studies on centromedian thalamic, cerebellar, nucleus accumbens and hippocampal stimulation urge further research. In this respect, it should be mentioned that one (n = 1/6) patient receiving one to three months of hippocampal stimulation showed objective worsening of memory scores (although he reported a subjective memory improvement) and cognitive scales assessing recall were generally lower after six months of active compared to sham hippocampal stimulation (again, in contrast to increased subjective QOLIE‐89 memory and attention/concentration scales). In addition, results were often incompletely published and the content of the neuropsychological test battery was not clear for Wright 1984 (cerebellar stimulation) and Wiebe 2013 (six months of hippocampal stimulation).
Anterior thalamic nucleus DBS and responsive ictal onset zone stimulation do not significantly improve or worsen quality of life after three months of stimulation. With regards to the other targets, only two trials on hippocampal stimulation (n = 9) (Tellez‐Zenteno 2006; Wiebe 2013) and one trial on nucleus accumbens stimulation (n = 4) (Kowski 2015) have formally evaluated quality of life, while in Wright 1984, the patients' impressions on cerebellar stimulation were described. Even for those targets, however, data are too sparse to make any sensible conclusion.
Overall completeness and applicability of evidence
Currently available evidence is far from complete. The completeness and applicability of the evidence are highly dependent on its quality. All factors limiting the quality of the evidence at the same time limit, to a greater or lesser extent, the completeness and applicability of the evidence. In this review this is especially the case for the small number of trials and patients in which deep brain and cortical stimulation have been studied. Furthermore, only a subset of trials have evaluated the impact of stimulation on the neuropsychological outcome (nine out of 12 trials, with varying degree of extensiveness of testing) and on quality of life (only five to six out of 10 trials). More large and well‐designed RCTs are definitely needed to demonstrate or exclude benefits and side effects of invasive brain stimulation therapies. This applies to every single target although there are important differences between the different targeted structures. Taken together, evidence is most complete for responsive ictal onset zone stimulation, followed by anterior thalamic DBS, hippocampal DBS, cerebellar cortical stimulation, nucleus accumbens DBS and finally centromedian thalamic DBS. In addition, several other targets have yielded promising results in uncontrolled open‐label trials but have not been studied in blinded and randomized conditions (or the results have not been published yet), for example the subthalamic nucleus (Chabardes 2002; Wille 2011), the caudate nucleus (Chkhenkeli 2004) and the motor cortex (Elisevich 2006).
Trials on cerebellar and centromedian thalamic DBS included both patients with (multi)focal epilepsy and patients suffering from generalized epilepsy. In contrast, trials on anterior thalamic DBS, hippocampal DBS, nucleus accumbens DBS and responsive ictal onset zone stimulation recruited only (multi)focal, temporal lobe, focal and focal (one or two epileptogenic regions) epilepsy patients, respectively. Although this makes sense for hippocampal DBS and responsive ictal onset zone stimulation, further studies are needed to determine if anterior thalamic or nucleus accumbens DBS could also be useful for generalized epilepsy patients.
Only Velasco 2000a (centromedian thalamic DBS) recruited a substantial number of minors; 5/13 or 7/15 patients were between four and 15 years old. Authors reported that skin erosion may be of particular concern in children under eight years of age as a result of the relatively large size of the pulse generator and the leads, originally designed for an adult population. Of the other trials, Fisher 1992 (centromedian thalamic DBS), Velasco 2005 (cerebellar stimulation) and Velasco 2007 (hippocampal stimulation), each included one 14 to 16 year old adolescent, whereas in all other trials all patients were adult. Therefore, current evidence is basically limited to adult refractory epilepsy patients. Fisher 2010 (anterior thalamic DBS) and Wiebe 2013 (hippocampal DBS, six months) only allowed adults with normal mental capacities (intelligence quotient (IQ) > 70). These are important restrictions which should be taken into consideration when evaluating the overall completeness and applicability of current evidence. Furthermore, evidence is limited to stimulation parameters or parameter strategies used in the respective trials and to the RNS® System (NeuroPace, Mountain View, CA) for responsive ictal onset zone stimulation.
Besides the low number of trials and patients, the limited duration of the BEPs (one to three‐month stimulation 'on' periods in all but one small trial on hippocampal stimulation) represents a second major gap in the available evidence. This seems of particular concern for invasive brain stimulation therapies as increasing efficacy over time has been reported during BEPs in some RCTs (Fisher 2010; Morrell 2011), during open‐label follow‐up after completion of RCTs (Fisher 2010; Morrell 2011; Velasco 2007), and in some small open‐label trials (Franzini 2008; Khan 2009). Various RCTs have followed their patients for many months or years after the randomized and blinded phase had been finished and it may be relevant for the reader to cite the results they reported to illustrate the shortcomings of today's evidence. Fisher 2010 (anterior thalamic DBS) reported seizure freedom in 0% at the end of the BEP (n = 54), in 2.0% at the end of the ensuing nine month open‐label period (stimulation parameters adjusted on an individual basis, antiepileptic drug (AEDs) unchanged) (n = 99) and 11 of 83 (13.3%; 10% of all implanted participants) participants that were still in the trial after five years of follow‐up were seizure‐free for at least six months at the five‐year assessment (changes in the AED regimen were allowed). Responder rates were 30%, 43% (n = 99 participants with at least 70 diary days) and 68% (n = 59) respectively, with mean seizure frequency reductions of ‐40%, ‐41% and ‐69%. Fisher 1992 (centromedian thalamic DBS) observed a 50% seizure reduction in 3/7 patients (2/7 during the BEP) after an additional three to 13 months of open‐label follow‐up (24 hours of stimulation per day), the mean reduction in seizure frequency being ‐30% (‐7% during the BEP). With regards to the same target, Velasco 2000a reported seizure freedom in 1/13 patients (7.7%), a 85% responder rate and a mean 72% seizure frequency reduction at maximum follow‐up (12 to 94 months). Velasco 2005 (cerebellar stimulation) showed a 50% improvement in 2/3 patients during the BEP (mean seizure frequency reduction of 56%) and in 4/5 patients after 12 to 24 months follow‐up (68% reduction). The most spectacular improvement was found in Velasco 2007 (hippocampal stimulation) who reported seizure freedom in 4/9 patients after 18 months follow‐up (0/4 during the BEP), a 50% reduction in all nine patients (1/4 during the BEP) and a mean seizure frequency reduction of ‐85% (‐30% during the BEP). Finally, three‐month seizure freedom, the 50% responder rate and the median reduction in seizure frequency after two years of open‐label follow‐up (n = 174) in Morrell 2011 (responsive ictal onset zone stimulation) were 7.1%, 55% and 53% compared to 2.1%, 29% and 37.9%, respectively during the BEP. Notwithstanding that these open‐label data often show very favourable results, we would like to emphasize that at the same time these are at high risk of bias, including but not limited to placebo effects and improvements due to changes in AED or spontaneous evolution of the disease (see also below). Only one small RCT with longer than three months of active stimulation has been published to date and data are too sparse to make any sensible conclusion. More RCTs with a more extensive BEP are needed to unequivocally determine whether and to what extent the efficacy of invasive brain stimulation treatments increases over time. Meanwhile, we pooled results per three‐month stimulation epochs and reported for each individual study if and to what extent such an increasing efficacy over time was observed during the BEP.
Finally, although three RCTs are currently recruiting patients to compare deep brain stimulation (DBSI with resective surgery, 'usual' treatment and vagus nerve stimulation, respectively, all trials published so far have compared active to sham stimulation only.
Quality of the evidence
For a more detailed assessment of the quality of the evidence see summary of findings Table for the main comparison; summary of findings Table 2; summary of findings Table 3; summary of findings Table 4; summary of findings Table 5; summary of findings Table 6.
Several factors affect the quality of currently available evidence. Of major importance is the limited number of trials, which in addition mostly have very small sample sizes. Although this holds true for every target, this is of particular concern for centromedian thalamic DBS, cerebellar, hippocampal and nucleus accumbens stimulation. Moreover, neuropsychological testing and assessment of quality of life were only performed in a subset of trials. These limitations make it harder to demonstrate the statistical significance of clinically meaningful differences or to exclude the possibility of such improvements when clinically non‐meaningful differences are found.
In five cross‐over RCTs on cerebellar (n = 2/3), centromedian thalamic (n = 1/2), hippocampal (n = 1/4) and nucleus accumbens (n = 1/1) DBS, there was no or a possibly too short washout period before outcome measures were evaluated during stimulation 'off' periods (Kowski 2015; Tellez‐Zenteno 2006; Van Buren 1978; Velasco 2000a; Wright 1984). As some or all patients had previously been stimulated and findings consistent with a carryover effect of invasive neurostimulation have been reported in the literature (Andrade 2006; Lim 2007; McLachlan 2010; Velasco 2007;Vonck 2013), this may mask or reduce possible beneficial or adverse effects of stimulation. In addition, changes in the antiepileptic drug (AED) regimen in 3/4 patients during the trial may further have influenced the results of Tellez‐Zenteno 2006 (hippocampal stimulation, one to three months stimulation). A sensitivity analysis excluding those four trials did not change our main conclusions, although this did result in more pronounced estimates of stimulation effects for cerebellar (responder rate OR 8.33; 95% CI 0.22 to 320.4; seizure frequency reduction ‐36.7%; 95% CI ‐95.5 to 21.1) and hippocampal stimulation (one to three months of stimulation) (responder rate OR 1.75; 95% CI 0.22 to 14.1; if also larger standard error for McLachlan 2010 for seizure frequency reduction of ‐45.7%; 95% CI ‐85.9 to ‐5.5). Obviously, in the case of a clear absence of any effect (for example, on seizure freedom), the possibility of an outlasting effect in these trials does not complicate interpretation of the results.
The quality of the evidence on centromedian thalamic DBS is very low. Two RCTs were identified in the literature. However, one trial (Velasco 2000a) (n = 13) evaluated stimulation 'off' periods after six to nine months of stimulation without any washout period. The trial only studied two outcome measures (seizure frequency reduction and adverse events), compared blinded stimulation 'off' to the three months preceding it (instead of consistently comparing outcomes to blinded stimulation 'on' periods), and the non‐reporting of exact figures prevented inclusion in the meta‐analysis. In the second trial (Fisher 1992), seven patients received only two hours of stimulation per day and incomplete outcome data could have biased the results.
Risk of bias was present or unclear in various other trials. It was unclear if the neuropsychological outcome in Van Buren 1978 (cerebellar stimulation) was assessed during blinded or unblinded evaluation periods; methods for random sequence generation and allocation concealment were not well‐described in Tellez‐Zenteno 2006 (hippocampal stimulation, one to three months) and Wright 1984 (cerebellar cortical stimulation), and evidence of selective reporting was present in two other trials (Fisher 2010 for anterior thalamic DBS; McLachlan 2010 for hippocampal DBS, one to three months), although we think the latter has not greatly affected the results of this review. Some trials also reported their results incompletely (mainly neuropsychological testing results) and without evidence for selective reporting (Fisher 1992 for centromedian thalamic DBS; Tellez‐Zenteno 2006 for hippocampal DBS; Wright 1984 for cerebellar cortical stimulation). Wiebe 2013 (hippocampal stimulation, six months) was only published as an abstract with many details missing for a more in depth methodological assessment or for full incorporation in the quantitative synthesis.
As no more than three trials could be identified for each individual target (per three‐month epoch in case of hippocampal stimulation), we were not able to assess the risk of publication bias.
For more detailed assessments of the quality of the evidence per outcome parameter and per stimulation target we refer to the 'Summary of findings' tables. In general, the quality of the evidence was rated as moderate to high for responsive ictal‐onset zone stimulation and anterior thalamic DBS. The two trials evaluating these targets were well‐designed and each included more than 100 participants. Nevertheless, more trials are needed to obtain high‐quality evidence on all outcome parameters. The quality of the evidence on hippocampal DBS (one to three months of stimulation) and cerebellar stimulation is limited by some potential biases in the individual trials (see above) and the overall low number of participants, ranging from very low to moderate depending on the outcome parameter taken into consideration. Nucleus accumbens and hippocampal (four to six months) DBS were each studied in only one very small trial. For nucleus accumbens DBS, this trial was methodologically well‐designed resulting into low‐quality evidence overall. As details needed for full methodological assessment of the trial on hippocampal DBS (four to six months) are missing, the quality of the evidence was rated as very low. For reasons outlined above, the quality of the evidence on centromedian thalamic DBS is only very low.
Potential biases in the review process
When performing meta‐analyses, the results of various trials are pooled yielding pooled treatment effects of which the precision and accuracy depend on the quality of the individual trials. Therefore, pooling results of various trials including some trials with a risk of bias adds some risk of bias to the review process. For this specific review, besides of course other types of bias, this remark particularly holds true for the inclusion of four cross‐over trials without any washout period as outlasting effects after neurostimulation treatments have been described (although still being controversial). We therefore performed a sensitivity analysis excluding these trials. Although this resulted in a slightly more favourable effect estimate, it did not change the review's main conclusions.
As empty cells hinder calculation of odds ratios (seizure freedom, responder rate), it is customary to add +0.5 to each cell if applicable (Deeks 2011). However, given the small number of patients included in most trials, this approach may have biased our results. A sensitivity analysis adding +0.25 instead of +0.5 did not change our main conclusions, but did increase the degree of uncertainty around the effect estimates for seizure freedom.
For cerebellar and hippocampal stimulation, results of BEPs with different durations of active stimulation BEP (one to three months) were pooled. As some reports have suggested increasing efficacy over time, this may have lead to an overestimation compared to the one‐month treatment effect and an underestimation compared to the three‐month treatment effect. We therefore refer to the observed treatment effects as occurring after 'one to three months' of stimulation. In addition, we described in the text if and to what extent increasing efficacy over time was observed during the BEP of each individual trial. As outlined in the previous version of this review, results of RCTs with longer BEPs are pooled per three‐month epochs. So far, only one very small RCT on hippocampal DBS (Wiebe 2013) had a BEP with longer than six months of active stimulation. A sensitivity analysis combining all trials on hippocampal DBS irrespective of the BEP duration did not change the conclusions of this review.
Agreements and disagreements with other studies or reviews
Although various non‐systematic reviews have been published the past years, to our knowledge this is the first systematic review on RCTs studying deep brain and cortical stimulation. The non‐systematic reviews also discussed uncontrolled, often unblinded trials. These uncontrolled and unblinded trials have often yielded remarkably more favourable results than the RCTs. Besides the placebo effect, several other factors may account for this discrepancy. First of all, RCTs compare real stimulation to sham stimulation, whereas in uncontrolled trials baseline seizure frequency is taken for the reference data. Accordingly, seizure frequency reductions due to (temporary) implantation effects (Fisher 2010; Hodaie 2002;Lim 2007; Morrell 2011) and microlesions resulting from electrode insertion (Boëx 2011; Katariwala 2001; Schulze‐Bonhage 2010) contribute to the observed treatment effects in uncontrolled trials, whereas they do not in RCTs. Second, uncontrolled trials have longer follow‐up periods and increasing efficacy over time has been suggested (see above). However, one should realize that medication‐induced and spontaneous improvements can be quite impressive on a group level (Neligan 2012; Selwa 2003) and therefore are likely to contribute to the more favourable results obtained in uncontrolled trials. Third, the cross‐over design used in four RCTs without any washout period may undervalue the efficacy of neurostimulation treatments, as discussed above. Finally, further improvements due to optimization of stimulation parameter settings have been reported (Boëx 2011; Vonck 2013; Wille 2011) and uncontrolled trials often use variable parameter settings, whereas RCTs have a fixed stimulation protocol. In conclusion, it is likely that several factors overestimate the efficacy of invasive neurostimulation in uncontrolled trials, whereas some others may contribute to an underestimation of its full potential in RCTs.
Vagus nerve stimulation is another type of invasive neurostimulation which nowadays has become routinely available in many epilepsy centres worldwide. Although the treatment effects reported in two large RCTs (‐12.7% and ‐18.4%) (Handforth 1998; VNS Study Group 1995) were similar or slightly inferior to those of anterior thalamic DBS (‐17.4%), hippocampal DBS (‐28.1%) and closed‐loop ictal onset zone stimulation (‐24.9%), a Cochrane Review on vagus nerve stimulation did demonstrate a significantly higher responder rate with vagus nerve stimulation using a high stimulation paradigm ('standard stimulation') compared to a low stimulation paradigm ('sham stimulation') (RR 1.73; 95% CI 1.13 to 2.64) (Panebianco 2015). As outlined above, we did not find such a significant improvement for any intracranial target.

Study flow diagram.
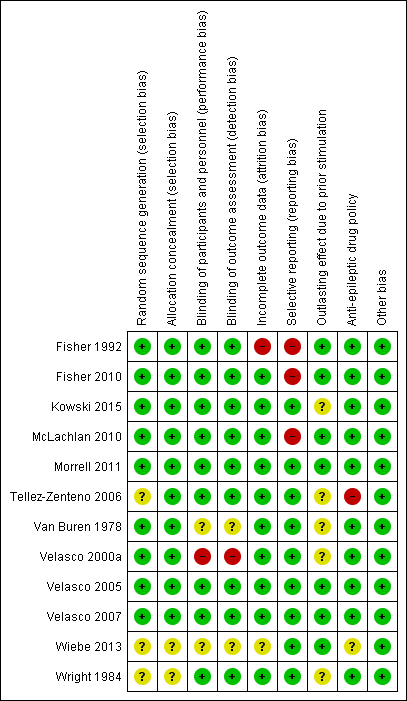
'Risk of bias' summary: review authors' judgements about each risk of bias item for each included study.

Forest plot of comparison: 1 Stimulation versus sham stimulation, outcome: 1.1 Seizure freedom.

Forest plot of comparison: 1 Stimulation versus sham stimulation, outcome: 1.2 Responder rate.
![Forest plot of comparison: 1 Stimulation versus sham stimulation, outcome: 1.3 Seizure frequency reduction.Note: Fisher 2010 (anterior thalamic nucleus stimulation) and Morrell 2011 (closed‐loop ictal onset zone stimulation) estimated the treatment effect and its standard error on a logarithmic scale, using the generalized estimating equation (GEE) model. As in this figure standard errors could not be inputted on the logarithmic scale, the values for the 95% confidence interval presented here differ slightly from the (more correct) values mentioned in the text. These correct values are ‐17.4% with 95% CI [‐31.2;‐1.0] for Fisher 2010 and ‐24.9% with 95% CI [‐40.1;‐6.0] for Morrell 2011.](/es/cdsr/doi/10.1002/14651858.CD008497.pub3/media/CDSR/CD008497/image_n/nCD008497-AFig-FIG05.png)
Forest plot of comparison: 1 Stimulation versus sham stimulation, outcome: 1.3 Seizure frequency reduction.
Note: Fisher 2010 (anterior thalamic nucleus stimulation) and Morrell 2011 (closed‐loop ictal onset zone stimulation) estimated the treatment effect and its standard error on a logarithmic scale, using the generalized estimating equation (GEE) model. As in this figure standard errors could not be inputted on the logarithmic scale, the values for the 95% confidence interval presented here differ slightly from the (more correct) values mentioned in the text. These correct values are ‐17.4% with 95% CI [‐31.2;‐1.0] for Fisher 2010 and ‐24.9% with 95% CI [‐40.1;‐6.0] for Morrell 2011.

Forest plot of comparison: 1 Stimulation versus sham stimulation, outcome: 1.4 Quality of Life. To measure quality of life, Tellez‐Zenteno 2006 and Morrell 2011 used the QOLIE‐89 questionnaire, Fisher 2010 used the QOLIE‐31 questionnaire (= abbreviated form of the QOLIE‐89 questionnaire) and Kowski 2015 usde the QOLIE‐31‐P questionnaire (slightly modified version of the QOLIE‐31 questionnaire). These questionnaires have the same range and for the QOLIE‐89 and QOLIE‐31 questionnaires very similar means, standard deviations and minimum clinically important change values in the same population have been reported (Cramer 1998; Devinsky 1995; Wiebe 2002). For this reason results from the different trials are presented in one forest plot (see also Methods section). For the QOLIE‐89 and QOLIE‐31 questionnaires, improvements of 5‐11.7 have been defined in literature (Borghs 2012; Cramer 2004; Wiebe 2002) as being clinically meaningful, positive is better.

Comparison 1 Stimulation versus sham stimulation, Outcome 1 Seizure freedom.
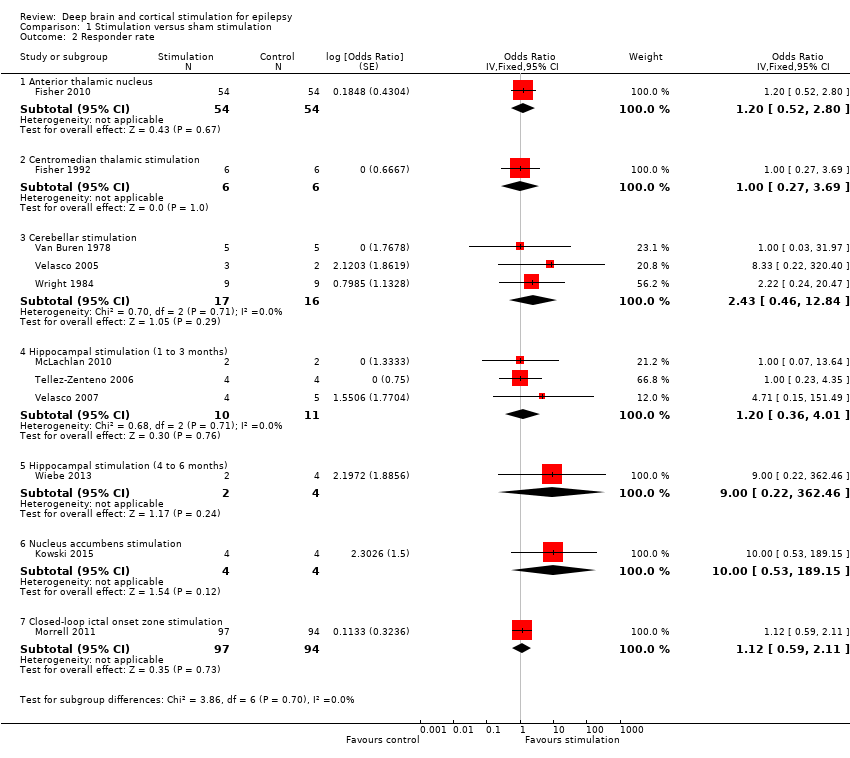
Comparison 1 Stimulation versus sham stimulation, Outcome 2 Responder rate.
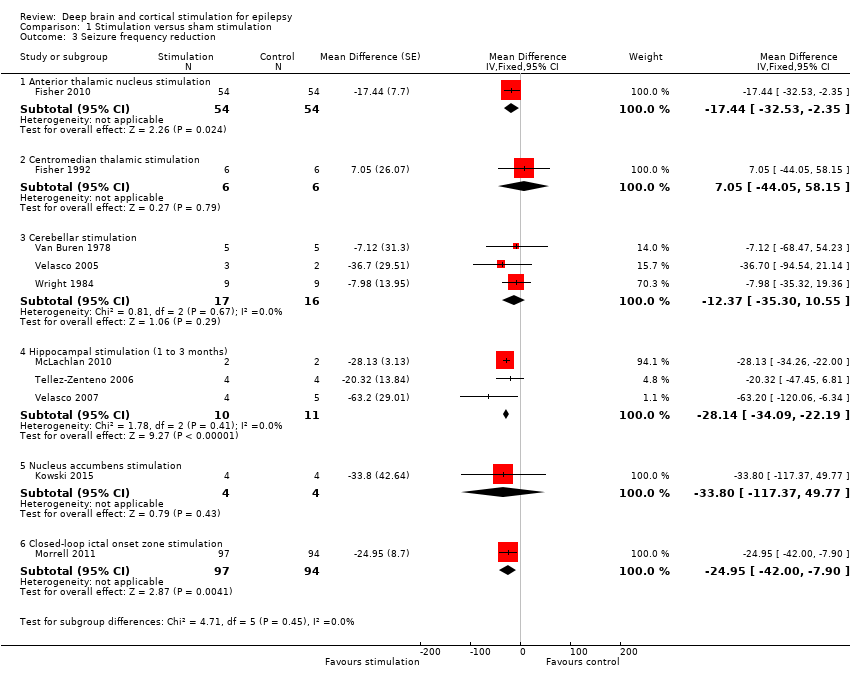
Comparison 1 Stimulation versus sham stimulation, Outcome 3 Seizure frequency reduction.
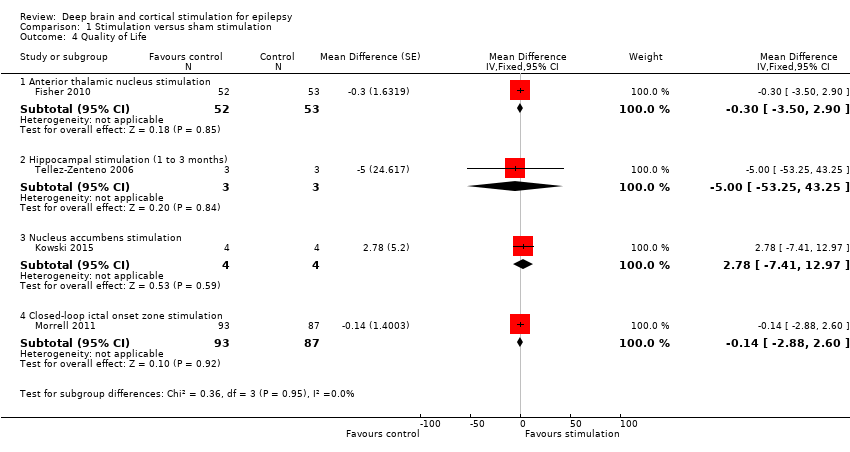
Comparison 1 Stimulation versus sham stimulation, Outcome 4 Quality of Life.
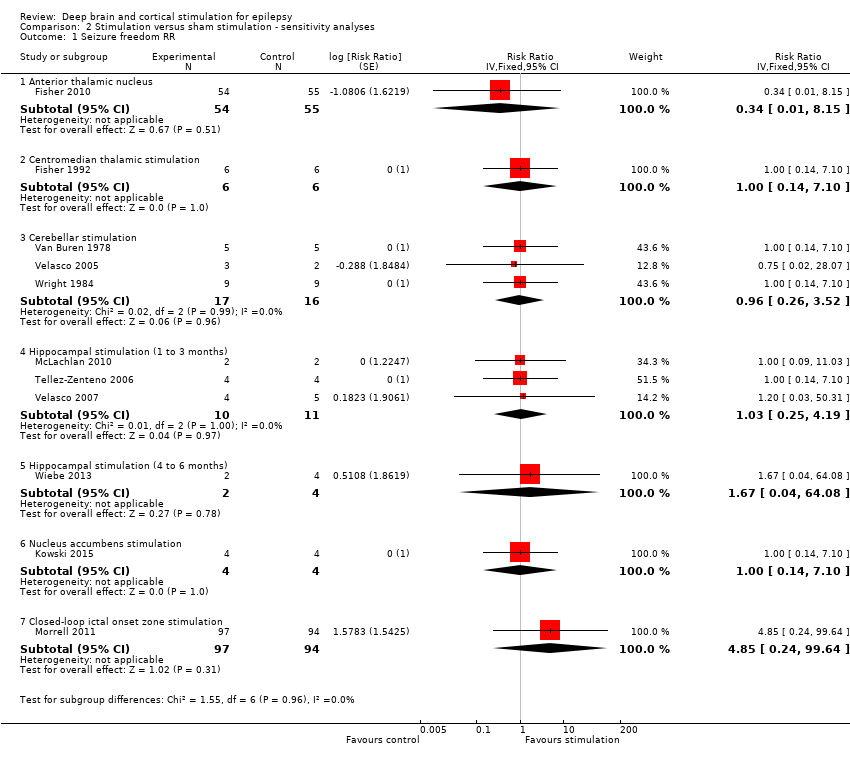
Comparison 2 Stimulation versus sham stimulation ‐ sensitivity analyses, Outcome 1 Seizure freedom RR.

Comparison 2 Stimulation versus sham stimulation ‐ sensitivity analyses, Outcome 2 Responder rate RR.

Comparison 2 Stimulation versus sham stimulation ‐ sensitivity analyses, Outcome 3 Seizure freedom OR 0.25.
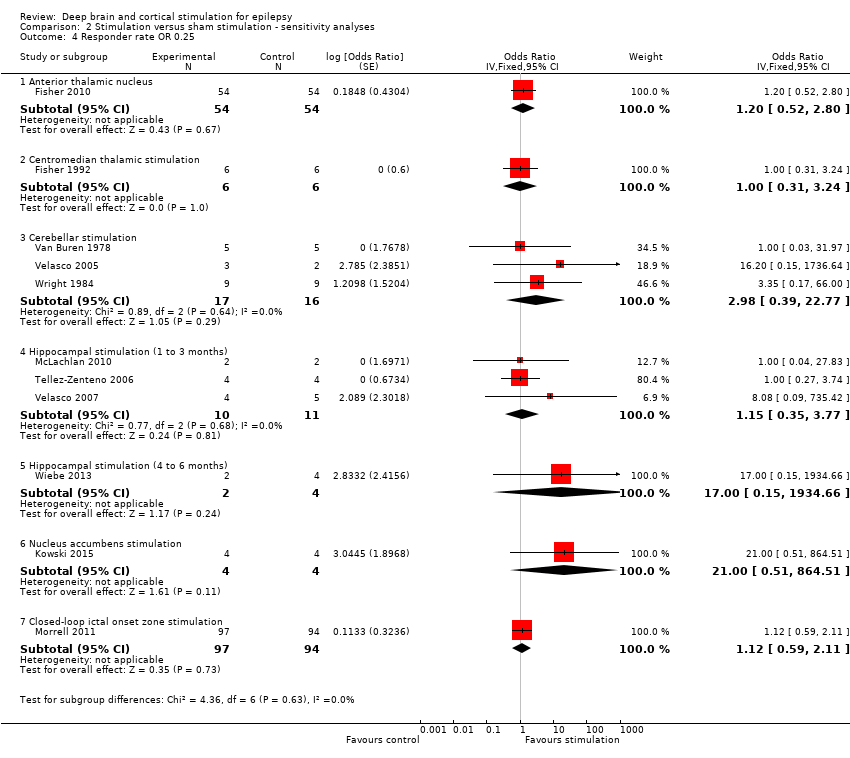
Comparison 2 Stimulation versus sham stimulation ‐ sensitivity analyses, Outcome 4 Responder rate OR 0.25.

Comparison 2 Stimulation versus sham stimulation ‐ sensitivity analyses, Outcome 5 Seizure freedom RR 0.25.
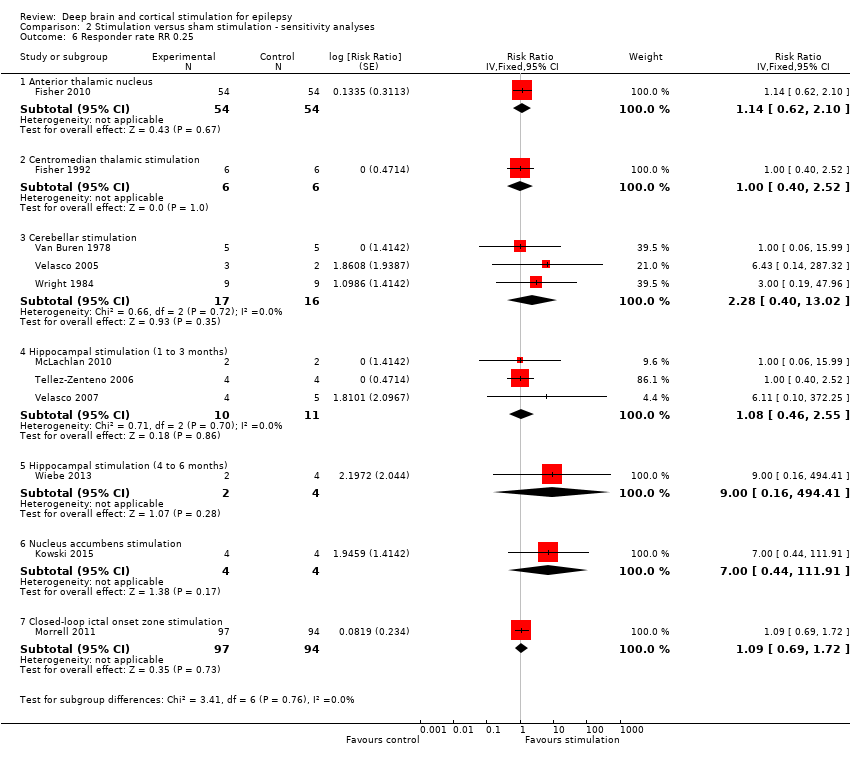
Comparison 2 Stimulation versus sham stimulation ‐ sensitivity analyses, Outcome 6 Responder rate RR 0.25.
| Anterior thalamic nucleus stimulation for refractory epilepsy | ||||||
| Patient or population: adults with IQ > 70 with refractory focal epilepsy Settings: epilepsy centres in the USA Intervention: anterior thalamic nucleus stimulation Comparison: sham stimulation | ||||||
| Outcomes | Illustrative comparative risks* (95% CI) | Relative effect | No of Participants | Quality of the evidence | Comments | |
| Assumed risk | Corresponding risk | |||||
| Sham stimulation | Anterior Thalamic Nucleus stimulation | |||||
| Seizure freedom (3‐month blinded evaluation period) | Observed inFisher 2010 | OR 0.33 (0.01 to 8.36) | 109 | ⊕⊕⊕⊝ | ||
| 1 per 55 | 0 per 54 | |||||
| Low risk population1 | ||||||
| 1 per 1000 | 0 per 1000 | |||||
| High risk population1 | ||||||
| 15 per 1000 | 5 per 1000 | |||||
| Responder rate (3‐month blinded evaluation period) | 26 per 100 | 30 per 100 (15 to 49) | OR 1.20 (0.52 to 2.80) | 108 | ⊕⊕⊕⊝ | |
| Seizure frequency reduction (%) (3‐month blinded evaluation period) | Median monthly seizure frequency reductions ranged from ‐14.5 to ‐28.7% | The mean seizure frequency in the intervention group was | 108 (1) | ⊕⊕⊕⊕ | A trend for increasing efficacy over time was observed during the blinded evaluation period and could result into an underestimation of the treatment effect (treatment effect of month 3: ‐29%). | |
| Adverse events | See comment | See comment | 109 (1) | ⊕⊕⊕⊝ | Stimulation‐related adverse events during the blinded evaluation period include (stimulation versus control): depression (14.8 versus 1.8%, P = 0.02), subjective memory impairment (13.8 versus 1.8%, P = 0.03) and epilepsy‐related injuries (7.4 versus 25.5%, P = 0.01). Standard stimulation parameters could be inappropriate and increase seizure frequency in a small minority of patients.4 Asymptomatic intracranial haemorrhages occurred in 3.7% of participants after the initial implant procedure. In 8.2% of participants leads had to be replaced after initial implantation outside the target. Postoperative implant site infections occurred in 4.5% of participants, increasing to 12.7% after 5 years of follow‐up urging (temporary) hardware removal in 8.2% of participants. Implant site pain was not uncommon (year 1: 10.9%, year 5: 20.9%). SUDEP rate during long‐term (including open‐label) follow‐up was 2.9 per 1000 p‐y which is comparable to rates reported in refractory epilepsy populations (2.2‐10 per 1000 p‐y) (Tellez‐Zenteno 2005; Tomson 2008). | |
| Neuropsychological outcome (3 months) | See comment | See comment | 96‐100 (1) | ⊕⊕⊕⊝ | Changes in neuropsychological test scores for cognition and mood were very similar in the treatment and control group and not significantly different. Individual patient data show worsening (> 1 SD) of Profile of Mood States Depression subscale (POMS‐D) in 3/8 stimulated participants with self‐reported depression and 0/7 patients with subjective memory impairment showed worsening (> 1 SD) of verbal or visual memory scores. | |
| Quality of life (QOLIE‐31) (3 months) | The mean improvement of the QOLIE‐31 score in the control group was +2.8 higher | The mean improvement in QOLIE‐31 score in the intervention group was | 105 (1) | ⊕⊕⊕⊕ | Positive changes in QOLIE‐31 (quality of life in epilepsy 31) scores indicate improvement. Changes of 5‐11.7 have been defined in literature as being clinically meaningful (Borghs 2012; Cramer 2004; Wiebe 2002). | |
| *The basis for the assumed risk (e.g. the median control group risk across studies) is provided in footnotes. The corresponding risk (and its 95% confidence interval) is based on the assumed risk in the comparison group and the relative effect of the intervention (and its 95% CI). | ||||||
| GRADE Working Group grades of evidence | ||||||
| 1 The assumed risks (low and high) are based on the range of the number of events observed in the sham stimulation control groups of all RCTs evaluating deep brain and cortical stimulation in refractory epilepsy patients 2 More trials and patients are needed to allow more precise estimation of stimulation effects (including more rare adverse effects) (GRADE ‐1). 3 The confidence interval includes clinically non‐significant changes (GRADE ‐1), however, the observed trend for increasing efficacy over time probably underestimates the treatment effect (GRADE +1). 4 One participant experienced a spectacular seizure frequency increase after initiation of stimulation, which was reversible after lowering output voltage. New or worse seizures occurred more frequently in the stimulation group compared to the control group but differences did not reach statistical significance. 5 Although clinically meaningful differences in formal neuropsychological testing results seem unlikely on the group level, the discrepancy between objective and subjective measures needs further clarification (GRADE ‐1). | ||||||
| Centromedian thalamic nucleus stimulation for refractory epilepsy | ||||||
| Patient or population: patients with refractory (multi)focal or generalized epilepsy Settings: epilepsy centres in the USA and in Mexico Intervention: centromedian thalamic nucleus stimulation Comparison: sham stimulation | ||||||
| Outcomes | Illustrative comparative risks* (95% CI) | Relative effect | No of Participants | Quality of the evidence | Comments | |
| Assumed risk | Corresponding risk | |||||
| Sham stimulation | Centromedian thalamic nucleus stimulation | |||||
| Seizure freedom (3‐month blinded evaluation period) | Observed inFisher 1992 | OR 1.00 (0.11 to 9.39) | 6 (1)2 | ⊕⊝⊝⊝ | ||
| 0 per 6 | 0 per 6 | |||||
| Low risk population1 | ||||||
| 1 per 1000 | 1 per 1000 | |||||
| High risk population1 | ||||||
| 15 per 1000 | 15 per 1000 | |||||
| Responder rate (3‐month blinded evaluation period) | Low risk population1 | OR 1.00 (0.27 to 3.69) | 6 (1)2 | ⊕⊝⊝⊝ | ||
| 10 per 100 | 10 per 1000 | |||||
| Medium‐high risk population1 | ||||||
| 25 per 100 | 25 per 1000 | |||||
| Seizure frequency reduction (3‐month blinded evaluation period) | The mean seizure frequency reduction in the control group was ‐0.4% | The mean seizure frequency in the intervention groups was | 6 (1)2 | ⊕⊝⊝⊝ | Also another trial (Velasco 2000a) (n = 13) could not demonstrate significant differences between stimulation ON and OFF periods. However, its cross‐over design without any washout period could mask a possible treatment effect. | |
| Adverse events | See comment | See comment | 19 (2)2 21 (2)2 | ⊕⊕⊝⊝ | Stimulation‐related adverse events did not occur. Postoperative CT revealed an asymptomatic and minimal haemorrhage in one patient, 1 patient required repair of the connection to the pulse generator and skin erosion urged device explantation in 3 other patients (including 2 young children). | |
| Neuropsychological outcome (3 months) | See comment | See comment | 6 (1)2 | ⊕⊝⊝⊝ | There were no significant differences in any of the neuropsychological tests between baseline, stimulation ON and OFF periods. | |
| Quality of life | See comment | See comment | 0 (0) | See comment | Impact of centromedian thalamic nucleus stimulation on quality of life has not been studied yet. | |
| *The basis for the assumed risk (e.g. the median control group risk across studies) is provided in footnotes. The corresponding risk (and its 95% confidence interval) is based on the assumed risk in the comparison group and the relative effect of the intervention (and its 95% CI). | ||||||
| GRADE Working Group grades of evidence | ||||||
| 1 The assumed risks (low, medium and high) are based on the range of the number of events observed in the sham stimulation control groups of all RCTs evaluating deep brain and cortical stimulation in refractory epilepsy patients 2 Cross‐over trial(s). 3 No more than one small RCT was identified, resulting into wide 95% confidence intervals (GRADE score ‐2). This is of particular concern for neuropsychological outcome, as no exact figures were reported or could be provided, so evaluation of certain statistically non‐significant trends is not possible. 4 Only 2 hours of intermittent stimulation per day in Fisher 1992 (GRADE score ‐1). 5 Incomplete outcome data may introduce bias (GRADE score ‐1). 6 Number of participants too low to identify less frequent adverse events (GRADE score ‐1) | ||||||
| Cerebellar stimulation for refractory epilepsy | ||||||
| Patient or population: patients with refractory (multi)focal or generalized epilepsy Settings: epilepsy centres in the USA and in Mexico Intervention: stimulation of the superomedial surface of the cerebellum Comparison: sham stimulation | ||||||
| Outcomes | Illustrative comparative risks* (95% CI) | Relative effect | No of Participants | Quality of the evidence | Comments | |
| Assumed risk | Corresponding risk | |||||
| Sham stimulation | Cerebellar stimulation | |||||
| Seizure freedom (1‐ to 3‐month blinded evaluation period) | Observed | OR 0.96 (0.22 to 4.12) | 22 (3)2 | ⊕⊕⊕⊝ | ||
| 0 per 19 | 0 per 20 (not estimable) | |||||
| Low risk population1 | ||||||
| 1 per 1000 | 1 per 1000 | |||||
| High risk population1 | ||||||
| 15 per 1000 | 14 per 1000 | |||||
| Responder rate (1‐ to 3‐month blinded evaluation period) | Low risk population1 | OR 2.43 (0.46 to 12.84) | 19 (3)2 | ⊕⊕⊝⊝ | ||
| 10 per 100 | 21 per 100 | |||||
| Medium‐high risk population1 | ||||||
| 25 per 100 | 45 per 100 | |||||
| Seizure frequency reduction (1‐ to 3‐month blinded evaluation period) | The mean seizure frequency reduction ranged across control groups from 0 to ‐18.8% | The mean seizure frequency in the intervention groups was | 19 (3)2 | ⊕⊕⊝⊝ | ||
| Adverse events | See comment | See comment | 22 (3)2 | ⊕⊕⊝⊝ | Stimulation‐related adverse events were not reported in any of the trials. In contrast, about half of the patients in every trial required repeated surgery due to electrode migration (n = 6), leakage of cerebrospinal fluid (n = 3), wound infection (n = 1), skin erosion (n = 2), lead problems (n = 1), subcutaneous seroma drainage (n = 1) and defective hardware (n = 1). Wound infections were solved with antibiotics only in 2 additional patients. In particular, electrode migration remains of specific concern, even in the most recent trial (Velasco 2005) (occurring in 3/5 patients). | |
| Neuropsychological outcome (1 to 2 months) | See comment | See comment | 16 (2)2 | ⊕⊝⊝⊝ | 'Psychometry' did not reveal any major change in any patient in any phase of the Wright 1984 trial. Comparing ON to OFF stimulation full scale intelligence and memory scores in Van Buren 1978 showed very similar results in two participants, a moderate increase in one patient and a moderate decrease in another. | |
| Quality of life (2 months) | See comment | See comment | 12 (1)7 | ⊕⊝⊝⊝ | Eleven out of 12 patients in Wright 1984 felt better for cerebellar stimulation, but only 5 chose one phase as being different from the others, being either the continuous (n = 2), contingent (n = 1) or no‐stimulation (n = 2) phase. | |
| *The basis for the assumed risk (e.g. the median control group risk across studies) is provided in footnotes. The corresponding risk (and its 95% confidence interval) is based on the assumed risk in the comparison group and the relative effect of the intervention (and its 95% CI). | ||||||
| GRADE Working Group grades of evidence | ||||||
| 1 The assumed risks (low, medium and high) are based on the range of the number of events observed in the sham stimulation control groups of all RCTs evaluating deep brain and cortical stimulation in refractory epilepsy patients 2 Including 2 cross‐over trials: Van Buren 1978 (n = 4‐5) and Wright 1984 (n = 9‐12) 3 The small number of patients leave a considerable amount of uncertainty with regards to stimulation effects (GRADE ‐1). 4Wright 1984 and Van Buren 1978 are cross‐over trials without any washout period which could mask or reduce potential benefits of cerebellar stimulation (and explain some heterogeneity) (GRADE ‐1). 5 Unclear if, how and to what extent stimulation‐related side effects were evaluated in Van Buren 1978 and Wright 1984 (GRADE ‐1). 6 Unclear what neuropsychological tests were performed in Wright 1984 ('psychometry'). Moreover, as testing scores were not published and could not be provided, evaluation of certain statistically non‐significant trends is not possible. Unclear if neuropsychological testing in Van Buren 1978 was done in blinded or unblinded evaluation periods (GRADE‐1). 7 Cross‐over trial: Wright 1984 (n = 12). 8 No formal scoring of quality of life but evaluation of patients' impressions on cerebellar stimulation (GRADE ‐1). | ||||||
| Hippocampal stimulation for refractory epilepsy | ||||||
| Patient or population: patients with refractory medial temporal lobe epilepsy Settings: epilepsy centres in Canada and in Mexico Intervention: hippocampal deep brain stimulation Comparison: sham stimulation | ||||||
| Outcomes | Illustrative comparative risks* (95% CI) | Relative effect | No of Participants | Quality of the evidence | Comments | |
| Assumed risk | Corresponding risk | |||||
| Sham stimulation | Hippocampal stimulation | |||||
| Seizure freedom (1‐ to 3‐month blinded evaluation periods) | Observed | OR 1.03 | 15 (3)2 | ⊕⊕⊕⊝ | Also in Wiebe 20134 no single patient achieved seizure freedom after six months of hippocampal active or sham stimulation. | |
| 0 per 11 | 0 per 10 | |||||
| Low risk population1 | ||||||
| 1 per 1000 | 1 per 1000 | |||||
| High risk population1 | ||||||
| 15 per 1000 | 15 per 1000 | |||||
| Responder rate (1‐ to 3‐month blinded evaluation periods) | Low risk population1 | OR 1.20 (0.36 to 4.01) | 15 (3)2 | ⊕⊕⊝⊝ | In Wiebe 20134there was one responder in the stimulation group (n = 2) compared to none in the sham group (n = 4) after six months of follow‐up. | |
| 10 per 100 | 12 per 100 | |||||
| Medium‐high risk population1 | ||||||
| 25 per 100 | 29 per 100 | |||||
| Seizure frequency (1‐ to 3‐month blinded evaluation periods) | The mean change in seizure frequency ranged across control groups from ‐4.7% to +33.7% | The mean seizure frequency in the intervention groups was | 15 (3)2 | ⊕⊕⊕⊝ | One trial (Tellez‐Zenteno 2006) has a cross‐over design without any washout period which could result into an underestimation of the true treatment effect. In Wiebe 20134 the sham stimulation group reported a median seizure frequency increase of 60% compared to a 45% decrease in the stimulation group after 6 months of follow‐up. | |
| Adverse events | See comment | See comment | 15 (3)2 | ⊕⊕⊝⊝ | There were neither stimulation‐related adverse events, nor early surgical complications. Skin erosion and local infection required explantation after >2 years in 3/9 patients in Velasco 2007. Wiebe 20134 also did not report any adverse event after 6 months of follow‐up. | |
| Neuropsychological outcome (1‐ to 3‐month periods) | See comment | See comment | 6 (2)2 | ⊕⊝⊝⊝ | Neuropsychological test results were the same or very similar during stimulation ON and OFF periods in Tellez‐Zenteno 2006 (n = 4) and in one patient in McLachlan 2010. The other patient in McLachlan 2010 showed worse verbal and visuospatial memory scores when stimulated, notwithstanding that he reported subjective memory improvement during the same period. At seven months in Wiebe 20134, scores of cognitive scales assessing recall (Rey Auditory Verbal Learning Test, Rey Complex Figure Test) were generally lower in the active stimulation compared to the sham group (p>0.05). | |
| Quality of life (QOLIE‐89) (1‐ to 3‐month periods) | The mean QOLIE‐89 score in the control group was 60 | The mean QOLIE‐89 in the intervention group was ‐5 lower (‐53 lower to +43 higher). | 3 (1)7 | ⊕⊝⊝⊝ | Positive changes in QOLIE‐89 (quality of life in epilepsy 89) scores indicate improvement. Changes of 5‐11.7 have been defined in literature as being clinically meaningful (Borghs 2012; Cramer 2004; Wiebe 2002). The overall QOLIE‐89 score at seven months in Wiebe 20134 worsened by 13 points with sham stimulation compared to an improvement of 3 points with active stimulation (p>0.05), and there was a trend for increased QOLIE‐89 subjective memory and attention/concentration scores. | |
| *The basis for the assumed risk (e.g. the median control group risk across studies) is provided in footnotes. The corresponding risk (and its 95% confidence interval) is based on the assumed risk in the comparison group and the relative effect of the intervention (and its 95% CI). | ||||||
| GRADE Working Group grades of evidence | ||||||
| 1 The assumed risks (low, medium and high) are based on the range of the number of events observed in the sham stimulation control groups of all RCTs evaluating deep brain and cortical stimulation in refractory epilepsy patients 2 Including two cross‐over trials: McLachlan 2010 (n = 2) and Tellez‐Zenteno 2006 (n = 4) 3 The small number of patients preclude more definitive judgements on effects of hippocampal stimulation (GRADE ‐1). 4Wiebe 2013 is a small parallel‐group RCT (n = 6) with a 6‐month blinded evaluation period. As there were no more than 2 participants in the active stimulation group and details needed for full methodological assessment are missing, the quality of the evidence is very low and we decided not to create separate 6‐month outcomes or a separate summary of findings table but only to describe the results. As the results of the first 3‐month epoch were not reported, the data of this trial could not be combined with the other trials evaluating one to three months of hippocampal stimulation. However, the reported six‐month results are generally compatible and in line with the estimated three‐month results. For more details and a sensitivity analysis combining all trials on hippocampal stimulation irrespective of the BEP duration, see text. 5 One trial (Tellez‐Zenteno 2006) had a cross‐over design without any washout period and allowed important changes in antiepileptic drugs, both of which could reduce or mask more important treatment effects. See also 'Sensitivity analyses' (GRADE ‐1). 6 Number of patients is too low to identify less frequent adverse events or changes in neuropsychological outcome or quality of life (GRADE‐score ‐2). 7 One cross‐over trial: Tellez‐Zenteno 2006 (n = 3) | ||||||
| Nucleus accumbens stimulation for refractory epilepsy | ||||||
| Patient or population: adults with IQ >70 with refractory focal epilepsy Settings: epilepsy centre in Germany Intervention: nucleus accumbens stimulation Comparison: sham stimulation | ||||||
| Outcomes | Illustrative comparative risks* (95% CI) | Relative effect | No of Participants | Quality of the evidence | Comments | |
| Assumed risk | Corresponding risk | |||||
| Sham stimulation | Nucleus accumbens stimulation | |||||
| Seizure freedom (3‐month blinded evaluation period) | Observed inKowski 2015 | OR 1.00 (0.07 to 13.64) | 4 (1)2 | ⊕⊕⊝⊝ | ||
| 0 per 4 | 0 per 4 (not estimable) | |||||
| Low risk population1 | ||||||
| 1 per 1000 | 1 per 1000 | |||||
| High risk population1 | ||||||
| 15 per 1000 | 15 per 1000 (0 to 172) | |||||
| Responder rate (3‐month blinded evaluation period) | Low risk population1 | OR 10.0 (0.53 to 189.15) | 4 (1)2 | ⊕⊕⊝⊝ | ||
| 10 per 100 | 53 per 100 | |||||
| Medium risk population1 | ||||||
| 25 per 100 | 77 per 100 | |||||
| Seizure frequency reduction (3‐month blinded evaluation period) | The mean change in seizure frequency in the control group was ‐13.8% | The mean seizure frequency in the intervention group was (‐100% lower to +49.8% higher) | 4 (1)2 | ⊕⊕⊝⊝ | When focusing on 'disabling seizures' only and excluding simple partial seizures (occurring in one patient), the mean change in seizure frequency in the control group was +8.2% with a ‐22.9% lower seizure frequency in the intervention group (‐100 lower to +94.0 higher) | |
| Adverse events | See comment | See comment | 4 (1)2 | ⊕⊕⊝⊝ | Except for one patient feeling sad for two weeks during the active stimulation period after a close relative had died, there were no adverse events that were exclusively linked to the active stimulation period (although various adverse events were reported in the sham and the active stimulation group, see text). One patient developed a local subcutaneous infection with colonization of the pulse generator and the leads 2 weeks post‐surgery urging antibiotic therapy and temporary hardware removal. | |
| Neuropsychological outcome (3 months) | See comment | See comment | 4 (1)2 | ⊕⊕⊝⊝ | Neurocognitive test scores were similar and not statistically significantly different during sham and active stimulation in this small trial. There were no categorical changes in Beck‐Depression‐Inventory scores during the BEP. However, the Mini International Neuropsychiatric Interview revealed a new‐onset major depression under nucleus accumbens stimulation in one patient, besides an ongoing low suicidal risk following one suicide attempt 10 years before the trial in another patient. | |
| Quality of Life (QOLIE‐31‐P) (3 months) | The mean change in the QOLIE‐31‐P score in the control group was ‐4.9 lower | The mean change in the QOLIE‐31‐P score in the intervention group was +2.8 higher (‐7.4 lower to +13.0 higher) | 4 (1)2 | ⊕⊕⊝⊝ | The QOLIE‐31‐P is a (slightly) modified version of the QOLIE‐31 questionnaire for which changes of 5 to 11.7 have been defined in the literature (Cramer 2004; Wiebe 2002; Borghs 2012) as being clinically meaningful; positive scores indicate improvement. | |
| *The basis for the assumed risk (e.g. the median control group risk across studies) is provided in footnotes. The corresponding risk (and its 95% confidence interval) is based on the assumed risk in the comparison group and the relative effect of the intervention (and its 95% CI). | ||||||
| GRADE Working Group grades of evidence | ||||||
| 1 The assumed risks (low, medium and high) are based on the range of the number of events observed in the sham stimulation control groups of all RCTs evaluating deep brain and cortical stimulation in refractory epilepsy patients 2 Cross‐over trial 3No more than one small RCT was identified which leaves a considerable amount of uncertainty with regards to stimulation effects (GRADE score ‐2). | ||||||
| Closed‐loop stimulation of the ictal onset zone for refractory epilepsy | ||||||
| Patient or population: adults with refractory focal epilepsy (1 or 2 epileptogenic regions) Settings: epilepsy centres in the USA Intervention: responsive stimulation of the ictal onset zone(s) Comparison: sham stimulation | ||||||
| Outcomes | Illustrative comparative risks* (95% CI) | Relative effect | No of Participants | Quality of the evidence | Comments | |
| Assumed risk | Corresponding risk | |||||
| Sham stimulation | Responsive ictal onset zone stimulation | |||||
| Seizure freedom (3‐month blinded evaluation period) | Observed inMorrell 2011 | OR 4.95 (0.23 to 104.44) | 191 (1) | ⊕⊕⊕⊝ | ||
| 0 per 94 | 2 per 97 (not estimable) | |||||
| Low risk population1 | ||||||
| 1 per 1000 | 5 per 1000 (0 to 95) | |||||
| High risk population1 | ||||||
| 15 per 1000 | 70 per 1000 | |||||
| Responder rate (3‐month blinded evaluation period) | 27 per 100 | 29 per 100 | OR 1.12 (0.59 to 2.11) | 191 (1) | ⊕⊕⊕⊝ | |
| Seizure frequency reduction (3‐month blinded evaluation period) | The mean estimated seizure frequency reduction in the control group was ‐17.3% | The mean seizure frequency in the intervention group was | 191 (1) | ⊕⊕⊕⊕ | A trend for increasing efficacy over time was observed during the blinded evaluation period and could result into an underestimation of the treatment effect (treatment effect of month 3: ‐32%). | |
| Adverse events | See comment | See comment | 191 (1) 256 (2) | ⊕⊕⊕⊝ | Adverse events during the blinded evaluation period were rare and there were no significant differences between the treatment and control group. Asymptomatic intracranial haemorrhages considered as serious adverse event were found postoperatively in 1.6% of participants. Postoperative implant or incision site infection occurred in 2.0% of participants, increasing to 9.4% of participants after 5 years of follow‐up (additional cases mainly upon battery replacement; urge for (temporary) explantation in the majority of cases). Cranial implantation of the neurostimulator was the probable cause of most adverse events, which include: implant site pain (16% during the first year of the trial), headache (11%), procedural headache (9%) and dysaesthesia (6%). Although the SUDEP rate (4 SUDEPs over 340 patient‐years = 11.8 per 1000 patient‐years) reported in the initial manuscript was slightly higher than those usually reported in refractory epilepsy patients (2.2 to 10 per 1000 p‐y) (Tellez‐Zenteno 2005; Tomson 2008), long‐term open‐label follow‐up has now reported reassuring figures (SUDEP rates of 3.5 per 1000 implant p‐y or 2.6 per 1000 stimulation p‐y). | |
| Neuropsychological outcome (3 months) | See comment | See comment | 160‐177 | ⊕⊕⊕⊕ | Changes in neuropsychological testing results were very similar in both groups and 95% confidence intervals did not include clinically meaningful differences. | |
| Quality of life (QOLIE‐89) (3 months) | The mean improvement of the QOLIE‐31 score in the control group was +2.18 higher | The mean improvement in QOLIE‐31 score in the intervention group was | 180 | ⊕⊕⊕⊕ | Positive changes in QOLIE‐89 (quality of life in epilepsy 89) scores indicate improvement. Changes of 5‐11.7 have been defined in literature as being clinically meaningful (Borghs 2012; Cramer 2004; Wiebe 2002). | |
| *The basis for the assumed risk (e.g. the median control group risk across studies) is provided in footnotes. The corresponding risk (and its 95% confidence interval) is based on the assumed risk in the comparison group and the relative effect of the intervention (and its 95% CI). | ||||||
| GRADE Working Group grades of evidence | ||||||
| 1 The assumed risks (low and high) are based on the range of the number of events observed in the sham stimulation control groups of all RCTs evaluating deep brain and cortical stimulation in refractory epilepsy patients 2 More trials and patients are needed to allow more precise estimation of stimulation effects (GRADE ‐1). 3 The confidence interval includes clinically non‐significant changes (GRADE ‐1), however, the observed trend for increasing efficacy over time probably underestimates the treatment effect (GRADE +1). | ||||||
| Outcome or subgroup title | No. of studies | No. of participants | Statistical method | Effect size |
| 1 Seizure freedom Show forest plot | 11 | Odds Ratio (Fixed, 95% CI) | Subtotals only | |
| 1.1 Anterior thalamic nucleus | 1 | 109 | Odds Ratio (Fixed, 95% CI) | 0.33 [0.01, 8.36] |
| 1.2 Centromedian thalamic stimulation | 1 | 12 | Odds Ratio (Fixed, 95% CI) | 1.0 [0.11, 9.39] |
| 1.3 Cerebellar stimulation | 3 | 39 | Odds Ratio (Fixed, 95% CI) | 0.96 [0.22, 4.12] |
| 1.4 Hippocampal stimulation (1 to 3 months) | 3 | 21 | Odds Ratio (Fixed, 95% CI) | 1.03 [0.21, 5.15] |
| 1.5 Hippocampal stimulation (4 to 6 months) | 1 | 6 | Odds Ratio (Fixed, 95% CI) | 1.80 [0.03, 121.68] |
| 1.6 Nucleus accumbens stimulation | 1 | 8 | Odds Ratio (Fixed, 95% CI) | 1.0 [0.07, 13.64] |
| 1.7 Closed‐loop ictal onset zone stimulation | 1 | 191 | Odds Ratio (Fixed, 95% CI) | 4.95 [0.23, 104.44] |
| 2 Responder rate Show forest plot | 11 | Odds Ratio (Fixed, 95% CI) | Subtotals only | |
| 2.1 Anterior thalamic nucleus | 1 | 108 | Odds Ratio (Fixed, 95% CI) | 1.20 [0.52, 2.80] |
| 2.2 Centromedian thalamic stimulation | 1 | 12 | Odds Ratio (Fixed, 95% CI) | 1.0 [0.27, 3.69] |
| 2.3 Cerebellar stimulation | 3 | 33 | Odds Ratio (Fixed, 95% CI) | 2.43 [0.46, 12.84] |
| 2.4 Hippocampal stimulation (1 to 3 months) | 3 | 21 | Odds Ratio (Fixed, 95% CI) | 1.20 [0.36, 4.01] |
| 2.5 Hippocampal stimulation (4 to 6 months) | 1 | 6 | Odds Ratio (Fixed, 95% CI) | 9.00 [0.22, 362.46] |
| 2.6 Nucleus accumbens stimulation | 1 | 8 | Odds Ratio (Fixed, 95% CI) | 10.00 [0.53, 189.15] |
| 2.7 Closed‐loop ictal onset zone stimulation | 1 | 191 | Odds Ratio (Fixed, 95% CI) | 1.12 [0.59, 2.11] |
| 3 Seizure frequency reduction Show forest plot | 10 | Mean Difference (Fixed, 95% CI) | Subtotals only | |
| 3.1 Anterior thalamic nucleus stimulation | 1 | 108 | Mean Difference (Fixed, 95% CI) | ‐17.44 [‐32.53, ‐2.35] |
| 3.2 Centromedian thalamic stimulation | 1 | 12 | Mean Difference (Fixed, 95% CI) | 7.05 [‐44.05, 58.15] |
| 3.3 Cerebellar stimulation | 3 | 33 | Mean Difference (Fixed, 95% CI) | ‐12.37 [‐35.30, 10.55] |
| 3.4 Hippocampal stimulation (1 to 3 months) | 3 | 21 | Mean Difference (Fixed, 95% CI) | ‐28.14 [‐34.09, ‐22.19] |
| 3.5 Nucleus accumbens stimulation | 1 | 8 | Mean Difference (Fixed, 95% CI) | ‐33.8 [‐117.37, 49.77] |
| 3.6 Closed‐loop ictal onset zone stimulation | 1 | 191 | Mean Difference (Fixed, 95% CI) | ‐24.95 [‐42.00, ‐7.90] |
| 4 Quality of Life Show forest plot | 4 | Mean Difference (Fixed, 95% CI) | Subtotals only | |
| 4.1 Anterior thalamic nucleus stimulation | 1 | 105 | Mean Difference (Fixed, 95% CI) | ‐0.3 [‐3.50, 2.90] |
| 4.2 Hippocampal stimulation (1 to 3 months) | 1 | 6 | Mean Difference (Fixed, 95% CI) | ‐5.0 [‐53.25, 43.25] |
| 4.3 Nucleus accumbens stimulation | 1 | 8 | Mean Difference (Fixed, 95% CI) | 2.78 [‐7.41, 12.97] |
| 4.4 Closed‐loop ictal onset zone stimulation | 1 | 180 | Mean Difference (Fixed, 95% CI) | ‐0.14 [‐2.88, 2.60] |
| Outcome or subgroup title | No. of studies | No. of participants | Statistical method | Effect size |
| 1 Seizure freedom RR Show forest plot | 11 | Risk Ratio (Fixed, 95% CI) | Subtotals only | |
| 1.1 Anterior thalamic nucleus | 1 | 109 | Risk Ratio (Fixed, 95% CI) | 0.34 [0.01, 8.15] |
| 1.2 Centromedian thalamic stimulation | 1 | 12 | Risk Ratio (Fixed, 95% CI) | 1.0 [0.14, 7.10] |
| 1.3 Cerebellar stimulation | 3 | 33 | Risk Ratio (Fixed, 95% CI) | 0.96 [0.26, 3.52] |
| 1.4 Hippocampal stimulation (1 to 3 months) | 3 | 21 | Risk Ratio (Fixed, 95% CI) | 1.03 [0.25, 4.19] |
| 1.5 Hippocampal stimulation (4 to 6 months) | 1 | 6 | Risk Ratio (Fixed, 95% CI) | 1.67 [0.04, 64.08] |
| 1.6 Nucleus accumbens stimulation | 1 | 8 | Risk Ratio (Fixed, 95% CI) | 1.0 [0.14, 7.10] |
| 1.7 Closed‐loop ictal onset zone stimulation | 1 | 191 | Risk Ratio (Fixed, 95% CI) | 4.85 [0.24, 99.64] |
| 2 Responder rate RR Show forest plot | 11 | Risk Ratio (Fixed, 95% CI) | Subtotals only | |
| 2.1 Anterior thalamic nucleus | 1 | 108 | Risk Ratio (Fixed, 95% CI) | 1.14 [0.62, 2.10] |
| 2.2 Centromedian thalamic stimulation | 1 | 12 | Risk Ratio (Fixed, 95% CI) | 1.0 [0.38, 2.66] |
| 2.3 Cerebellar stimulation | 3 | 33 | Risk Ratio (Fixed, 95% CI) | 2.00 [0.51, 7.86] |
| 2.4 Hippocampal stimulation (1 to 3 months) | 3 | 21 | Risk Ratio (Fixed, 95% CI) | 1.12 [0.47, 2.66] |
| 2.5 Hippocampal stimulation (4 to 6 months) | 1 | 6 | Risk Ratio (Fixed, 95% CI) | 5.00 [0.29, 87.54] |
| 2.6 Nucleus accumbens stimulation | 1 | 8 | Risk Ratio (Fixed, 95% CI) | 4.00 [0.56, 28.40] |
| 2.7 Closed‐loop ictal onset zone stimulation | 1 | 191 | Risk Ratio (Fixed, 95% CI) | 1.09 [0.69, 1.72] |
| 3 Seizure freedom OR 0.25 Show forest plot | 11 | Odds Ratio (Fixed, 95% CI) | Subtotals only | |
| 3.1 Anterior thalamic nucleus | 1 | 109 | Odds Ratio (Fixed, 95% CI) | 0.20 [0.00, 15.17] |
| 3.2 Centromedian thalamic stimulation | 1 | 12 | Odds Ratio (Fixed, 95% CI) | 1.0 [0.05, 19.79] |
| 3.3 Cerebellar stimulation | 3 | 33 | Odds Ratio (Fixed, 95% CI) | 0.96 [0.13, 6.83] |
| 3.4 Hippocampal stimulation (1 to 3 months) | 3 | 21 | Odds Ratio (Fixed, 95% CI) | 1.03 [0.13, 8.41] |
| 3.5 Hippocampal stimulation (4 to 6 months) | 1 | 6 | Odds Ratio (Fixed, 95% CI) | 1.89 [0.01, 608.05] |
| 3.6 Nucleus accumbens stimulation | 1 | 8 | Odds Ratio (Fixed, 95% CI) | 1.0 [0.04, 27.83] |
| 3.7 Closed‐loop ictal onset zone stimulation | 1 | 191 | Odds Ratio (Fixed, 95% CI) | 8.91 [0.14, 560.31] |
| 4 Responder rate OR 0.25 Show forest plot | 11 | Odds Ratio (Fixed, 95% CI) | Subtotals only | |
| 4.1 Anterior thalamic nucleus | 1 | 108 | Odds Ratio (Fixed, 95% CI) | 1.20 [0.52, 2.80] |
| 4.2 Centromedian thalamic stimulation | 1 | 12 | Odds Ratio (Fixed, 95% CI) | 1.0 [0.31, 3.24] |
| 4.3 Cerebellar stimulation | 3 | 33 | Odds Ratio (Fixed, 95% CI) | 2.98 [0.39, 22.77] |
| 4.4 Hippocampal stimulation (1 to 3 months) | 3 | 21 | Odds Ratio (Fixed, 95% CI) | 1.15 [0.35, 3.77] |
| 4.5 Hippocampal stimulation (4 to 6 months) | 1 | 6 | Odds Ratio (Fixed, 95% CI) | 17.00 [0.15, 1934.66] |
| 4.6 Nucleus accumbens stimulation | 1 | 8 | Odds Ratio (Fixed, 95% CI) | 21.00 [0.51, 864.51] |
| 4.7 Closed‐loop ictal onset zone stimulation | 1 | 191 | Odds Ratio (Fixed, 95% CI) | 1.12 [0.59, 2.11] |
| 5 Seizure freedom RR 0.25 Show forest plot | 11 | Risk Ratio (Fixed, 95% CI) | Subtotals only | |
| 5.1 Anterior thalamic nucleus | 1 | 109 | Risk Ratio (Fixed, 95% CI) | 0.21 [0.00, 14.95] |
| 5.2 Centromedian thalamic stimulation | 1 | 12 | Risk Ratio (Fixed, 95% CI) | 1.0 [0.06, 15.99] |
| 5.3 Cerebellar stimulation | 3 | 33 | Risk Ratio (Fixed, 95% CI) | 0.96 [0.15, 6.04] |
| 5.4 Hippocampal stimulation (1 to 3 months) | 3 | 21 | Risk Ratio (Fixed, 95% CI) | 1.02 [0.16, 6.46] |
| 5.5 Hippocampal stimulation (4 to 6 months) | 1 | 6 | Risk Ratio (Fixed, 95% CI) | 1.80 [0.01, 369.24] |
| 5.6 Nucleus accumbens stimulation | 1 | 8 | Risk Ratio (Fixed, 95% CI) | 1.0 [0.06, 15.99] |
| 5.7 Closed‐loop ictal onset zone stimulation | 1 | 191 | Risk Ratio (Fixed, 95% CI) | 8.72 [0.14, 538.18] |
| 6 Responder rate RR 0.25 Show forest plot | 11 | Risk Ratio (Fixed, 95% CI) | Subtotals only | |
| 6.1 Anterior thalamic nucleus | 1 | 108 | Risk Ratio (Fixed, 95% CI) | 1.14 [0.62, 2.10] |
| 6.2 Centromedian thalamic stimulation | 1 | 12 | Risk Ratio (Fixed, 95% CI) | 1.0 [0.40, 2.52] |
| 6.3 Cerebellar stimulation | 3 | 33 | Risk Ratio (Fixed, 95% CI) | 2.28 [0.40, 13.02] |
| 6.4 Hippocampal stimulation (1 to 3 months) | 3 | 21 | Risk Ratio (Fixed, 95% CI) | 1.08 [0.46, 2.55] |
| 6.5 Hippocampal stimulation (4 to 6 months) | 1 | 6 | Risk Ratio (Fixed, 95% CI) | 9.00 [0.16, 494.41] |
| 6.6 Nucleus accumbens stimulation | 1 | 8 | Risk Ratio (Fixed, 95% CI) | 7.00 [0.44, 111.91] |
| 6.7 Closed‐loop ictal onset zone stimulation | 1 | 191 | Risk Ratio (Fixed, 95% CI) | 1.09 [0.69, 1.72] |