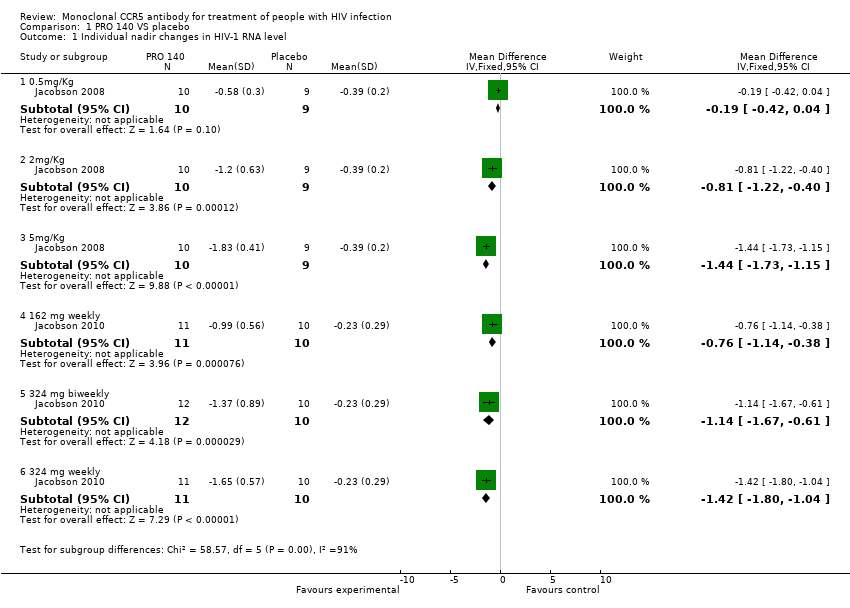
| 1 Individual nadir changes in HIV‐1 RNA level Show forest plot | 2 | | Mean Difference (IV, Fixed, 95% CI) | Subtotals only |
|
| 1.1 0.5mg/Kg | 1 | 19 | Mean Difference (IV, Fixed, 95% CI) | ‐0.19 [‐0.42, 0.04] |
| 1.2 2mg/Kg | 1 | 19 | Mean Difference (IV, Fixed, 95% CI) | ‐0.81 [‐1.22, ‐0.40] |
| 1.3 5mg/Kg | 1 | 19 | Mean Difference (IV, Fixed, 95% CI) | ‐1.44 [‐1.73, ‐1.15] |
| 1.4 162 mg weekly | 1 | 21 | Mean Difference (IV, Fixed, 95% CI) | ‐0.76 [‐1.14, ‐0.38] |
| 1.5 324 mg biweekly | 1 | 22 | Mean Difference (IV, Fixed, 95% CI) | ‐1.14 [‐1.67, ‐0.61] |
| 1.6 324 mg weekly | 1 | 21 | Mean Difference (IV, Fixed, 95% CI) | ‐1.42 [‐1.80, ‐1.04] |
| 2 Changes in HIV‐1 RNA level on day 10 Show forest plot | 1 | | Mean Difference (IV, Fixed, 95% CI) | Subtotals only |
|
| 2.1 0.5mg/Kg | 1 | 19 | Mean Difference (IV, Fixed, 95% CI) | ‐0.24 [‐0.61, 0.13] |
| 2.2 2mg/Kg | 1 | 19 | Mean Difference (IV, Fixed, 95% CI) | ‐0.91 [‐1.23, ‐0.59] |
| 2.3 5mg/Kg | 1 | 19 | Mean Difference (IV, Fixed, 95% CI) | ‐1.57 [‐1.91, ‐1.23] |
| 3 Changes in HIV‐1 RNA level on day 22 Show forest plot | 1 | 64 | Mean Difference (IV, Fixed, 95% CI) | ‐0.87 [‐1.08, ‐0.66] |
|
| 3.1 162 mg weekly | 1 | 21 | Mean Difference (IV, Fixed, 95% CI) | ‐0.6 [‐0.87, ‐0.33] |
| 3.2 324 mg biweekly | 1 | 22 | Mean Difference (IV, Fixed, 95% CI) | ‐1.05 [‐1.63, ‐0.47] |
| 3.3 324 mg weekly | 1 | 21 | Mean Difference (IV, Fixed, 95% CI) | ‐1.36 [‐1.76, ‐0.96] |
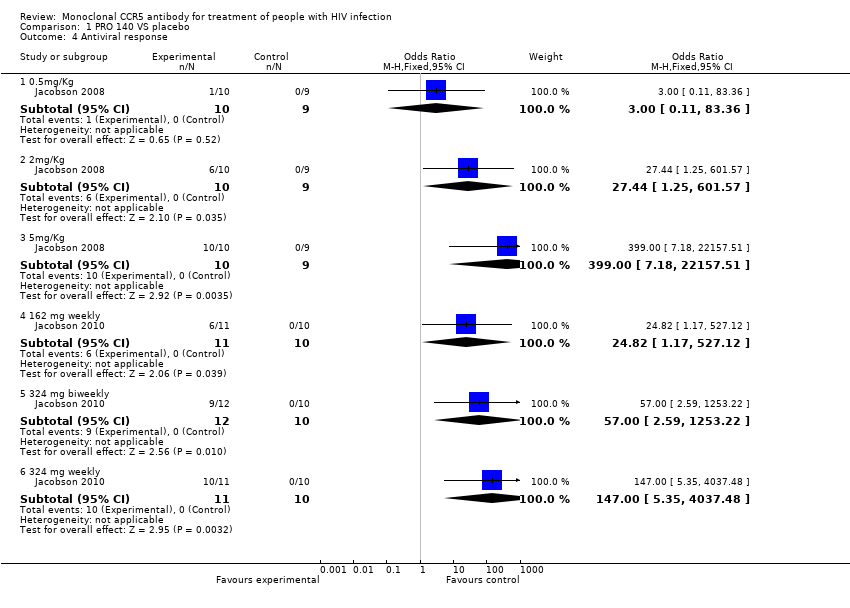
| 4 Antiviral response Show forest plot | 2 | | Odds Ratio (M‐H, Fixed, 95% CI) | Subtotals only |
|
| 4.1 0.5mg/Kg | 1 | 19 | Odds Ratio (M‐H, Fixed, 95% CI) | 3.0 [0.11, 83.36] |
| 4.2 2mg/Kg | 1 | 19 | Odds Ratio (M‐H, Fixed, 95% CI) | 27.44 [1.25, 601.57] |
| 4.3 5mg/Kg | 1 | 19 | Odds Ratio (M‐H, Fixed, 95% CI) | 399.0 [7.18, 22157.51] |
| 4.4 162 mg weekly | 1 | 21 | Odds Ratio (M‐H, Fixed, 95% CI) | 24.82 [1.17, 527.12] |
| 4.5 324 mg biweekly | 1 | 22 | Odds Ratio (M‐H, Fixed, 95% CI) | 57.00 [2.59, 1253.22] |
| 4.6 324 mg weekly | 1 | 21 | Odds Ratio (M‐H, Fixed, 95% CI) | 147.0 [5.35, 4037.48] |
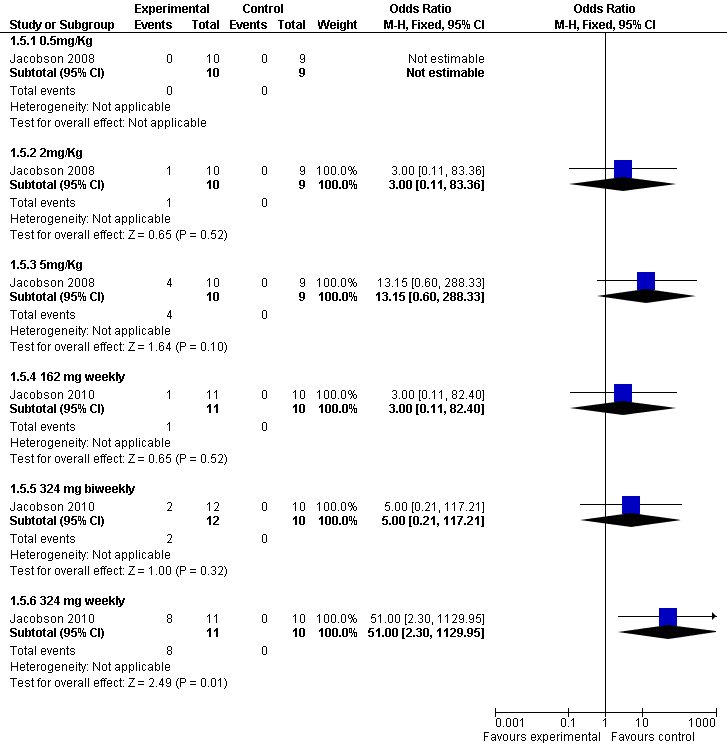
| 5 No. of subjects with ≦400 copies/mL HIV‐1 RNA Show forest plot | 2 | | Odds Ratio (M‐H, Fixed, 95% CI) | Subtotals only |
|
| 5.1 0.5mg/Kg | 1 | 19 | Odds Ratio (M‐H, Fixed, 95% CI) | 0.0 [0.0, 0.0] |
| 5.2 2mg/Kg | 1 | 19 | Odds Ratio (M‐H, Fixed, 95% CI) | 3.0 [0.11, 83.36] |
| 5.3 5mg/Kg | 1 | 19 | Odds Ratio (M‐H, Fixed, 95% CI) | 13.15 [0.60, 288.33] |
| 5.4 162 mg weekly | 1 | 21 | Odds Ratio (M‐H, Fixed, 95% CI) | 3.0 [0.11, 82.40] |
| 5.5 324 mg biweekly | 1 | 22 | Odds Ratio (M‐H, Fixed, 95% CI) | 5.0 [0.21, 117.21] |
| 5.6 324 mg weekly | 1 | 21 | Odds Ratio (M‐H, Fixed, 95% CI) | 51.0 [2.30, 1129.95] |
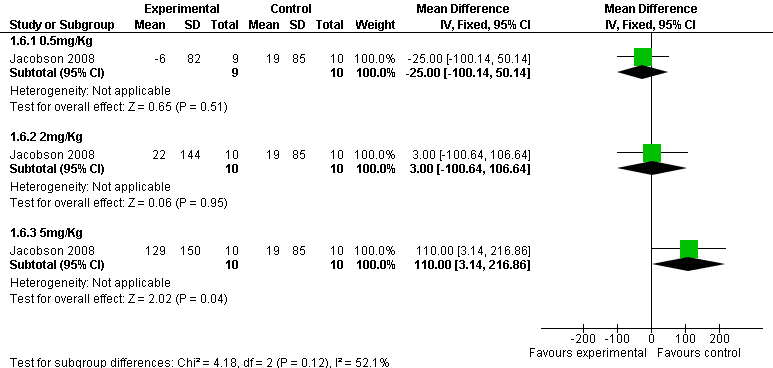
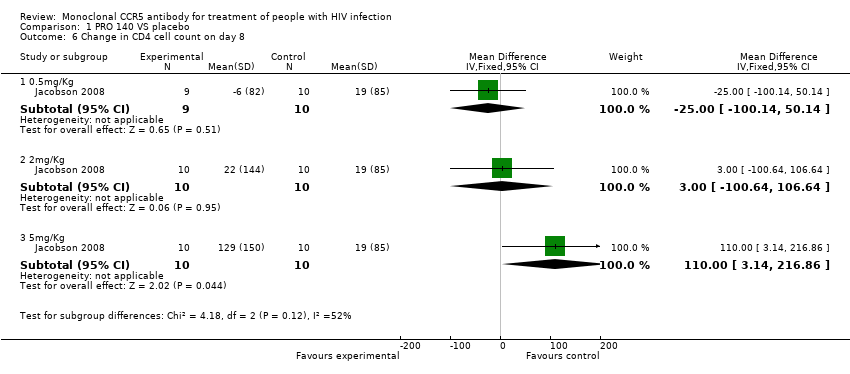
| 6 Change in CD4 cell count on day 8 Show forest plot | 1 | | Mean Difference (IV, Fixed, 95% CI) | Subtotals only |
|
| 6.1 0.5mg/Kg | 1 | 19 | Mean Difference (IV, Fixed, 95% CI) | ‐25.0 [‐100.14, 50.14] |
| 6.2 2mg/Kg | 1 | 20 | Mean Difference (IV, Fixed, 95% CI) | 3.0 [‐100.64, 106.64] |
| 6.3 5mg/Kg | 1 | 20 | Mean Difference (IV, Fixed, 95% CI) | 110.0 [3.14, 216.86] |