Fluoropirimidinas por vía oral versus intravenosa para el cáncer colorrectal
Información
- DOI:
- https://doi.org/10.1002/14651858.CD008398.pub2Copiar DOI

- Base de datos:
-
- Cochrane Database of Systematic Reviews
- Versión publicada:
-
- 28 julio 2017see what's new
- Tipo:
-
- Intervention
- Etapa:
-
- Review
- Grupo Editorial Cochrane:
-
Grupo Cochrane de Colorrectal
- Copyright:
-
- Copyright © 2017 The Cochrane Collaboration. Published by John Wiley & Sons, Ltd.
Cifras del artículo
Altmetric:
Citado por:
Autores
Contributions of authors
Fiona Chionh: protocol development, with contribution from all protocol co‐authors; co‐ordinating the review; study selection; data extraction; risk of bias assessment; correspondence with study authors and study contacts; data analysis; interpretation of data; writing the review.
Yvonne Yeung: study selection; data extraction; risk of bias assessment; writing the review.
David Lau: study selection; data extraction; risk of bias assessment; interpretation of data; writing the review.
Timothy Price: contribution to protocol development; clinical advice; writing the review.
Niall Tebbutt: contribution to protocol development; study selection; risk of bias assessment; interpretation of data; clinical advice; writing the review.
Declarations of interest
FC has been provided with honorarium from Roche to speak at a non‐promotional educational meeting. DL has received an educational grant from Roche. TP is on advisory boards for Roche and Amgen. NT is on advisory boards for Roche, Amgen and Bayer.
Acknowledgements
We would like to acknowledge the following people.
-
The Cochrane Colorectal Cancer Group (in particular, Dr. Henning Keinke Andersen, Sys Johnsen, Anne Kathrine Helnæs Jensen, Marija Barbateskovic, and Susse Wegeberg) for assistance with the review, including assistance from the Trial Information Specialists with the search strategy for the Cochrane Library, MEDLINE (OVID), and Embase (OVID).
-
The Australasian Cochrane Centre Training team, for assistance provided.
-
Diana Zannino, statistician from the Centre for Biostatistics & Clinical Trials; Peter MacCallum Cancer Centre, Australia; for assistance with extracting statistics from manuscripts for the review.
-
Professor Val Gebski, Professor and Director, Biostatistics and Research Methodology, NHMRC Clinical Trials Centre, Australia, for assistance with non‐inferiority analyses.
-
Study authors and study contacts (including statisticians, pharmaceutical company liaison staff, and Co‐operative Group staff) who replied to us and assisted with our queries about their studies. In particular, we would like to individually acknowledge the following study authors and study contacts who provided significant assistance with information about their studies: Dr. Abhishek Basu, Dr. Alejandro de la Torre Tomas, Anastasia Eleftheraki and Dr. Angelos Koutras, Mr. Atsuki Shinozaki and Dr. Narikazu Boku, Dr. Bruce Sizer, Dr. Carmen Allegra, Dr. Chikashi Ishioka and Dr. Shunsuke Kato, Dr. Christopher Twelves, Dr. Hirotoshi Hasegawa, Dr. Jean‐Pierre Pignon and Dr. Michel Ducreux, Dr. Jeremey Levin and Dr. Richard Schilsky, Dr. John Souglakos, Mr. Naruhito Takenaka, Dr. Paul Catalano, Dr. Peter Eggleton, Dr. Ralf Hofheinz, Dr. Yuri Barsukov and Dr. Sergey S. Gordeyev, and staff from Taiho who assisted us with our queries.
-
Dr. V.K. Yeung for translation of two study reports from Chinese to English.
-
Dr. Hongdo Do for translation of one study report from Korean to English.
-
Pharmaceutical company liaison staff (from Taiho, Roche, Orzel, and Adherex) who assisted with identifying studies.
-
Anne McLean, librarian at Austin Hospital, Australia, for assistance with the search strategy and with obtaining full‐text reports or the most mature study reports from the search.
-
A/Prof Sue‐Anne McLachlan for assistance with the search strategy for the protocol for this review.
-
Co‐authors of the protocol for this review ‐ Drs. Ainsley Campbell and Shawgi Sukumaran.
Version history
| Published | Title | Stage | Authors | Version |
| 2017 Jul 28 | Oral versus intravenous fluoropyrimidines for colorectal cancer | Review | Fiona Chionh, David Lau, Yvonne Yeung, Timothy Price, Niall Tebbutt | |
| 2010 Mar 17 | Oral versus intravenous fluoropyrimidines for colorectal cancer | Protocol | Fiona Chionh, Ainsley Campbell, Shawgi Sukumaran, Timothy Price, Niall Tebbutt | |
Differences between protocol and review
Terminology
-
We changed the term "intravenous 5‐FU chemotherapy" to "intravenous fluoropyrimidines" to correctly reflect the intended comparison of oral versus IV fluoropyrimidines in this review.
-
We changed the term "randomised trials" to “randomised controlled trials”.
-
We changed the term "Grade 3 or 4 toxicity" to "Grade ≥ 3 AEs".
Eligibility criteria
-
We clarified eligibility criteria regarding inclusion of studies with a cross‐over design to exclude studies in which participants in one or more of the treatment arms received fewer than three cycles of chemotherapy before cross‐over. We judged that reasonable comparisons with respect to efficacy and adverse event outcomes for this type of study design could not be performed in such studies.
Outcomes
-
We included TTP in participants with inoperable advanced or metastatic CRC who were treated with oral versus IV fluoropyrimidine chemotherapy as a secondary outcome. Multiple studies reported TTP rather than PFS as an efficacy outcome.
-
We provided further detail regarding the criteria used for grade ≥ 3 AE and ORR assessments.
Search methods
-
Trial Information Specialists from the Cochrane Colorectal Cancer Group updated search strategies for the Cochrane Central Register of Controlled Trials (CENTRAL), MEDLINE (OVID), and Embase (OVID).
-
We formulated the search strategy for the Web of Science (Web of Knowledge) databases with the assistance of Anne McLean (librarian at Austin Hospital, Australia).
-
We included search strategies for the databases listed above in the 'Appendices' section of the review.
-
We additionally searched the World Health Organization International Clinical Trials Registry Platform (WHO ICTRP), in keeping with the Methodological Expectations of Cochrane Intevention Reviews (MECIR) guidelines (Chandler 2013).
-
We did not search CancerLit separately, as we searched the broader MEDLINE database. We did not search Current Contents and Science Citation Index separately. Current Contents is integrated with Web of Science, and Science Citation Index Expanded was already included in the Web of Science search. After discussion with the hospital Drug Information Pharmacist, we did not search the International Pharmaceutical Abstracts database.
-
We modified the years of searching the proceedings for meeting and conferences.
Data collection and analysis
-
We changed the independent review authors for study selection, data extraction and management, and assessment of risk of bias to FC, YY, and DL, owing to attrition of AC and SS as authors of this review.
-
For studies that included patients treated with curative intent for CRC with neoadjuvant and/or adjuvant chemotherapy, we clarified that these were included only for DFS and OS outcomes if median follow‐up time was three years or longer; however, they could be included for grade ≥ 3 AEs outcome if median follow‐up time was less than three years.
-
We provided additional detail regarding assessment of risk of bias.
-
We provided additional detail regarding analysis of studies with multiple treatment arms.
-
In response to a peer reviewer suggestion, we performed analyses to assess whether oral fluoropyrimidines are non‐inferior to IV fluoropyrimidines, had the original design been one of non‐inferiority. In response to an editor suggestion, we further assessed whether non‐inferiority had been demonstrated if one made the post hoc judgement that retaining at least 80% of the activity of the active control was reasonable to demonstrate this.
-
We described pre‐specified subgroup analyses more clearly, in particular to reflect the comparison of any oral fluoropyrimidines versus any IV fluoropyrimidine. We included additional (but still pre‐specified) subgroup analyses to assess important subgroup analyses defined by the following intervention characteristics: received chemotherapy versus received chemo‐radiotherapy (among participants treated with curative intent for CRC)or received single‐agent versus combination therapy (among participants treated with palliative intent for inoperable advanced or metastatic CRC); received infusional versus bolus IV fluoropyrimidine; type of oral fluoropyrimidine backbone given (e.g. capecitabine vs UFT/Ftorafur vs Eniluracil + oral 5‐FU vs doxifluridine vs S‐1); and oxaliplatin‐based versus irinotecan‐based therapy (among participants treated with palliative intent for inoperable advanced or metastatic CRC who received combination chemotherapy).
-
After identifying the included studies, we performed a post hoc subgroup analysis to compare combination chemotherapy regimens with and without bevacizumab for the co‐primary endpoint of PFS in studies of palliative intent treatment with chemotherapy for inoperable advanced or metastatic CRC.
-
We provided additional detail in the review regarding the sensitivity analyses performed.
-
In response to an editor suggestion, we performed a sensitivity analysis for grade ≥ 3 HFS among participants treated with curative intent for CRC with neoadjuvant and/or adjuvant chemotherapy, and used a random‐effects model for meta‐analysis.
-
We assessed quality of the evidence using the GRADE approach, and reported this for key outcomes using 'Summary of findings' tables, in keeping with MECIR guidelines (Chandler 2013; Tovey 2012).
Keywords
MeSH
Medical Subject Headings (MeSH) Keywords
- Administration, Oral;
- Antineoplastic Agents [*administration & dosage, adverse effects];
- Camptothecin [administration & dosage, analogs & derivatives];
- Capecitabine [administration & dosage];
- Chemotherapy, Adjuvant;
- Colorectal Neoplasms [*drug therapy, mortality, pathology];
- Disease‐Free Survival;
- Floxuridine [administration & dosage];
- Fluorouracil [administration & dosage];
- Injections, Intravenous;
- Irinotecan;
- Neoadjuvant Therapy;
- Organoplatinum Compounds [administration & dosage];
- Palliative Care;
- Pyridines [administration & dosage];
- Pyrimidines [*administration & dosage];
- Randomized Controlled Trials as Topic;
- Tegafur [administration & dosage];
- Uracil [administration & dosage, analogs & derivatives];
Medical Subject Headings Check Words
Adult; Female; Humans; Male;
PICO

Study flow diagram.

Risk of bias graph: review authors' judgements about each risk of bias item presented as percentages across all included studies.1
1 In this graph, the risk of bias for each domain was calculated using the worst assessment documented for that domain in the contributing studies.

Risk of bias summary: review authors' judgements about each risk of bias item for each included study.1
1 In this summary, the risk of bias for each domain was scored using the worst assessment documented for that domain in the study.

Forest plot of disease‐free survival.

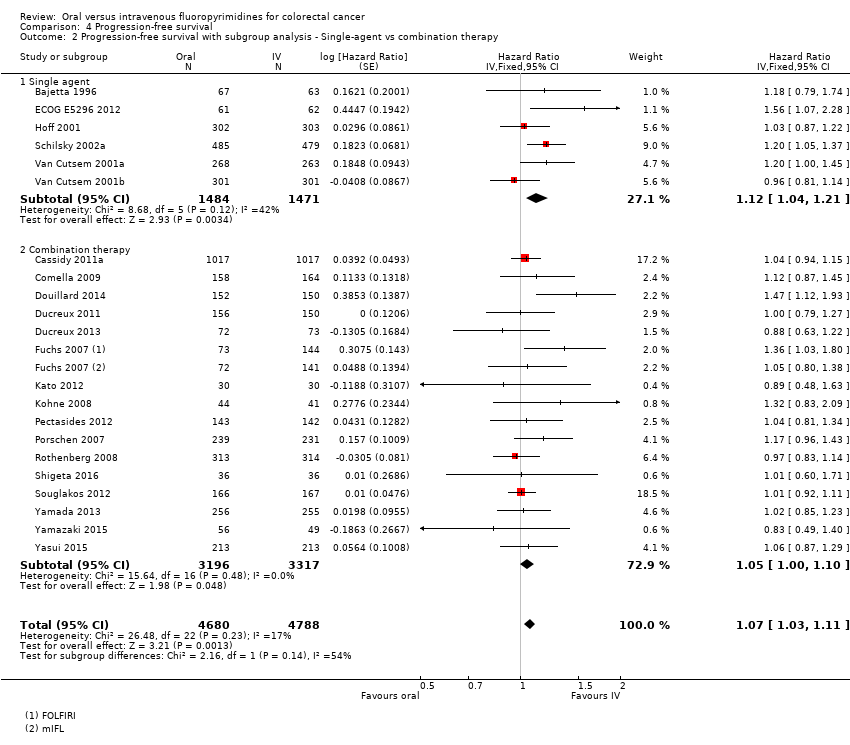
Forest plot of comparison: 4 Progression‐free survival with, outcome: 4.4 Progression‐free survival with subgroup analysis ‐ oral fluoropyrimidine backbone.
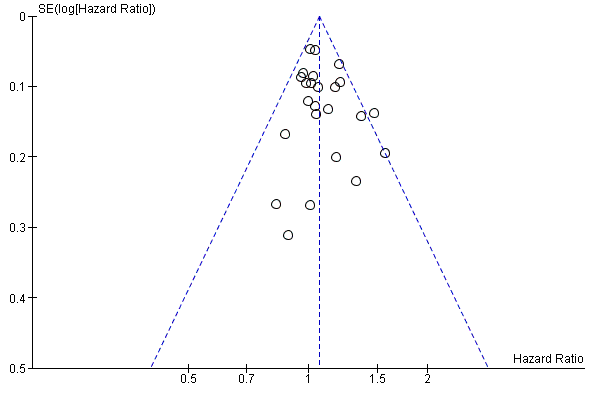
Funnel plot of progression‐free survival.

Comparison 1 Disease‐free survival, Outcome 1 Disease‐free survival.

Comparison 1 Disease‐free survival, Outcome 2 Disease‐free survival with subgroup analysis ‐ Chemotherapy vs chemo‐radiotherapy.
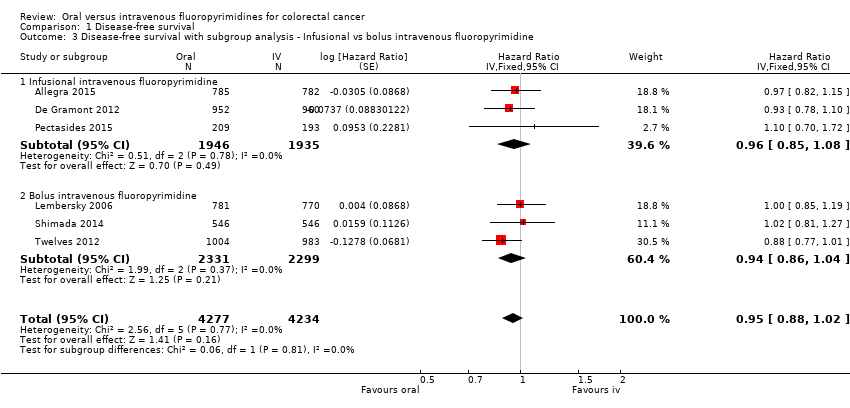
Comparison 1 Disease‐free survival, Outcome 3 Disease‐free survival with subgroup analysis ‐ Infusional vs bolus intravenous fluoropyrimidine.

Comparison 1 Disease‐free survival, Outcome 4 Disease‐free survival with subgroup analysis ‐ Oral fluoropyrimidine backbone.
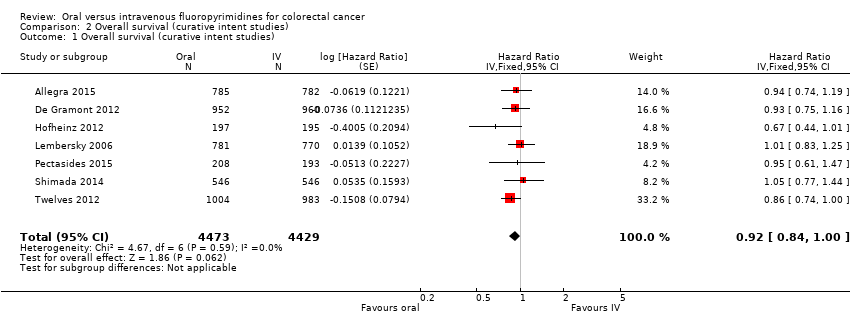
Comparison 2 Overall survival (curative intent studies), Outcome 1 Overall survival (curative intent studies).
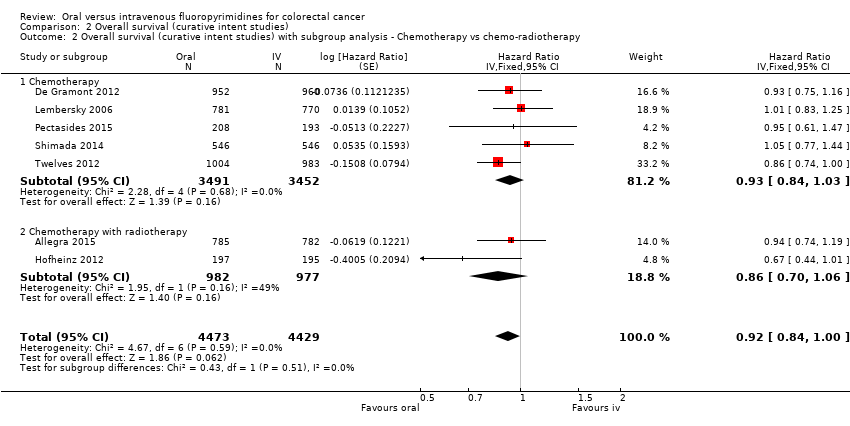
Comparison 2 Overall survival (curative intent studies), Outcome 2 Overall survival (curative intent studies) with subgroup analysis ‐ Chemotherapy vs chemo‐radiotherapy.

Comparison 2 Overall survival (curative intent studies), Outcome 3 Overall survival (curative intent studies) with subgroup analysis ‐ Infusional vs bolus intravenous fluoropyrimidine.
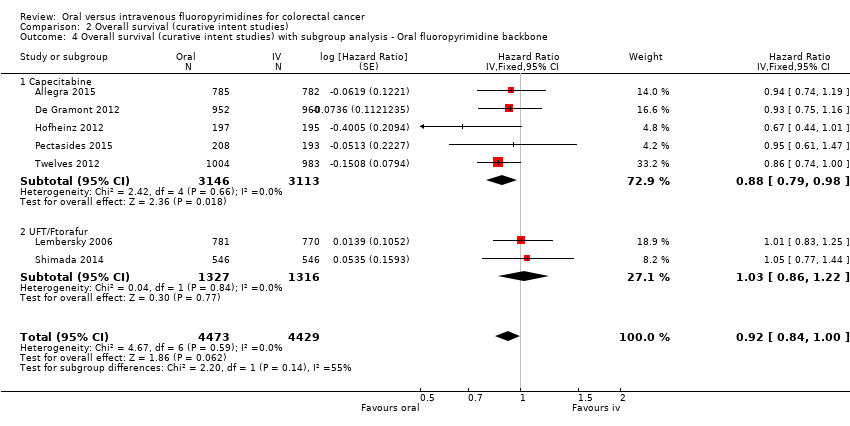
Comparison 2 Overall survival (curative intent studies), Outcome 4 Overall survival (curative intent studies) with subgroup analysis ‐ Oral fluoropyrimidine backbone.

Comparison 3 Grade ≥ 3 adverse events (curative intent studies), Outcome 1 Grade ≥ 3 diarrhoea (curative intent studies).
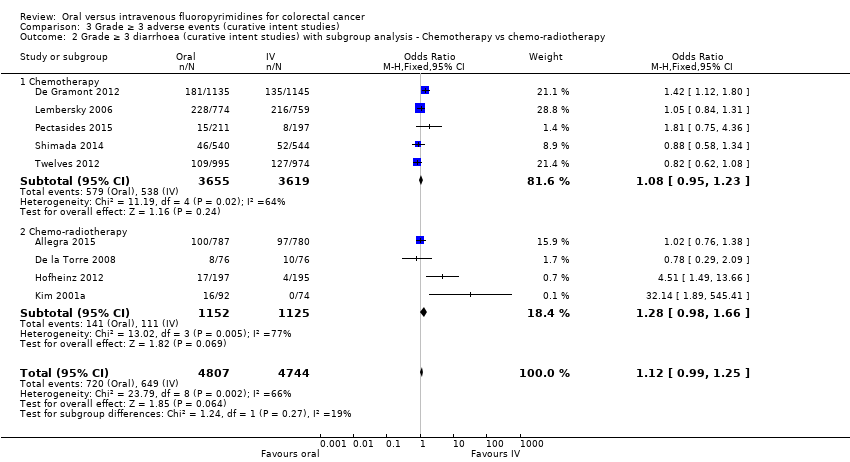
Comparison 3 Grade ≥ 3 adverse events (curative intent studies), Outcome 2 Grade ≥ 3 diarrhoea (curative intent studies) with subgroup analysis ‐ Chemotherapy vs chemo‐radiotherapy.

Comparison 3 Grade ≥ 3 adverse events (curative intent studies), Outcome 3 Grade ≥ 3 diarrhoea (curative intent studies) with subgroup analysis ‐ Infusional vs bolus intravenous fluoropyrimidine.
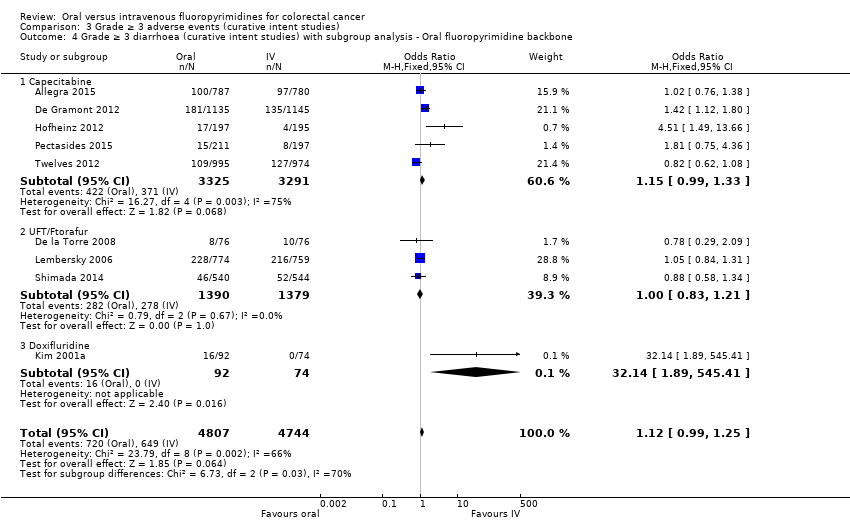
Comparison 3 Grade ≥ 3 adverse events (curative intent studies), Outcome 4 Grade ≥ 3 diarrhoea (curative intent studies) with subgroup analysis ‐ Oral fluoropyrimidine backbone.

Comparison 3 Grade ≥ 3 adverse events (curative intent studies), Outcome 5 Grade ≥ 3 hand foot syndrome (curative intent studies).
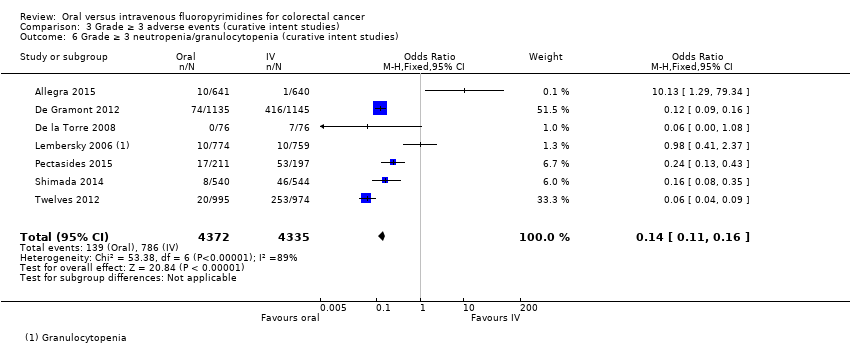
Comparison 3 Grade ≥ 3 adverse events (curative intent studies), Outcome 6 Grade ≥ 3 neutropenia/granulocytopenia (curative intent studies).
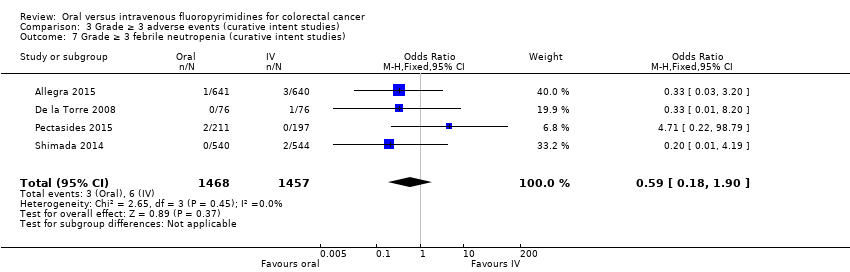
Comparison 3 Grade ≥ 3 adverse events (curative intent studies), Outcome 7 Grade ≥ 3 febrile neutropenia (curative intent studies).
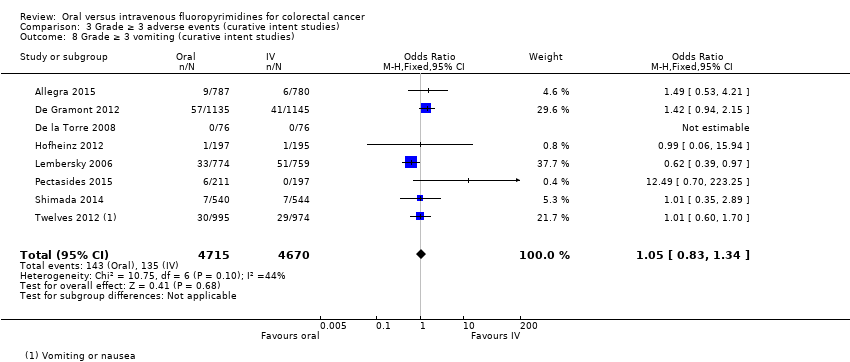
Comparison 3 Grade ≥ 3 adverse events (curative intent studies), Outcome 8 Grade ≥ 3 vomiting (curative intent studies).
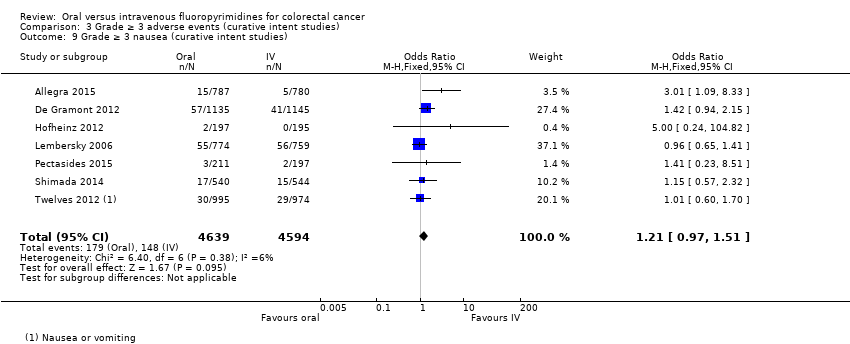
Comparison 3 Grade ≥ 3 adverse events (curative intent studies), Outcome 9 Grade ≥ 3 nausea (curative intent studies).
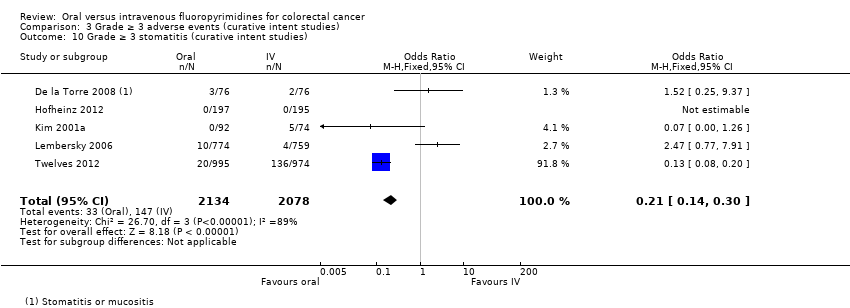
Comparison 3 Grade ≥ 3 adverse events (curative intent studies), Outcome 10 Grade ≥ 3 stomatitis (curative intent studies).
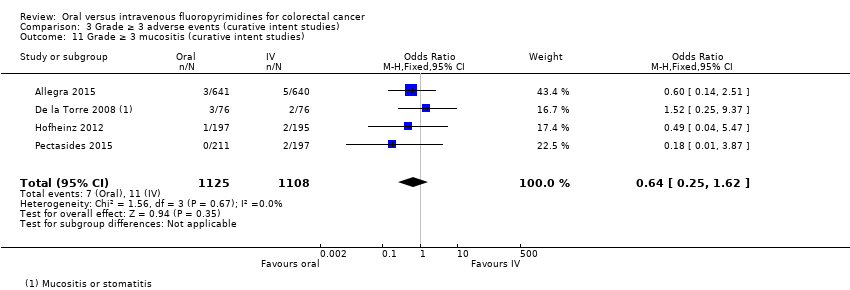
Comparison 3 Grade ≥ 3 adverse events (curative intent studies), Outcome 11 Grade ≥ 3 mucositis (curative intent studies).
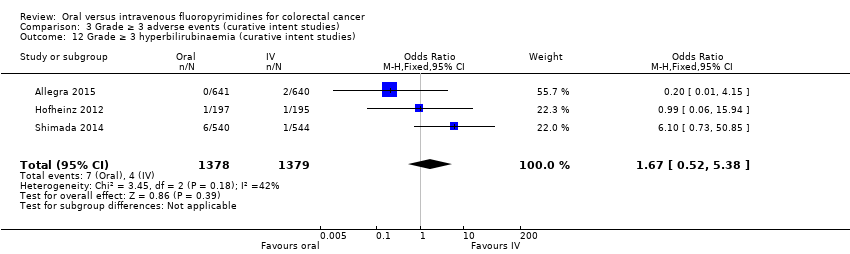
Comparison 3 Grade ≥ 3 adverse events (curative intent studies), Outcome 12 Grade ≥ 3 hyperbilirubinaemia (curative intent studies).
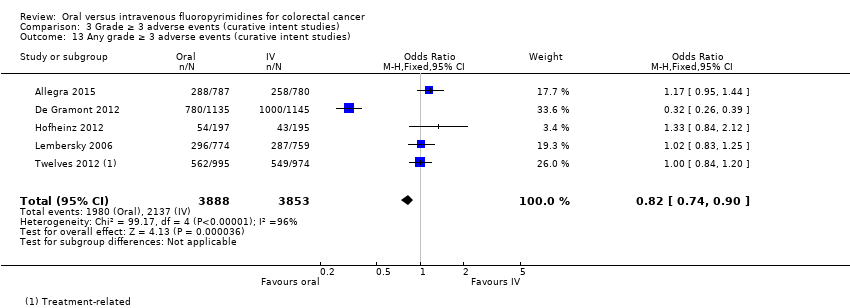
Comparison 3 Grade ≥ 3 adverse events (curative intent studies), Outcome 13 Any grade ≥ 3 adverse events (curative intent studies).

Comparison 4 Progression‐free survival, Outcome 1 Progression‐free survival.
Comparison 4 Progression‐free survival, Outcome 2 Progression‐free survival with subgroup analysis ‐ Single‐agent vs combination therapy.

Comparison 4 Progression‐free survival, Outcome 3 Progression‐free survival with subgroup analysis ‐ Infusional vs bolus intravenous fluoropyrimidine.

Comparison 4 Progression‐free survival, Outcome 4 Progression‐free survival with subgroup analysis ‐ Oral fluoropyrimidine backbone.

Comparison 4 Progression‐free survival, Outcome 5 Progression‐free survival for combination therapy with subgroup analysis ‐ Oxaliplatin‐based vs irinotecan‐based.
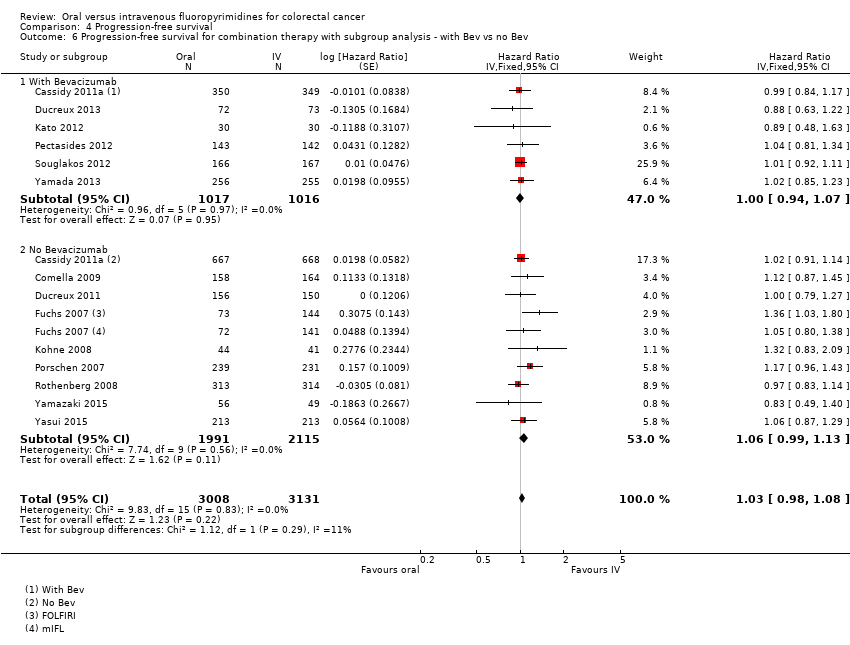
Comparison 4 Progression‐free survival, Outcome 6 Progression‐free survival for combination therapy with subgroup analysis ‐ with Bev vs no Bev.
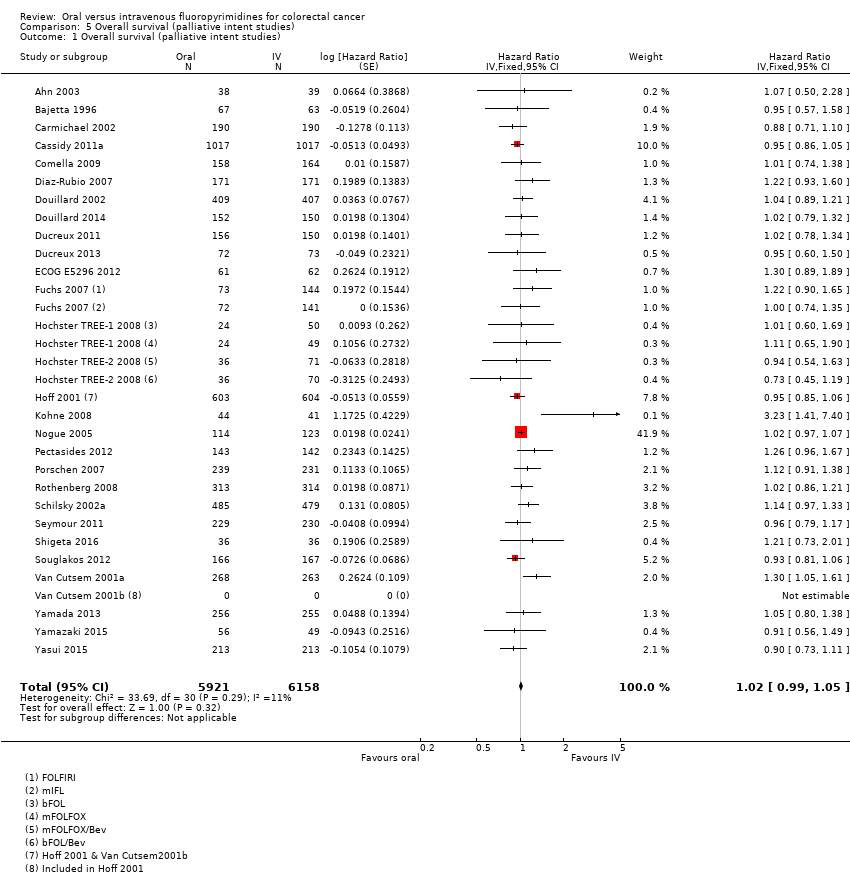
Comparison 5 Overall survival (palliative intent studies), Outcome 1 Overall survival (palliative intent studies).

Comparison 5 Overall survival (palliative intent studies), Outcome 2 Overall survival (palliative intent studies) with subgroup analysis ‐ Single‐agent vs combination therapy.

Comparison 5 Overall survival (palliative intent studies), Outcome 3 Overall survival (palliative intent studies) with subgroup analysis ‐ Infusional vs bolus intravenous fluoropyrimidine.
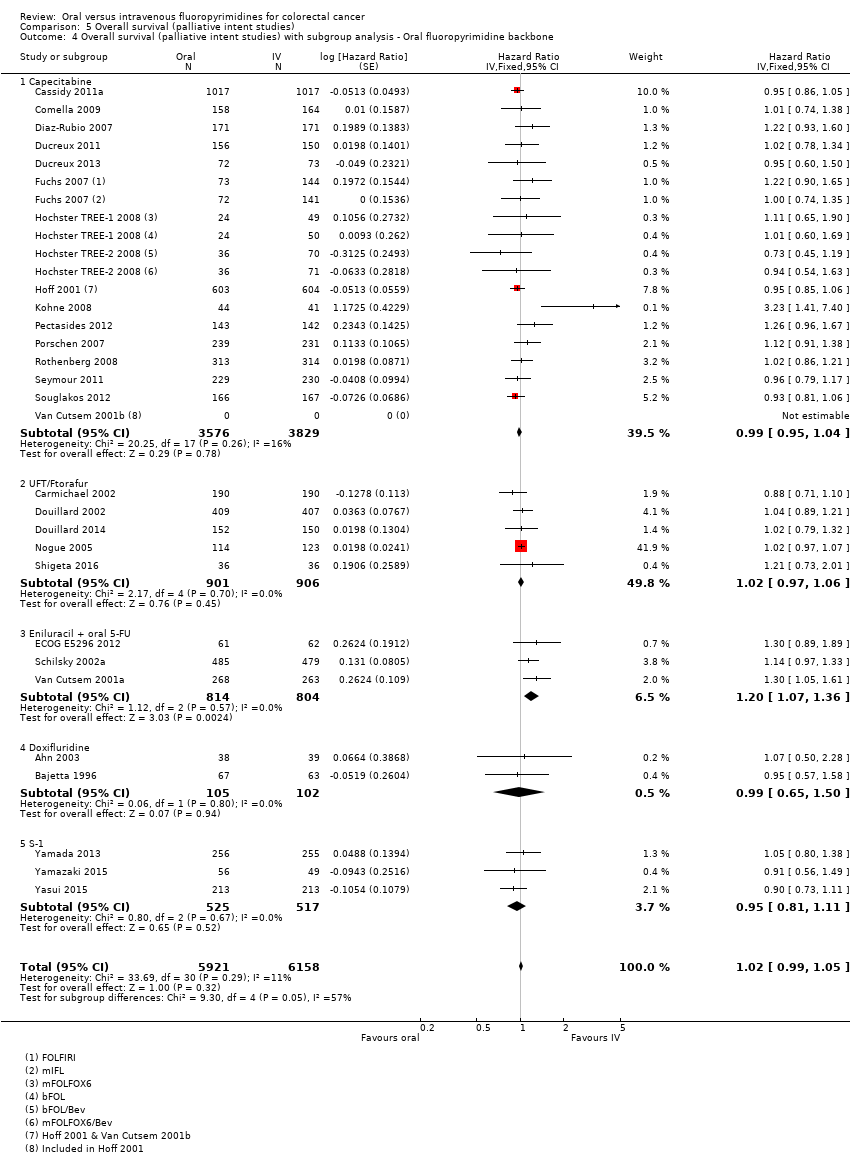
Comparison 5 Overall survival (palliative intent studies), Outcome 4 Overall survival (palliative intent studies) with subgroup analysis ‐ Oral fluoropyrimidine backbone.
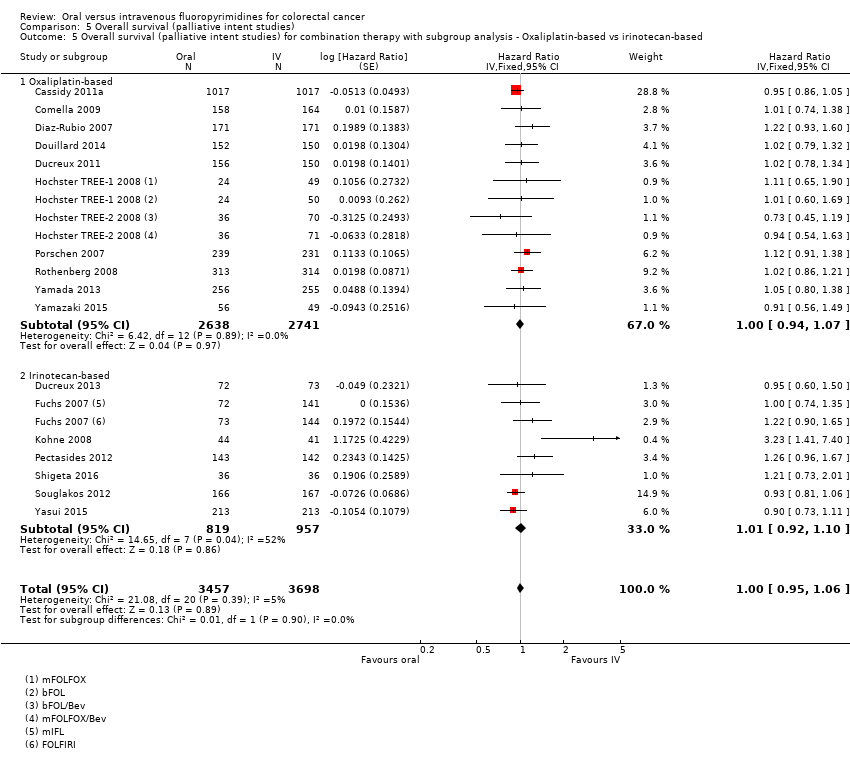
Comparison 5 Overall survival (palliative intent studies), Outcome 5 Overall survival (palliative intent studies) for combination therapy with subgroup analysis ‐ Oxaliplatin‐based vs irinotecan‐based.
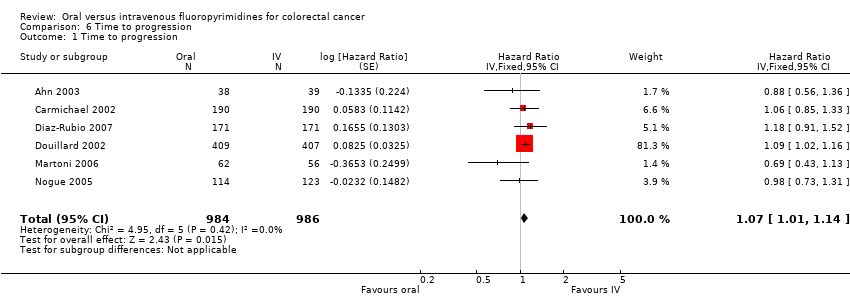
Comparison 6 Time to progression, Outcome 1 Time to progression.
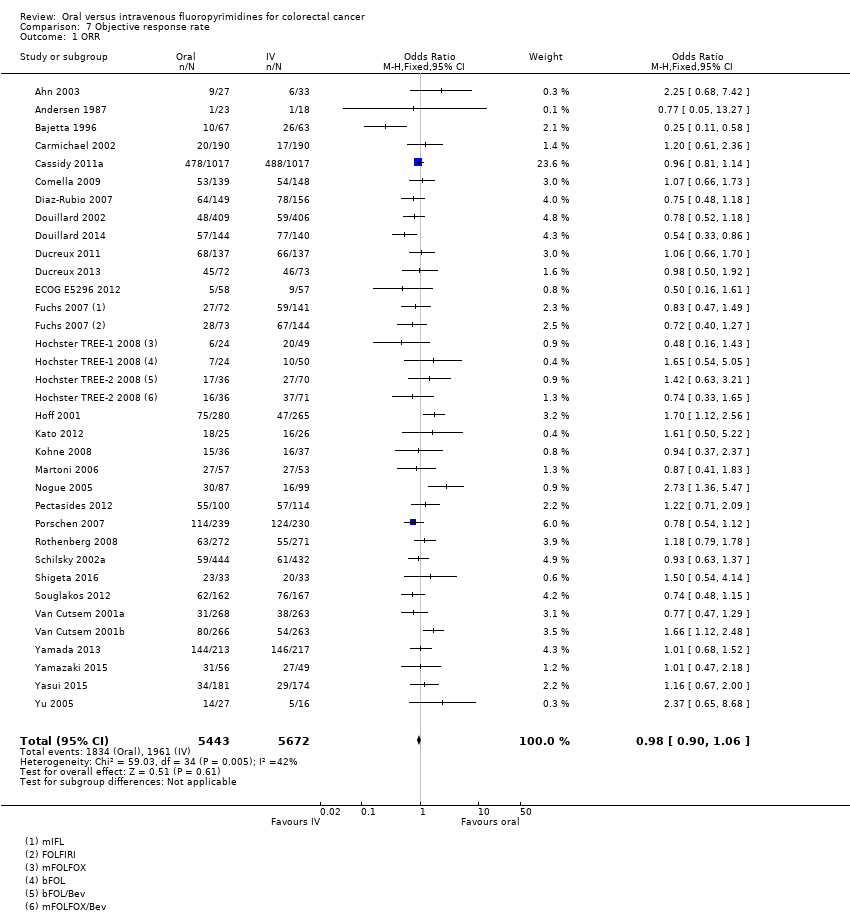
Comparison 7 Objective response rate, Outcome 1 ORR.
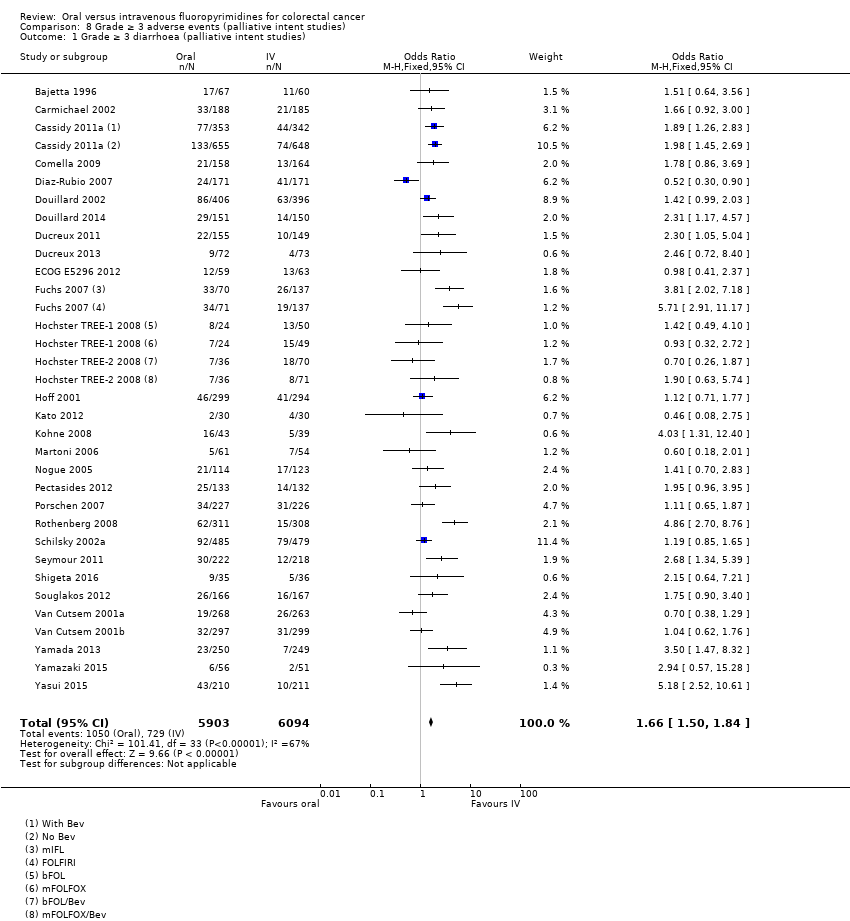
Comparison 8 Grade ≥ 3 adverse events (palliative intent studies), Outcome 1 Grade ≥ 3 diarrhoea (palliative intent studies).

Comparison 8 Grade ≥ 3 adverse events (palliative intent studies), Outcome 2 Grade ≥ 3 diarrhoea (palliative intent studies) with subgroup analysis ‐ Single‐agent vs combination therapy.

Comparison 8 Grade ≥ 3 adverse events (palliative intent studies), Outcome 3 Grade ≥ 3 diarrhea (palliative intent studies) with subgroup analysis ‐ Infusional vs bolus intravenous fluoropyrimidine.
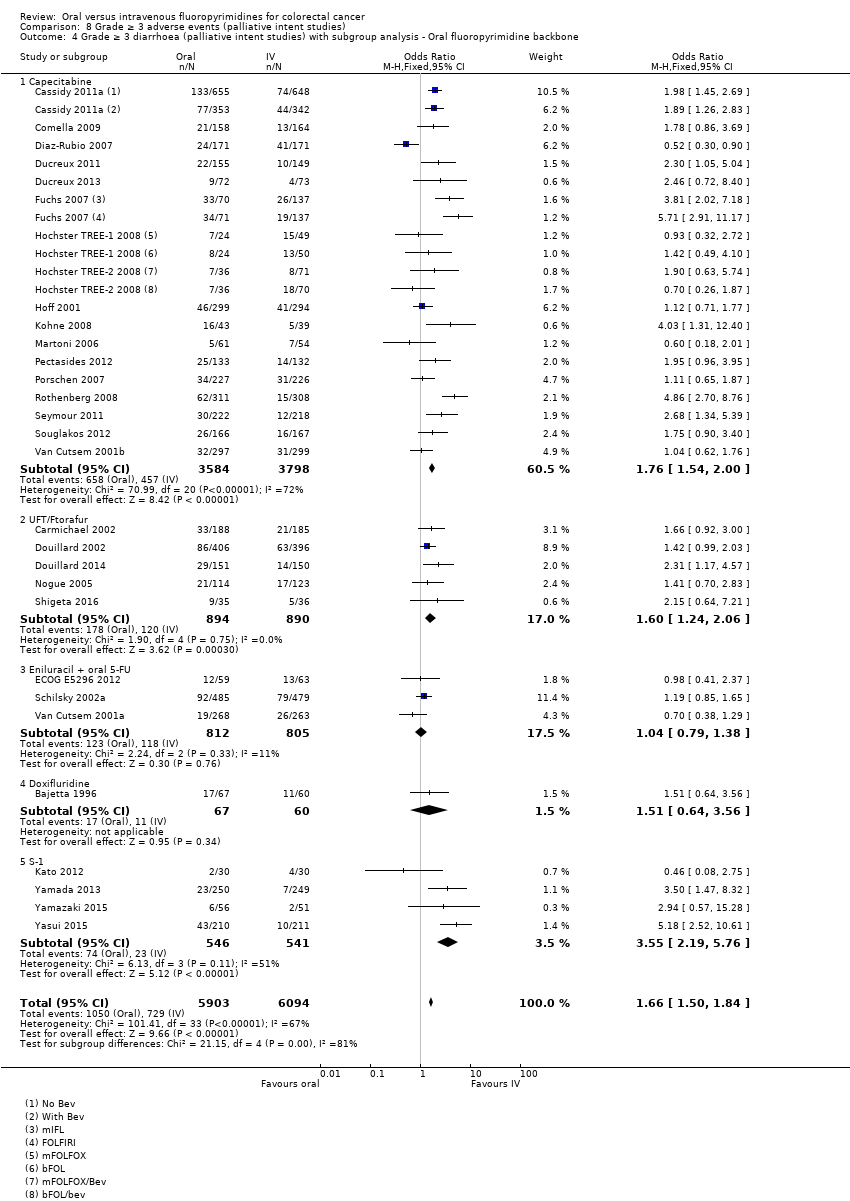
Comparison 8 Grade ≥ 3 adverse events (palliative intent studies), Outcome 4 Grade ≥ 3 diarrhoea (palliative intent studies) with subgroup analysis ‐ Oral fluoropyrimidine backbone.
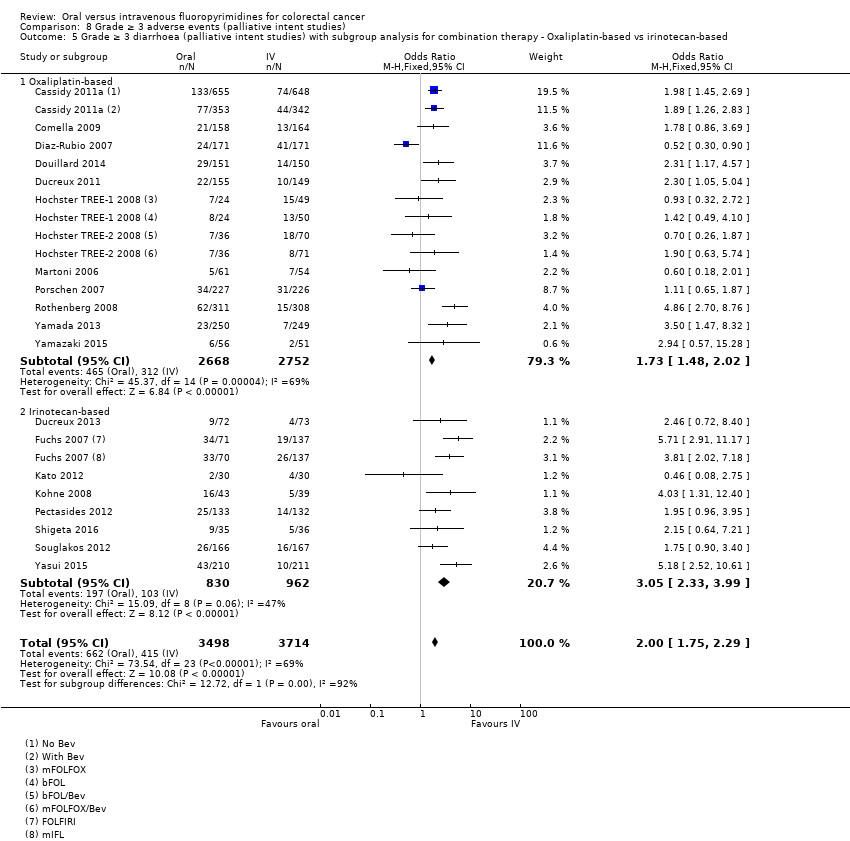
Comparison 8 Grade ≥ 3 adverse events (palliative intent studies), Outcome 5 Grade ≥ 3 diarrhoea (palliative intent studies) with subgroup analysis for combination therapy ‐ Oxaliplatin‐based vs irinotecan‐based.

Comparison 8 Grade ≥ 3 adverse events (palliative intent studies), Outcome 6 Grade ≥ 3 hand foot syndrome (palliative intent studies).
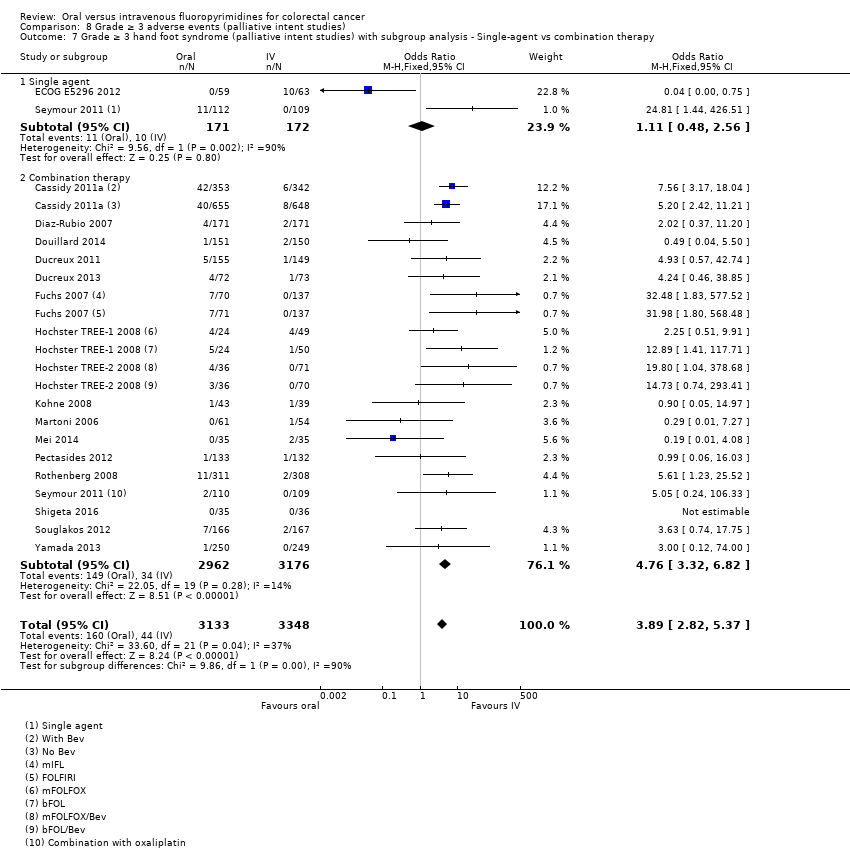
Comparison 8 Grade ≥ 3 adverse events (palliative intent studies), Outcome 7 Grade ≥ 3 hand foot syndrome (palliative intent studies) with subgroup analysis ‐ Single‐agent vs combination therapy.

Comparison 8 Grade ≥ 3 adverse events (palliative intent studies), Outcome 8 Grade ≥ 3 hand foot syndrome (palliative intent studies) with subgroup analysis ‐ Infusional vs bolus intravenous fluoropyrimidine.
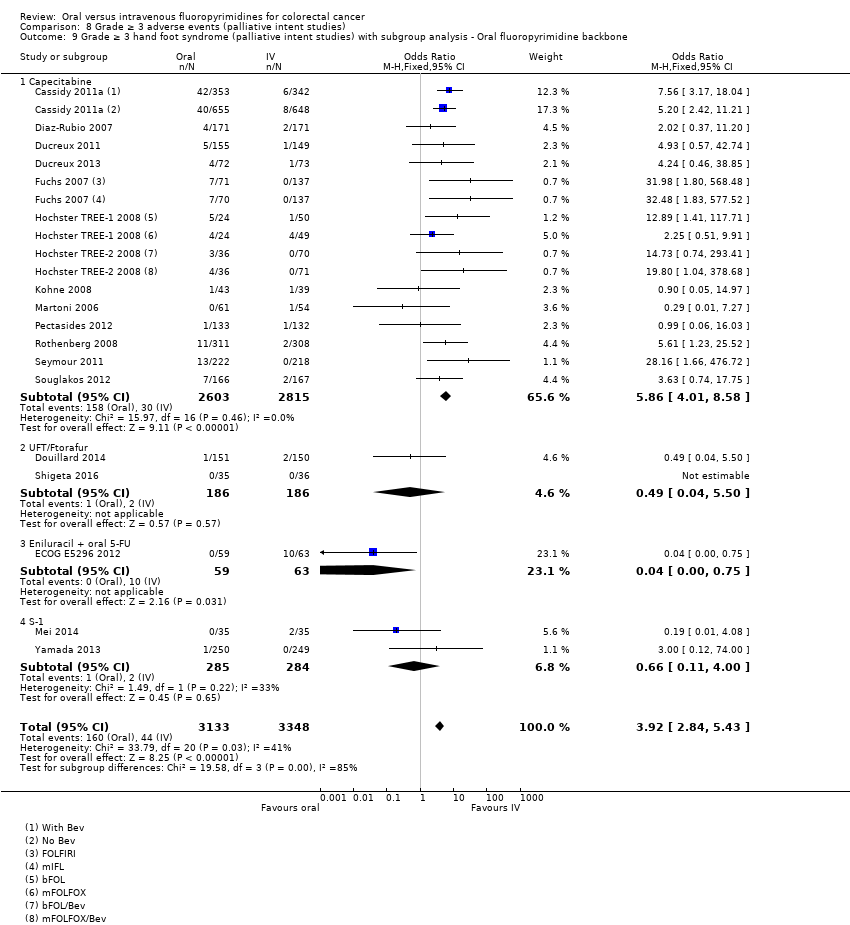
Comparison 8 Grade ≥ 3 adverse events (palliative intent studies), Outcome 9 Grade ≥ 3 hand foot syndrome (palliative intent studies) with subgroup analysis ‐ Oral fluoropyrimidine backbone.
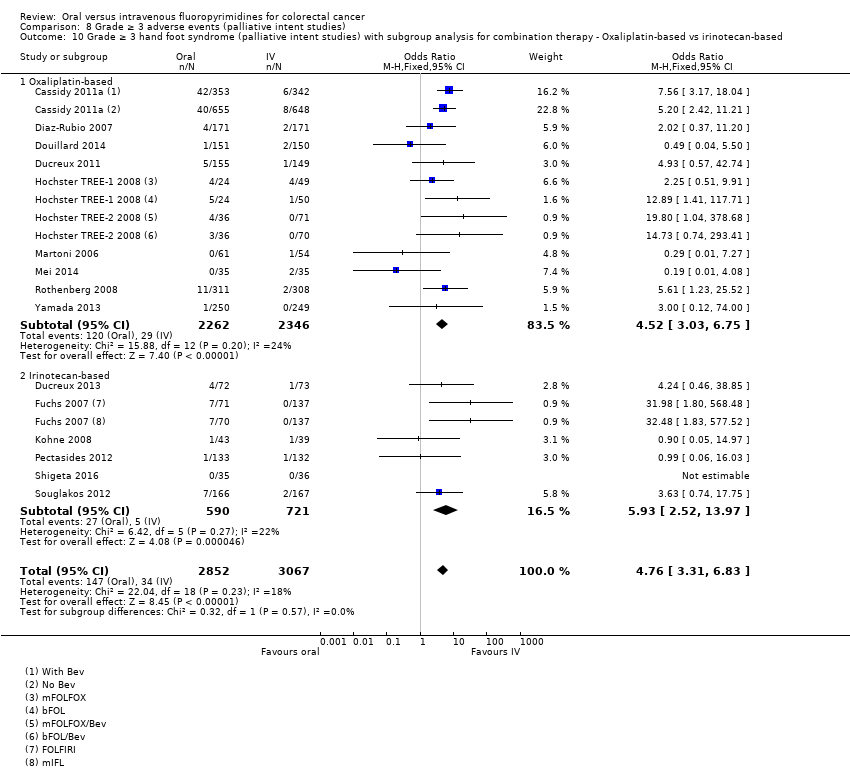
Comparison 8 Grade ≥ 3 adverse events (palliative intent studies), Outcome 10 Grade ≥ 3 hand foot syndrome (palliative intent studies) with subgroup analysis for combination therapy ‐ Oxaliplatin‐based vs irinotecan‐based.
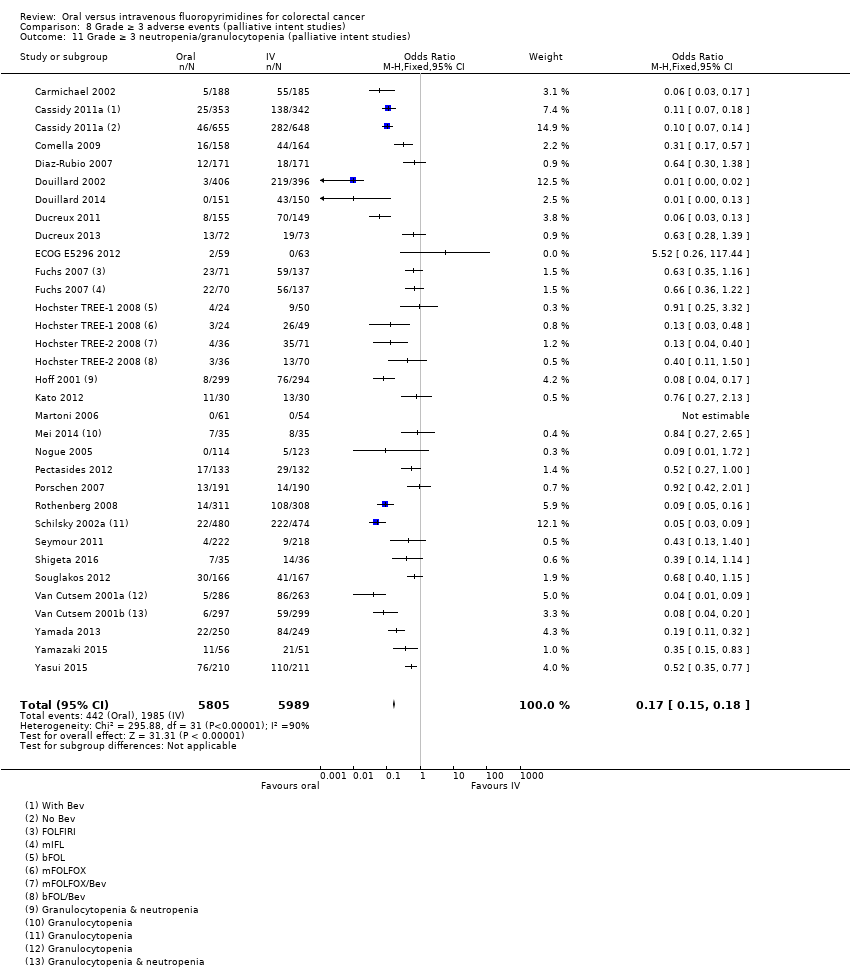
Comparison 8 Grade ≥ 3 adverse events (palliative intent studies), Outcome 11 Grade ≥ 3 neutropenia/granulocytopenia (palliative intent studies).
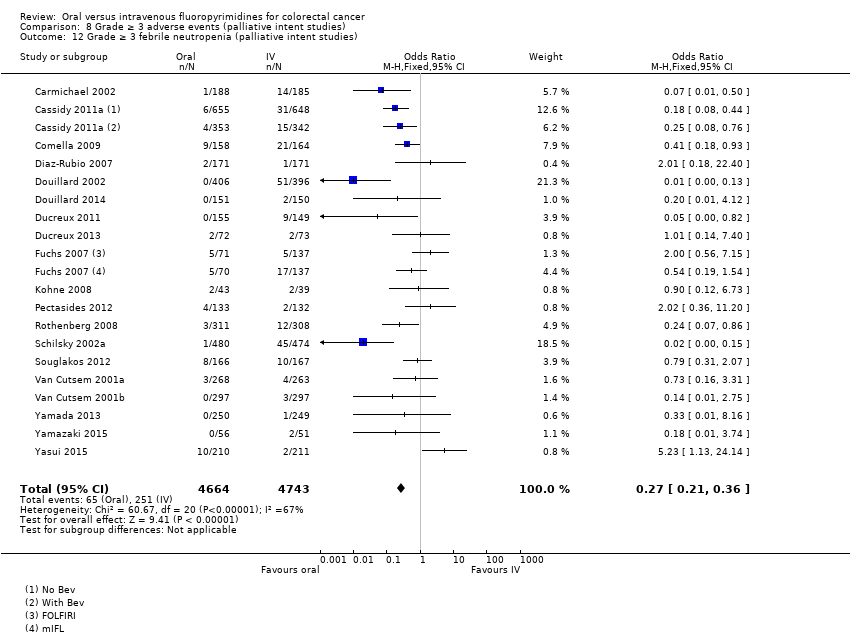
Comparison 8 Grade ≥ 3 adverse events (palliative intent studies), Outcome 12 Grade ≥ 3 febrile neutropenia (palliative intent studies).

Comparison 8 Grade ≥ 3 adverse events (palliative intent studies), Outcome 13 Grade ≥ 3 vomiting (palliative intent studies).
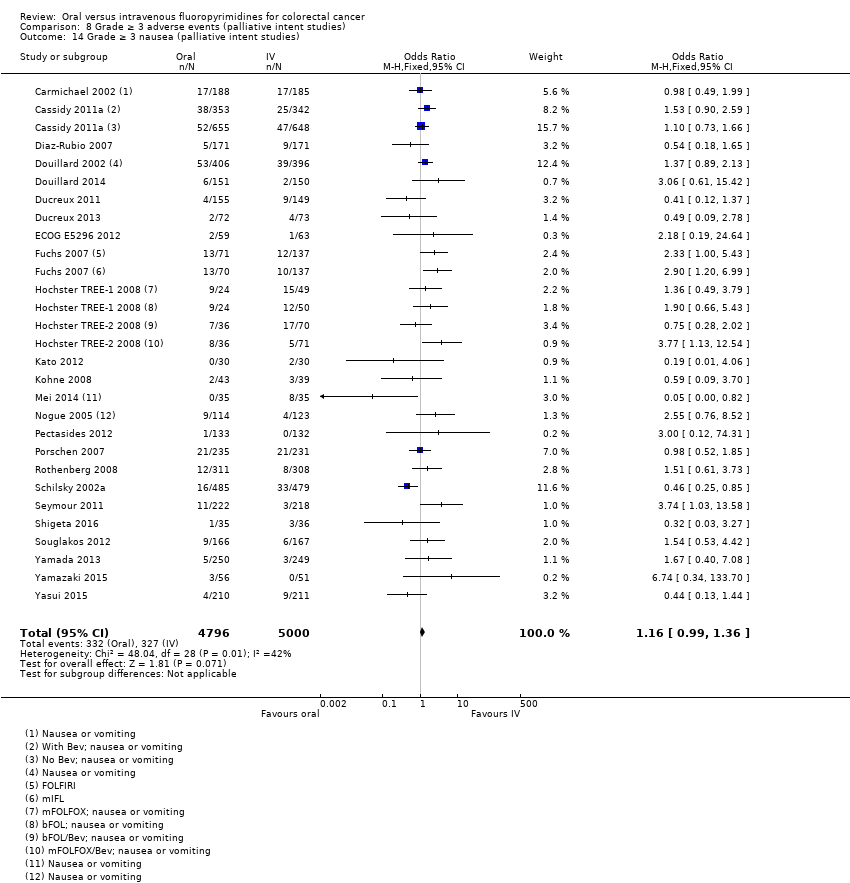
Comparison 8 Grade ≥ 3 adverse events (palliative intent studies), Outcome 14 Grade ≥ 3 nausea (palliative intent studies).
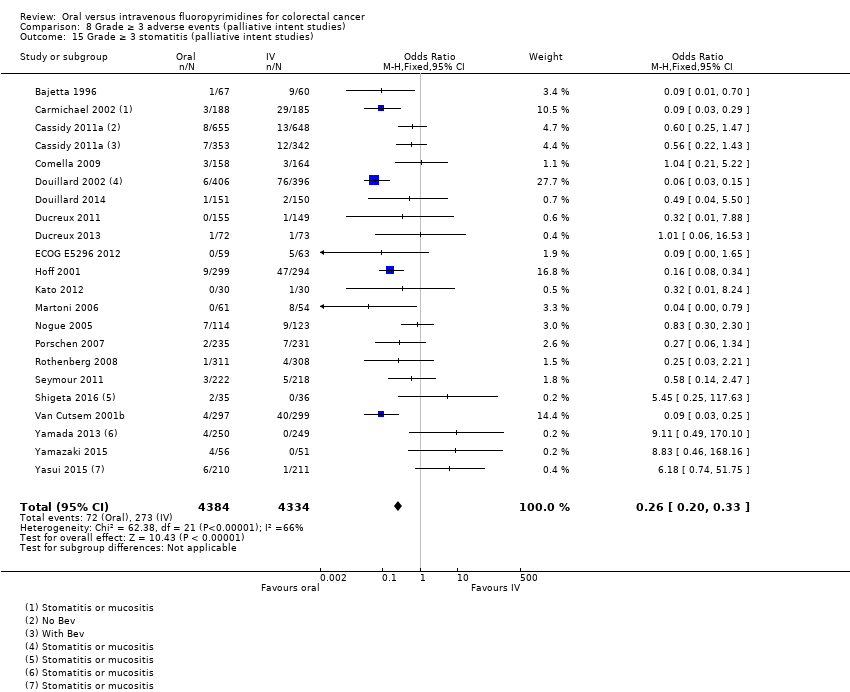
Comparison 8 Grade ≥ 3 adverse events (palliative intent studies), Outcome 15 Grade ≥ 3 stomatitis (palliative intent studies).
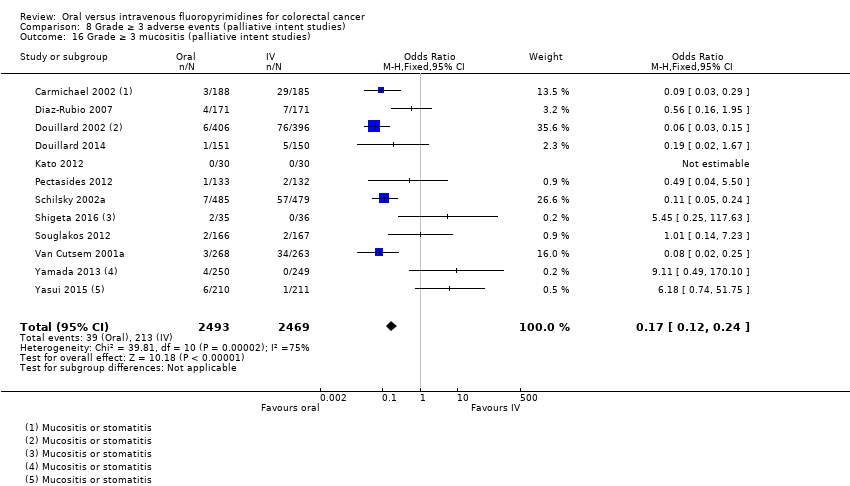
Comparison 8 Grade ≥ 3 adverse events (palliative intent studies), Outcome 16 Grade ≥ 3 mucositis (palliative intent studies).

Comparison 8 Grade ≥ 3 adverse events (palliative intent studies), Outcome 17 Grade ≥ 3 hyperbilirubinaemia (palliative intent studies).
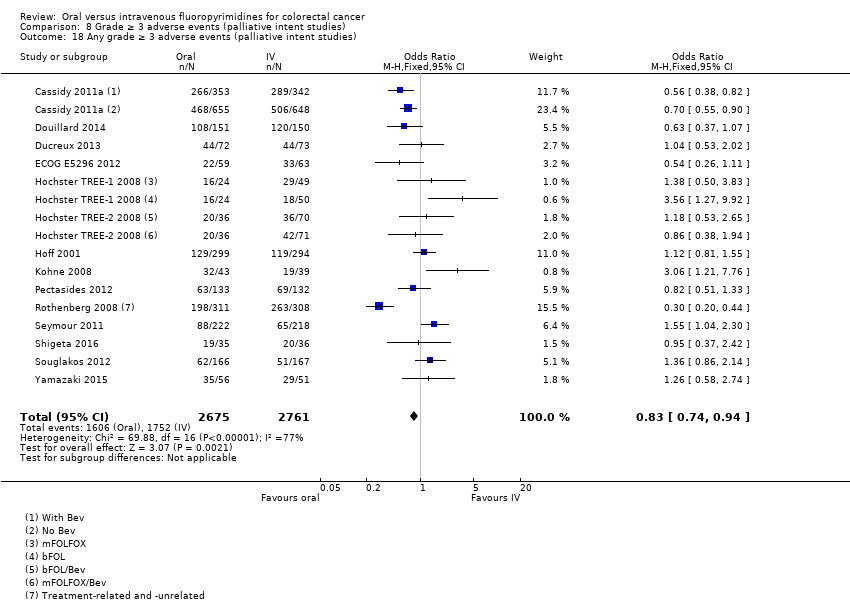
Comparison 8 Grade ≥ 3 adverse events (palliative intent studies), Outcome 18 Any grade ≥ 3 adverse events (palliative intent studies).
| Oral compared with intravenous fluoropyrimidines for colorectal cancer ‐ Patients treated with curative intent | |||||
| Patient or population: Patients treated with curative intent for colorectal cancer with neoadjuvant and/or adjuvant chemotherapy Setting: Hospital Intervention: Oral fluoropyrimidines Comparison: Intravenous fluoropyrimidines | |||||
| Outcomes | Illustrative comparative risks (95% CI) | Relative effect | No. of participants | Quality of the evidence | |
| Assumed risk* | Corresponding risk** | ||||
| Intravenous fluoropyrimidines | Oral fluoropyrimidines | ||||
| Disease‐free survival | 313 per 1000a | 291 per 1000 (272 to 313) | HR 0.93 | 8903 | ⊕⊕⊕⊝ |
| Overall survival | 222 per 1000c | 204 per 1000 (186 to 222) | HR 0.92 (0.84 to 1.00) | 8902 (7 RCTs) | ⊕⊕⊕⊕ |
| Grade ≥ 3 diarrhoea | 137 per 1000d | 153 per 1000 (135 to 171) | OR 1.12 | 9551 | ⊕⊝⊝⊝ |
| Grade ≥ 3 hand foot syndrome | 8 per 1000d | 37 per 1000 (24 to 57) | OR 4.59g | 5731 | ⊕⊕⊝⊝ |
| Grade ≥ 3 neutropenia/granulocytopenia | 181 per 1000d | 25 per 1000 (20 to 29) | OR 0.14 (0.11 to 0.16) | 8087 (7 RCTs) | ⊕⊕⊕⊝ |
| *The basis for the assumed risk is provided in footnotes. **The corresponding risk (and its 95% CI) is based on the assumed risk in the comparison group and the relative effect of the intervention (and its 95% CI). Pooled estimates from fixed‐effects meta‐analysis are reported in the table | |||||
| GRADE Working Group grades of evidence | |||||
| aThe assumed risk for disease‐free survival was based on the 3‐year disease‐free survival rate in the control group from studies in the meta‐analysis (68.7%) bDowngraded by one level owing to a high risk of bias in included studies. cThe assumed risk for overall survival was based on the 5‐year overall survival rate in the control group from studies in the meta‐analysis (77.8%) dThe assumed risk for each grade ≥ 3 AE was the mean risk in the control group from studies in the meta‐analysis eDowngraded by one level owing to inconsistency of results that was supported by non‐overlapping CIs, high I2 values, and statistically significant heterogeneity of effect estimates fDowngraded by one level owing to imprecision gRandom‐effects estimate, OR 2.36 (95% CI 0.52 to 10.74). Pooled effect estimate was sensitive to the meta‐analysis model used | |||||
| Oral compared with intravenous fluoropyrimidines for colorectal cancer ‐ Patients treated with palliative intent | |||||
| Patient or population: Patients treated with palliative intent for inoperable advanced or metastatic colorectal cancer with chemotherapy Setting: Hospital Intervention: Oral fluoropyrimidines Comparison: Intravenous fluoropyrimidines | |||||
| Outcomes | Illustrative comparative risks (95% CI) | Relative effect | No. of participants | Quality of the evidence | |
| Assumed risk* | Corresponding risk** | ||||
| Intravenous fluoropyrimidines | Oral fluoropyrimidines | ||||
| Progression‐free survival | 398 per 1000a | 422 per 1000 (406 to 442) | HR 1.06 | 9927 | ⊕⊕⊕⊝ |
| Overall survival | 336 per 1000c | 343 per 1000 (333 to 353) | HR 1.02 (0.99 to 1.05) | 12,079 (29 RCTs) | ⊕⊕⊕⊕ |
| Grade ≥ 3 diarrhoea | 120 per 1000d | 199 per 1000 (180 to 221) | OR 1.66 | 11,997 | ⊕⊕⊝⊝ |
| Grade ≥ 3 hand foot syndrome | 13 per 1000d | 51 per 1000 (37 to 71) | OR 3.92 | 6481 | ⊕⊕⊕⊝ |
| Grade ≥ 3 neutropenia/granulocytopenia | 331 per 1000d | 56 per 1000 (50 to 60) | OR 0.17 (0.15 to 0.18) | 11,794 (29 RCTs) | ⊕⊕⊝⊝ |
| *The basis for the assumed risk is provided in footnotes. **The corresponding risk (and its 95% CI) is based on the assumed risk in the comparison group and the relative effect of the intervention (and its 95% CI). Pooled estimates from fixed‐effects meta‐analysis are reported in the table | |||||
| GRADE Working Group grades of evidence | |||||
| aThe assumed risk for progression‐free survival was based on the 6‐month progression‐free survival rate in the control group from studies in the meta‐analysis (60.2%) bDowngraded by one level owing to a high risk of bias in included studies cThe assumed risk for overall survival was based on the 12‐month overall survival rate in the control group from studies in the meta‐analysis (66.4%) dThe assumed risk for each grade ≥ 3 AE was the mean risk in the control group from the studies in the meta‐analysis eDowngraded by one level owing to inconsistency of results that was supported by non‐overlapping CIs, high I2 values, and statistically significant heterogeneity of effect estimates | |||||
| Treatment setting | Study ID | Phase | Treatment type | Treatment arm/s (oral), n randomised | Treatment arm/s (IV), n randomised | IV arm: bolus vs Infusional |
| Neoadjuvant | Rectal | |||||
| III | Fluoropyrimidine combined with RT | Capecitabine (Grp 2), n = 146 Capecitabine (Grp 5), n = 326 Capecitabine + oxaliplatin (Grp 6), n = 330 | 5‐FU (Grp 1), n = 147 5‐FU (Grp 3), n = 330 5‐FU + oxaliplatin (Grp 4), n = 329 | Infusional | ||
| III | Fluoropyrimidine combined with RT | UFT (Tegafur/Uracil) + LV with RT, n = 78 | 5‐FU + LV with RT, n = 77 | Bolus | ||
| Neoadjuvant/ Adjuvant | Rectal | |||||
| III | Fluoropyrimidine combined with RT | Capecitabine with RT, n = 197 ∙ Adjuvant cohort: n = 116 ∙ Neoadjuvant cohort: n = 81 | 5‐FU with RT, n = 195 ∙ Adjuvant cohort: n = 115 ∙ Neoadjuvant cohort: n = 80 | Bolus and infusional | ||
| Adjuvant | Rectal | |||||
| ND | Fluoropyrimidine combined with RT (after completion of 2C of fluoropyrimidine alone) | 5‐dFUR + LV, n = 92 | 5‐FU + LV, n = 74 | Bolus | ||
| Colon | ||||||
| III | Combination chemotherapy ‐ Oxaliplatin + Bevacizumab (BEV) | BEV‐XELOX, n = 952 | BEV‐FOLFOX4, n = 960 | Infusional | ||
| III | Fluoropyrimidine alone | UFT + LV, n = 805 | 5‐FU + LV, n = 803 | Bolus | ||
| III | Fluoropyrimidine alone | UFT + LV, n = 551 | 5‐FU + LV, n = 550 | Bolus | ||
| III | Fluoropyrimidine alone | Capecitabine, n = 1004 | 5‐FU + LV, n = 983 | Bolus | ||
| Colorectal | ||||||
| III | Combination chemotherapy ‐ fluoropyrimidine + oxaliplatin | CAPOX (capecitabine + oxaliplatin), n = 197 | mFOLFOX6, n = 211 | Infusional | ||
| IV: intravenous RT: radiotherapy 5‐FU: 5‐fluorouracil UFT: tegafur/uracil LV: leucovorin ND: no data available 5‐dFUR: doxifluridine BEV: bevacizumab | ||||||
| Oral fluoropyrimidine backbone | Study ID | Phase | Treatment line | Treatment arm/s (Oral), n randomised | Treatment arm/s (IV), n randomised | IV arm: Bolus vs Infusional |
| Capecitabine | III | First | Capecitabine, n = 302 | 5‐FU + LV, n = 303 | Bolus | |
| III | First | Capecitabine, n = 301 | 5‐FU + LV, n = 301 | Bolus | ||
| Doxifluridine (5‐dFUR) | II | First | 5‐dFUR + LV, n = 38 | 5‐FU + LV, n = 39 | Bolus | |
| II | First | 5‐dFUR + LV, n = 67 | 5‐dFUR + LV, n = 63 | Bolus | ||
| Eniluracil + oral 5‐FU | III | First | Eniluracil/Oral 5‐FU, n = 61 | 5‐FU, n = 64 | Infusional | |
| III | First | Eniluracil/Oral 5‐FU, n = 488 | 5‐FU + LV, n = 493 | Bolus | ||
| III | First | Eniluracil/Oral 5‐FU, n = 268 | 5‐FU + LV, n = 263 | Bolus | ||
| Ftorafur/tegafur (FT) | ND | First | Ftorafur, n = 30 | 5‐FU, n = 30 | Bolus | |
| Unclear; described as Phase IV in abstracts | First | FT + LV, n = 114 | 5‐FU + LV, n = 123 | Bolus | ||
| Ftorafur + uracil (UFT) | III | First | UFT + LV, n = 190 | 5FU + LV, n = 190 | Bolus | |
| III | First | UFT + LV, n = 409 | 5‐FU + LV, n = 407 | Bolus | ||
| IV: intravenous 5‐FU: 5‐fluorouracil LV: leucovorin 5‐dFUR: doxifluridine ND: no data available FT: tegafur UFT: tegafur + uracil | ||||||
| Chemotherapy | Study ID | Phase | Study design ‐ other details | Treatment line | Treatment arm/s (Oral), n randomised | Treatment arm/s (IV), n randomised | IV arm: Bolus vs Infusional |
| Oxaliplatin | Combination with capecitabine | ||||||
| III | 2 × 2 factorial ‐ following protocol amendment | First | XELOX alone, n = 317 | FOLFOX‐4 alone, n = 317 | Infusional | ||
| XELOX + Placebo, n = 350 | FOLFOX‐4 + Placebo, n = 351 | Infusional | |||||
| XELOX + BEV, n = 350 | FOLFOX‐4 + BEV, n = 350 | Infusional | |||||
| III | First | OXXEL (Capecitabine + oxaliplatin), n = 158 | OXAFAFU (5‐FU/LV + Oxaliplatin), n = 164 | Bolus | |||
| III | First | XELOX, n = 174 | FUOX (5‐FU + Oxaliplatin), n = 174 | Infusional | |||
| III | First | XELOX, n = 156 | FOLFOX‐6, n = 150 | Infusional | |||
| ND | First | CapeOx, n = 50 | mFOLFOX6, n = 50 | Infusional | |||
| bFOL, n = 50 | Bolus | ||||||
| ND | First | CapeOx + BEV, n = 74 | mFOLFOX6 + BEV, n = 75 | Infusional | |||
| bFOL + BEV, n = 74 | Bolus | ||||||
| II | First | XELOX, n = 62 | pviFOX, n = 56 | Infusional | |||
| III | First | CAPOX, n = 242 | FUFOX, n = 234 | Infusional | |||
| III | Second | XELOX, n = 313 | FOLFOX‐4, n = 314 | Infusional | |||
| ND | 2 × 2 factorial, cross‐over (only from no oxaliplatin to oxaliplatin) | First | Capecitabine or OxCap, n = 229 ∙ Capecitabine, n = 115 ∙ OxCap, n = 114 | 5‐FU or OxFU, n = 230 ∙ 5‐FU, n = 115 ∙ OxFU, n = 115 | Infusional | ||
| Combination with Ftorafur/uracil (UFT) | |||||||
| II | First | UFOX + Cetuximab, n = 152 | FOLFOX4 + Cetuximab, n = 150 | Infusional | |||
| Combination with S‐1 | |||||||
| ND | First | SOX, n = 35 | FOLFOX4, n = 35 | Infusional | |||
| III | First | SOX‐BEV, n = 256 | mFOLFOX6‐BEV, n = 256 | Infusional | |||
| II | First | SOL (S‐1 + oxaliplatin + oral LV), n = 56 | mFOLFOX6, n = 51 | Infusional | |||
| Irinotecan | Combination with capecitabine | ||||||
| II | First | XELIRI + BEV, n = 72 | FOLFIRI + BEV, n = 73 | Infusional | |||
| III | 3 × 2 factorial (Period 1) | First | CapeIRI + Celecoxib/Placebo, n = 145 | FOLFIRI + Celecoxib/Placebo, n = 144 | Infusional | ||
| mIFL + Celecoxib/Placebo, n = 141 | Bolus | ||||||
| III | 2 × 2 factorial | First | CAPIRI + Celecoxib/Placebo, n = 44 | FOLFIRI + Celecoxib/Placebo, n = 41 | Infusional | ||
| III | First | XELIRI + BEV, n = 143 | FOLFIRI + BEV, n = 142 | Infusional | |||
| II | First | XELIRI, n = ND | FOLFIRI, n = ND | Infusional | |||
| II | First | CAPIRI + BEV, n = 168 | FOLFIRI + BEV, n = 168 | Infusional | |||
| ND | First and second | Capecitabine + Irinotecan, n = 27 | 5‐FU + Irinotecan, n = 16 | Infusional | |||
| Combination with Ftorafur/uracil (UFT) | |||||||
| II | First | TEGAFIRI (UFT, leucovorin, irinotecan) ± BEV, n = 35 | FOLFIRI ± BEV, n = 36 | Infusional | |||
| Combination with S‐1 | |||||||
| II | First and second | Sequential IRIS‐BEV, n = 30 | mFOLFIRI‐BEV, n = 30 | Infusional | |||
| II/III | Second | IRIS (Irinotecan + S‐1), n = 213 | FOLFIRI, n = 213 | Infusional | |||
| IV: intravenous BEV: bevacizumab ND: no data available UFT: tegafur/uracil | |||||||
| Setting | Related | Related and unrelated | Not specified |
| Patients treated with curative intent for CRC with neoadjuvant and/or adjuvant chemotherapy | |||
| Patients treated with palliative intent for inoperable advanced or metastatic CRC with chemotherapy
|
| ||
| CRC: colorectal cancer | |||
| Study ID | Outcome | |||||||||||
| Efficacy | Grade ≥ 3 AE | |||||||||||
| DFS | OS | Diarrhoea | HFS | Neutropenia/ granulocytopenia | Febrile neutropenia | Vomiting | Nausea | Stomatitis | Mucositis | Hyperbilirubinemia | Any | |
| X | X | X | X | X | X | X | X | X | X | X | ||
| X | X | X | X | X | X | X | X | |||||
| Oa | Oa | X | Ob | X | X | X | Xc | Xc | ||||
| X | X | X | X | X | X | X | X | X | X | |||
| X | X | |||||||||||
| X | X | X | X | X | X | X | X | |||||
| X | X | X | X | X | X | X | X | X | ||||
| X | X | X | X | X | X | X | X | X | ||||
| X | X | X | Ob | X | Xd | Xd | X | Oe | X | |||
| X: Study contributed to the pooled effect estimate for the outcome O: Study reported the outcome but did not contribute to the pooled effect estimate for the outcome aInsufficient follow‐up time ‐ median 22 months in each arm (< 3 years) bAssessed grade ≥ 3 HFS using criteria not considered to be sufficiently similar to National Cancer Institute Common Terminology Criteria for Adverse Events (NCI CTCAE) (versions 2.0 to 4.0) cReported combined data for grade ≥ 3 stomatitis and mucositis dReported combined data for grade ≥ 3 vomiting and nausea eAssessed grade 3 ≥ hyperbilirubinaemia using criteria not considered to be sufficiently similar to NCI CTCAE (versions 2.0 to 4.0 and 1981) and World Health Organisation (WHO) (1981 version) AE: adverse event DFS: disease‐free survival OS: overall survival HFS: hand foot syndrome | ||||||||||||
| Study ID | Outcome | |||||||||||||
| Efficacy | Grade ≥ 3 AE | |||||||||||||
| PFS | TTP | OS | ORR | Diarrhoea | HFS | Neutropenia/ granulocytopenia | Febrile neutropenia | Vomiting | Nausea | Stomatitis | Mucositis | Hyperbilirubinemia | Any | |
| X | X | X | Oa | Oa | Oa | Oa | ||||||||
| Ob | X | |||||||||||||
| X | X | X | X | X | ||||||||||
| X | X | X | X | X | X | Xc | Xc | Xd | Xd | Oe | ||||
| X | X | X | X | X | X | X | Xc | Xc | X | X | ||||
| X | X | X | X | X | X | X | ||||||||
| X | X | X | X | X | X | X | X | X | X | X | ||||
| X | X | X | X | Of | X | X | Xc | Xc | Xd | Xd | Oe | |||
| X | X | X | X | X | X | X | X | X | X | X | X | X | ||
| X | X | X | X | X | X | X | X | X | X | |||||
| X | X | X | X | X | X | X | X | X | X | X | ||||
| X | X | X | X | X | X | X | X | X | X | X | ||||
| X | X | X | X | X | X | X | X | X | ||||||
| Ob | X | X | X | X | X | Xc | Xc | X | ||||||
| Ob | X | X | X | X | X | Xc | Xc | X | ||||||
| X | X | X | X | Og | X | X | X | X | X | |||||
| X | X | X | X | X | X | X | X | X | ||||||
| X | X | X | X | X | X | X | X | X | ||||||
| X | X | X | X | X | X | X | ||||||||
| Oh | X | X | Xc | Xc | ||||||||||
| X | X | X | X | X | Xc | Xc | X | |||||||
| X | X | X | X | X | X | X | X | X | X | X | ||||
| X | X | X | X | X | X | X | X | |||||||
| X | X | X | X | X | X | X | X | X | X | Oi | X | |||
| X | X | X | X | Og | X | X | X | X | X | |||||
| X | X | Oj | X | X | X | X | X | X | X | |||||
| X | X | X | X | X | X | X | X | Xd | Xd | X | X | |||
| Ob | Oa | Oa | Oa | |||||||||||
| X | X | X | X | X | X | X | X | X | X | |||||
| X | X | X | X | X | X | X | ||||||||
| X | X | X | X | Og | X | X | X | X | ||||||
| X | X | X | X | X | X | X | X | X | Xd | Xd | X | |||
| X | X | X | X | X | X | X | X | X | ||||||
| X | X | X | X | X | X | X | Xd | Xd | ||||||
| Ob | Ob | X | Oa | Oa | Oa | Oa | Oa | |||||||
| X: Study contributed to the pooled effect estimate for the outcome O: Study reported the outcome but did not contribute to the pooled effect estimate for the outcome aUnclear number of participants assessed for outcomes in both arms bHazard ratios could not be estimated either directly or indirectly from the provided information cReported combined data for grade ≥3 vomiting and nausea dReported combined data for grade ≥3 stomatitis and mucositis eAssessed grade ≥ 3 hyperbilirubinaemia using Common Toxicity Criteria (CTC), version not specified fAssessed grade ≥ 3 HFS using CTC, version not specified gAssessed grade ≥ 3 HFS using criteria not considered to be sufficiently similar to National Cancer Institute Common Terminology Criteria for Adverse Events (NCI CTCAE) (versions 2.0 to 4.0) hORR reported after 2 cycles of chemotherapy iAssessed grade ≥3 hyperbilirubinaemia using criteria not considered to be sufficiently similar to NCI CTCAE (versions 2.0 to 4.0 and 1981) and World Health Organisation (WHO) (1981 version) jORR reported 12 to 14 weeks after start of treatment AE: adverse event PFS: progression‐free survival TTP: time to progression OS: overall survival ORR: objective response rate HFS: hand foot syndrome | ||||||||||||||
| Risk of bias assessment | ||
| Low | Unclear | High |
| No studies | No studies | |
| Risk of bias assessment | ||
| Low | Unclear | High |
| Sensitivity analyses for PFS outcome | Original analysis: (effect estimatea, fixed | Sensitivity analysis: (effect estimatea, fixed |
| Excluding studies with 'High' risk of bias | 1.06 (1.02 to 1.11) | 1.01 (95% CI 0.96 to 1.07) |
| Excluding Seymour 2011 study (frail and elderly study population) | 1.06 (1.02 to 1.11) | 1.07 (1.03 to 1.11) |
| Excluding second‐line studies in patients treated with palliative intent for inoperable or metastatic colorectal cancerb | 1.06 (1.02 to 1.11) | 1.07 (1.03 to 1.12) |
| aEffect estimates presented as inverse‐variance hazard ratios for time‐to‐event outcomes, and Mantel‐Haenszel odds ratios for adverse events bAnalysis excluding Kato 2012, Rothenberg 2008, Yasui 2015, and Yu 2005. Kato 2012 and Yu 2005 included patients receiving first‐ or second‐line treatment PFS: progression‐free survival CI: confidence interval | ||
| Outcome or subgroup title | No. of studies | No. of participants | Statistical method | Effect size |
| 1 Disease‐free survival Show forest plot | 7 | 8903 | Hazard Ratio (Fixed, 95% CI) | 0.93 [0.87, 1.00] |
| 2 Disease‐free survival with subgroup analysis ‐ Chemotherapy vs chemo‐radiotherapy Show forest plot | 7 | 8903 | Hazard Ratio (Fixed, 95% CI) | 0.93 [0.87, 1.00] |
| 2.1 Chemotherapy | 5 | 6944 | Hazard Ratio (Fixed, 95% CI) | 0.94 [0.87, 1.02] |
| 2.2 Chemo‐radiotherapy | 2 | 1959 | Hazard Ratio (Fixed, 95% CI) | 0.91 [0.78, 1.05] |
| 3 Disease‐free survival with subgroup analysis ‐ Infusional vs bolus intravenous fluoropyrimidine Show forest plot | 6 | 8511 | Hazard Ratio (Fixed, 95% CI) | 0.95 [0.88, 1.02] |
| 3.1 Infusional intravenous fluoropyrimidine | 3 | 3881 | Hazard Ratio (Fixed, 95% CI) | 0.96 [0.85, 1.08] |
| 3.2 Bolus intravenous fluoropyrimidine | 3 | 4630 | Hazard Ratio (Fixed, 95% CI) | 0.94 [0.86, 1.04] |
| 4 Disease‐free survival with subgroup analysis ‐ Oral fluoropyrimidine backbone Show forest plot | 7 | 8903 | Hazard Ratio (Fixed, 95% CI) | 0.93 [0.87, 1.00] |
| 4.1 Capecitabine | 5 | 6260 | Hazard Ratio (Fixed, 95% CI) | 0.91 [0.83, 0.99] |
| 4.2 UFT/Ftorafur | 2 | 2643 | Hazard Ratio (Fixed, 95% CI) | 1.01 [0.88, 1.15] |
| Outcome or subgroup title | No. of studies | No. of participants | Statistical method | Effect size |
| 1 Overall survival (curative intent studies) Show forest plot | 7 | 8902 | Hazard Ratio (Fixed, 95% CI) | 0.92 [0.84, 1.00] |
| 2 Overall survival (curative intent studies) with subgroup analysis ‐ Chemotherapy vs chemo‐radiotherapy Show forest plot | 7 | 8902 | Hazard Ratio (Fixed, 95% CI) | 0.92 [0.84, 1.00] |
| 2.1 Chemotherapy | 5 | 6943 | Hazard Ratio (Fixed, 95% CI) | 0.93 [0.84, 1.03] |
| 2.2 Chemotherapy with radiotherapy | 2 | 1959 | Hazard Ratio (Fixed, 95% CI) | 0.86 [0.70, 1.06] |
| 3 Overall survival (curative intent studies) with subgroup analysis ‐ Infusional vs bolus intravenous fluoropyrimidine Show forest plot | 6 | 8510 | Hazard Ratio (Fixed, 95% CI) | 0.93 [0.85, 1.02] |
| 3.1 Infusional intravenous fluoropyrimidine | 3 | 3880 | Hazard Ratio (Fixed, 95% CI) | 0.94 [0.80, 1.09] |
| 3.2 Bolus intravenous fluoropyrimidine | 3 | 4630 | Hazard Ratio (Fixed, 95% CI) | 0.93 [0.83, 1.05] |
| 4 Overall survival (curative intent studies) with subgroup analysis ‐ Oral fluoropyrimidine backbone Show forest plot | 7 | 8902 | Hazard Ratio (Fixed, 95% CI) | 0.92 [0.84, 1.00] |
| 4.1 Capecitabine | 5 | 6259 | Hazard Ratio (Fixed, 95% CI) | 0.88 [0.79, 0.98] |
| 4.2 UFT/Ftorafur | 2 | 2643 | Hazard Ratio (Fixed, 95% CI) | 1.03 [0.86, 1.22] |
| Outcome or subgroup title | No. of studies | No. of participants | Statistical method | Effect size |
| 1 Grade ≥ 3 diarrhoea (curative intent studies) Show forest plot | 9 | 9551 | Odds Ratio (M‐H, Fixed, 95% CI) | 1.12 [0.99, 1.25] |
| 2 Grade ≥ 3 diarrhoea (curative intent studies) with subgroup analysis ‐ Chemotherapy vs chemo‐radiotherapy Show forest plot | 9 | 9551 | Odds Ratio (M‐H, Fixed, 95% CI) | 1.12 [0.99, 1.25] |
| 2.1 Chemotherapy | 5 | 7274 | Odds Ratio (M‐H, Fixed, 95% CI) | 1.08 [0.95, 1.23] |
| 2.2 Chemo‐radiotherapy | 4 | 2277 | Odds Ratio (M‐H, Fixed, 95% CI) | 1.28 [0.98, 1.66] |
| 3 Grade ≥ 3 diarrhoea (curative intent studies) with subgroup analysis ‐ Infusional vs bolus intravenous fluoropyrimidine Show forest plot | 8 | 9159 | Odds Ratio (M‐H, Fixed, 95% CI) | 1.09 [0.97, 1.23] |
| 3.1 Infusional intravenous fluoropyrimidine | 3 | 4255 | Odds Ratio (M‐H, Fixed, 95% CI) | 1.27 [1.06, 1.53] |
| 3.2 Bolus intravenous fluoropyrimidine | 5 | 4904 | Odds Ratio (M‐H, Fixed, 95% CI) | 0.98 [0.84, 1.14] |
| 4 Grade ≥ 3 diarrhoea (curative intent studies) with subgroup analysis ‐ Oral fluoropyrimidine backbone Show forest plot | 9 | 9551 | Odds Ratio (M‐H, Fixed, 95% CI) | 1.12 [0.99, 1.25] |
| 4.1 Capecitabine | 5 | 6616 | Odds Ratio (M‐H, Fixed, 95% CI) | 1.15 [0.99, 1.33] |
| 4.2 UFT/Ftorafur | 3 | 2769 | Odds Ratio (M‐H, Fixed, 95% CI) | 1.00 [0.83, 1.21] |
| 4.3 Doxifluridine | 1 | 166 | Odds Ratio (M‐H, Fixed, 95% CI) | 32.14 [1.89, 545.41] |
| 5 Grade ≥ 3 hand foot syndrome (curative intent studies) Show forest plot | 5 | 5731 | Odds Ratio (M‐H, Fixed, 95% CI) | 4.59 [2.97, 7.10] |
| 6 Grade ≥ 3 neutropenia/granulocytopenia (curative intent studies) Show forest plot | 7 | 8707 | Odds Ratio (M‐H, Fixed, 95% CI) | 0.14 [0.11, 0.16] |
| 7 Grade ≥ 3 febrile neutropenia (curative intent studies) Show forest plot | 4 | 2925 | Odds Ratio (M‐H, Fixed, 95% CI) | 0.59 [0.18, 1.90] |
| 8 Grade ≥ 3 vomiting (curative intent studies) Show forest plot | 8 | 9385 | Odds Ratio (M‐H, Fixed, 95% CI) | 1.05 [0.83, 1.34] |
| 9 Grade ≥ 3 nausea (curative intent studies) Show forest plot | 7 | 9233 | Odds Ratio (M‐H, Fixed, 95% CI) | 1.21 [0.97, 1.51] |
| 10 Grade ≥ 3 stomatitis (curative intent studies) Show forest plot | 5 | 4212 | Odds Ratio (M‐H, Fixed, 95% CI) | 0.21 [0.14, 0.30] |
| 11 Grade ≥ 3 mucositis (curative intent studies) Show forest plot | 4 | 2233 | Odds Ratio (M‐H, Fixed, 95% CI) | 0.64 [0.25, 1.62] |
| 12 Grade ≥ 3 hyperbilirubinaemia (curative intent studies) Show forest plot | 3 | 2757 | Odds Ratio (M‐H, Fixed, 95% CI) | 1.67 [0.52, 5.38] |
| 13 Any grade ≥ 3 adverse events (curative intent studies) Show forest plot | 5 | 7741 | Odds Ratio (M‐H, Fixed, 95% CI) | 0.82 [0.74, 0.90] |
| Outcome or subgroup title | No. of studies | No. of participants | Statistical method | Effect size |
| 1 Progression‐free survival Show forest plot | 23 | 9927 | Hazard Ratio (Fixed, 95% CI) | 1.06 [1.02, 1.11] |
| 2 Progression‐free survival with subgroup analysis ‐ Single‐agent vs combination therapy Show forest plot | 22 | 9468 | Hazard Ratio (Fixed, 95% CI) | 1.07 [1.03, 1.11] |
| 2.1 Single agent | 6 | 2955 | Hazard Ratio (Fixed, 95% CI) | 1.12 [1.04, 1.21] |
| 2.2 Combination therapy | 16 | 6513 | Hazard Ratio (Fixed, 95% CI) | 1.05 [1.00, 1.10] |
| 3 Progression‐free survival with subgroup analysis ‐ Infusional vs bolus intravenous fluoropyrimidine Show forest plot | 23 | 9927 | Hazard Ratio (Fixed, 95% CI) | 1.06 [1.02, 1.11] |
| 3.1 Infusional intravenous fluoropyrimidine | 17 | 6560 | Hazard Ratio (Fixed, 95% CI) | 1.05 [1.00, 1.10] |
| 3.2 Bolus intravenous fluoropyrimidine | 7 | 3367 | Hazard Ratio (Fixed, 95% CI) | 1.10 [1.03, 1.19] |
| 4 Progression‐free survival with subgroup analysis ‐ Oral fluoropyrimidine backbone Show forest plot | 23 | 9927 | Hazard Ratio (Fixed, 95% CI) | 1.06 [1.02, 1.11] |
| 4.1 Capecitabine | 13 | 6703 | Hazard Ratio (Fixed, 95% CI) | 1.03 [0.98, 1.08] |
| 4.2 UFT/Ftorafur | 2 | 374 | Hazard Ratio (Fixed, 95% CI) | 1.36 [1.07, 1.73] |
| 4.3 Eniluracil + oral 5‐FU | 3 | 1618 | Hazard Ratio (Fixed, 95% CI) | 1.22 [1.10, 1.36] |
| 4.4 Doxifluridine | 1 | 130 | Hazard Ratio (Fixed, 95% CI) | 1.18 [0.79, 1.74] |
| 4.5 S‐1 | 4 | 1102 | Hazard Ratio (Fixed, 95% CI) | 1.02 [0.89, 1.16] |
| 5 Progression‐free survival for combination therapy with subgroup analysis ‐ Oxaliplatin‐based vs irinotecan‐based Show forest plot | 16 | 6513 | Hazard Ratio (Fixed, 95% CI) | 1.05 [1.00, 1.10] |
| 5.1 Oxaliplatin‐based | 8 | 4677 | Hazard Ratio (Fixed, 95% CI) | 1.06 [0.99, 1.13] |
| 5.2 Irinotecan‐based | 8 | 1836 | Hazard Ratio (Fixed, 95% CI) | 1.04 [0.97, 1.11] |
| 6 Progression‐free survival for combination therapy with subgroup analysis ‐ with Bev vs no Bev Show forest plot | 14 | 6139 | Hazard Ratio (Fixed, 95% CI) | 1.03 [0.98, 1.08] |
| 6.1 With Bevacizumab | 6 | 2033 | Hazard Ratio (Fixed, 95% CI) | 1.00 [0.94, 1.07] |
| 6.2 No Bevacizumab | 9 | 4106 | Hazard Ratio (Fixed, 95% CI) | 1.06 [0.99, 1.13] |
| Outcome or subgroup title | No. of studies | No. of participants | Statistical method | Effect size |
| 1 Overall survival (palliative intent studies) Show forest plot | 29 | 12079 | Hazard Ratio (Fixed, 95% CI) | 1.02 [0.99, 1.05] |
| 2 Overall survival (palliative intent studies) with subgroup analysis ‐ Single‐agent vs combination therapy Show forest plot | 28 | 11620 | Hazard Ratio (Fixed, 95% CI) | 1.02 [0.99, 1.05] |
| 2.1 Single agent | 10 | 4465 | Hazard Ratio (Fixed, 95% CI) | 1.02 [0.99, 1.07] |
| 2.2 Combination therapy | 18 | 7155 | Hazard Ratio (Fixed, 95% CI) | 1.00 [0.95, 1.06] |
| 3 Overall survival (palliative intent studies) with subgroup analysis ‐ Infusional vs bolus intravenous fluoropyrimidine Show forest plot | 29 | 12079 | Hazard Ratio (Fixed, 95% CI) | 1.02 [0.99, 1.05] |
| 3.1 Infusional intravenous fluoropyrimidine | 19 | 7022 | Hazard Ratio (Fixed, 95% CI) | 1.01 [0.96, 1.06] |
| 3.2 Bolus intravenous fluoropyrimidine | 13 | 5057 | Hazard Ratio (Fixed, 95% CI) | 1.02 [0.98, 1.06] |
| 4 Overall survival (palliative intent studies) with subgroup analysis ‐ Oral fluoropyrimidine backbone Show forest plot | 29 | 12079 | Hazard Ratio (Fixed, 95% CI) | 1.02 [0.99, 1.05] |
| 4.1 Capecitabine | 16 | 7405 | Hazard Ratio (Fixed, 95% CI) | 0.99 [0.95, 1.04] |
| 4.2 UFT/Ftorafur | 5 | 1807 | Hazard Ratio (Fixed, 95% CI) | 1.02 [0.97, 1.06] |
| 4.3 Eniluracil + oral 5‐FU | 3 | 1618 | Hazard Ratio (Fixed, 95% CI) | 1.20 [1.07, 1.36] |
| 4.4 Doxifluridine | 2 | 207 | Hazard Ratio (Fixed, 95% CI) | 0.99 [0.65, 1.50] |
| 4.5 S‐1 | 3 | 1042 | Hazard Ratio (Fixed, 95% CI) | 0.95 [0.81, 1.11] |
| 5 Overall survival (palliative intent studies) for combination therapy with subgroup analysis ‐ Oxaliplatin‐based vs irinotecan‐based Show forest plot | 18 | 7155 | Hazard Ratio (Fixed, 95% CI) | 1.00 [0.95, 1.06] |
| 5.1 Oxaliplatin‐based | 11 | 5379 | Hazard Ratio (Fixed, 95% CI) | 1.00 [0.94, 1.07] |
| 5.2 Irinotecan‐based | 7 | 1776 | Hazard Ratio (Fixed, 95% CI) | 1.01 [0.92, 1.10] |
| Outcome or subgroup title | No. of studies | No. of participants | Statistical method | Effect size |
| 1 Time to progression Show forest plot | 6 | 1970 | Hazard Ratio (Fixed, 95% CI) | 1.07 [1.01, 1.14] |
| Outcome or subgroup title | No. of studies | No. of participants | Statistical method | Effect size |
| 1 ORR Show forest plot | 32 | 11115 | Odds Ratio (M‐H, Fixed, 95% CI) | 0.98 [0.90, 1.06] |
| Outcome or subgroup title | No. of studies | No. of participants | Statistical method | Effect size |
| 1 Grade ≥ 3 diarrhoea (palliative intent studies) Show forest plot | 30 | 11997 | Odds Ratio (M‐H, Fixed, 95% CI) | 1.66 [1.50, 1.84] |
| 2 Grade ≥ 3 diarrhoea (palliative intent studies) with subgroup analysis ‐ Single‐agent vs combination therapy Show forest plot | 30 | 11997 | Odds Ratio (M‐H, Fixed, 95% CI) | 1.66 [1.50, 1.84] |
| 2.1 Single agent | 10 | 4566 | Odds Ratio (M‐H, Fixed, 95% CI) | 1.22 [1.04, 1.44] |
| 2.2 Combination therapy | 21 | 7431 | Odds Ratio (M‐H, Fixed, 95% CI) | 2.03 [1.77, 2.32] |
| 3 Grade ≥ 3 diarrhea (palliative intent studies) with subgroup analysis ‐ Infusional vs bolus intravenous fluoropyrimidine Show forest plot | 30 | 11997 | Odds Ratio (M‐H, Fixed, 95% CI) | 1.66 [1.50, 1.84] |
| 3.1 Infusional intravenous fluoropyrimidine | 21 | 7065 | Odds Ratio (M‐H, Fixed, 95% CI) | 2.00 [1.74, 2.30] |
| 3.2 Bolus intravenous fluoropyrimidine | 12 | 4932 | Odds Ratio (M‐H, Fixed, 95% CI) | 1.31 [1.12, 1.53] |
| 4 Grade ≥ 3 diarrhoea (palliative intent studies) with subgroup analysis ‐ Oral fluoropyrimidine backbone Show forest plot | 30 | 11997 | Odds Ratio (M‐H, Fixed, 95% CI) | 1.66 [1.50, 1.84] |
| 4.1 Capecitabine | 17 | 7382 | Odds Ratio (M‐H, Fixed, 95% CI) | 1.76 [1.54, 2.00] |
| 4.2 UFT/Ftorafur | 5 | 1784 | Odds Ratio (M‐H, Fixed, 95% CI) | 1.60 [1.24, 2.06] |
| 4.3 Eniluracil + oral 5‐FU | 3 | 1617 | Odds Ratio (M‐H, Fixed, 95% CI) | 1.04 [0.79, 1.38] |
| 4.4 Doxifluridine | 1 | 127 | Odds Ratio (M‐H, Fixed, 95% CI) | 1.51 [0.64, 3.56] |
| 4.5 S‐1 | 4 | 1087 | Odds Ratio (M‐H, Fixed, 95% CI) | 3.55 [2.19, 5.76] |
| 5 Grade ≥ 3 diarrhoea (palliative intent studies) with subgroup analysis for combination therapy ‐ Oxaliplatin‐based vs irinotecan‐based Show forest plot | 20 | 7212 | Odds Ratio (M‐H, Fixed, 95% CI) | 2.00 [1.75, 2.29] |
| 5.1 Oxaliplatin‐based | 12 | 5420 | Odds Ratio (M‐H, Fixed, 95% CI) | 1.73 [1.48, 2.02] |
| 5.2 Irinotecan‐based | 8 | 1792 | Odds Ratio (M‐H, Fixed, 95% CI) | 3.05 [2.33, 3.99] |
| 6 Grade ≥ 3 hand foot syndrome (palliative intent studies) Show forest plot | 18 | 6481 | Odds Ratio (M‐H, Fixed, 95% CI) | 3.92 [2.84, 5.43] |
| 7 Grade ≥ 3 hand foot syndrome (palliative intent studies) with subgroup analysis ‐ Single‐agent vs combination therapy Show forest plot | 18 | 6481 | Odds Ratio (M‐H, Fixed, 95% CI) | 3.89 [2.82, 5.37] |
| 7.1 Single agent | 2 | 343 | Odds Ratio (M‐H, Fixed, 95% CI) | 1.11 [0.48, 2.56] |
| 7.2 Combination therapy | 17 | 6138 | Odds Ratio (M‐H, Fixed, 95% CI) | 4.76 [3.32, 6.82] |
| 8 Grade ≥ 3 hand foot syndrome (palliative intent studies) with subgroup analysis ‐ Infusional vs bolus intravenous fluoropyrimidine Show forest plot | 18 | 6481 | Odds Ratio (M‐H, Fixed, 95% CI) | 3.92 [2.84, 5.43] |
| 8.1 Infusional intravenous fluoropyrimidine | 18 | 6094 | Odds Ratio (M‐H, Fixed, 95% CI) | 3.53 [2.53, 4.94] |
| 8.2 Bolus intravenous fluoropyrimidine | 3 | 387 | Odds Ratio (M‐H, Fixed, 95% CI) | 18.68 [4.15, 84.10] |
| 9 Grade ≥ 3 hand foot syndrome (palliative intent studies) with subgroup analysis ‐ Oral fluoropyrimidine backbone Show forest plot | 18 | 6481 | Odds Ratio (M‐H, Fixed, 95% CI) | 3.92 [2.84, 5.43] |
| 9.1 Capecitabine | 13 | 5418 | Odds Ratio (M‐H, Fixed, 95% CI) | 5.86 [4.01, 8.58] |
| 9.2 UFT/Ftorafur | 2 | 372 | Odds Ratio (M‐H, Fixed, 95% CI) | 0.49 [0.04, 5.50] |
| 9.3 Eniluracil + oral 5‐FU | 1 | 122 | Odds Ratio (M‐H, Fixed, 95% CI) | 0.04 [0.00, 0.75] |
| 9.4 S‐1 | 2 | 569 | Odds Ratio (M‐H, Fixed, 95% CI) | 0.66 [0.11, 4.00] |
| 10 Grade ≥ 3 hand foot syndrome (palliative intent studies) with subgroup analysis for combination therapy ‐ Oxaliplatin‐based vs irinotecan‐based Show forest plot | 16 | 5919 | Odds Ratio (M‐H, Fixed, 95% CI) | 4.76 [3.31, 6.83] |
| 10.1 Oxaliplatin‐based | 10 | 4608 | Odds Ratio (M‐H, Fixed, 95% CI) | 4.52 [3.03, 6.75] |
| 10.2 Irinotecan‐based | 6 | 1311 | Odds Ratio (M‐H, Fixed, 95% CI) | 5.93 [2.52, 13.97] |
| 11 Grade ≥ 3 neutropenia/granulocytopenia (palliative intent studies) Show forest plot | 29 | 11794 | Odds Ratio (M‐H, Fixed, 95% CI) | 0.17 [0.15, 0.18] |
| 12 Grade ≥ 3 febrile neutropenia (palliative intent studies) Show forest plot | 19 | 9407 | Odds Ratio (M‐H, Fixed, 95% CI) | 0.27 [0.21, 0.36] |
| 13 Grade ≥ 3 vomiting (palliative intent studies) Show forest plot | 23 | 9528 | Odds Ratio (M‐H, Fixed, 95% CI) | 1.18 [1.00, 1.40] |
| 14 Grade ≥ 3 nausea (palliative intent studies) Show forest plot | 25 | 9796 | Odds Ratio (M‐H, Fixed, 95% CI) | 1.16 [0.99, 1.36] |
| 15 Grade ≥ 3 stomatitis (palliative intent studies) Show forest plot | 21 | 8718 | Odds Ratio (M‐H, Fixed, 95% CI) | 0.26 [0.20, 0.33] |
| 16 Grade ≥ 3 mucositis (palliative intent studies) Show forest plot | 12 | 4962 | Odds Ratio (M‐H, Fixed, 95% CI) | 0.17 [0.12, 0.24] |
| 17 Grade ≥ 3 hyperbilirubinaemia (palliative intent studies) Show forest plot | 9 | 2699 | Odds Ratio (M‐H, Fixed, 95% CI) | 1.62 [0.99, 2.64] |
| 18 Any grade ≥ 3 adverse events (palliative intent studies) Show forest plot | 14 | 5436 | Odds Ratio (M‐H, Fixed, 95% CI) | 0.83 [0.74, 0.94] |