فلوروپیریمیدین خوراکی در مقابل فلوروپیریمیدین داخل وریدی در مدیریت درمانی سرطان کولورکتال
چکیده
پیشینه
بیماران، شیمیدرمانی تسکینی (palliative) خوراکی را به نوع داخل وریدی آن ترجیح میدهند، به شرط آنکه درمان خوراکی اثربخشی کمتری نداشته نباشد. ما سودمندی و ایمنی فلوروپیریمیدینهای (fluoropyrimidines) خوراکی و IV را برای درمان سرطان کولورکتال (colorectal cancer; CRC) مقایسه کردیم.
اهداف
مقایسه اثرات شیمیدرمانی یا فلوروپیریمیدین خوراکی و IV در بیماران درمان شده با هدف علاج قطعی (curative) یا تسکینی برای CRC.
روشهای جستوجو
در جون 2016 در پایگاه ثبت مرکزی کارآزماییهای کنترل شده کاکرین (CENTRAL؛ 2016، شماره 5)، را به موازات OVID MEDLINE؛ OVID Embase، و پایگاه اطلاعاتی Web of Science جستوجو کردیم. همچنین پنج پایگاه ثبت کارآزماییهای بالینی، چندین مجموعه مقالات کنفرانسها، و فهرست منابع گزارش مطالعات و مرورهای سیستماتیک را جستوجو کردیم. برای شناسایی مطالعات بیشتر با شرکتهای داروسازی تماس گرفتیم.
معیارهای انتخاب
کارآزماییهای تصادفیسازی و کنترل شده (randomised controlled trials; RCTs) را وارد مرور کردیم که به مقایسه شیمیدرمانی با فلوروپیریمیدین خوراکی و IV در بیماران درمان شده با هدف علاج قطعی با تسکینی برای CRC پرداختند.
گردآوری و تجزیهوتحلیل دادهها
سه نویسنده مرور به صورت مستقل به استخراج دادهها و ارزیابی خطر سوگیری (bias) پرداختند. هفت حیطه را در ابزار «خطر سوگیری» کاکرین و سه حیطه بیشتر را ارزیابی کردیم: برنامههای ارزیابی پیامد و/یا پیگیری؛ استفاده از آنالیز قصد درمان (intention‐to‐treat)؛ و مقایسهپذیری بازوهای درمان در خط پایه.
نتایج اصلی
ما نه RCT (شامل مجموعا 10,918 شرکتکننده) را وارد مرور کردیم که به بررسی درمان با قصد بهبودی برای CRC با استفاده از شیمیدرمانی نئوادجوانت (neoadjuvant) و/یا ادجوانت (adjuvant) پرداختند. ما 35 RCT (شامل مجموعا 12,592 شرکتکننده) را وارد مرور کردیم (31 مطالعه شیمیدرمانی خط اول (first‐line)، دو مطالعه شیمیدرمانی خط دوم (second‐line)، و دو مطالعه شیمیدرمانی خط اول یا دوم) که به بررسی درمان با شیمیدرمانی تسکینی برای CRC پیشرفته غیر‐قابل جراحی یا متاستاتیک پرداختند. تمامی مطالعات بیماران مرد و زن را دربرگرفته و هیچ مطالعهای نبود که بیماران کمتر از 18 سال را برسی کرده باشد.
بیماران درمان شده با هدف بهبودی کامل برای CRC با استفاده از شیمیدرمانی نئوادجوانت و/یا ادجوانت
• بقای بدون بیماری (disease‐free survival; DFS): DFS میان شرکتکنندگان درمان شده با فلوروپیریمیدینهای خوراکی در مقابل نوع IV آنها تفاوتی نداشت (نسبت خطر (HR): 0.93؛ 95% فاصله اطمینان (CI): 0.87 تا 1.00؛ هفت مطالعه، 8903 شرکتکننده؛ شواهد با کیفیت متوسط).
• بقای کلی (overall survival; OS): OS میان شرکتکنندگان درمان شده با فلوروپیریمیدینهای خوراکی در مقابل نوع IV آنها تفاوتی را نشان نداد (HR: 0.92؛ 95% CI؛ 0.84 تا 1.00؛ هفت مطالعه؛ 8902 شرکتکننده آنالیز شده؛ شواهد با کیفیت بالا).
• عوارض جانبی (adverse event; AE) با درجه ≥ 3: شرکتکنندگان درمان شده با فلوروپیریمیدینهای خوراکی، کمتر دچار نوتروپنی/گرانولوسیتوپنی با درجه ≥ 3 (نسبت شانس (OR): 0.14؛ 95% CI؛ 0.11 تا 0.16؛ هفت مطالعه؛ 8087 شرکتکننده؛ شواهد با کیفیت متوسط)، استوماتیت (stomatitis) (OR: 0.21؛ 95% CI؛ 0.14 تا 0.30؛ پنج مطالعه؛ 4212 شرکتکننده؛ شواهد با کیفیت پائین)، و هرگونه AE با درجه ≥ 3 (OR: 0.82؛ 95% CI؛ 0.74 تا 0.90؛ پنج مطالعه؛ 7741 شرکتکننده؛ شواهد با کیفیت پائین) شدند. سندرم دست و پا (hand foot syndrome) با درجه ≥ 3 در بیماران درمان شده با فلوروپیریمیدینهای خوراکی بیشتر گزارش شد (OR: 4.59؛ 95% CI؛ 2.97 تا 7.10؛ پنج مطالعه؛ 5731 شرکتکننده؛ شواهد با کیفیت پائین). هیچ اختلافاتی میان شرکتکنندگان درمان شده با فلوروپیریمیدینهای خوراکی در مقابل نوع IV آنها به لحاظ ابتلا به اسهال (diarrhoea) با درجه ≥ 3 (OR: 1.12؛ 95% CI؛ 0.99 تا 1.25؛ نه مطالعه؛ 9551 شرکتکننده؛ شواهد با کیفیت بسیار پائین)، نوتروپنی تبدار (OR: 0.59؛ 95% CI؛ 0.18 تا 1.90؛ چهار مطالعه؛ 2925 شرکتکننده؛ شواهد با کیفیت پائین)، استفراغ (OR: 1.05؛ 95% CI؛ 0.83 تا 1.34؛ هشت مطالعه؛ 9385 شرکتکننده؛ شواهد با کیفیت پائین)، حالت تهوع (OR: 1.21؛ 95% CI؛ 0.97 تا 1.51؛ هفت مطالعه؛ 9233 شرکتکننده؛ شواهد با کیفیت پائین)، موکوزیت (OR: 0.64؛ 95% CI؛ 0.25 تا 1.62؛ چهار مطالعه؛ 2233 شرکتکننده؛ شواهد با کیفیت بسیار پائین) و هیپربیلیروبینمی (hyperbilirubinaemia) (OR: 1.67؛ 95% CI؛ 0.52 تا 5.38؛ سه مطالعه؛ 2757 شرکتکننده؛ شواهد با کیفیت بسیار پائین) وجود نداشتند.
بیماران درمان شده با هدف تسکینی برای CRC پیشرفته غیر‐قابل جراحی یا متاستاتیک با شیمیدرمانی
• بقای بدون پیشرفت (progression‐free survival; PFS): در مجموع، PFS در شرکتکنندگان درمان شده با فلوروپیریمیدینهای خوراکی در مقابل نوع IV آنها، کمتر بود (HR: 1.06؛ 95% CI؛ 1.02 تا 1.11؛ 23 مطالعه؛ 9927 شرکتکننده؛ شواهد با کیفیت متوسط). در حالی که در زمان استفاده از UFT/Ftorafur یا انیلوراسیل (eniluracil) با 5‐فلوروراسیل (5‐FU) خوراکی، PFS در شرکتکنندگان درمان شده با فلوروپیریمیدین خوراکی در مقایسه با نوع IV آن بدتر بود، PFS میان افراد درمان شده با فلوروپیریمیدینهای خوراکی در مقابل نوع IV آنها در زمان استفاه از کاپسیتابین (capecitabine)، دوکسیفلوریدین (doxifluridine) یا S‐1 تفاوتی نداشت.
• OS: در مجموع، OS هیچ تفاوتی میان شرکتکنندگان درمان شده با فلوروپیریمیدینهای خوراکی در مقایسه با نوع IV آنها نداشت (HR: 1.02؛ 95% CI؛ 0.99 تا 1.05؛ 29 مطالعه؛ 12079 شرکتکننده؛ شواهد با کیفیت بالا). OS در شرکتکنندگان درمان شده با فلوروپیریمیدینها خوراکی در مقایسه با نوع IV آنها در زمان استفاده از انیلوراسیل با 5‐FU خوراکی کمتر بود.
• مدت زمان سپری شده تا پیشرفت بیماری (time to progression; TTP): TTP در شرکتکنندگان درمان شده با فلوروپیریمیدینهای خوراکی در مقایسه با نوع IV آنها کمتر بود (HR: 1.07؛ 95% CI؛ 1.01 تا 1.14؛ شش مطالعه؛ 1970 شرکتکننده؛ شواهد با کیفیت متوسط).
• نرخ پاسخ عینی (objective response rate; ORR): ORR میان شرکتکنندگان درمان شده با فلوروپیریمیدینهای خوراکی در مقایسه با نوع IV آنها تفاوتی نداشت (OR: 0.98؛ 95% CI؛ 0.90 تا 1.06؛ 32 مطالعه؛ 11,115 شرکتکننده؛ شواهد با کیفیت متوسط).
• عوارض جانبی درجه ≥ 3: شرکتکنندگان درمان شده با فلوروپیریمیدینهای خوراکی، کمتر دچار نوتروپنی/گرانولوسیتوپنی با درجه ≥ 3 (OR: 0.17؛ 95% CI؛ 0.15 تا 0.18؛ 29 مطالعه؛ 11,794 شرکتکننده؛ شواهد با کیفیت پائین)، نوتروپنی تبدار (OR: 0.27؛ 95% CI؛ 0.21 تا 0.36؛ 19 مطالعه؛ 9407 شرکتکننده؛ شواهد با کیفیت متوسط)، استوماتیت (OR: 0.26؛ 95% CI؛ 0.20 تا 0.33؛ 21 مطالعه؛ 8718 شرکتکننده؛ شواهد با کیفیت پائین)، موکوزیت (OR: 0.17؛ 95% CI؛ 0.12 تا 0.24؛ 12 مطالعه؛ 4962 شرکتکننده؛ شواهد با کیفیت پائین) و هرگونه AE با درجه ≥ 3 (OR: 0.83؛ 95% CI؛ 0.74 تا 0.94؛ 14 مطالعه؛ 5436 شرکتکننده؛ شواهد با کیفیت پائین) شدند. اسهال با درجه ≥ 3 (OR: 1.66؛ 95% CI؛ 1.50 تا 1.84؛ 30 مطالعه؛ 11,997 شرکتکننده؛ شواهد با کیفیت پائین) و سندرم دست و پا (OR: 3.92؛ 95% CI؛ 2.84 تا 5.43؛ 18 مطالعه؛ 6481 شرکتکننده؛ شواهد با کیفیت متوسط) در بازوی درمان شده با فلوروپیریمیدینهای خوراکی بیشتر گزارش شد. هیچ اختلافاتی میان شرکتکنندگان درمان شده با فلوروپیریمیدینهای خوراکی در مقابل نوع IV آنها از نظر استفراغ (OR: 1.18؛ 95% CI؛ 1.00 تا 1.40؛ 23 مطالعه؛ 9528 شرکتکننده؛ شواهد با کیفیت پائین)، حالت تهوع (OR: 1.16؛ 95% CI؛ 0.99 تا 1.36؛ 25 مطالعه؛ 9796 شرکتکننده؛ شواهد با کیفیت پائین)، و هیپربیلیروبینمی (OR: 1.62؛ 95% CI؛ 0.99 تا 2.64؛ نه مطالعه؛ 2699 شرکتکننده؛شواهد با کیفیت پائین) وجود نداشتند.
نتیجهگیریهای نویسندگان
نتایج به دست آمده از این مرور باید این اطمینان را ایجاد کنند که درمان CRC با اکثر فلوروپیریمیدینهای خوراکی که بهطور متداول در درمانهای بالینی حال حاضر استفاده میشوند، در مقایسه با درمان با فلوروپیریمیدینهای IV به یک اندازه کارآمد هستند. در شرکتکنندگان درمان شده برای CRC با هدف تسکینی، میان درمان با انیلوراسیل به همراه 5‐FU خوراکی و PFS و OS کمتر رابطهای وجود دارد، و انیلوراسیل دیگر استفاده نمیشود. فلوروپیریمیدینهای خوراکی و IV دارای الگوهای متفاوتی از عوارض جانبی هستند؛ پژوهش آتی ممکن است روی تعیین مبنای این تفاوتها تمرکز کند.
PICO
خلاصه به زبان ساده
شیمیدرمانی خوراکی در مقابل تزریق داخل وریدی آن برای سرطان کولورکتال
پیشینه
فلوروپیریمیدینهای (fluoropyrimidines) داخل وریدی (intravenous; IV) بخشی ضروری از درمان شیمیدرمانی برای سرطان کولورکتال (colorectal cancer; CRC) هستند. بیماران مصرف قرص را ترجیح میدهند، به شرط آن که به خوبی روش درمانی IV پاسخ داده و به اندازه آن ایمن باشند، زیرا استفاده از آنها راحتتر بوده و در دسترستر هستند.
سوال مطالعه مروری
ما اثرات شیمیدرمانی را با فلوروپیریمیدین خوراکی و IV در بیماران مبتلا به CRC که با هدف بهبودی کامل درمان شدند، یا بیمارانی که سرطان آنها از طریق جراحی قابل برداشت نبود یا متاستاتیک (پخششدن از محل شروع درگیری به سایر نقاط بدن) بود و با شیمیدرمانی تسکینی (palliative chemotherapy) درمان شدند، مقایسه کردیم.
ویژگیهای مطالعه
شواهد تا جون 2016 بهروز است. ما 44 کارآزمایی تصادفیسازی و کنترل شده را شامل 23,150 بیمار که به مقایسه فلوروپیریمیدینهای خوراکی و IV پرداختند، شناسایی کردیم. تمامی مطالعات وارد شده به مرور هر دو نوع بیماران مرد و زن را در برگرفته و هیچ مطالعهای نبود که شامل افراد کمتر از 18 سال باشد.
نتایج اصلی
میان افراد مبتلا به CRC که با هدف بهبودی کامل درمان شدند، بقای بدون بیماری (disease‐free survival; DFS) و بقای کلی (overall survival; OS) میان آنهایی که درمان خوراکی دریافت کردند، در مقابل آنهایی که درمان IV دریافت کردند، تفاوتی نداشت. از نظر عوارض جانبی شدید، بیمارانی که درمان خوراکی دریافت کردند، و آنهایی که با درمان IV شدند، خطر مشابهی در ابتلا به اسهال داشتند. احتمال ایجاد بثورات ناحیه دست و پا در بیمارانی که درمان خوراکی دریافت کردند، بیشتر بود اما احتمال کاهش تعداد سلولهای سفید (نوتروپنی) در این گروه از بیماران نسبت به بیماران دریافت کننده درمان IV کمتر گزارش شد.
در افراد مبتلا به CRC که سرطان آنها به روش شیمیدرمانی تسکینی درمان شد، در مجموع، آنهایی که درمان خوراکی دریافت کردند، دارای بقای بدون پیشرفت (progression‐free survival; PFS) بدتری نسبت به بیمارانی بودند که درمان IV دریافت کردند. استفاده از دو فرمول از درمان خوراکی (UFT یا Ftorafur، و انیلوراسیل (eniluracil) با 5‐فلوروراسیل (5‐FU)) خوراکی منجر به بدتر شدن PFS در بیمارانی شد که در مقایسه با درمان IV، تحت درمان به روش خوراکی قرار گرفتند. استفاده از سه فرمول دارویی دیگر در درمان خوراکی (کپسیتابین (capecitabine)، S‐1، دوکسیفلوریدین (doxifluridine)) منجر به PFS مشابه در بیمارانی شد که در مقایسه با درمان IV، درمان خوراکی دریافت کردند. OS میان بیماران درمان شده با فلوروپیریمیدینهای خوراکی در مقابل نوع IV آنها، تفاوتی نداشت. از نظر عوارض جانبی شدید، احتمال بروز اسهال و بثورات دست و پا در بیمارانی که درمان خوراکی دریافت کردند بیشتر، اما کاهش شمار سلولهای سفید نسبت به آنهایی که درمان IV دریافت کردند، کمتر بود.
کیفیت شواهد
نویسندگان مرور کیفیت شواهد را برای پیامدهای اصلی در این مرور (DFS و PFS) در سطح متوسط ارزیابی کردند، علت اصلی برای کاهش سطح کیفیت شواهد عبارت بودند از موضوعات مرتبط با طراحی مطالعات. کیفیت شواهد برای OS در بیمارانی که با هدف بهبودی کامل درمان شده و در بیمارانی که با شیمیدرمانی تسکینی درمان شدند، بالا بود. کیفیت شواهد برای عوارض جانبی از بسیار پائین یا متوسط متغیر بود و علل تنزل کیفیت عبارت بودند از موضوعات مربوط به طراحی مطالعات، نتایج متفاوت میان مطالعات، یا عدم ارائه دادههای کافی.
Authors' conclusions
Summary of findings
| Oral compared with intravenous fluoropyrimidines for colorectal cancer ‐ Patients treated with curative intent | |||||
| Patient or population: Patients treated with curative intent for colorectal cancer with neoadjuvant and/or adjuvant chemotherapy Setting: Hospital Intervention: Oral fluoropyrimidines Comparison: Intravenous fluoropyrimidines | |||||
| Outcomes | Illustrative comparative risks (95% CI) | Relative effect | No. of participants | Quality of the evidence | |
| Assumed risk* | Corresponding risk** | ||||
| Intravenous fluoropyrimidines | Oral fluoropyrimidines | ||||
| Disease‐free survival | 313 per 1000a | 291 per 1000 (272 to 313) | HR 0.93 | 8903 | ⊕⊕⊕⊝ |
| Overall survival | 222 per 1000c | 204 per 1000 (186 to 222) | HR 0.92 (0.84 to 1.00) | 8902 (7 RCTs) | ⊕⊕⊕⊕ |
| Grade ≥ 3 diarrhoea | 137 per 1000d | 153 per 1000 (135 to 171) | OR 1.12 | 9551 | ⊕⊝⊝⊝ |
| Grade ≥ 3 hand foot syndrome | 8 per 1000d | 37 per 1000 (24 to 57) | OR 4.59g | 5731 | ⊕⊕⊝⊝ |
| Grade ≥ 3 neutropenia/granulocytopenia | 181 per 1000d | 25 per 1000 (20 to 29) | OR 0.14 (0.11 to 0.16) | 8087 (7 RCTs) | ⊕⊕⊕⊝ |
| *The basis for the assumed risk is provided in footnotes. **The corresponding risk (and its 95% CI) is based on the assumed risk in the comparison group and the relative effect of the intervention (and its 95% CI). Pooled estimates from fixed‐effects meta‐analysis are reported in the table | |||||
| GRADE Working Group grades of evidence | |||||
| aThe assumed risk for disease‐free survival was based on the 3‐year disease‐free survival rate in the control group from studies in the meta‐analysis (68.7%) bDowngraded by one level owing to a high risk of bias in included studies. cThe assumed risk for overall survival was based on the 5‐year overall survival rate in the control group from studies in the meta‐analysis (77.8%) dThe assumed risk for each grade ≥ 3 AE was the mean risk in the control group from studies in the meta‐analysis eDowngraded by one level owing to inconsistency of results that was supported by non‐overlapping CIs, high I2 values, and statistically significant heterogeneity of effect estimates fDowngraded by one level owing to imprecision gRandom‐effects estimate, OR 2.36 (95% CI 0.52 to 10.74). Pooled effect estimate was sensitive to the meta‐analysis model used | |||||
| Oral compared with intravenous fluoropyrimidines for colorectal cancer ‐ Patients treated with palliative intent | |||||
| Patient or population: Patients treated with palliative intent for inoperable advanced or metastatic colorectal cancer with chemotherapy Setting: Hospital Intervention: Oral fluoropyrimidines Comparison: Intravenous fluoropyrimidines | |||||
| Outcomes | Illustrative comparative risks (95% CI) | Relative effect | No. of participants | Quality of the evidence | |
| Assumed risk* | Corresponding risk** | ||||
| Intravenous fluoropyrimidines | Oral fluoropyrimidines | ||||
| Progression‐free survival | 398 per 1000a | 422 per 1000 (406 to 442) | HR 1.06 | 9927 | ⊕⊕⊕⊝ |
| Overall survival | 336 per 1000c | 343 per 1000 (333 to 353) | HR 1.02 (0.99 to 1.05) | 12,079 (29 RCTs) | ⊕⊕⊕⊕ |
| Grade ≥ 3 diarrhoea | 120 per 1000d | 199 per 1000 (180 to 221) | OR 1.66 | 11,997 | ⊕⊕⊝⊝ |
| Grade ≥ 3 hand foot syndrome | 13 per 1000d | 51 per 1000 (37 to 71) | OR 3.92 | 6481 | ⊕⊕⊕⊝ |
| Grade ≥ 3 neutropenia/granulocytopenia | 331 per 1000d | 56 per 1000 (50 to 60) | OR 0.17 (0.15 to 0.18) | 11,794 (29 RCTs) | ⊕⊕⊝⊝ |
| *The basis for the assumed risk is provided in footnotes. **The corresponding risk (and its 95% CI) is based on the assumed risk in the comparison group and the relative effect of the intervention (and its 95% CI). Pooled estimates from fixed‐effects meta‐analysis are reported in the table | |||||
| GRADE Working Group grades of evidence | |||||
| aThe assumed risk for progression‐free survival was based on the 6‐month progression‐free survival rate in the control group from studies in the meta‐analysis (60.2%) bDowngraded by one level owing to a high risk of bias in included studies cThe assumed risk for overall survival was based on the 12‐month overall survival rate in the control group from studies in the meta‐analysis (66.4%) dThe assumed risk for each grade ≥ 3 AE was the mean risk in the control group from the studies in the meta‐analysis eDowngraded by one level owing to inconsistency of results that was supported by non‐overlapping CIs, high I2 values, and statistically significant heterogeneity of effect estimates | |||||
Background
Description of the condition
Worldwide, colorectal carcinoma (CRC) has the third highest incidence rate and the fourth highest mortality rate of all cancers (Ferlay 2013). In 2012, an estimated 1,360,602 new cases and an estimated 693,933 deaths from CRC occurred worldwide (Ferlay 2013). Approximately 20% of patients diagnosed with CRC have distant metastases at diagnosis, and a further 25% to 35% will develop metastases at a later time (Siegel 2017; Van Cutsem 2006; Van der Geest LGM). This contributes to the high mortality rates observed for CRC (Ferlay 2013).
Description of the intervention
Fluoropyrimidines have been an essential part of treatment for CRC for over 40 years.
For patients with colon cancer treated with curative intent, recommendations regarding use of adjuvant chemotherapy following resection of the primary tumour vary, depending on the stage of disease. TNM stage II disease is defined as T3 or T4 but node negative, whilst TNM stage III disease is defined as any T stage and node positive (Edge 2009). Use of adjuvant 5‐fluorouracil (5‐FU)‐based chemotherapy has been demonstrated to improve survival (Francini 1994; IMPACT Investigators 1995; Laurie 1989; Moertel 1990; O'Connell 1997); subsequently, six months' duration of adjuvant 5‐FU/leucovorin (LV) was established as the standard of care for patients with stage III colon cancer (Dencausse 2002; Haller 2005; O'Connell 1998). More recent research has shown that oxaliplatin added to six months of adjuvant 5‐FU/LV chemotherapy leads to further improvement in both five‐year disease‐free survival (DFS) and six‐year overall survival (OS) compared with 5‐FU/LV alone for stage III colon cancer (André 2009).
Survival outcomes for stage II colon cancer are better than for stage III disease, and the survival benefit derived from use of adjuvant chemotherapy is accordingly less in this setting (André 2009; Brenner 2014; Figueredo 2008; Gill 2004; Gray 2007; IMPACT Investigators 1995; Sargent 2009). American Society of Clinical Oncology (ASCO) guidelines state that direct evidence from randomised controlled trials (RCTs) does not support the routine use of adjuvant chemotherapy in stage II disease (Benson 2004). Current National Comprehensive Cancer Network (NCCN) guidelines recommend that for stage II colon cancer, physician and patient discussion should include potential benefits versus risks of adjuvant chemotherapy. This discussion should encompass consideration of high‐risk features (both clinicopathological and molecular), as well as indirect evidence, potential treatment‐related morbidity and patient co‐morbidities, anticipated life expectancy, and patient preferences (NCCN 2016).
The current standard of care for stage II and III rectal carcinoma is curative intent treatment based on a combined‐modality approach. This consists of neoadjuvant chemo‐radiotherapy with 5‐FU, total mesorectal excision (TME), and adjuvant chemotherapy with 5‐FU and oxaliplatin (Weiser 2015).
In patients with inoperable advanced or metastatic CRC, use of palliative intent IV 5‐FU‐based therapy has led to improved survival outcomes (Nordic 1992; Scheithauer 1993). Subsequent advances including optimisation of IV 5‐FU regimens and combination with irinotecan and oxaliplatin chemotherapy have led to further improvements in median OS (Lucas 2011). Over the past decade, anti‐angiogenic therapies have been successfully combined with fluoropyrimidine‐based chemotherapy. A pivotal phase III trial examined bevacizumab (BEV), a humanised monoclonal antibody to vascular endothelial growth factor (VEGF), by randomising participants to irinotecan, fluorouracil, leucovorin (IFL)/placebo (control), and IFL/BEV or 5‐FU/LV/BEV (Hurwitz 2004). Overall, results showed significant improvement in the endpoints of OS, progression‐free survival (PFS), and median duration of response in the IFL/BEV arm. Survival benefits were also reported in a second‐line study which compared oxaliplatin, fluorouracil and leucovorin (FOLFOX4)‐BEV with FOLFOX4 alone (Giantonio 2007) and in the first‐line MAX trial (Tebbutt 2010), which reported that BEV added to the oral fluoropyrimidine capecitabine improved PFS. Subsequently, the benefit of continuing BEV beyond progression in combination with a second‐line fluoropyrimidine‐based chemotherapy was demonstrated in the phase III TML study (Bennouna 2013). Furthermore, the anti‐angiogenic drugs ziv‐aflibercept and ramucirumab, in combination with infusional 5‐FU, leucovorin, and irinotecan (FOLFIRI), were demonstrated to prolong PFS and OS in the second‐line setting (Tabernero 2015; Van Cutsem 2012).
Cetuximab, an epidermal growth factor receptor (EGFR) antibody, added to FOLFIRI in the first‐line setting, was shown to improve efficacy in patients with KRAS wild‐type metastatic CRC (Van Cutsem 2011). Similarly, panitumumab, a fully humanised antibody to EGFR, was shown to be effective for this subset of patients in the first‐ and second‐line setting when combined with fluoropyrimidine chemotherapy (Douillard 2010; Peeters 2010).
How the intervention might work
Intravenous and oral 5‐FU have been used in the treatment of cancer for several decades. Owing to its unpredictable gastrointestinal absorption and marked variation in pharmacokinetics, use of oral 5‐FU alone was abandoned early. Since that time, research has focused on the biomodulation of 5‐FU to improve its therapeutic effectiveness and cytotoxicity. Leucovorin (LV), an intracellular source of reduced folates, acts by stabilising the complex formed by 5‐FU with thymidylate synthase (TS) and 5‐fluoro‐deoxyuridine monophosphate (5‐FdUMP), leading to prolonged TS inhibition and enhanced efficacy. Eniluracil is a potent inactivator of the principal 5‐FU degradation enzyme dihydropyrimidine dehydrogenase (DPD), and co‐administration with oral 5‐FU significantly increased oral bioavailability whilst decreasing 5‐FU pharmacokinetic variability (reviewed in Schilsky 2002b). Development of this combination was discontinued in 2000.
Several other oral fluoropyrimidines have been designed and currently are undergoing clinical trials or are used routinely in the clinic. Doxifluridine (5’‐dFUR) consists of a 5‐FU molecule attached to a pseudo‐pentose, thus it cannot be directly metabolised in deoxyribonucleic acid (DNA) or ribonucleic acid (RNA) synthesis. With exposure to pyrimidine phosphorylases found at higher concentrations in tumours, 5'‐dFUR is preferentially converted to active 5‐FU in malignant tissue (reviewed in Calabresi 1991). Ftorafur (FTO; Tegafur) is a second‐generation fluoropyrimidine prodrug which provides more prolonged and stable release of 5‐FU. UFT, which comprises FTO and uracil in molar proportions of 1:4, is a third‐generation drug designed to improve the therapeutic index of FTO. Uracil, a natural substrate of DPD, is converted preferentially in lieu of FTO owing to its higher molar concentration in this formulation, resulting in a prolonged 5‐FU elimination half‐life. It has been combined with LV under the trade name Orzel. Capecitabine, another third‐generation drug, is the most commonly used oral fluoropyrimidine worldwide. Designed to limit gastrointestinal toxicity, capecitabine resists enzymatic degradation by thymidine phosphorylase (TP) in the intestine and undergoes a three‐stage conversion with eventual transformation to active 5‐FU in the tumour tissue, where TP levels are highest. S‐1 is a combination of FTO and two biomodulators ‐ 5‐chloro‐2,4‐dihydroxypyridine (CDHP) and potassium oxalate (OXO). CDHP is a potent, reversible inhibitor of DPD which is used to achieve prolonged higher concentrations of 5‐FU in the circulation. OXO acts to limit the gastrointestinal toxicity associated with phosphorylation of 5‐FU in the gastrointestinal tract. OXO accumulates in gastrointestinal tissues, where it inhibits phosphorylation of 5‐FU into 5‐fluorouridine‐5′‐monophosphate (5‐FUMP) by orotate phosphoribosyl transferase (OPRT) (reviewed in Hoff 2000 and Malet‐Martino 2002).
More recently, TAS‐102, an oral combination of trifluridine (FTD, a thymidine‐based nucleoside analogue) and tipiracil (a TP inhibitor which improves bioavailability of FTD), was demonstrated to confer an overall survival benefit in the metastatic chemo‐refractory setting (Mayer 2015). At the dosing schedule used in the clinical development of TAS‐102, its clinically relevant mechanism of action consists of incorporation into DNA and subsequent DNA dysfunction, rather than TS inhibition (reviewed in Lenz 2015). We considered its mechanism of action to be distinct from that of the other fluoropyrimidines described here and did not search for studies examining TAS‐102 for inclusion in this review.
Why it is important to do this review
Patients prefer oral over IV administration of palliative chemotherapy for multiple cancers, including CRC, provided that oral therapy is not less effective. Reasons include the convenience of home‐based treatment with a tablet formulation (Borner 2002; Liu 1997; Twelves 2006).
Oral fluoropyrimidine chemotherapy has been compared with IV fluoropyrimidine in patients with CRC who have been treated with curative or palliative intent. However, researchers have reported variable results with respect to efficacy and adverse events (Chau 2009).
Differences in the efficacy and adverse event profiles of IV fluoropyrimidines depend on whether infusional or bolus regimens are used (Meta‐analysis Group in Cancer 1998a; Meta‐analysis Group in Cancer 1998b). Different oral fluoropyrimidines may also have different efficacy and adverse event profiles (Hamaguchi 2015; Hong 2012; Kwakman 2017). For patients treated with palliative intent for inoperable advanced or metastatic CRC, efficacy and adverse event outcomes for oral compared with IV fluoropyrimidines may vary, depending on whether fluoropyrimidines are combined with irinotecan versus oxaliplatin chemotherapy (Chau 2009). Combination cancer therapy can improve efficacy but can also increase toxicity (Braun 2011). Therefore, it is important to assess whether efficacy and adverse event outcomes differ between oral and IV fluoropyrimidines, depending on whether patients with CRC receive chemotherapy alone versus chemo‐radiotherapy (in curative intent studies) or single‐agent versus combination chemotherapy (in palliative intent studies).
We were unable to identify a previous meta‐analysis and systematic review that examined a wide range of oral fluoropyrimidines, nor were we able to find a systematic review that performed subgroup analyses examining chemotherapy versus chemo‐radiotherapy (in curative intent studies) and single‐agent versus combination therapy (in palliative intent studies), infusional versus bolus IV fluoropyrimidine, the oral fluoropyrimidine backbone used, and oxaliplatin‐based versus irinotecan‐based combination therapy.
Objectives
To compare the effects of oral and IV fluoropyrimidine chemotherapy in patients treated with curative or palliative intent for CRC.
Methods
Criteria for considering studies for this review
Types of studies
We included RCTs with treatment arms comparing oral fluoropyrimidine versus IV fluoropyrimidine chemotherapy.
Studies with a cross‐over design from oral to IV fluoropyrimidine, or vice versa, were eligible for inclusion only if the cross‐over design permitted all relevant treatment arms to crossover.
We included studies regardless of publication status and blinding of participants, personnel, and/or outcome assessment. We applied no language restrictions and did not use outcomes as criteria for considering studies for inclusion in this review.
Types of participants
We included patients who were treated with curative intent for CRC and received neoadjuvant (preoperative) and/or adjuvant (postoperative) chemotherapy. For adjuvant chemotherapy, we included patients with stage II or III colon cancer.
We included patients who were treated with palliative intent for inoperable advanced or metastatic CRC and received chemotherapy.
We included only patients for whom a diagnosis of CRC had been confirmed by histopathology or cytology. We did not restrict patients by gender, age, or ethnic group.
If a study included relevant patients as a subgroup and if outcomes related to this subgroup were reported separately, we included the patients who were eligible for this review (e.g. Fuchs 2007).
Types of interventions
Oral fluoropyrimidine treatment included any fluoropyrimidine administered orally (e.g. capecitabine, S‐1, ftorafur, UFT, doxifluridine, 5‐ethynyluracil). IV fluoropyrimidine treatment included agents administered by bolus and by infusion.
For oral and IV fluoropyrimidine treatments, we did not restrict dose, frequency, intensity, and duration of treatment.
We included oral and IV fluoropyrimidine treatments that were administered as a single agent, or in combination with any other cytotoxic agent/s (e.g. irinotecan, oxaliplatin) and targeted therapies (e.g. bevacizumab, cetuximab). In the case of combination therapy, we included only studies in which the same cytotoxic agents and targeted therapies were administered in both the oral and the IV fluoropyrimidine arms.
We also included oral and IV fluoropyrimidine treatments that were administered with radiotherapy (chemo‐radiotherapy). In the case of chemo‐radiotherapy, we included only studies in which radiotherapy was administered in both the oral and the IV fluoropyrimidine arms.
Cross‐over studies were eligible for inclusion only if participants in both the oral and the IV fluoropyrimidine arms received at least three cycles of chemotherapy before crossover.
Types of outcome measures
Primary outcomes
Patients treated with curative intent for CRC with neoadjuvant and/or adjuvant chemotherapy
-
Disease‐free survival (DFS), defined as time from randomisation until death from any cause or disease recurrence, whichever occurred first
Patients treated with palliative intent for inoperable advanced or metastatic CRC with chemotherapy
-
Progression‐free survival (PFS), defined in this review as time from randomisation until death from any cause or disease progression, whichever occurred first
Secondary outcomes
Patients treated with curative intent for CRC with neoadjuvant and/or adjuvant chemotherapy
-
Overall survival (OS)
-
Grade ≥ 3 adverse events (AEs) (diarrhoea, hand foot syndrome (HFS), neutropenia/granulocytopenia, febrile neutropenia, vomiting, nausea, stomatitis, mucositis, hyperbilirubinaemia, any grade ≥ 3 AEs) assessed on the basis of National Cancer Institute Common Terminology Criteria for Adverse Events (NCI CTCAE) or similar criteria
Patients treated with palliative intent for inoperable advanced or metastatic CRC with chemotherapy
-
OS
-
Time to progression (TTP), defined in this review as time from randomisation until disease progression
-
Objective response rate (ORR), with objective response defined as best response assessed as a complete response (CR) or a partial response (PR) on the basis of Response Evaluation Critieria in Solid Tumours (RECIST) or similar criteria
-
Incidence of grade ≥ 3 AEs listed above
Search methods for identification of studies
Electronic searches
We searched the following databases with no limitation on publication year or language.
-
Cochrane Central Register of Controlled Trials (CENTRAL) on 14 June 2016 (2016, Issue 5) in the Cochrane Library (Appendix 1).
-
MEDLINE (OVID) from 1950 to 14 June 2016 (Appendix 2).
-
Embase (OVID) from 1974 to 14 June 2016 (Appendix 3).
-
Web of Science (Web of Knowledge) from 1900 to 16 June 2016 (Appendix 4).
The first three searches were performed by the Cochrane Colorectal Cancer Group Information Specialist.
We searched the following trials registries.
-
ClinicalTrials.gov (http://clinicaltrials.gov/) on 8 June 2016, with no limitations on the date trial information was received or updated.
-
World Health Organization International Clinical Trials Registry Platform (WHO ICTRP) (www.who.int/ictrp/en/) on 29 August 2016, with no date restrictions on date of registration.
-
Current Controlled Trials, using the International Standard Randomised Controlled Trial Number (ISRCTN) Register (International) (www.controlled‐trials.com) on 9 June 2016, with no date limitations.
-
The Australian New Zealand Clinical Trials Registry (ANZCTR) (www.anzctr.org.au) on 16 June 2016, with no limitations on trial registration or start dates.
-
European Organisation for Research and Treatment of Cancer (EORTC) clinical trials database (www.eortc.org/clinical‐trials/) on 16 June 2016, with no date limitations.
Searching other resources
We searched for additional trials not identified in the above electronic searches by searching relevant proceedings for oncology meetings and conferences. We searched the following proceedings.
-
American Society for Clinical Oncology (ASCO), search of the electronic database of meeting abstracts (http://meetinglibrary.asco.org/abstracts) from 2004 to 15 June 2016.
-
European Society of Medical Oncology (ESMO), handsearched from 2000 to 14 June 2016.
-
European Cancer Conference, handsearched from 1993 to 14 June 2016.
We searched the reference lists of identified studies and other systematic reviews, and wrote to the following pharmaceutical companies involved in the manufacture of oral fluoropyrimidines: Orzel, Adherex, Roche, Merck Serono, Sanofi Aventis, and Taiho.
Data collection and analysis
Selection of studies
Three review authors (FC and YY or DL) selected trials for inclusion independently, and resolved queries or disagreements with assistance from a fourth review author (NT). We used a standard checklist of inclusion and exclusion criteria to select studies. We listed excluded trials and reasons for their exclusion. We wrote to investigators for clarification when we could not determine eligibility from published report/s for the study.
Data extraction and management
We collected data from the reports for included studies by using Data Extraction Forms that we had piloted successfully. Two or three review authors (FC and YY or DL) performed this independently, and a fourth review author (NT) resolved disagreements.
We collected the following information about the included studies: study design and setting, study eligibility criteria, participant characteristics, intervention(s) given, outcomes assessed, funding sources, and declarations of interest of the primary researchers. We used this information to populate the Characteristics of included studies tables.
When an included study had multiple reports, we used the report with the most recent data for a specific outcome to extract data for that outcome. When applicable and if necessary, we used other study reports to extract additional information required, including study characteristics and information for risk of bias assessments.
We examined retraction statements and errata associated with included studies and, when applicable, updated recorded data accordingly.
If required, we contacted study authors of the included studies for clarification or for additional information, which we then used in analyses of treatment effects and/or risk of bias assessments.
We checked the magnitude and direction of effects reported by studies against the data presented in our review.
Assessment of risk of bias in included studies
Three review authors (FC and YY or DL) independently assessed risk of bias of included studies using the Cochrane 'Risk of bias' tool (Higgins 2011a); NT resolved queries or disagreements. We assessed the following risk of bias domains: random sequence generation, allocation concealment, blinding of participants and personnel, blinding of outcome assessment, incomplete outcome data, selective reporting, and other sources of bias including the following.
-
Use of subsequent therapies in treatment arms.
-
-
For patients treated with curative intent for CRC who received neoadjuvant chemotherapy, we assessed subsequent treatment with adjuvant chemotherapy.
-
For patients treated with curative intent for CRC who received adjuvant chemotherapy, we assessed subsequent treatment with chemotherapy following recurrence or new occurrence of CRC.
-
For patients treated with palliative intent for inoperable advanced or metastatic CRC who received chemotherapy, we assessed subsequent‐line palliative drug therapy following progressive disease.
-
-
In factorial trials, assessment of important interactions between effects of different interventions (Higgins 2011b).
We assessed an additional three domains that we judged to be important for risk of bias assessment of included studies.
-
Comparable schedule of assessment and/or follow‐up for outcomes in different treatment arms.
-
We assessed risk as 'High' if we noted differences in the frequency of outcome assessments between treatment arms, 'Low' if frequency of assessment was the same in the treatment arms, and 'Unclear' if insufficient information was provided to allow assessment.
-
-
Incomplete outcome data (intention‐to‐treat (ITT) analysis).
-
We defined ITT analysis as analysis of randomised participants for efficacy and safety outcomes according to allocated treatment, irrespective of whether participants were eligible, received the allocated treatment, received another treatment, or received no treatment.
-
We assessed risk as 'High' if the efficacy analysis was clearly not an ITT analysis as defined, and/or if ≥ 5% of participants were excluded from the analysis. We assessed risk as 'Unclear' if insufficient information was provided to allow assessment, and we assessed all other studies as 'Low' risk.
-
-
Comparability of treatment arms at baseline.
-
This included Eastern Cooperative Oncology Group (ECOG)/Karnofsky/World Health Organization (WHO)/Zubrod performance status (PS); median or mean age; TNM stage and/or stage II vs III for patients treated with curative intent and number of involved organs for patients treated with palliative intent; and difference in the proportion of participants with KRAS‐mutant CRC among those treated with palliative intent using EGFR inhibitors.
-
We assessed risk as 'High' if differences between treatment arms at baseline were ≥ 15% for PS; ≥ 5 years for age; ≥ 15% for stage or number of involved organs; or ≥ 10% for KRAS mutant status. We assessed risk as 'Unclear' if insufficient information was provided to allow assessment, and we assessed all other studies as 'Low' risk.
-
We contacted study authors of included studies when we needed clarification or additional information.
-
Evaluation of risk of bias for outcomes
We assessed risk of bias for all studies that contributed to each of the review outcomes, as follows.
-
We judged a study contributing to an outcome to be at high risk of bias if we assessed it as having 'High' risk of bias for one or more domains relevant to the outcome.
-
We judged a study contributing to an outcome to be at low risk of bias if we assessed it as having 'Low' risk of bias for all domains relevant to the outcome.
-
We judged a study contributing to an outcome to be at unclear risk of bias if we assessed it as having 'Unclear' risk of bias for one or more domains relevant to the outcome, but we did not assess any domain as 'High' risk.
We used risk of bias assessments for each contributing study to summarise risk of bias for each outcome.
Measures of treatment effect
Time‐to‐event data
We expressed effect estimates as hazard ratios (HRs) with 95% confidence intervals (CIs) for the following time‐to‐event outcomes.
-
Patients treated with curative intent for CRC with neoadjuvant and/or adjuvant chemotherapy.
-
DFS, OS.
-
-
Patients treated with palliative intent for inoperable advanced or metastatic CRC with chemotherapy.
-
PFS, TTP, and OS.
-
Dichotomous data
We expressed summary statistics as odd ratios (ORs) for the following dichotomous outcomes.
-
Patients treated with curative intent for CRC with neoadjuvant and/or adjuvant chemotherapy.
-
Grade ≥ 3 AEs.
-
-
Patients treated with palliative intent for inoperable advanced or metastatic CRC with chemotherapy.
-
ORR, grade ≥ 3 AEs.
-
Statistical methods for data analysis
Specific outcomes
Time‐to‐event outcomes
When possible, we extracted hazard ratios (HRs) and their 95% confidence intervals (CIs) or standard error of the natural logarithm of HR (se(lnHR)) directly from reports of studies or from correspondence with study authors and contacts; if not reported, we estimated these indirectly from the study reports.
A statistician estimated HRs and se(lnHR) indirectly from Kaplan‐Meier survival curves using the method described by Tierney et al. (Tierney 2007). For one study (Douillard 2002), a statistician indirectly estimated the HR and the se(lnHR) for TTP using a ratio of the median TTP to approximate the HR, and the stratified log‐rank P value to approximate the se(lnHR). For studies for which CIs for effect estimates were not reported as 90%, 95%, or 99% CIs for input into Review Manager 5, a statistician used the indirect variance estimation method to determine the se(lnHR) of the reported HR (Tierney 2007).
For patients treated with curative intent for CRC who received neoadjuvant and/or adjuvant chemotherapy, we measured DFS and OS after a minimum of three years' follow‐up.
Dichotomous outcomes
ORR
For ORR, we calculated the OR using the number of participants who achieved an objective response as the number of 'events', and the total number of participants who were assessable or evaluable for response as the 'total'. When the latter information was not specified, we used the number of participants in the ORR population, which was reported for the study as the 'total'. When only the percentage of participants who achieved an objective response in the treatment arms was reported, we used this percentage and the number of participants in the ORR population to calculate the number of 'events'. If this percentage was reported as "less than x%", we used the absolute value of x. For studies that did not specify a separate ORR population, we used the number of participants in the overall analysis population as the 'total'.
For studies that reported ORRs assessed by both Investigator Assessment and an Independent Review Committee (IRC), we used the ORR from the Investigator Assessment, as most studies did not undergo IRC assessment.
Grade ≥ 3 AE outcomes
For grade ≥ 3 AE outcomes, we calculated the OR using the number of participants who experienced grade ≥ 3 AEs as the number of 'events', and the number of participants included in the safety analysis population as the 'total'. When only the percentage of participants who experienced grade ≥ 3 AEs in the treatment arms were reported, we used this percentage and the number of participants in the safety analysis population to calculate the number of 'events'. If this percentage was reported as "less than x %", we used the absolute value of "x". When a separate safety analysis population denominator was not specified, we used the number of participants in the overall analysis population as the 'total'.
We only quantitatively synthesised HFS data that had been assessed as grade ≥ 3 using NCI CTCAE (versions 2.0 to 4.0), as assessments of grade ≥ 3 HFS using other criteria were not considered sufficiently similar.
We quantitatively synthesised hyperbilirubinaemia data that had been assessed as grade ≥ 3 using NCI CTCAE (versions 2.0 to 4.0 and 1981) and WHO (1981 version). Additionally, we considered hyperbilirubinaemia assessed as grade 4 using NCI CTCAE (1994 version), National Cancer Institute of Canada Clinical Trials Group (NCIC‐CTG) Common Toxicity Criteria (CTC) (1991 version), Southwest Oncology Group (SWOG) (1992 version), and Eastern Cooperative Oncology Group (ECOG) CTC to also be sufficiently similar to hyperbilirubinaemia assessed as grade ≥ 3 using NCI CTCAE (versions 2.0 to 4.0 and 1981) and WHO (1981 version), and we included these data in our quantitative synthesis.
Data presented for different populations
When study authors presented efficacy data for both 'per protocol' and ITT populations (as defined in the study report), we used results for the ITT population.
When study authors presented data for both the safety analysis population and those with available safety data, we used data from the safety analysis population.
Non‐inferiority analysis
In our original protocol, we did not hypothesise that one route of fluoropyrimidine administration (oral or IV) was superior to the other. As such, we did not state a priori levels of benefit.
However, in response to a peer reviewer suggestion, we defined non‐inferiority (NI) margins for the primary outcomes DFS and PFS whereby 50%, 70%, 80%, and 90% of the activity of the active control was retained had the original design been one of non‐inferiority, using IV fluoropyrimidines as the historical active control (FDA 2010). We determined these NI margins independent of studies comparing oral versus IV fluoropyrimidines. In response to an editor suggestion, we assessed whether non‐inferiority had been demonstrated if one made the post hoc judgement that retaining at least 80% of the activity of the active control was reasonable to demonstrate this.
Unit of analysis issues
Studies with multiple treatment arms
In the case of studies with multiple treatment arms:
-
if one or more treatment arms in a study did not contain an oral fluoropyrimidine or IV fluoropyrimidine chemotherapy, we omitted these arms from the analysis;
-
when two IV fluoropyrimidine treatment arms contained similar regimens with respect to the outcome or subgroup analysis being examined (and it was considered clinically appropriate to pool the arms), we combined these treatment arms to create a single pair‐wise comparison with the oral fluoropyrimidine treatment arm; and
-
when two IV fluoropyrimidine treatment arms contained regimens that were different with respect to the outcome or subgroup analysis of interest (and it was not considered clinically appropriate to pool the arms), we used these treatment arms in separate comparisons. In such cases, we used half of the sample size of the experimental oral fluoropyrimidine arm for each comparison.
Cross‐over studies
For cross‐over studies, we measured the outcomes DFS, TTP, PFS, ORR, and grade ≥ 3 AEs (not OS) before crossover.
Dealing with missing data
We contacted the study authors to request missing summary data. If study authors provided us with this data, we included these data in the analyses. If this information was not provided to us by study authors, when possible, we extracted and analysed data as described in 'Statistical methods for data analysis'. With respect to missing individual data, we did not use an imputation method for sensitivity analyses of primary (time‐to‐event) outcomes. We identified studies that did not perform an intention‐to‐treat analysis, assessed associated risk of bias (reported in 'Risk of bias' tables), and incorporated this information into our assessments of quality of evidence for all outcomes.
Assessment of heterogeneity
We assessed clinical heterogeneity with focus on included participants, interventions, and measurements of outcomes (Discussion). We assessed statistical heterogeneity using the Chi2 test, with the level of statistical significance set at 5%. We quantified statistical heterogeneity using the I2 statistic, with interpretation of I2 guided by the Cochrane Handbook for Systematic Reviews of Interventions (Deeks 2011) ‐ 0% to 40%: might not be important; 30% to 60%: may represent moderate heterogeneity; 50% to 90%: may represent substantial heterogeneity; 75% to 100%: considerable heterogeneity.
Assessment of reporting biases
We assessed reporting bias using symmetry of the funnel plot for the co‐primary endpoint PFS, as described in the Cochrane Handbook for Systematic Reviews of Interventions (Sterne 2011). As we included only seven studies in the pooled estimate for DFS, we did not examine a funnel plot for this outcome.
Data synthesis
We performed quantitative synthesis of aggregate data using HR and OR effect estimates, and using fixed‐effect model (FEM) meta‐analysis in Review Manager software (RevMan [Computer Program]). We used the generic inverse‐variance method for meta‐analysis of time‐to‐event outcomes, and the Mantel‐Haenszel method for meta‐analysis of dichotomous outcomes (Higgins 2011c).
Multiple included studies reported the outcomes grade ≥ 3 vomiting and nausea and grade ≥ 3 mucositis and stomatitis in combination. We therefore performed quantitative synthesis of these outcomes as follows.
-
Grade ≥ 3 vomiting included data from studies that reported either grade ≥ 3 vomiting alone, or grade ≥ 3 vomiting or nausea.
-
Grade ≥ 3 nausea included data from studies that reported either grade ≥ 3 nausea alone, or grade ≥ 3 vomiting or nausea.
-
Grade ≥ 3 stomatitis included data from studies that reported grade ≥ 3 stomatitis alone, or grade ≥ 3 stomatitis or mucositis.
-
Grade ≥ 3 mucositis included data from studies that reported either grade ≥ 3 mucositis alone, or grade ≥ 3 stomatitis or mucositis.
Subgroup analysis and investigation of heterogeneity
We used prespecified tests for heterogeneity to compare treatment effects between subgroups (Higgins 2011c), defined by the following intervention characteristics.
-
Chemotherapy versus chemo‐radiotherapy received (among participants treated with curative intent for CRC)or single‐agent versus combination therapy received (among participants treated with palliative intent for inoperable advanced or metastatic CRC).
-
Infusional versus bolus IV fluoropyrimidine received.
-
Type of oral fluoropyrimidine backbone given (e.g. capecitabine vs UFT/Ftorafur vs Eniluracil + oral 5‐FU vs doxifluridine vs S‐1).
-
Oxaliplatin‐based versus irinotecan‐based therapy received (among participants treated with palliative intent for inoperable advanced or metastatic CRC who received combination chemotherapy).
-
Bevacizumab (BEV) received versus not received (among participants treated with palliative intent for inoperable advanced or metastatic CRC who received combination chemotherapy) ‐ this was a post hoc analysis for the PFS outcome only.
Sensitivity analysis
We performed the following sensitivity analyses for primary outcomes to evaluate the robustness of meta‐analysis results.
-
Excluded studies assessed as having 'High' risk of bias (DFS and PFS).
-
Excluded Seymour 2011, wherein the study population differed from the study populations of most studies (frail and elderly) (PFS).
-
Excluded studies of second‐line palliative chemotherapy and studies that included a combination of first‐ and second‐line palliative chemotherapy (PFS).
In response to an editor suggestion, for the comparison of oral versus IV fluoropyrimidines in patients treated with curative intent for CRC with neoadjuvant and/or adjuvant chemotherapy, we performed a sensitivity analysis for grade ≥ 3 HFS, which incorporated heterogeneity by using a random‐effects model (REM) for meta‐analysis in Review Manager software (DerSimonian 1986; RevMan [Computer Program]).
'Summary of findings' table
We assessed the quality of evidence for all outcomes using the Grading of Recommendations Assessment, Development, and Evaluation (GRADE) approach (Guyatt 2008a; Guyatt 2008b). We used GRADEpro (GRADEpro [Computer program]) to create 'Summary of findings' tables for the following outcomes, which we assessed as most important.
-
Patients treated with curative intent for CRC with neoadjuvant and/or adjuvant chemotherapy.
-
DFS.
-
OS.
-
Grade ≥ 3 diarrhoea.
-
Grade ≥ 3 HFS.
-
Grade ≥ 3 neutropenia/granulocytopenia.
-
-
Patients treated with palliative intent for inoperable advanced or metastatic CRC with chemotherapy.
-
PFS.
-
OS.
-
Grade ≥ 3 diarrhoea.
-
Grade ≥ 3 HFS.
-
Grade ≥ 3 neutropenia/granulocytopenia.
-
We classified the quality of evidence into one of four grades.
-
High quality: We are very confident that the true effect lies close to that of the estimate of the effect.
-
Moderate quality: We are moderately confident in the effect estimate: The true effect is likely to be close to the estimate of the effect, but there is a possibility that it is substantially different.
-
Low quality: Our confidence in the effect estimate is limited: The true effect may be substantially different from the estimate of the effect.
-
Very low quality: We have very little confidence in the effect estimate: The true effect is likely to be substantially different from the estimate of effect.
We downgraded the quality by one (serious concern) or two (very serious concern) levels for the following reasons: risk of bias, inconsistency (unexplained heterogeneity, inconsistency of results), indirectness of evidence (indirect population, intervention, control, outcomes), imprecision of results (wide confidence intervals), and risk of publication bias.
Protocol
The protocol for this review was published on 17 March 2010 (Chionh 2010).
Results
Description of studies
Results of the search
We have presented in Figure 1 the workflow for studies identified and included in the review.
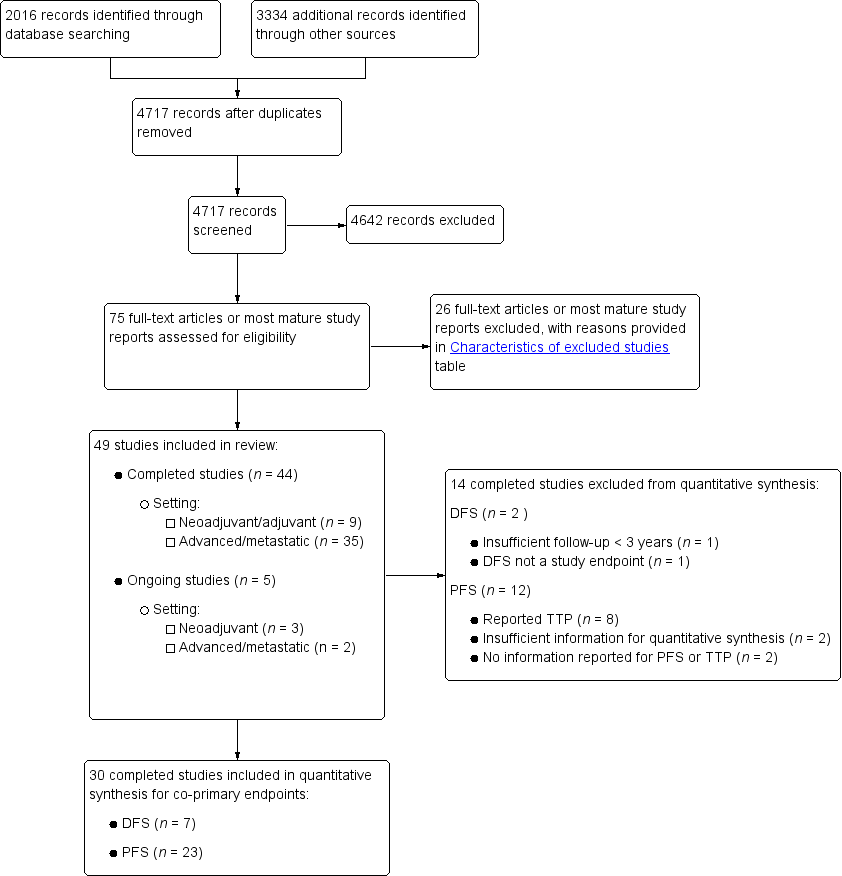
Study flow diagram.
Using the search strategy described, we identified 2016 records from bibliographic databases and 3334 additional records through searches of 'other sources', which included trials registers and conference proceedings. We contacted pharmaceutical companies, and Taiho, Orzel, Adherex, and Roche provided us with lists of potentially eligible studies. After removing duplicates, we screened a total of 4717 records for inclusion.
Of these, we assessed the full‐text reports or the most mature study reports for 75 potentially eligible studies, and we identified 49 studies that met review inclusion criteria. Forty‐four of the included studies were completed studies (Characteristics of included studies), and five were ongoing, with ongoing accrual or follow‐up (Characteristics of ongoing studies). We had two studies translated from Chinese to English (Yu 2005; Mei 2014), and one from Korean to English (Kim 2001a) before we extracted data.
Included studies
Design
We included 44 studies in the review.
The nine studies of curative intent treatment with neoadjuvant and/or adjuvant chemotherapy for CRC included 10,918 randomised participants (Table 1). These included eight phase 3 studies and one study that did not specify the phase of the study. One study of neoadjuvant treatment had a 2 × 2 factorial design (Allegra 2015).
| Treatment setting | Study ID | Phase | Treatment type | Treatment arm/s (oral), n randomised | Treatment arm/s (IV), n randomised | IV arm: bolus vs Infusional |
| Neoadjuvant | Rectal | |||||
| III | Fluoropyrimidine combined with RT | Capecitabine (Grp 2), n = 146 Capecitabine (Grp 5), n = 326 Capecitabine + oxaliplatin (Grp 6), n = 330 | 5‐FU (Grp 1), n = 147 5‐FU (Grp 3), n = 330 5‐FU + oxaliplatin (Grp 4), n = 329 | Infusional | ||
| III | Fluoropyrimidine combined with RT | UFT (Tegafur/Uracil) + LV with RT, n = 78 | 5‐FU + LV with RT, n = 77 | Bolus | ||
| Neoadjuvant/ Adjuvant | Rectal | |||||
| III | Fluoropyrimidine combined with RT | Capecitabine with RT, n = 197 ∙ Adjuvant cohort: n = 116 ∙ Neoadjuvant cohort: n = 81 | 5‐FU with RT, n = 195 ∙ Adjuvant cohort: n = 115 ∙ Neoadjuvant cohort: n = 80 | Bolus and infusional | ||
| Adjuvant | Rectal | |||||
| ND | Fluoropyrimidine combined with RT (after completion of 2C of fluoropyrimidine alone) | 5‐dFUR + LV, n = 92 | 5‐FU + LV, n = 74 | Bolus | ||
| Colon | ||||||
| III | Combination chemotherapy ‐ Oxaliplatin + Bevacizumab (BEV) | BEV‐XELOX, n = 952 | BEV‐FOLFOX4, n = 960 | Infusional | ||
| III | Fluoropyrimidine alone | UFT + LV, n = 805 | 5‐FU + LV, n = 803 | Bolus | ||
| III | Fluoropyrimidine alone | UFT + LV, n = 551 | 5‐FU + LV, n = 550 | Bolus | ||
| III | Fluoropyrimidine alone | Capecitabine, n = 1004 | 5‐FU + LV, n = 983 | Bolus | ||
| Colorectal | ||||||
| III | Combination chemotherapy ‐ fluoropyrimidine + oxaliplatin | CAPOX (capecitabine + oxaliplatin), n = 197 | mFOLFOX6, n = 211 | Infusional | ||
IV: intravenous
RT: radiotherapy
5‐FU: 5‐fluorouracil
UFT: tegafur/uracil
LV: leucovorin
ND: no data available
5‐dFUR: doxifluridine
BEV: bevacizumab
The 35 studies of palliative intent treatment with chemotherapy for inoperable advanced or metastatic CRC included 12,592 randomised participants (Table 2; Table 3). These included 10 phase 2 and 17 phase 3 studies, along with six studies that did not specify the phase of the study. Study authors described one study as phase 4 in previous abstracts but specified no phase in the journal report (Nogue 2005), and another study as phase 2/3 (Yasui 2015). Three of these studies used a 2 × 2 factorial design (Cassidy 2011a; Kohne 2008; Seymour 2011). Fuchs 2007 used a 3 × 2 factorial design to compare FOLFIRI, irinotecan plus bolus FU/LV (mIFL), and irinotecan plus oral capecitabine (CapeIRI) in period 1 of the trial, which was the only study period of interest for this review.
| Oral fluoropyrimidine backbone | Study ID | Phase | Treatment line | Treatment arm/s (Oral), n randomised | Treatment arm/s (IV), n randomised | IV arm: Bolus vs Infusional |
| Capecitabine | III | First | Capecitabine, n = 302 | 5‐FU + LV, n = 303 | Bolus | |
| III | First | Capecitabine, n = 301 | 5‐FU + LV, n = 301 | Bolus | ||
| Doxifluridine (5‐dFUR) | II | First | 5‐dFUR + LV, n = 38 | 5‐FU + LV, n = 39 | Bolus | |
| II | First | 5‐dFUR + LV, n = 67 | 5‐dFUR + LV, n = 63 | Bolus | ||
| Eniluracil + oral 5‐FU | III | First | Eniluracil/Oral 5‐FU, n = 61 | 5‐FU, n = 64 | Infusional | |
| III | First | Eniluracil/Oral 5‐FU, n = 488 | 5‐FU + LV, n = 493 | Bolus | ||
| III | First | Eniluracil/Oral 5‐FU, n = 268 | 5‐FU + LV, n = 263 | Bolus | ||
| Ftorafur/tegafur (FT) | ND | First | Ftorafur, n = 30 | 5‐FU, n = 30 | Bolus | |
| Unclear; described as Phase IV in abstracts | First | FT + LV, n = 114 | 5‐FU + LV, n = 123 | Bolus | ||
| Ftorafur + uracil (UFT) | III | First | UFT + LV, n = 190 | 5FU + LV, n = 190 | Bolus | |
| III | First | UFT + LV, n = 409 | 5‐FU + LV, n = 407 | Bolus |
IV: intravenous
5‐FU: 5‐fluorouracil
LV: leucovorin
5‐dFUR: doxifluridine
ND: no data available
FT: tegafur
UFT: tegafur + uracil
| Chemotherapy | Study ID | Phase | Study design ‐ other details | Treatment line | Treatment arm/s (Oral), n randomised | Treatment arm/s (IV), n randomised | IV arm: Bolus vs Infusional |
| Oxaliplatin | Combination with capecitabine | ||||||
| III | 2 × 2 factorial ‐ following protocol amendment | First | XELOX alone, n = 317 | FOLFOX‐4 alone, n = 317 | Infusional | ||
| XELOX + Placebo, n = 350 | FOLFOX‐4 + Placebo, n = 351 | Infusional | |||||
| XELOX + BEV, n = 350 | FOLFOX‐4 + BEV, n = 350 | Infusional | |||||
| III | First | OXXEL (Capecitabine + oxaliplatin), n = 158 | OXAFAFU (5‐FU/LV + Oxaliplatin), n = 164 | Bolus | |||
| III | First | XELOX, n = 174 | FUOX (5‐FU + Oxaliplatin), n = 174 | Infusional | |||
| III | First | XELOX, n = 156 | FOLFOX‐6, n = 150 | Infusional | |||
| ND | First | CapeOx, n = 50 | mFOLFOX6, n = 50 | Infusional | |||
| bFOL, n = 50 | Bolus | ||||||
| ND | First | CapeOx + BEV, n = 74 | mFOLFOX6 + BEV, n = 75 | Infusional | |||
| bFOL + BEV, n = 74 | Bolus | ||||||
| II | First | XELOX, n = 62 | pviFOX, n = 56 | Infusional | |||
| III | First | CAPOX, n = 242 | FUFOX, n = 234 | Infusional | |||
| III | Second | XELOX, n = 313 | FOLFOX‐4, n = 314 | Infusional | |||
| ND | 2 × 2 factorial, cross‐over (only from no oxaliplatin to oxaliplatin) | First | Capecitabine or OxCap, n = 229 ∙ Capecitabine, n = 115 ∙ OxCap, n = 114 | 5‐FU or OxFU, n = 230 ∙ 5‐FU, n = 115 ∙ OxFU, n = 115 | Infusional | ||
| Combination with Ftorafur/uracil (UFT) | |||||||
| II | First | UFOX + Cetuximab, n = 152 | FOLFOX4 + Cetuximab, n = 150 | Infusional | |||
| Combination with S‐1 | |||||||
| ND | First | SOX, n = 35 | FOLFOX4, n = 35 | Infusional | |||
| III | First | SOX‐BEV, n = 256 | mFOLFOX6‐BEV, n = 256 | Infusional | |||
| II | First | SOL (S‐1 + oxaliplatin + oral LV), n = 56 | mFOLFOX6, n = 51 | Infusional | |||
| Irinotecan | Combination with capecitabine | ||||||
| II | First | XELIRI + BEV, n = 72 | FOLFIRI + BEV, n = 73 | Infusional | |||
| III | 3 × 2 factorial (Period 1) | First | CapeIRI + Celecoxib/Placebo, n = 145 | FOLFIRI + Celecoxib/Placebo, n = 144 | Infusional | ||
| mIFL + Celecoxib/Placebo, n = 141 | Bolus | ||||||
| III | 2 × 2 factorial | First | CAPIRI + Celecoxib/Placebo, n = 44 | FOLFIRI + Celecoxib/Placebo, n = 41 | Infusional | ||
| III | First | XELIRI + BEV, n = 143 | FOLFIRI + BEV, n = 142 | Infusional | |||
| II | First | XELIRI, n = ND | FOLFIRI, n = ND | Infusional | |||
| II | First | CAPIRI + BEV, n = 168 | FOLFIRI + BEV, n = 168 | Infusional | |||
| ND | First and second | Capecitabine + Irinotecan, n = 27 | 5‐FU + Irinotecan, n = 16 | Infusional | |||
| Combination with Ftorafur/uracil (UFT) | |||||||
| II | First | TEGAFIRI (UFT, leucovorin, irinotecan) ± BEV, n = 35 | FOLFIRI ± BEV, n = 36 | Infusional | |||
| Combination with S‐1 | |||||||
| II | First and second | Sequential IRIS‐BEV, n = 30 | mFOLFIRI‐BEV, n = 30 | Infusional | |||
| II/III | Second | IRIS (Irinotecan + S‐1), n = 213 | FOLFIRI, n = 213 | Infusional | |||
IV: intravenous
BEV: bevacizumab
ND: no data available
UFT: tegafur/uracil
Sample size
Most studies reported a planned sample size with power considerations based on comparisons of efficacy or safety.
Among the studies of curative intent treatment with neoadjuvant and/or adjuvant chemotherapy for CRC, Kim 2001a did not report sample size calculations. Sample size calculations for De Gramont 2012 were based on the DFS hazard rates for BEV‐FOLFOX4 versus FOLFOX4 or BEV‐capecitabine plus oxaliplatin (XELOX) versus FOLFOX4 in patients with stage III disease. However, we compared treatment effects of BEV‐XELOX versus BEV‐FOLFOX4 in this review.
Among the studies of palliative intent treatment with chemotherapy for inoperable advanced or metastatic CRC, six studies did not report sample size calculations (Ahn 2003; Andersen 1987; Mei 2014; Silvestris 2010; Van Cutsem 2001b (in abstract form only); Yu 2005), and in three studies, reported sample size calculations did not include power considerations based on comparisons of outcomes between treatment arms (Hochster TREE‐1 2008; Hochster TREE‐2 2008; Martoni 2006). Three other studies used a non‐comparative design (Bajetta 1996; Douillard 2014; Ducreux 2013).
Participants
No studies reported that they included patients younger than 18 years of age (information on youngest age was not provided for Kim 2001a, Lembersky 2006, Van Cutsem 2001a, and Yu 2005). Six out of nine studies of curative intent treatment with neoadjuvant and/or adjuvant chemotherapy for CRC placed an upper limit on the age of eligible patients (Lembersky 2006 (upper limit 60 years); Kim 2001a (upper limit 70 years); Pectasides 2015, Shimada 2014, Twelves 2012 (upper limit 75 years); Bajetta 1996 (upper limit 80 years)). Nine out of 35 studies of palliative intent treatment with chemotherapy for inoperable advanced or metastatic CRC placed an upper limit on age of eligible patients (Ahn 2003; Ducreux 2013; Kato 2012; Mei 2014; Shigeta 2016; Yasui 2015; Yu 2005 (upper limit 75 years); Bajetta 1996, Yamada 2013 (upper limit 80 years)).
All studies included both male and female participants.
Treatment type and line of treatment
Among studies of curative intent treatment for CRC, two studies examined neoadjuvant treatment alone for rectal carcinoma (De la Torre 2008; Allegra 2015), and one study explored use of both neoadjuvant and adjuvant treatment for rectal carcinoma (Hofheinz 2012). Six studies examined adjuvant treatment alone, including four studies for colon carcinoma (De Gramont 2012; Lembersky 2006; Shimada 2014; Twelves 2012), one study for rectal carcinoma (Kim 2001a), and one study for carcinoma of the colon or rectum (Pectasides 2015) (Table 1). Among studies that included patients with rectal carcinoma, two studies required the distal border of the tumour to be < 12 cm from the anal verge (Allegra 2015; Kim 2001a), one study required the distal border of the tumour to be < 16 cm from the anal verge (Hofheinz 2012), and two studies did not describe anatomical criteria (De la Torre 2008; Pectasides 2015).
Among studies of palliative intent treatment with chemotherapy for inoperable advanced or metastatic CRC, 31 were performed exclusively in the first‐line setting. One study had exclusion criteria that specified “no past history of chemotherapy or chemotherapy ceased for over six months” and included patients in the report who had been given first‐ and second‐line treatment (Yu 2005). Kato 2012 included patients given first‐ or second‐line treatment; if treatment was second‐line, first‐line therapy with FOLFOX was mandated. Two studies were conducted in the second‐line setting ‐ one in combination with oxaliplatin (Rothenberg 2008) and one in combination with irinotecan (Yasui 2015) (Table 2; Table 3).
Location
Among studies of curative intent treatment with neoadjuvant and/or adjuvant chemotherapy for CRC, capecitabine trials were performed in Greece (Pectasides 2015), in Europe (Hofheinz 2012), and in the USA, Europe, Asia, Australia, and other countries (Twelves 2012; De Gramont 2012). The Allegra 2015 study was predominantly performed in North America. UFT studies were conducted at sites in Asia (Shimada 2014), Europe (De la Torre 2008), and North America (Lembersky 2006). The single doxifluridine study was performed in Asia only (Kim 2001a).
Among studies of palliative intent treatment with palliative chemotherapy for inoperable advanced or metastatic CRC, all four S‐1 trials were performed in Asia only (Kato 2012; Yamada 2013; Yamazaki 2015; Yasui 2015). One Asia‐only study used capecitabine (Yu 2005); nine studies were conducted in Europe or included both European and non‐USA sites. Additionally, three European Intergroup studies were carried out ‐ Gruppo Oncologico Aree Metropolitane ‐ GOAM (Martoni 2006); Gruppo Oncologico dell'Italia Meriodionale ‐ GOIM (Silvestris 2010); and European Organisation for Research and Treatment of Cancer ‐ EORTC (Kohne 2008). Two capecitabine studies were conducted in the USA (Hochster TREE‐1 2008; Hochster TREE‐2 2008), and four studies had sites in the USA and in other countries. UFT trials were conducted in Europe and in non‐USA countries (Carmichael 2002; Douillard 2014), and in the USA and in other countries (Douillard 2002). Non‐USA sites in the European UFT trials included Canada, Australia, New Zealand, and Israel (Carmichael 2002); and Asia, South America, Australia, and Israel (Douillard 2014); the Douillard 2002 study also included non‐USA sites in Europe, Canada, and Puerto Rico. One UFT study was based in Japan (Shigeta 2016). Tegafur was used in two European studies (Andersen 1987; Nogue 2005). Eniluracil was used in one USA study (ECOG E5296 2012); one study was performed in the USA and Canada (Schilsky 2002a), and one was an international study (Van Cutsem 2001a). Doxifluridine was used in Europe (Bajetta 1996), and in South Korea (Ahn 2003)(Characteristics of included studies).
Performance status
Although most studies included patients with ECOG PS 2 or less (or the equivalent Karnofsky PS (KPS)), the study population for Seymour 2011 comprised elderly and frail patients who were considered by the treating oncologist to be unsuitable for upfront full‐dose chemotherapy. One study (Andersen 1987) included patients with ECOG PS 3, although the proportion of patients with ECOG PS 3 was not clear (Characteristics of included studies).
Interventions
Among studies of curative intent treatment with neoadjuvant and/or adjuvant chemotherapy for CRC, three studies used fluoropyrimidines alone (not in combination with other chemotherapy or radiotherapy). These studies included the oral fluoropyrimidines UFT (Lembersky 2006; Shimada 2014) and capecitabine (Twelves 2012). Three other studies combined single‐agent fluoropyrimidines with radiotherapy, and included the oral fluoropyrimidines UFT (De la Torre 2008), capecitabine (Hofheinz 2012), and doxifluridine (Kim 2001a). One study of neoadjuvant treatment investigated radiotherapy in combination with oral and intravenous fluoropyrimidines and oxaliplatin (Allegra 2015). Two studies of adjuvant treatment compared combination chemotherapy regimens (De Gramont 2012; Pectasides 2015) (Table 1).
Among studies of palliative intent treatment with chemotherapy for inoperable advanced or metastatic CRC, 11 single‐agent studies compared IV fluoropyrimidines with the oral fluoropyrimidines capecitabine, doxifluridine, eniluracil/oral 5‐FU, and Ftorafur (Tegafur) or UFT. All but one study used IV 5‐FU; Bajetta 1996 compared oral and IV doxifluridine. All of the studies that examined IV 5‐FU as a single‐agent used bolus regimens, except ECOG E5296 2012, which used infusional IV 5‐FU (Table 2). All of the 24 studies that included combination chemotherapy used oxaliplatin or irinotecan (Table 3). Of the 14 studies that used oxaliplatin‐based combination chemotherapy, three trials included bolus 5‐FU arms (Comella 2009; Hochster TREE‐1 2008; Hochster TREE‐2 2008). Four studies that used oxaliplatin‐based combination chemotherapy examined combinations with the EGFR‐antibody cetuximab (Douillard 2014) or with BEV (Cassidy 2011a; Hochster TREE‐2 2008; Yamada 2013). Of the ten studies with irinotecan‐based combination chemotherapy, five trials included BEV‐containing arms (Ducreux 2013; Kato 2012; Pectasides 2012; Shigeta 2016; Souglakos 2012). Two further studies with a factorial design randomised participants to CAPIRI versus FOLFIRI plus celecoxib/placebo (Kohne 2008), or CapeIRI versus FOLFIRI versus mIFL plus celecoxib/placebo (Fuchs 2007).
Monitoring of compliance and adherence to oral treatment
Among studies of curative intent treatment with neoadjuvant and/or adjuvant chemotherapy for CRC, only one study (Lembersky 2006) reported monitoring of compliance and adherence to oral treatment.
Among studies of palliative intent treatment with chemotherapy for inoperable advanced or metastatic CRC, 10 studies (Ahn 2003; Bajetta 1996; Douillard 2002; Douillard 2014; Ducreux 2011; Martoni 2006; Rothenberg 2008; Schilsky 2002a; Seymour 2011; Shigeta 2016) described oral chemotherapy pill monitoring or use of a patient diary.
Outcomes
Patients treated with curative intent for CRC with neoadjuvant and/or adjuvant chemotherapy
Of the nine studies, all but one study assessed DFS. Kim 2001a examined rates of local and systemic recurrence but did not report DFS. Although De la Torre 2008 examined DFS, we did not include this study in the DFS meta‐analysis owing to insufficient median follow‐up time (22 months) (Table 1).
All of the studies apart from Kim 2001a reported the OS outcome. We excluded De la Torre 2008 from the meta‐analysis of OS owing to insufficient follow‐up time (Appendix 5).
All of the studies reported outcome data for at least one specific grade ≥ 3 AE of interest for this review, and all provided data that were suitable for meta‐analysis. Included studies reported information for specific grade ≥ 3 AEs: diarrhoea (n = 9), HFS (n = 7), neutropenia/granulocytopenia (n = 7), febrile neutropenia (n = 4), vomiting (n = 8), nausea (n = 7), stomatitis (n = 5), mucositis (n = 4), and hyperbilirubinaemia (n = 4). Two studies of adjuvant treatment (Hofheinz 2012; Kim 2001a) described 'lowered leucocytes' or 'leukopenia' only and were excluded from the meta‐analysis (Appendix 6). One study (Twelves 2012) reported combined data for grade ≥ 3 vomiting and nausea, and one study (De la Torre 2008) reported combined data for grade ≥ 3 stomatitis and mucositis. Table 4 shows the relationships between reported AEs and treatment for the included studies. Included studies used the following AE assessment criteria: ECOG CTC (n = 1), NCI CTCAE version 4.0 (n = 1), NCI CTCAE version 3.0 (n = 1), NCI CTCAE version 2.0 (n = 3), NCIC‐CTG CTC 1991 version (n = 1), NCI CTC 1958 (n = 1), and WHO, version not specified (n = 1).
| Setting | Related | Related and unrelated | Not specified |
| Patients treated with curative intent for CRC with neoadjuvant and/or adjuvant chemotherapy | |||
| Patients treated with palliative intent for inoperable advanced or metastatic CRC with chemotherapy
|
|
CRC: colorectal cancer
Overall, five studies presented data for 'any grade ≥ 3 AEs' (Allegra 2015; De Gramont 2012; Hofheinz 2012; Lembersky 2006; Twelves 2012).
Patients treated with palliative intent for inoperable advanced or metastatic CRC with palliative chemotherapy
Of the 35 studies, all but one study contributed to pooled effect estimates for an efficacy outcome and/or at least one grade ≥ 3 AE outcome (Silvestris 2010).
A total of 25 studies assessed PFS, and eight studies assessed the TTP outcome. Andersen 1987 did not assess either outcome. Hochster TREE‐1 2008, Hochster TREE‐2 2008, Hoff 2001, and Van Cutsem 2001b described TTP as the outcome examined but provided a definition compatible with the definition for PFS provided in this review. Bajetta 1996 stated that time to treatment failure was the examined outcome but provided a definition compatible with the definition for PFS provided in this review. Ahn 2003 described PFS as the examined outcome but provided a definition compatible with the classification for TTP provided in this review. We excluded Hochster TREE‐1 2008 and Hochster TREE‐2 2008 (for the PFS endpoint) and Silvestris 2010 and Yu 2005 (for the TTP endpoint) from our meta‐analyses because we could not estimate the HRs either directly or indirectly from the information provided (Appendix 7). Douillard 2002 presented only median TTP times with a stratified log‐rank P value.
Thirty‐one studies reported the OS outcome. Kato 2012, Martoni 2006, Mei 2014, and Silvestris 2010 did not report the OS outcome, and we excluded Andersen 1987 and Yu 2005 from our quantitative synthesis because we could not estimate the HR either directly or indirectly from the report (Appendix 7).
All 35 studies assessed ORR using the following criteria: WHO 1979 (n = 3), WHO 1981 (n = 4), modified WHO (n = 2), RECIST, version 1.0 (n = 21), RECIST, version not specified (n = 1), ECOG (n = 1), and SWOG (n = 1). Two studies did not specify this information (Van Cutsem 2001a; Yu 2005). We excluded Mei 2014 and Seymour 2011 from meta‐analysis because investigators reported ORR only after two cycles of chemotherapy and at 12 to 14 weeks after the start of treatment, respectively. We excluded Silvestris 2010 because investigators assessed an unclear number of participants for ORR in both arms (Appendix 7). Of the 32 studies included in the meta‐analysis, 22 studies provided information on the number of participants assessable or evaluable for response. One study did not specify a separate ORR analysis population denominator (Van Cutsem 2001a).
All but one included study (Andersen 1987) reported outcome data on grade ≥ 3 AEs of interest for this review. Table 4 shows the relationship between reported AEs and treatment in the included studies. AE assessment criteria included NCI CTCAE, version 3.0 (n = 14); NCI CTCAE, version 2.0 (n = 9); NCI CTCAE, 1994 version (n = 2); NCI CTCAE, 1981 version (n = 1); NCI CTCAE, version not specified (n = 3); WHO, 1981 (n = 1); WHO, version not specified (n = 1); and an adaptation of SWOG, 1992 (n = 1). Two studies did not specify this information. Included studies provided information for specific grade ≥ 3 AEs as follows: diarrhoea (n = 30), HFS (n = 23), neutropenia/granulocytopenia (n = 29), febrile neutropenia (n = 19), vomiting (n = 23), nausea (n = 25), stomatitis (n = 21), mucositis (n = 12), and hyperbilirubinaemia (n = 12). Five trials provided combined grade ≥ 3 stomatitis and mucositis data (Carmichael 2002; Douillard 2002; Shigeta 2016; Yamada 2013; Yasui 2015), and eight studies reported combined grade ≥ 3 nausea and vomiting data (Ahn 2003; Carmichael 2002; Cassidy 2011a; Douillard 2002; Hochster TREE‐1 2008; Hochster TREE‐2 2008; Mei 2014; Nogue 2005). Fourteen studies presented data for 'any grade ≥ 3 AEs'. Three studies did not specify a separate safety analysis denominator (Comella 2009; Porschen 2007; Van Cutsem 2001a). Kato 2012 reported grade ≥ 3 AEs up to 12 weeks.
Four studies had no grade ≥ 3 AE outcomes that were suitable for meta‐analysis. Of these, one study included an unclear number of participants in the safety analysis population and unclear units of analysis (Ahn 2003). Andersen 1987 did not report any grade ≥ 3 AE outcomes. Silvestris 2010 included an unclear number of participants in the safety analysis population for each arm. For Yu 2005, it is unclear whether investigators reported AEs for the entire study population or only for a subset owing to discrepancies between the table title and participant numbers provided in the table (Appendix 8). Two additional included studies reported only 'leukopenia' or lowered 'white blood cells' (Bajetta 1996; Kohne 2008). One study reported grade 2 and 3 HFS (Porschen 2007), and one trial reported toxicities affecting skin/appendages which included but were not confined to HFS (Carmichael 2002). We did not include these studies in the meta‐analysis for neutropenia/granulocytopenia and HFS outcomes, respectively (Appendix 6).
Early stopping
Among studies of curative intent treatment for CRC, one study of neoadjuvant treatment (De la Torre 2008) was stopped early owing to slow accrual after 63% of the number of participants planned for accrual had been randomised. For similar reasons, one study of adjuvant treatment (Pectasides 2015) was prematurely closed after 55% of participants were enrolled.
Among studies of palliative intent treatment with chemotherapy for inoperable advanced or metastatic CRC, four studies were stopped early: Nogue 2005 owing to slow accrual, when 85% of the planned number of participants for accrual to the study had been randomised; ECOG E5296 2012 after 125 of the 950 planned participants had been accrued, owing to negative results from two other studies of eniluracil with oral 5‐FU (Schilsky 2002a; Van Cutsem 2001a); Kohne 2008 after enrolment of only 85 participants as a consequence of seven deaths that were assessed as unrelated to disease progression; and Fuchs 2007 after 547 of the 900 participants for Periods 1 and 2 combined had been enrolled. Accrual to this trial had slowed after reports described cardiovascular concerns with celecoxib, although celecoxib/placebo administration was permanently discontinued for patients in January 2005.
Excluded studies
For this review, we classified studies as excluded only when a reader might plausibly expect them to be eligible for inclusion. We have provided reasons for exclusion of 26 such studies in the Characteristics of excluded studies table. We most commonly excluded studies because investigators did not confirm histologically proven colorectal adenocarcinoma as an inclusion criterion, or, in the case of cross‐over studies, because researchers permitted cross‐over in only one arm or treated participants with an insufficient number of chemotherapy cycles before cross‐over.
Risk of bias in included studies
We analysed all nine studies of curative intent treatment with neoadjuvant and/or adjuvant chemotherapy for CRC and 35 studies of palliative intent treatment with chemotherapy for inoperable advanced or metastatic CRC for risk of bias using the 10 domains described below (Assessment of risk of bias in included studies; Figure 2; Figure 3).

Risk of bias graph: review authors' judgements about each risk of bias item presented as percentages across all included studies.1
1 In this graph, the risk of bias for each domain was calculated using the worst assessment documented for that domain in the contributing studies.
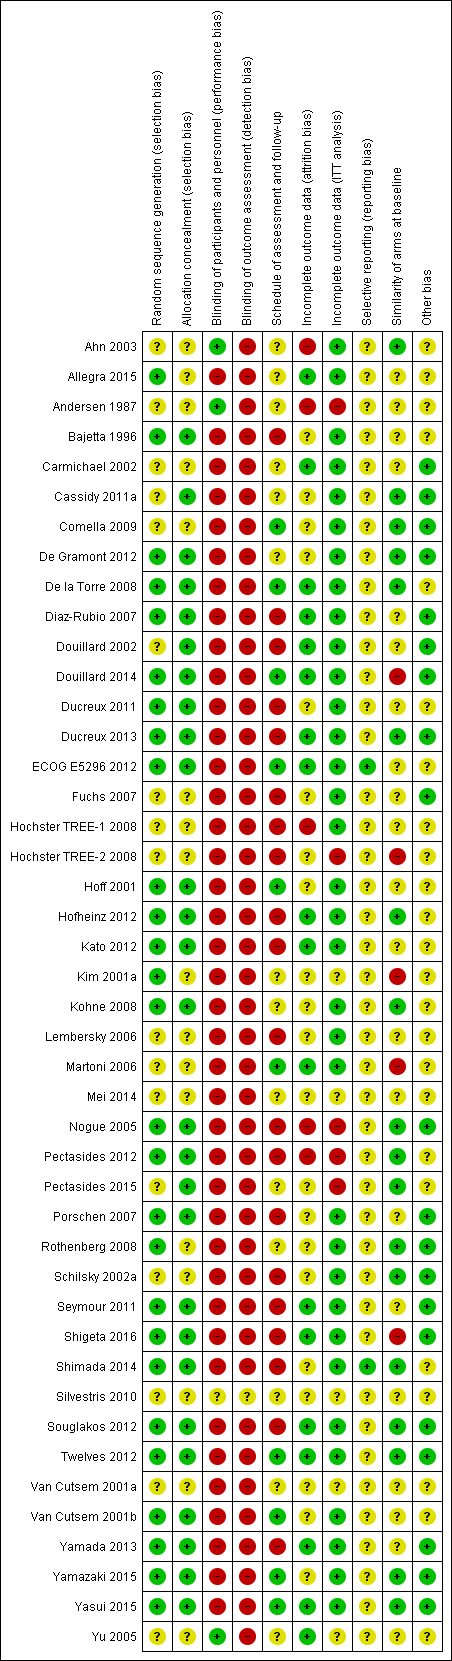
Risk of bias summary: review authors' judgements about each risk of bias item for each included study.1
1 In this summary, the risk of bias for each domain was scored using the worst assessment documented for that domain in the study.
The following section describes risk of bias in the 43 studies that contributed to pooled effect estimates for each outcome (Table 5 and Table 6). We did not include Silvestris 2010 in the pooled effect estimates for any of the outcomes in this review. This study had 'Unclear' risk of bias in all domains.
| Study ID | Outcome | |||||||||||
| Efficacy | Grade ≥ 3 AE | |||||||||||
| DFS | OS | Diarrhoea | HFS | Neutropenia/ granulocytopenia | Febrile neutropenia | Vomiting | Nausea | Stomatitis | Mucositis | Hyperbilirubinemia | Any | |
| X | X | X | X | X | X | X | X | X | X | X | ||
| X | X | X | X | X | X | X | X | |||||
| Oa | Oa | X | Ob | X | X | X | Xc | Xc | ||||
| X | X | X | X | X | X | X | X | X | X | |||
| X | X | |||||||||||
| X | X | X | X | X | X | X | X | |||||
| X | X | X | X | X | X | X | X | X | ||||
| X | X | X | X | X | X | X | X | X | ||||
| X | X | X | Ob | X | Xd | Xd | X | Oe | X | |||
X: Study contributed to the pooled effect estimate for the outcome
O: Study reported the outcome but did not contribute to the pooled effect estimate for the outcome
aInsufficient follow‐up time ‐ median 22 months in each arm (< 3 years)
bAssessed grade ≥ 3 HFS using criteria not considered to be sufficiently similar to National Cancer Institute Common Terminology Criteria for Adverse Events (NCI CTCAE) (versions 2.0 to 4.0)
cReported combined data for grade ≥ 3 stomatitis and mucositis
dReported combined data for grade ≥ 3 vomiting and nausea
eAssessed grade 3 ≥ hyperbilirubinaemia using criteria not considered to be sufficiently similar to NCI CTCAE (versions 2.0 to 4.0 and 1981) and World Health Organisation (WHO) (1981 version)
AE: adverse event
DFS: disease‐free survival
OS: overall survival
HFS: hand foot syndrome
| Study ID | Outcome | |||||||||||||
| Efficacy | Grade ≥ 3 AE | |||||||||||||
| PFS | TTP | OS | ORR | Diarrhoea | HFS | Neutropenia/ granulocytopenia | Febrile neutropenia | Vomiting | Nausea | Stomatitis | Mucositis | Hyperbilirubinemia | Any | |
| X | X | X | Oa | Oa | Oa | Oa | ||||||||
| Ob | X | |||||||||||||
| X | X | X | X | X | ||||||||||
| X | X | X | X | X | X | Xc | Xc | Xd | Xd | Oe | ||||
| X | X | X | X | X | X | X | Xc | Xc | X | X | ||||
| X | X | X | X | X | X | X | ||||||||
| X | X | X | X | X | X | X | X | X | X | X | ||||
| X | X | X | X | Of | X | X | Xc | Xc | Xd | Xd | Oe | |||
| X | X | X | X | X | X | X | X | X | X | X | X | X | ||
| X | X | X | X | X | X | X | X | X | X | |||||
| X | X | X | X | X | X | X | X | X | X | X | ||||
| X | X | X | X | X | X | X | X | X | X | X | ||||
| X | X | X | X | X | X | X | X | X | ||||||
| Ob | X | X | X | X | X | Xc | Xc | X | ||||||
| Ob | X | X | X | X | X | Xc | Xc | X | ||||||
| X | X | X | X | Og | X | X | X | X | X | |||||
| X | X | X | X | X | X | X | X | X | ||||||
| X | X | X | X | X | X | X | X | X | ||||||
| X | X | X | X | X | X | X | ||||||||
| Oh | X | X | Xc | Xc | ||||||||||
| X | X | X | X | X | Xc | Xc | X | |||||||
| X | X | X | X | X | X | X | X | X | X | X | ||||
| X | X | X | X | X | X | X | X | |||||||
| X | X | X | X | X | X | X | X | X | X | Oi | X | |||
| X | X | X | X | Og | X | X | X | X | X | |||||
| X | X | Oj | X | X | X | X | X | X | X | |||||
| X | X | X | X | X | X | X | X | Xd | Xd | X | X | |||
| Ob | Oa | Oa | Oa | |||||||||||
| X | X | X | X | X | X | X | X | X | X | |||||
| X | X | X | X | X | X | X | ||||||||
| X | X | X | X | Og | X | X | X | X | ||||||
| X | X | X | X | X | X | X | X | X | Xd | Xd | X | |||
| X | X | X | X | X | X | X | X | X | ||||||
| X | X | X | X | X | X | X | Xd | Xd | ||||||
| Ob | Ob | X | Oa | Oa | Oa | Oa | Oa | |||||||
X: Study contributed to the pooled effect estimate for the outcome
O: Study reported the outcome but did not contribute to the pooled effect estimate for the outcome
aUnclear number of participants assessed for outcomes in both arms
bHazard ratios could not be estimated either directly or indirectly from the provided information
cReported combined data for grade ≥3 vomiting and nausea
dReported combined data for grade ≥3 stomatitis and mucositis
eAssessed grade ≥ 3 hyperbilirubinaemia using Common Toxicity Criteria (CTC), version not specified
fAssessed grade ≥ 3 HFS using CTC, version not specified
gAssessed grade ≥ 3 HFS using criteria not considered to be sufficiently similar to National Cancer Institute Common Terminology Criteria for Adverse Events (NCI CTCAE) (versions 2.0 to 4.0)
hORR reported after 2 cycles of chemotherapy
iAssessed grade ≥3 hyperbilirubinaemia using criteria not considered to be sufficiently similar to NCI CTCAE (versions 2.0 to 4.0 and 1981) and World Health Organisation (WHO) (1981 version)
jORR reported 12 to 14 weeks after start of treatment
AE: adverse event
PFS: progression‐free survival
TTP: time to progression
OS: overall survival
ORR: objective response rate
HFS: hand foot syndrome
Allocation
Random sequence generation
Studies assessed as 'Low' risk used random sequence generation methods including minimisation, varying block size, and computer‐assisted randomisation.
Studies of curative intent treatment with neoadjuvant and/or adjuvant chemotherapy for CRC
We assessed seven curative intent studies as 'Low' risk. Two curative intent studies had 'Unclear' risk of bias owing to unspecified methods of randomisation, and we did not assess any studies as having 'High' risk of bias.
Studies of palliative intent treatment with chemotherapy for inoperable advanced or metastatic CRC
We assessed 20 palliative intent studies as 'Low' risk. Fifteen palliative intent studies had ‘Unclear’ risk of bias owing to unspecified methods of randomisation, and we did not assess any studies as having 'High' risk of bias.
Allocation concealment
Studies assessed as 'Low' risk used central randomisation by fax, interactive voice response system (IVRS), computer, and central centre.
Studies of curative intent treatment with neoadjuvant and/or adjuvant chemotherapy for CRC
We assessed seven curative intent studies as 'Low' risk. Two curative intent studies had 'Unclear' risk of bias owing to lack of information about allocation concealment, and we did not assess any studies as having 'High' risk of bias.
Studies of palliative intent treatment with chemotherapy for inoperable advanced or metastatic CRC
We assessed 21 palliative intent studies as 'Low' risk. Fourteen palliative intent studies had 'Unclear' risk of bias owing to lack of information about allocation concealment, and we did not assess any studies as having 'High' risk of bias.
Blinding
Blinding of participants/personnel
One study described a 'double‐blind method' (Yu 2005); however, we judged this to be unclear and unlikely, as investigators did not describe placebo in either the oral or IV treatment arms. No other studies described blinding of participants and/or personnel.
DFS/PFS/TTP/ORR
We judged that lack of blinding of participants and/or personnel would not lead to ‘High’ risk of bias for these outcomes.
Studies of curative intent treatment with neoadjuvant and/or adjuvant chemotherapy for CRC
DFS outcome: We assessed the seven curative intent studies used in the meta‐analysis for this outcome to have 'Low' risk of bias.
Studies of palliative intent treatment with chemotherapy for inoperable advanced or metastatic CRC
PFS/TTP/ORR outcomes: We assessed the 33 palliative intent studies that contributed to at least one of these outcomes to have ‘Low’ risk of bias.
OS
We judged that lack of blinding of participants and/or personnel would not lead to ‘High’ risk of bias for these outcomes.
Studies of curative intent treatment with neoadjuvant and/or adjuvant chemotherapy for CRC
We assessed the seven curative intent studies used in the meta‐analysis for this outcome to have 'Low' risk of bias.
Studies of palliative intent treatment with chemotherapy for inoperable advanced or metastatic CRC
We assessed the 29 palliative intent studies used in the meta‐analysis for this outcome to have 'Low' risk of bias.
Grade ≥ 3 AEs
We judged that lack of blinding of participants and personnel would lead to 'High' risk of bias for this outcome.
Studies of curative intent treatment with neoadjuvant and/or adjuvant chemotherapy for CRC
All nine curative intent studies that reported this outcome were open‐label and were deemed at 'High' risk of bias.
Studies of palliative intent treatment with chemotherapy for inoperable advanced or metastatic CRC
All 31 palliative intent studies that reported this outcome were open‐label and were deemed at 'High' risk of bias.
Blinding of outcome assessment
DFS/PFS/TTP/ORR
We judged that lack of blinding of outcome assessors would lead to 'High' risk of bias for this outcome.
Studies of curative intent treatment with neoadjuvant and/or adjuvant chemotherapy for CRC
DFS outcome: We assessed all seven curative intent studies to have 'High' risk of bias for detection of disease recurrence.
Studies of palliative intent treatment with chemotherapy for inoperable advanced or metastatic CRC
PFS/TTP/ORR: Of the 33 palliative intent studies that included these outcomes, eight studies had ‘Low’ risk, two had ‘Unclear’ risk, and 23 had 'High’ risk of bias. For all ‘Low’‐risk studies, blinded independent physicians/radiologists or an independent review committee (IRC) assessed response outcomes (Cassidy 2011a; Ducreux 2011; Hoff 2001; Kato 2012; Schilsky 2002a; Souglakos 2012; Van Cutsem 2001b; Yamazaki 2015). The two ‘Unclear’ risk studies used an unspecified method of assessment. In Rothenberg 2008 investigators as well as a blinded IRC assessed tumour response; however it remains unclear whether investigator assessments or IRC assessments were used for the reported PFS outcome. Carmichael 2002 evaluated response data locally, with subsequent central review. However, study authors did not specifically describe the role of the central review in the reported response data. 'High’‐risk studies were other open‐label studies that did not describe using blinded independent radiologists or an IRC to assess response outcomes.
OS
We judged that lack of blinding of outcome assessors would not lead to ‘High’ risk of bias for these outcomes.
Studies of curative intent treatment with neoadjuvant and/or adjuvant chemotherapy for CRC
We assessed seven curative intent studies used in the meta‐analysis for this outcome to have 'Low' risk of bias.
Studies of palliative intent treatment with chemotherapy for inoperable advanced or metastatic CRC
We assessed 29 palliative intent studies used in the meta‐analysis for this outcome to have 'Low' risk of bias.
Grade ≥ 3 AEs
We judged that lack of blinding of outcome assessors would lead to 'High' risk of bias for this outcome, in particular for assessment of subjective grade ≥ 3 AEs such as HFS, diarrhoea, vomiting, nausea, stomatitis, and mucositis. We did not judge that lack of blinding of outcome assessors would affect assessment of grade ≥ 3 neutropenia/granulocytopenia, febrile neutropenia, or hyperbilirubinaemia, as these rely upon objective laboratory assessments.
Studies of curative intent treatment with neoadjuvant and/or adjuvant chemotherapy for CRC
We assessed all nine curative intent studies used in the meta‐analysis for these outcomes to have 'High' risk of bias.
Studies of palliative intent treatment with chemotherapy for inoperable advanced or metastatic CRC
We assessed all 31 palliative intent studies used in the meta‐analysis for these outcomes to have 'High' risk of bias.
Incomplete outcome data
Attrition bias
We judged that studies with high percentages (≥ 20%) of non‐evaluable response data in at least one treatment arm had 'High' risk of bias.
ORR in studies of palliative intent treatment with chemotherapy for inoperable advanced or metastatic CRC
Of the 32 palliative intent studies that contributed to the ORR analysis, 23 studies had 'Low' risk of bias, four had 'Unclear’ risk, and five had ‘High’ risk. For Andersen 1987, ORR data were non‐evaluable for 20% of participants in the IV 5‐FU arm, and for Ahn 2003, ORR data were non‐evaluable for 29% of participants in the 5‐dFUR/LV arm. Twenty‐three per cent of participants in the CapeOx arm had missing confirmed tumour response data in Hochster TREE‐1 2008. Twenty‐four per cent (FT/LV) and 20% (5‐FU/LV) of participants in Nogue 2005 had non‐evaluable data for response owing to protocol deviations in response evaluation methods. In Pectasides 2012, 30.1% of participants in the XELIRI‐BEV arm and 19.7% of those in the FOLFIRI‐BEV arm had non‐evaluable response data owing to treatment discontinuation, early death, missing data, and non‐evaluable disease.
Time‐to‐event outcomes (DFS/PFS/OS/TTP)
Studies of curative intent treatment with neoadjuvant and/or adjuvant chemotherapy for CRC
Of the seven curative intent studies that contributed to DFS or OS (curative intent studies) pooled effect estimates, six studies had ‘Low’ risk of bias, and we judged one study to have ‘Unclear’ risk (Lembersky 2006).
Studies of palliative intent treatment with chemotherapy for inoperable advanced or metastatic CRC
Of the 31 palliative intent studies with a time‐to‐event outcome, 23 studies had ‘Low’ risk of bias with no or minimal missing data. Five studies had ‘Unclear’ risk. We judged three studies as having ‘High’ risk (Ahn 2003; Nogue 2005; Pectasides 2012).
Grade ≥ 3 AEs
Studies of curative intent treatment with neoadjuvant and/or adjuvant chemotherapy for CRC
Of the nine curative intent studies included in the meta‐analysis for these outcomes, four had no or minimal missing data, and we assessed these as 'Low' risk. Five studies had an unclear number of participants with missing data and had ‘Unclear’ risk of bias.
Studies of palliative intent treatment with chemotherapy for inoperable advanced or metastatic CRC
Of the 31 palliative studies that reported this outcome, 14 studies had no or minimal missing data, and we assessed these as 'Low' risk. The other 17 studies had an unclear number of participants with missing data and had ‘Unclear’ risk of bias.
ITT analysis
Efficacy analysis
We judged studies to be at 'Low' risk of bias if an ITT analysis was performed as per the definition in our review, or if < 5% of randomised participants were excluded from the analysis.
Studies of curative intent treatment with neoadjuvant and/or adjuvant chemotherapy for CRC
Six curative intent studies were at 'Low' risk and one study was at 'High' risk of bias (Pectasides 2015).
Studies of palliative intent treatment with chemotherapy for inoperable advanced or metastatic CRC
Twenty‐seven palliative intent studies were at 'Low' risk, two studies were at 'Unclear' risk, and four studies were at 'High' risk of bias (Andersen 1987; Hochster TREE‐2 2008; Nogue 2005; Pectasides 2012).
Safety analysis
Most studies performed a safety analysis in the as‐treated population, which included participants who had received at least one dose of chemotherapy.
Selective reporting
ECOG E5296 2012 and Shimada 2014 were the only studies for which a protocol was available. The technical report (ECOG E5296 2012) or the study report (Shimada 2014) included all of the outcomes described in the protocol, and we assessed these studies as ‘Low’ risk. All other studies had ‘Unclear’ risk.
Other potential sources of bias
Schedule of follow‐up and assessment
We judged studies to be at 'High' risk of bias if they used different schedules for assessment of disease recurrence/response, survival, and/or grade ≥ 3 AEs between treatment arms. For example, more frequent AE assessments in a treatment arm compared with the other treatment arm/s may have increased the likelihood of documenting and treating the toxicities of interest earlier. Similarly, more frequent disease recurrence, response, or survival assessments in a treatment arm compared with the other treatment arm/s may have increased the likelihood of documenting recurrence, progression, or death earlier. Variation in assessment schedules occurred because of differences in cycle lengths among treatment arms.
Disease recurrence/response (influences DFS/PFS/TTP/ORR)
This pertains to the detection of disease recurrence, response, and progression events.
Studies of curative intent treatment with neoadjuvant and/or adjuvant chemotherapy for CRC
Of the seven curative intent studies contributing to these outcomes, five had assessments performed at the same time and were at 'Low' risk of bias. Two did not specify the assessment schedule and were at 'Unclear' risk. No studies were at 'High' risk of bias.
Studies of palliative intent treatment with chemotherapy for inoperable advanced or metastatic CRC
Of the 33 palliative studies contributing to these outcomes, 23 studies had assessments performed at the same time and were at ‘Low’ risk of bias. Four palliative studies did not specify the assessment schedule and were at 'Unclear' risk. Six studies that we assessed as ‘High’ risk had differences in assessment schedules between study arms (Douillard 2002; Ducreux 2011; Nogue 2005; Pectasides 2012; Porschen 2007; Schilsky 2002a).
Survival (influences DFS/PFS/OS)
This pertains to detection of death events.
Studies of curative intent treatment with neoadjuvant and/or adjuvant chemotherapy for CRC
Of seven curative intent studies contributing to these outcomes, five studies had 'Low' risk of bias, and two had 'Unclear' risk.
Studies of palliative intent treatment with chemotherapy for inoperable advanced or metastatic CRC
Of 29 palliative intent studies contributing to these outcomes, two studies had ‘High’ risk of bias. In Hochster TREE‐1 2008, following treatment discontinuation, investigators collected follow‐up data for participants who consented retrospectively, but provided no information on the number of participants in each arm who consented and were followed up. Shigeta 2016 provided survival follow‐up at the discretion of the treating physician. We assessed a further 19 studies as 'Low' risk. Eight studies were at 'Unclear' risk owing to insufficient information.
Grade ≥ 3 AEs
This pertains to the detection of grade ≥ 3 AEs.
Studies of curative intent treatment with neoadjuvant and/or adjuvant chemotherapy for CRC
Of nine curative studies that contributed to the pooled estimate analysis, three studies (Hofheinz 2012; Lembersky 2006; Shimada 2014) had different AE assessment schedules between arms and were at ‘High’ risk. Two studies were at 'Low' risk, and four studies were at 'Unclear' risk.
Studies of palliative intent treatment with chemotherapy for inoperable advanced or metastatic CRC
Of the 31 palliative intent studies that contributed to the pooled estimate analysis, we considered 13 to have ‘High’ risk (Bajetta 1996; Diaz‐Rubio 2007; Ducreux 2013; Fuchs 2007; Hochster TREE‐1 2008; Hochster TREE‐2 2008; Kato 2012; Nogue 2005; Pectasides 2012; Schilsky 2002a; Seymour 2011; Souglakos 2012; Yamada 2013). We assessed nine studies as 'Low' risk, and nine studies as having 'Unclear' risk owing to insufficient information.
Baseline similarities
Studies of curative intent treatment with neoadjuvant and/or adjuvant chemotherapy for CRC
Of nine curative intent studies that contributed to meta‐analyses for any of the outcomes in this review, six studies were 'Low' risk, as participants in all treatment arms had similar baseline characteristics with regards to PS, median or mean age, and disease stage. Two studies had 'Unclear' risk, and one study had 'High' risk owing to a difference in mean age of 7.2 years (Kim 2001a).
Studies of palliative intent treatment with chemotherapy for inoperable advanced or metastatic CRC
Of the 34 palliative intent studies that contributed to meta‐analyses for any of the outcomes in this review, 12 studies had 'Low' risk of bias, as participants in all treatment arms had similar baseline characteristics with regards to PS, median or mean age, and number of organs involved with metastases, or KRAS mutation status in the case of EGFR inhibitor treatment. Eighteen studies had ’Unclear’ risk of bias. Four studies had ‘High’ risk of bias owing to differences between comparison arms. Hochster TREE‐2 2008 and Shigeta 2016 reported a five‐year difference in median age between oral and IV arms. Martoni 2006 described a 16.5% difference between arms with regards to the percentage with one versus more than one metastatic site at baseline. Douillard 2014 performed a post hoc analysis of participants evaluable for KRAS mutation status and found that a greater proportion of those in the UFOX + cetuximab arm (47/87; 54%) were KRAS mutant than in the FOLFOX4 + cetuximab arm (37/93; 40%). Whilst only 60% of the population was evaluable for KRAS mutation status, we considered that a 14% difference between oral and IV arms would lead to 'High' risk of bias.
Other bias
Studies of curative intent treatment with neoadjuvant and/or adjuvant chemotherapy for CRC
Two curative intent studies provided information about subsequent treatment with adjuvant chemotherapy or chemotherapy following a recurrence or a new occurrence of CRC (Allegra 2015; Twelves 2012); both had 'Low' risk of bias. The remaining seven curative intent studies did not provide this information and had 'Unclear' risk.
Studies of palliative intent treatment with chemotherapy for inoperable advanced or metastatic CRC
Twenty‐one palliative intent studies reported information about subsequent lines of treatment used for each treatment arm after disease progression. Study authors reported no major differences between treatment arms with regards to the percentage of participants who received subsequent therapy or the type of subsequent therapy used. None were at high risk of bias.
We identified no other reasons for high risk of bias in the included studies.
Risk of bias for outcomes
With respect to efficacy outcomes, we considered DFS in curative intent studies, and PFS, TTP, and ORR in palliative intent studies, to be outcomes at risk of detection bias owing to lack of blinding of outcome assessors. We did not judge OS in both curative intent and palliative intent studies to be at risk of bias owing to lack of blinding of outcome assessors.
With respect to adverse event outcomes, we considered the grade ≥ 3 AEs diarrhoea, HFS, vomiting, nausea, stomatitis, mucositis, and any grade ≥ 3 AEs to be subjective outcomes that were at risk of performance and detection bias if blinding of participants and personnel, and outcome assessors, was lacking, respectively. We considered the grade ≥ 3 AEs neutropenia/granulocytopenia, febrile neutropenia, and hyperbilirubinaemia to be objective outcomes that were not at risk of performance and detection bias from lack of blinding.
Patients treated with curative intent for CRC with neoadjuvant and/or adjuvant chemotherapy
DFS
We considered all seven curative intent studies that contributed to the pooled effect estimate for the DFS outcome to have high risk of detection bias owing to lack of blinding of outcome assessors (Table 7), and we downgraded this outcome for risk of bias. One study (Pectasides 2015) additionally had high risk of bias owing to lack of an ITT analysis.
| Risk of bias assessment | ||
| Low | Unclear | High |
| No studies | No studies | |
OS (curative intent studies)
We did not judge OS (curative intent studies) to be at risk of bias from lack of blinding of outcome assessors. One study (Pectasides 2015) had high risk of bias owing to lack of an ITT analysis. However, this study contributed only 4.2% of the weight for the pooled effect estimate for this outcome, and we did not downgrade this outcome for risk of bias.
Grade ≥ 3 AEs (curative intent studies)
Subjective outcomes
All nine curative intent studies that contributed to the subjective outcomes of grade ≥ 3 AEs diarrhoea, HFS, vomiting, nausea, stomatitis, mucositis, and any grade ≥ 3 AE had high risk of bias owing to lack of blinding; consequently, we downgraded these outcomes for risk of bias.
Four of these nine studies additionally had high risk of bias in other domains. Hofheinz 2012 (which contributed to all subjective grade ≥ 3 AE outcomes), Lembersky 2006 (which contributed to grade ≥ 3 diarrhoea, vomiting, nausea, stomatitis, and any grade ≥ 3 AE outcomes), and Shimada 2014 (which contributed to grade ≥ 3 diarrhoea, HFS, vomiting, and nausea outcomes) had high risk of bias owing to differences in schedules of assessment and/or follow‐up between treatment arms. Kim 2001a (which contributed to grade ≥ 3 diarrhoea and stomatitis) also had high risk of bias owing to a difference in baseline mean age of participants between treatment arms.
Objective outcomes
The grade ≥ 3 AEs neutropenia/granulocytopenia, febrile neutropenia, and hyperbilirubinaemia were objective outcomes and were not at risk of performance and detection bias from lack of blinding.
However, for grade ≥ 3 neutropenia/granulocytopenia (curative intent studies), Lembersky 2006 and Shimada 2014 had high risk of bias owing to differences in schedules of assessment and/or follow‐up between treatment arms. These studies contributed 7.3% of the weight for the pooled effect estimate for this outcome, and we did not downgrade this outcome for risk of bias.
No studies were at high risk of bias for the grade ≥ 3 febrile neutropenia (curative intent studies) outcome, and we did not downgrade this outcome for risk of bias.
For grade ≥ 3 hyperbilirubinaemia (curative intent studies), Hofheinz 2012 and Shimada 2014 were at high risk of bias owing to differences in schedules of assessment and/or follow‐up between treatment arms. These studies contributed 44.3% of the weight for the pooled effect estimate for this outcome, and we downgraded this outcome for risk of bias.
Studies of palliative intent treatment with chemotherapy for inoperable advanced or metastatic CRC
PFS
For the PFS outcome, 17 out of 23 studies had high risk of bias (Table 8). These studies contributed 48.5% of the pooled effect estimate for the PFS outcome, and we downgraded the PFS outcome for risk of bias.
| Risk of bias assessment | ||
| Low | Unclear | High |
Fifteen of these studies had high risk of detection bias owing to lack of blinding of outcome assessors (Bajetta 1996; Comella 2009; Douillard 2014;Ducreux 2013; ECOG E5296 2012; Fuchs 2007; Kato 2012; Kohne 2008; Pectasides 2012; Porschen 2007; Seymour 2011; Shigeta 2016; Van Cutsem 2001a; Yamada 2013; Yasui 2015). Four of these fifteen studies additionally had high risk of bias in other domains. Douillard 2014 had high risk of bias owing to an imbalance in the proportion of participants with KRAS mutations between oral and IV arms (within the population evaluable for KRAS mutation status) and high risk of detection bias. Pectasides 2012 had high risk of bias owing to detection bias, differences in schedules of assessment and/or follow‐up between arms, lack of an ITT analysis, and attrition bias. Porschen 2007 had high risk of bias owing to differences in schedules of assessment and/or follow‐up between arms. Shigeta 2016 had high risk of bias owing to detection bias, differences in schedules of assessment and/or follow‐up between arms, and a difference in baseline median age of participants between treatment arms.
The remaining two studies (Ducreux 2011; Schilsky 2002a) had low risk of detection bias because tumour responses were reviewed by a blinded independent review panel. However, both studies had high risk of bias owing to differences in schedules of assessment and/or follow‐up between arms.
OS (palliative intent studies)
We did not judge OS (palliative intent studies) to be at risk of bias from lack of blinding of outcome assessors. However, five out of 29 studies had high risk of bias in other domains (Douillard 2014; Hochster TREE‐1 2008; Hochster TREE‐2 2008; Pectasides 2012; Shigeta 2016). These studies contributed only 4.4% to the pooled effect estimate for the OS (palliative intent studies) outcome, and we did not downgrade this outcome for risk of bias.
Douillard 2014 had high risk of bias owing to an imbalance in the proportion of participants with KRAS mutations between oral and IV arms (within the population evaluable for KRAS mutation status). Hochster TREE‐1 2008 and Shigeta 2016 had high risk of bias owing to differences in schedules of assessment and/or follow‐up between arms. Additionally, Shigeta 2016 had high risk of bias owing to a difference in baseline median age of participants between treatment arms. Hochster TREE‐2 2008 had high risk of bias for lack of an ITT analysis and a difference in baseline median age of participants between treatment arms. Pectasides 2012 had high risk of bias owing to lack of an ITT analysis.
TTP
For the TTP outcome, five out of six studies had high risk of bias owing to lack of blinding of outcome assessors (Ahn 2003; Diaz‐Rubio 2007; Douillard 2002; Martoni 2006; Nogue 2005). These studies contributed 93.4% of the pooled effect estimate for the TTP outcome, and we downgraded this outcome for risk of bias.
Three of these five studies had additional judgements of high risk of bias in other domains. Ahn 2003 had high risk of attrition bias, and Douillard 2002 had high risk of bias owing to differences in schedules of assessment and/or follow‐up between arms. Nogue 2005 had high risk of attrition bias and of bias due to differences in schedules of assessment and/or follow‐up between arms, as well as lack of an ITT analysis.
ORR
For the ORR outcome, we considered 25 out of 32 studies to have high risk of bias. These studies contributed 59.3% of the pooled effect estimate for the ORR outcome, and we downgraded this outcome for risk of bias.
Twenty‐three of these studies had high risk of bias owing to lack of blinding of outcome assessors (Ahn 2003; Andersen 1987; Bajetta 1996; Comella 2009; Diaz‐Rubio 2007; Douillard 2002; Douillard 2014; Ducreux 2013; ECOG E5296 2012; Fuchs 2007; Hochster TREE‐1 2008; Hochster TREE‐2 2008; Kato 2012; Kohne 2008; Martoni 2006; Nogue 2005; Pectasides 2012; Porschen 2007; Shigeta 2016; Van Cutsem 2001a; Van Cutsem 2001b; Yasui 2015; Yu 2005). Six of these 23 studies had additional judgements of high risk of bias in other domains. Ahn 2003, Andersen 1987, and Hochster TREE‐1 2008 had high risk of attrition bias; Andersen 1987 additionally had high risk of bias owing to lack of an ITT analysis. Hochster TREE‐2 2008 had high risk of bias owing to lack of an ITT analysis. Nogue 2005 and Pectasides 2012 had high risk of attrition bias owing to differences in schedules of assessment and/or follow‐up between arms, as well as lack of an ITT analysis.
The remaining two studies (Ducreux 2011; Schilsky 2002a) had low risk of detection bias because tumour responses were reviewed by a blinded independent review panel in these studies. However, these two studies had high risk of bias owing to differences in schedules of assessment and/or follow‐up between arms.
Grade ≥ 3 AEs (palliative intent studies)
Subjective outcomes
All 31 palliative intent studies that contributed to the subjective outcomes grade ≥ 3 AEs diarrhoea, HFS, vomiting, nausea, stomatitis, mucositis, and any grade ≥ 3 AE had high risk of bias owing to lack of blinding, and we downgraded these outcomes for risk of bias.
Fourteen of these 31 studies had additional judgements of high risk of bias in other domains (Bajetta 1996; Diaz‐Rubio 2007; Ducreux 2013; Fuchs 2007; Hochster TREE‐1 2008; Hochster TREE‐2 2008; Kato 2012; Nogue 2005; Pectasides 2012; Schilsky 2002a; Seymour 2011; Shigeta 2016; Souglakos 2012; Yamada 2013). With the exception of Shigeta 2016 (high risk of bias caused by a difference in baseline median age of participants between treatment arms), all of these studies had additional high risk of bias owing to differences in schedules of assessment and/or follow‐up between arms. Hochster TREE‐2 2008 also had high risk of bias owing to a difference in baseline median age of participants between treatment arms.
Objective outcomes
The grade ≥ 3 AEs neutropenia/granulocytopenia, febrile neutropenia, and hyperbilirubinaemia were objective outcomes and were not at risk of performance and detection bias from lack of blinding.
However, for the grade ≥ 3 neutropenia/granulocytopenia (palliative intent studies) outcome, 13 out of 29 studies (Diaz‐Rubio 2007; Ducreux 2013; Fuchs 2007; Hochster TREE‐1 2008; Hochster TREE‐2 2008; Kato 2012; Nogue 2005; Pectasides 2012; Schilsky 2002a; Seymour 2011; Shigeta 2016; Souglakos 2012; Yamada 2013) had high risk of bias in domains unrelated to lack of blinding. These studies contributed 29.2% of the pooled effect estimate for the grade ≥ 3 neutropenia/granulocytopenia (palliative intent studies) outcome, and we downgraded this outcome for risk of bias. With the exception of Shigeta 2016 (high risk of bias caused by a difference in baseline median age of participants between treatment arms), all of these studies had additional high risk of bias owing to differences in schedules of assessment and/or follow‐up between arms. Hochster TREE‐2 2008 also had high risk of bias owing to a difference in baseline median age of participants between treatment arms.
No studies were at high risk of bias for grade ≥ 3 febrile neutropenia, and we did not downgrade this outcome for risk of bias.
For the grade ≥ 3 hyperbilirubinaemia (palliative intent studies) outcome, four out of nine studies (Diaz‐Rubio 2007; Kato 2012; Yamada 2013; Shigeta 2016) had high risk of bias in domains unrelated to lack of blinding. These studies contributed 28.5% of the pooled effect estimate for the grade ≥ 3 hyperbilirubinaemia (palliative intent studies) outcome, and we downgraded this outcome for risk of bias. Diaz‐Rubio 2007, Kato 2012, and Yamada 2013 had high risk of bias owing to differences in schedules of assessment and/or follow‐up between arms, and Shigeta 2016 had high risk of bias owing to a difference in baseline median age of participants between treatment arms.
Effects of interventions
See: Summary of findings for the main comparison Oral compared with intravenous fluoropyrimidines for colorectal cancer ‐ Patients treated with curative intent; Summary of findings 2 Oral compared with intravenous fluoropyrimidines for colorectal cancer ‐ Patients treated with palliative intent
We have provided a summary of the results for effects of interventions, shown in Data and analyses. Table 5 (patients treated with curative intent for CRC with neoadjuvant and/or adjuvant chemotherapy) and Table 6 (patients treated with palliative intent for inoperable advanced or metastatic CRC with chemotherapy) show the studies that contributed to pooled effect estimates for each outcome.
We have also described results of subgroup analyses for the outcomes that we assessed as the most important. For efficacy, these include DFS, PFS, and OS in both curative intent and palliative intent studies. For grade ≥ 3 AEs, these consist of diarrhoea and HFS in both curative intent and palliative intent studies. We have presented results of all other subgroup analyses in Appendix 9, Appendix 10, Appendix 11, and Appendix 12.
We have presented additional information for the outcomes analysed in this review, other than the information used in our quantitative synthesis, in Appendix 5, Appendix 6, Appendix 7, Appendix 8, Appendix 13 , Appendix 14, Appendix 15, Appendix 16, and Appendix 17.
Patients treated with curative intent for CRC with neoadjuvant and/or adjuvant chemotherapy
Co‐primary outcome
1.1 DFS
For the comparison of oral versus IV fluoropyrimidines in patients treated with curative intent for CRC with neoadjuvant and/or adjuvant chemotherapy, DFS did not differ between participants treated with oral versus IV fluoropyrimidines. The pooled HR from seven studies with 8903 participants was 0.93 (95% CI 0.87 to 1.00) (Analysis 1.1; Table 5). Results show no heterogeneity (Chi² = 5.51, P = 0.48; I² = 0%) among effect estimates for these studies (Figure 4).
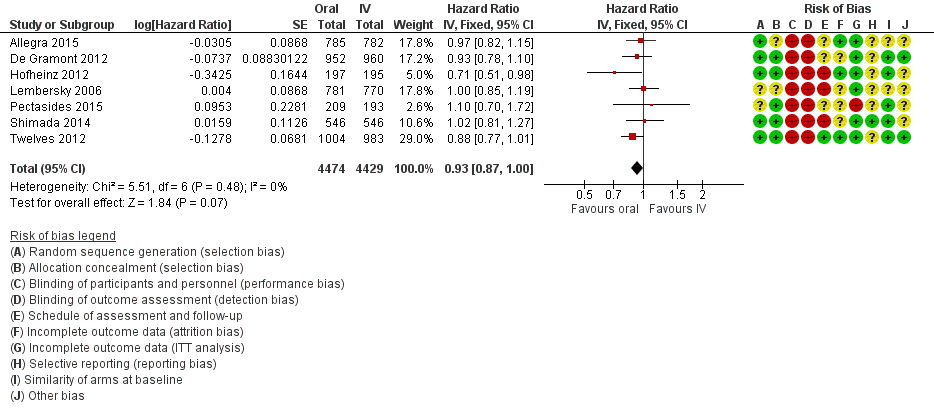
Forest plot of disease‐free survival.
We downgraded the quality of evidence by one level for risk of bias, as all studies that contributed to the pooled effect estimate had high risk of bias owing to lack of blinding. We assessed the quality of evidence as moderate (summary of findings Table for the main comparison).
Subgroup analyses:
We observed no subgroup differences in any of the prespecified subgroup analyses (Analysis 1.2; Analysis 1.3; Analysis 1.4; Appendix 9):
1.2 DFS with subgroup analysis ‐ Treatment type
Chi2 = 0.21, P = 0.64; I2 = 0%.
1.3 DFS with subgroup analysis ‐ Infusional versus bolus intravenous fluoropyrimidine
Chi2 = 0.06, P = 0.81; I2 = 0%.
1.4 DFS with subgroup analysis ‐ Oral fluoropyrimidine backbone
Chi2 = 1.70, P = 0.19; I2 = 41.1%.
Assessment of publication bias for DFS
We did not assess funnel plot asymmetry for the DFS outcome, as we included only seven studies in the meta‐analysis.
Secondary outcomes
2.1 OS (curative intent)
For the comparison of oral versus IV fluoropyrimidines in patients treated with curative intent for CRC with neoadjuvant and/or adjuvant chemotherapy, OS did not differ between participants treated with oral versus IV fluoropyrimidines. The pooled HR from seven studies with 8902 participants was 0.92 (95% CI 0.84 to 1.00) (Analysis 2.1; Table 5). Results show no heterogeneity (Chi² = 4.67, P = 0.59; I² = 0%) among effect estimates for these studies.
We did not identify any factors that reduced the quality of evidence for this outcome, and we assessed the quality of evidence as high (summary of findings Table for the main comparison).
Subgroup analyses
We observed no subgroup differences in any of the prespecified subgroup analyses (Analysis 2.2; Analysis 2.3; Analysis 2.4; Appendix 9):
2.2 OS with subgroup analysis ‐ Chemotherapy versus chemo‐radiotherapy
Chi2 = 0.43, P = 0.51; I2 = 0%.
2.3 OS with subgroup analysis ‐ Infusional versus bolus intravenous fluoropyrimidine
Chi2 = 0.00, P = 0.96; I2 = 0%.
2.4 OS with subgroup analysis ‐ Oral fluoropyrimidine backbone
Chi2 = 2.20, P = 0.14; I2 = 54.5%.
Grade ≥ 3 AEs (curative intent studies)
3.1 Grade ≥ 3 diarrhoea (curative intent studies)
For the comparison of oral versus IV fluoropyrimidines in patients treated with curative intent for CRC with neoadjuvant and/or adjuvant chemotherapy, grade ≥ 3 diarrhoea did not differ between participants treated with oral versus IV fluoropyrimidines. The pooled OR from nine studies with 9551 participants was 1.12 (95% CI 0.99 to 1.25) (Analysis 3.1; Table 5).
We downgraded the quality of evidence by one level for risk of bias, as all studies that contributed to the pooled effect estimate had high risk of bias owing to lack of blinding. We further downgraded quality by one level for inconsistency of results, as we noted substantial heterogeneity among included studies (Chi² = 23.79, P = 0.002; I² = 66%), and by one level for imprecision. We assessed the quality of evidence as very low (summary of findings Table for the main comparison).
Subgroup analyses
3.2 Grade ≥ 3 diarrhoea (curative intent studies) ‐ Treatment type
Results show no subgroup differences by treatment type (chemotherapy versus chemo‐radiotherapy): Chi2 = 1.24, P = 0.27; I2 = 19.3% (Analysis 3.2; Appendix 10).
3.3 Grade ≥ 3 diarrhoea (curative intent studies) ‐ Infusional versus bolus intravenous fluoropyrimidine
Results show significant subgroup differences between ‘Infusional intravenous fluoropyrimidine’ (pooled OR 1.27, 95% CI 1.06 to 1.53 ‐ indicating more grade ≥ 3 diarrhoea with oral fluoropyrimidines) and ‘Bolus intravenous fluoropyrimidine’ (pooled OR 0.98, 95% CI 0.84 to 1.14 ‐ indicating that grade ≥ 3 diarrhoea did not differ between those treated with oral versus IV fluoropyrimidines) subgroups: Chi2 = 4.52, P = 0.03; I2 = 77.9% (Analysis 3.3; Appendix 10).
3.4 Grade ≥ 3 diarrhoea (curative intent studies) ‐ Oral fluoropyrimidine backbone
Results show significant differences between subgroups for the different oral fluoropyrimidine backbones.
Pooled effect estimates for the ‘Capecitabine’ and ‘UFT/Ftorafur’ subgroups indicate that grade ≥ 3 diarrhoea did not differ between participants treated with oral versus IV fluoropyrimidines, whilst the OR for the only study in the ‘Doxifluridine’ subgroup (Kim 2001a) indicated that grade ≥ 3 diarrhoea was increased with oral fluoropyrimidines (OR 32.14, 95% CI 1.89 to 545.41). Tests for subgroup differences yielded these results: Chi2 = 6.73, P = 0.03; I2 = 70.3%. Substantial or considerable heterogeneity remained between studies within the ‘Capecitabine’ subgroup (Chi2 = 16.27, P = 0.003; I2 = 75%) (Analysis 3.4; Appendix 10).
3.5 Grade ≥ 3 hand foot syndrome (curative intent studies)
For the comparison of oral versus IV fluoropyrimidines in patients treated with curative intent for CRC with neoadjuvant and/or adjuvant chemotherapy, odds of grade ≥ 3 HFS were higher with oral fluoropyrimidine treatment. The pooled OR from five studies with 5731 participants was 4.59 (95% CI 2.97 to 7.10) (Analysis 3.5; Table 5).
We downgraded the quality of evidence by one level for risk of bias, as all studies that contributed to the pooled effect estimate had high risk of bias owing to lack of blinding. We further downgraded quality by one level for inconsistency of results, as we noted substantial or considerable heterogeneity among included studies (Chi² = 16.34, P = 0.003; I² = 76%). We assessed the quality of evidence as low (summary of findings Table for the main comparison).
In four of the included studies, effect estimates favoured IV fluoropyrimidines, and in three of these, 95% CIs crossed the null value of 1.00 (Allegra 2015; Hofheinz 2012; Pectasides 2015). In one outlier study (Shimada 2014), the effect estimate favoured oral fluoropyrimidines and the upper limit of the 95% CI was 1.00. It is unclear whether this variation in effects was due to clinical diversity (this was the only study for this outcome that utilised UFT and enrolled patients only from Japan) and/or methodological diversity (AE assessments were less frequent in the oral than in the IV treatment arm). In a post hoc sensitivity analysis in which we incorporated heterogeneity into a random‐effects model meta‐analysis, the pooled OR was 2.36 and the 95% confidence interval crossed the null value of 1.00 (95% CI 0.52 to 10.74).
3.6 Grade ≥ 3 neutropenia/granulocytopenia (curative intent studies)
For the comparison of oral versus IV fluoropyrimidines in patients treated with curative intent for CRC with neoadjuvant and/or adjuvant chemotherapy, the pooled OR for grade ≥ 3 neutropenia/granulocytopenia from seven studies with 8087 participants was 0.14 (95% CI 0.11 to 0.16), favouring oral fluoropyrimidines (Table 5).
We downgraded the quality of evidence by one level for inconsistency of results, as we noted substantial or considerable heterogeneity between the included studies (Chi² = 53.38, P < 0.00001, I² = 89%). We assessed the quality of evidence as moderate (summary of findings Table for the main comparison).
The 95% CIs for effect estimates either favoured the oral fluoropyrimidine group (four studies) or crossed the null value of 1.00 (two studies). Only one outlier study (Allegra 2015) reported that the effect estimate and the 95% CI indicated more grade ≥ 3 neutropenia/granulocytopenia with oral fluoropyrimidine treatment (the only study for this outcome that included combination chemotherapy with radiotherapy) (Analysis 3.6).
Grade ≥ 3 neutropenia/granulocytopenia (curative intent studies) – study data not suitable for quantitative synthesis
For the Hofheinz 2012 and Kim 2001a studies, wherein neutropenia/granulocytopenia was not specifically reported, the incidence of the grade ≥ 3 AEs ‘lowered leucocytes’ and ‘leukopenia’, respectively, was lower in the oral fluoropyrimidine arms (Appendix 6).
3.7 Grade ≥ 3 febrile neutropenia (curative intent studies)
For the comparison of oral versus IV fluoropyrimidines in patients treated with curative intent for CRC with neoadjuvant and/or adjuvant chemotherapy, grade ≥ 3 febrile neutropenia events were few in the four studies with 2925 participants that reported this outcome (Analysis 3.7; Table 5). The pooled OR was 0.59 (95% CI 0.18 to 1.90), and we observed no heterogeneity (Chi² = 2.65, P = 0.45; I² = 0%).
We downgraded the quality of evidence by two levels for imprecision (small number of events and 95% CI included appreciable benefit and harm) and assessed quality as low.
3.8 Grade ≥ 3 vomiting (curative intent studies)
For the comparison of oral versus IV fluoropyrimidines in patients treated with curative intent for CRC with neoadjuvant and/or adjuvant chemotherapy, grade ≥ 3 vomiting did not differ between participants treated with oral versus IV fluoropyrimidines. The pooled OR from eight studies with 9385 participants was 1.05 (95% CI 0.83 to 1.34) (Analysis 3.8; Table 5).
We downgraded the quality of the evidence by one level for risk of bias, as all studies that contributed to the pooled effect estimate had high risk of bias owing to lack of blinding. We downgraded quality by one further level for imprecision. The final assessment for quality of evidence was low.
Heterogeneity among effect estimates for these studies was moderate (Chi² = 10.75, P = 0.10; I² = 44%), albeit not statistically significant. However, most of the effect estimates with their 95% CIs crossed the null value of 1.00, with the exception of one outlier study (Lembersky 2006), for which the effect estimate favoured oral fluoropyrimidines.
3.9 Grade ≥ 3 nausea (curative intent studies)
For the comparison of oral versus IV fluoropyrimidines in patients treated with curative intent for CRC with neoadjuvant and/or adjuvant chemotherapy, grade ≥ 3 nausea did not differ between participants treated with oral versus IV fluoropyrimidines. The pooled OR from seven studies with 9233 participants was 1.21 (95% CI 0.97 to 1.51) (Analysis 3.9; Table 5). Heterogeneity among effect estimates for these studies was minimal (Chi² = 6.40, P = 0.38, I² = 6%).
We downgraded the quality of the evidence by one level for risk of bias, as all studies that contributed to the pooled effect estimate had high risk of bias owing to lack of blinding. We downgraded quality by one further level for imprecision. The final assessment for quality of evidence was low.
3.10 Grade ≥ 3 stomatitis (curative intent studies)
For the comparison of oral versus IV fluoropyrimidines in patients treated with curative intent for CRC with neoadjuvant and/or adjuvant chemotherapy, the pooled OR for grade ≥ 3 stomatitis from five studies with 4212 participants was 0.21 (95% CI 0.14 to 0.30), favouring oral fluoropyrimidines (Analysis 3.10; Table 5).
We downgraded the quality of evidence by one level for risk of bias, as all studies that contributed to the pooled effect estimate had high risk of bias owing to lack of blinding. We downgraded quality by one further level for inconsistency of results, as we noted substantial or considerable heterogeneity between the included studies (Chi² = 26.70, P < 0.00001; I² = 89%). We assessed the quality of evidence as low. However, in the included studies, 95% CIs for effect estimates either crossed the null value of 1.00 (three studies) or favoured oral fluoropyrimidines (one study, Twelves 2012).
3.11 Grade ≥ 3 mucositis (curative intent studies)
For the comparison of oral versus IV fluoropyrimidines in patients treated with curative intent for CRC with neoadjuvant and/or adjuvant chemotherapy, grade ≥ 3 mucositis did not differ between participants treated with oral versus IV fluoropyrimidines. The pooled OR from four studies with 2233 participants was 0.64 (95% CI 0.25 to 1.62) (Analysis 3.11; Table 5). We noted no heterogeneity among effect estimates for these studies (Chi² = 1.56, P = 0.67; I² = 0%).
We downgraded the quality of evidence by one level for risk of bias, as all studies that contributed to the pooled effect estimate had high risk of bias owing to lack of blinding. We downgraded quality by two further levels for imprecision (small number of events and 95% CI included appreciable benefit and harm). We assessed the quality of evidence as very low.
3.12 Grade ≥ 3 hyperbilirubinaemia (curative intent studies)
For the comparison of oral versus IV fluoropyrimidines in patients treated with curative intent for CRC with neoadjuvant and/or adjuvant chemotherapy, grade ≥ 3 hyperbilirubinaemia did not differ between participants treated with oral versus IV fluoropyrimidines. The OR of 1.67 (95% CI 0.52 to 5.38) was derived from three studies with 2757 participants (Analysis 3.12; Table 5). However, few events occurred in both arms. Heterogeneity between effect estimates was moderate for these studies (Chi² = 3.45, P = 0.18; I² = 42%).
We downgraded the quality of evidence by one level for risk of bias, as studies at high risk of bias for this outcome contributed 44.3% of the weight for the pooled effect estimate. We downgraded quality by two further levels owing to imprecision (small numbers of events and 95% CIs included appreciable benefit and harm). We assessed the quality of evidence as very low.
3.13 Any grade ≥ 3 AEs (curative intent studies)
For the comparison of oral versus IV fluoropyrimidines in patients treated with curative intent for CRC with neoadjuvant and/or adjuvant chemotherapy, we found that odds of any grade ≥ 3 AEs were lower with oral fluoropyrimidines, with a pooled OR of 0.82 (95% CI 0.74 to 0.90) from five studies with 7741 participants (Table 5).
We downgraded the quality of evidence by one level for risk of bias, as all studies that contributed to the pooled effect estimate had high risk of bias. We downgraded quality by one further level for inconsistency of results, as heterogeneity among the included studies was considerable (Chi² = 99.17, P < 0.00001; I² = 96%). We assessed the quality of evidence as low.
The effect estimate for De Gramont 2012 (weight 33.6%) strongly favoured the oral fluoropyrimidine group (HR 0.32, 95% CI 0.26 to 0.39), and in the remaining four studies, 95% CIs for the effect estimates crossed the null value of 1.00 (Analysis 3.13).
Sensitivity analyses
Excluding studies at 'High' risk of bias
As we assessed all studies contributing to the DFS outcome as having 'High' risk of bias owing to lack of blinding (Table 7), we could not perform a sensitivity analysis that excluded studies at 'High' risk of bias.
Patients treated with palliative intent for inoperable advanced or metastatic CRC with chemotherapy
Co‐primary outcome
4.1 PFS
For the comparison of oral versus IV fluoropyrimidines in patients treated with palliative intent for CRC with chemotherapy, PFS was worse in the oral fluoropyrimidine group. The pooled HR from 23 studies with 9927 participants was 1.06 (95% CI 1.02 to 1.11) (Analysis 4.1; Table 6). Heterogeneity among effect estimates for these studies was minimal (Chi² = 27.08, P = 0.25; I² = 15%).
We downgraded the quality of evidence by one level for risk of bias, as studies at high risk of bias for this outcome contributed 48.5% of the weight for the pooled effect estimate. We assessed the quality of evidence as moderate (summary of findings Table 2).
Subgroup analyses
4.2 PFS with subgroup analysis ‐ Single agent versus combination therapy
We found no evidence of subgroup differences (Chi² = 2.16, P = 0.14; I² = 53.8%) (Analysis 4.2; Appendix 11).
4.3 PFS with subgroup analysis ‐ Infusional versus bolus intravenous fluoropyrimidine
We found no evidence of subgroup differences (Chi² = 1.33, P = 0.25; I² = 24.7%) (Analysis 4.3; Appendix 11).
4.4 PFS with subgroup analysis ‐ Oral fluoropyrimidine backbone
Results showed significant subgroup differences by oral fluoropyrimidine backbone (Chi² = 13.46, P = 0.009; I² =70.3%). Pooled effect estimates for the ‘Capecitabine’ and ‘S‐1’ subgroups and the effect estimate for the ‘Doxifluridine’ subgroup (one study, Bajetta 1996) indicated that PFS did not differ between participants treated with oral versus IV fluoropyrimidines. However, pooled effect estimates for the ‘UFT/Ftorafur’ and ‘Eniluracil + oral 5‐FU’ subgroups indicated worse PFS in the oral fluoropyrimidine group (Figure 5; Analysis 4.4; Appendix 11).

Forest plot of comparison: 4 Progression‐free survival with, outcome: 4.4 Progression‐free survival with subgroup analysis ‐ oral fluoropyrimidine backbone.
4.5 PFS for combination therapy with subgroup analysis ‐ Oxaliplatin‐based versus irinotecan based
We found no evidence of subgroup differences (Chi² = 0.13, P = 0.72; I² = 0%) (Analysis 4.5; Appendix 11).
4.6 PFS for combination therapy with subgroup analysis ‐ with bevacizumab versus no bevacizumab
The post hoc subgroup analysis comparing studies of combination chemotherapy that included BEV versus those that did not include BEV found no subgroup differences (Chi² = 1.12, P = 0.29; I² = 11.0%) (Analysis 4.6; Appendix 11).
PFS ‐ study data not suitable for quantitative synthesis
The Hochster TREE‐1 2008 and Hochster TREE‐2 2008 studies reported the median PFS for treatment arms without log‐rank P values. The median PFS for infusional IV fluoropyrimidine arms compared with oral fluoropyrimidine arms (TREE‐1: 8.7 m, 95% CI 6.5 to 9.8 vs 5.9 m, 95% CI 5.1 to 7.4; TREE‐2: 9.9 m, 95% CI 7.9 to 11.7 vs 10.3 m, 95% CI 8.6 to 12.5) and for bolus IV fluoropyrimidine arms compared with oral fluoropyrimidine arms (TREE‐1: 6.9 m, 95% CI 4.2 to 8.0 vs 5.9 m, 95% CI 5.1 to 7.4; TREE‐2: 8.3 m, 95% CI 6.6 to 9.9 vs 10.3 m, 95% CI 8.6 to 12.5) had overlapping 95% CIs for all oral versus IV fluoropyrimidine comparisons (Appendix 7).
Assessment of publication bias for PFS
Visual inspection of a funnel plot of SE(lnHR)s against HRs for the 23 studies quantitatively synthesised for the PFS outcome revealed no asymmetry (Figure 6).

Funnel plot of progression‐free survival.
Secondary outcomes
5.1 OS (palliative intent studies)
For the comparison of oral versus IV fluoropyrimidines in patients treated with palliative intent for CRC with chemotherapy, OS did not differ between participants treated with oral versus IV fluoropyrimidines. The pooled HR from 29 studies with 12,079 participants was 1.02 (95% CI 0.99 to 1.05) (Table 6). Heterogeneity among effect estimates for these studies was minimal (Chi² = 33.69, P = 0.29; I² = 11%) (Analysis 5.1).
We did not identify any factors that reduced the quality of evidence for this outcome, and we assessed the quality of evidence as high (summary of findings Table 2).
Subgroup analyses:
We found no significant subgroup differences for any of the prespecified subgroup analyses (Analysis 5.2; Analysis 5.3; Analysis 5.4; Analysis 5.5; Appendix 11).
5.2 OS with subgroup analysis ‐ Single‐agent versus combination therapy
Chi² = 0.40, P = 0.53; I² = 0%.
5.3 OS with subgroup analysis ‐ Infusional versus bolus intravenous fluoropyrimidine
Chi² = 0.10, P = 0.75; I² = 0%.
5.4 OS with subgroup analysis ‐ Oral fluoropyrimidine backbone
Chi2 = 9.30, P = 0.05; I² = 57.0%.
However, the pooled effect estimate for the 'Capecitabine', 'UFT/Ftorafur', 'Doxifluridine', and 'S‐1' subgroups indicated that OS did not differ between participants treated with oral versus IV fluoropyrimidines, whereas the pooled effect estimate for the 'Eniluracil + oral 5‐FU' subgroup indicated a worse OS in the oral fluoropyrimidine group (Analysis 5.4).
5.5 OS for combination therapy with subgroup analysis‐ Oxaliplatin‐based versus irinotecan‐based
Chi² = 0.01, P = 0.90; I² = 0%.
6.1 TTP
For the comparison of oral versus IV fluoropyrimidines in patients treated with palliative intent for CRC with chemotherapy, TTP was worse in the oral fluoropyrimidine group. The pooled HR from six studies with 1970 participants was 1.07 (95% CI 1.01 to 1.14) (Analysis 6.1; Table 6). We noted no heterogeneity among effect estimates for these studies (Chi² = 4.95, P = 0.42; I² = 0%).
We downgraded the quality of evidence by one level for risk of bias, as studies at high risk of bias for this outcome contributed 93.4% of the weight for the pooled effect estimate. We assessed the quality of evidence as moderate.
7.1 ORR
For the comparison of oral versus IV fluoropyrimidines in patients treated with palliative intent for CRC with chemotherapy, ORR did not differ between participants treated with oral versus IV fluoropyrimidines. The pooled OR from 32 studies with 11,115 participants was 0.98 (95% CI 0.90 to 1.06) (Analysis 7.1; Table 6). Heterogeneity between the included studies was moderate (Chi² = 59.03, P = 0.005; I² = 42%).
We downgraded the quality of evidence by one level for risk of bias, as studies at high risk of bias for this outcome contributed 59.3% of the weight for the pooled effect estimate. We assessed the quality of evidence as moderate.
Grade ≥ 3 AEs (palliative intent studies)
8.1 Grade ≥ 3 diarrhoea (palliative intent studies)
For the comparison of oral versus IV fluoropyrimidines in patients treated with palliative intent for CRC with chemotherapy, odds of grade ≥ 3 diarrhoea were higher in the oral fluoropyrimidine arm. The pooled OR from 30 studies with 11,997 participants was 1.66 (95% CI 1.50 to 1.84) (Analysis 8.1; Table 6).
We downgraded the quality of evidence by one level for risk of bias, as all studies that contributed to the pooled effect estimate had high risk of bias owing to lack of blinding. We further downgraded quality by one level for inconsistency, as heterogeneity between the included studies was substantial (Chi² = 101.41, P < 0.00001; I² = 67%). The final assessment for quality of evidence was low (summary of findings Table 2).
We observed that for the included studies, 95% CIs for the effect estimates either crossed the null value of 1.00 or indicated more grade ≥ 3 diarrhoea with oral fluoropyrimidine treatment. One outlier study, which was an exception to this, favoured oral fluoropyrimidines (Diaz‐Rubio 2007). In this study, AE assessments were less frequent in the oral than in the IV treatment arm; however, many other studies included in the meta‐analysis for grade ≥ 3 diarrhoea also had high risk of bias as a result of this methodological issue (Characteristics of included studies).
Subgroup analyses
Results showed subgroup differences for all prespecified subgroup analyses explored. However, substantial or considerable heterogeneity remained between included studies within at least one subgroup (Appendix 12).
8.2 Grade ≥ 3 diarrhoea (palliative intent studies) with subgroup analysis ‐ Single‐agent versus combination therapy
The pooled OR for the ‘Combination therapy’ subgroup favoured IV fluoropyrimidines more than the pooled OR for the ‘Single agent’ subgroup (Chi2 = 21.70, P < 0.00001; I² = 95.4%) (Analysis 8.2).
8.3 Grade ≥ 3 diarrhoea (palliative intent studies) with subgroup analysis ‐ Infusional versus bolus IV fluoropyrimidine
The pooled OR for the ‘Infusional IV fluoropyrimidine’ subgroup favoured IV fluoropyrimidines more than the pooled effect estimate for the ‘Bolus IV fluoropyrimidine’ subgroup (Chi2 = 15.57, P < 0.0001; I² = 93.6%) (Analysis 8.3).
8.4 Grade ≥ 3 diarrhoea (palliative intent studies) with subgroup analysis ‐ Oral fluoropyrimidine backbone
Results showed significant subgroup differences by oral fluoropyrimidine backbone (Chi2 = 21.15, P = 0.0003; I² = 81.1%). The pooled OR for the ‘Capecitabine’, ‘UFT/Ftorafur’ and ‘S‐1’ subgroups indicated worse grade ≥ 3 diarrhoea with oral fluoropyrimidine treatment, and 95% CIs for pooled effect estimates for the ‘Eniluracil + oral 5‐FU’ and ‘Doxifluridine’ (one study, Bajetta 1996) subgroups crossed the null value of 1.00 (Analysis 8.4).
8.5 Grade ≥ 3 diarrhoea (palliative intent studies) with subgroup analysis for combination therapy ‐ Oxaliplatin‐based versus irinotecan‐based
The pooled OR for the ‘Irinotecan‐based’ subgroup favoured IV fluoropyrimidines more than the pooled effect estimate for the ‘Oxaliplatin‐based’ subgroup (Chi2 = 12.72, P = 0.0004; I² = 92.1% ) (Analysis 8.5).
8.6 Grade ≥ 3 hand foot syndrome (palliative intent studies)
For the comparison of oral versus IV fluoropyrimidines in patients treated with palliative intent for CRC with chemotherapy, results showed greater grade ≥ 3 HFS with oral fluoropyrimidine use. The pooled OR from 18 studies with 6481 participants was 3.92 (95% CI 2.84 to 5.43) (Table 6). Heterogeneity between the included studies was moderate (Chi² = 33.79, P = 0.03; I² = 41%).
We downgraded the quality of evidence by one level for risk of bias, as all studies that contributed to the pooled effect estimate had high risk of bias owing to lack of blinding. We assessed the quality of evidence as moderate (summary of findings Table 2).
We observed that for the included studies, effect estimates with their 95% CIs crossed the null value of 1.00 (10 studies, and one arm of Hochster TREE‐1 2008 and Hochster TREE‐2 2008) or indicated increased grade ≥ 3 HFS with oral fluoropyrimidine treatment (four studies, and one arm of Hochster TREE‐1 2008 and Hochster TREE‐2 2008). One outlier, which was an exception to this, favoured oral fluoropyrimidines (ECOG E5296 2012, the only study for this outcome using Eniluracil + oral 5‐FU). Another study (Shigeta 2016) reported no events in either arm (Analysis 8.6).
Subgroup analyses
8.7 Grade ≥ 3 hand foot syndrome (palliative intent studies) subgroup analysis ‐ Single‐agent versus combination therapy
Results showed subgroup differences in the 'Single‐agent' and 'Combination therapy' subgroups. In the 'Single‐agent' subgroup, grade ≥ 3 HFS did not differ between participants treated with oral versus IV fluoropyrimidines. However, the 'Combination therapy' subgroup showed an increase in grade ≥ 3 HFS with oral fluoropyrimidine treatment (Chi2 = 9.86, P = 0.002; I² = 89.9%). Only two studies were included in the 'Single‐agent' subgroup (one was ECOG E5296 2012, the outlier study), and heterogeneity between these two studies was considerable (Chi2 = 9.56, P = 0.002; I² = 90%) (Analysis 8.7; Appendix 12).
8.8 Grade ≥ 3 hand foot syndrome (palliative intent studies) subgroup analysis ‐ Infusional versus bolus IV fluoropyrimidine
The pooled OR for the ‘Bolus IV fluoropyrimidine’ subgroup favoured IV fluoropyrimidines more than the pooled effect estimate for the ‘Infusional IV fluoropyrimidine’ subgroup (Chi2 = 4.48, P = 0.03; I² = 77.7%) (Analysis 8.8; Appendix 12). However, heterogeneity between studies within the ‘Infusional IV fluoropyrimidines’ subgroup was moderate (Chi2 = 30.02, P = 0.03; I² = 43%).
8.9 Grade ≥ 3 hand foot syndrome (palliative intent studies) subgroup analysis ‐ Oral fluoropyrimidine backbone
The effect estimate for the ‘Eniluracil + oral 5‐FU’ subgroup (one study, ECOG E5296 2012) favoured oral fluoropyrimidines, the 95% CI for pooled effect estimates for the ‘UFT/Ftorafur’ and ‘S‐1’ subgroups crossed the null value of 1.00, and the pooled OR for the ‘Capecitabine’ subgroup indicated increased grade ≥ 3 HFS with oral fluoropyrimidine treatment (Chi2 = 19.58, P = 0.0002; I² = 84.7%) (Analysis 8.9; Appendix 12).
8.10 Grade ≥ 3 hand foot syndrome (palliative intent studies) subgroup analysis for combination therapy ‐ Oxaliplatin‐based versus irinotecan‐based
We found no evidence of subgroup differences (Chi² = 0.32, P = 0.57; I² = 0%) (Analysis 8.10; Appendix 12).
8.11 Grade ≥ 3 neutropenia/granulocytopenia (palliative intent studies)
For the comparison of oral versus IV fluoropyrimidines in patients treated with palliative intent for CRC with chemotherapy, the pooled OR for grade ≥ 3 neutropenia/granulocytopenia from 29 studies with 11,794 participants (Table 6) was 0.17 (95% CI 0.15 to 0.18), favouring oral fluoropyrimidines.
We downgraded the quality of evidence by one level for risk of bias, as studies at high risk of bias for this outcome contributed 29.2% of the weight for the pooled effect estimate. We further downgraded quality by one level for inconsistency of results, as heterogeneity between included studies was substantial to considerable (Chi² = 295.88, P < 0.00001; I² = 90%). We assessed the quality of evidence as low (summary of findings Table 2).
We observed that for the included studies, effect estimates with their 95% CIs either favoured oral fluoropyrimidines (14 studies and infusional arms of Hochster TREE‐1 2008 and Hochster TREE‐2 2008 studies), or included the null value of 1.00 (13 studies and bolus arms of Hochster TREE‐1 2008 and Hochster TREE‐2 2008 studies) (Analysis 8.11).
Grade ≥ 3 neutropenia/granulocytopenia (palliative intent studies) ‐ study data not suitable for quantitative synthesis
For the Kohne 2008 and Silvestris 2010 studies, in which neutropenia/granulocytopenia were not specifically reported, the incidence of the grade ≥ 3 AEs 'white blood cells' and 'leuko/neutropenia', respectively, was similar. For the Bajetta 1996 study, which reported 'leukopenia', the incidence of this grade ≥ 3 AE was lower in the oral fluoropyrimidine arm (Appendix 6).
8.12 Grade ≥ 3 febrile neutropenia (palliative intent studies)
For the comparison of oral versus IV fluoropyrimidines in patients treated with palliative intent for CRC with chemotherapy, the pooled OR for grade ≥ 3 febrile neutropenia from 19 studies with 9407 participants was 0.27 (95% CI 0.21 to 0.36), indicating lower odds of grade ≥ 3 febrile neutropenia in the oral fluoropyrimidine arm (Table 6).
We downgraded the quality of evidence by one level owing to inconsistency of results, with substantial heterogeneity between the included studies (Chi² = 60.67, P < 0.00001; I² = 67%). We assessed the quality of evidence as moderate.
However, we observed that for the included studies, effect estimates with their 95% CIs either crossed the null value of 1.00 (11 studies) or favoured oral fluoropyrimidines (seven studies), with the exception of one outlier study (Yasui 2015) in which participants treated with oral fluoropyrimidines had greater grade ≥ 3 febrile neutropenia (Analysis 8.12).
8.13 Grade ≥ 3 vomiting (palliative intent studies)
For the comparison of oral versus IV fluoropyrimidines in patients treated with palliative intent for CRC with chemotherapy, the pooled OR of 1.18 (95% CI 1.00 to 1.40) from 23 studies with 9528 participants indicated higher odds of vomiting with oral fluoropyrimidine treatment (Analysis 8.13; Table 6). Heterogeneity among the effect estimates for these studies was minimal (Chi² = 32.08, P = 0.19; I² = 19%). This pooled OR included data from seven studies that combined data for grade ≥ 3 vomiting and nausea (Carmichael 2002; Cassidy 2011a; Douillard 2002; Hochster TREE‐1 2008; Hochster TREE‐2 2008; Nogue 2005; Mei 2014).
We downgraded the quality of evidence by one level for risk of bias, as all studies that contributed to the pooled effect estimate had high risk of bias owing to lack of blinding. We downgraded quality by one further level as the result of imprecision, and the final assessment for quality of evidence was low.
8.14 Grade ≥ 3 nausea (palliative intent studies)
For the comparison of oral versus IV fluoropyrimidines in patients treated with palliative intent for CRC with chemotherapy, grade ≥ 3 nausea did not differ between participants treated with oral versus IV fluoropyrimidines. The pooled OR from 25 studies with 9796 participants was 1.16 (95% CI 0.99 to 1.36) (Table 6). Heterogeneity between studies was moderate (Chi² = 48.04, P = 0.01; I² = 42%). However, for the included studies, effect estimates with their 95% CIs either crossed the null value of 1.00 or indicated higher odds of grade ≥ 3 nausea with oral fluoropyrimidine treatment, with the exception of two outlier studies (Mei 2014; Schilsky 2002a) (Analysis 8.14).
We downgraded the quality of evidence by one level for risk of bias, as all studies that contributed to the pooled effect estimate had high risk of bias owing to lack of blinding. We downgraded quality by one further level owing to imprecision. The final assessment for quality of evidence was low.
8.15 Grade ≥ 3 stomatitis (palliative intent studies)
For the comparison of oral versus IV fluoropyrimidines in patients treated with palliative intent for CRC with chemotherapy, the pooled OR for grade ≥ 3 stomatitis from 21 studies with 8718 participants (Table 6) was 0.26 (95% CI 0.20 to 0.33), favouring oral fluoropyrimidines.
We downgraded the quality of evidence by one level owing to risk of bias, as all studies that contributed to the pooled effect estimate had high risk of bias owing to lack of blinding. We downgraded quality by one further level for inconsistency of results, with substantial heterogeneity between the included studies (Chi² = 62.38, P < 0.00001; I² = 66%). We assessed the quality of evidence as low.
We observed that for the included studies, effect estimates with their 95% CIs either crossed the null value of 1.00 (15 studies) or favoured oral fluoropyrimidines (six studies) (Analysis 8.15).
8.16 Grade ≥ 3 mucositis (palliative intent studies)
For the comparison of oral versus IV fluoropyrimidines in patients treated with palliative intent for CRC with chemotherapy, the pooled OR for grade ≥ 3 mucositis was 0.17 (95% CI 0.12 to 0.24) from 12 studies with 4962 participants (Table 6), favouring oral fluoropyrimidines.
We downgraded the quality of evidence by one level owing to risk of bias, as all studies that contributed to the pooled effect estimate had high risk of bias owing to lack of blinding. We further downgraded quality by one level owing to inconsistency of results, as heterogeneity between the included studies was substantial or considerable (Chi² = 39.81, P < 0.0001; I² = 75%). We assessed the quality of evidence as low.
We observed that for the included studies, effect estimates with their 95% CIs either crossed the null value of 1.00 (seven studies) or favoured oral fluoropyrimidines (four studies) (Analysis 8.16).
8.17 Grade ≥ 3 hyperbilirubinaemia (palliative intent studies)
For the comparison of oral versus IV fluoropyrimidines in patients treated with palliative intent for CRC with chemotherapy, grade ≥ 3 hyperbilirubinaemia did not differ between oral and IV fluoropyrimidine arms. The pooled OR from nine studies with 2699 participants was 1.62 (95% CI 0.99 to 2.64). We noted no heterogeneity between the included studies (Chi² = 3.86, P = 0.70; I² = 0%) (Analysis 8.17; Table 6).
We downgraded the quality of evidence by one level owing to risk of bias, as studies at high risk of bias for this outcome contributed 28.5% of the weight for the pooled effect estimate. We downgraded quality by one further level for imprecision, and we assessed the quality of evidence as low.
8.18 Any grade ≥ 3 AEs (palliative intent studies)
For the comparison of oral versus IV fluoropyrimidines in patients treated with palliative intent for CRC with chemotherapy, the pooled OR for any grade ≥ 3 AEs from 14 studies with 5436 participants was 0.83 (95% CI 0.74 to 0.94), favouring oral fluoropyrimidines (Table 6).
We downgraded the quality of evidence by one level for risk of bias, as all studies that contributed to the pooled effect estimate had high risk of bias owing to lack of blinding. We further downgraded quality by one level for inconsistency of results, as heterogeneity between the included studies was substantial or considerable (Chi2 = 69.88, P < 0.00001; I2 = 77%). We assessed the quality of evidence as low.
We observed that for the included studies, 95% CIs for the effect estimates crossed the null value of 1.00 or favoured oral fluoropyrimidines, with the exception of the bolus arm of Hochster TREE‐1 2008, Kohne 2008, and Seymour 2011 (Analysis 8.18).
Sensitivity analyses
Excluding studies with 'High' risk of bias
When we excluded studies with 'High' risk of bias from the meta‐analysis for the PFS outcome (Table 8), the pooled HR was 1.01 (95% CI 0.96 to 1.07). Whilst results showed no substantial change in the direction or magnitude of the effect estimate compared with the original analysis, which included studies at 'High' risk of bias (HR 1.06, 95% CI 1.02 to 1.11), the 95% CI included the null value of 1.00 (Table 9). We found no heterogeneity (I2 = 0%, P = 0.91).
| Sensitivity analyses for PFS outcome | Original analysis: (effect estimatea, fixed | Sensitivity analysis: (effect estimatea, fixed |
| Excluding studies with 'High' risk of bias | 1.06 (1.02 to 1.11) | 1.01 (95% CI 0.96 to 1.07) |
| Excluding Seymour 2011 study (frail and elderly study population) | 1.06 (1.02 to 1.11) | 1.07 (1.03 to 1.11) |
| Excluding second‐line studies in patients treated with palliative intent for inoperable or metastatic colorectal cancerb | 1.06 (1.02 to 1.11) | 1.07 (1.03 to 1.12) |
aEffect estimates presented as inverse‐variance hazard ratios for time‐to‐event outcomes, and Mantel‐Haenszel odds ratios for adverse events
bAnalysis excluding Kato 2012, Rothenberg 2008, Yasui 2015, and Yu 2005. Kato 2012 and Yu 2005 included patients receiving first‐ or second‐line treatment
PFS: progression‐free survival
CI: confidence interval
Other sensitivity analyses
Results showed no change in direction nor substantial change in magnitude of the pooled effect estimate for PFS when we performed sensitivity analyses excluding the Seymour 2011 study (with a frail and elderly study population) or excluding studies of second‐line chemotherapy (Table 9).
Discussion
Summary of main results
Patients treated with curative intent for colorectal cancer (CRC) with neoadjuvant and/or adjuvant chemotherapy
Efficacy
Our review found that in patients treated with curative intent for CRC with neoadjuvant and/or adjuvant chemotherapy, the co‐primary outcome disease‐free survival (DFS) did not differ between study participants treated with oral versus intravenous (IV) fluoropyrimidines. The pooled hazard ratio (HR) for DFS was 0.93 (95% confidence interval (CI) 0.87 to 1.00). Quantitative synthesis of historical data for the effect of IV fluoropyrimidine‐based therapy in early‐stage CRC demonstrated a 22% reduction in the risk of disease recurrence, with a pooled HR for DFS of 0.78 (95% CI 0.73 to 0.83) (Appendix 18). To retain 50%, 70%, 80%, or 90% of the activity of the active control would lead to non‐inferiority margins of 1.13, 1.08, 1.05, and 1.03, respectively, had the original design been one of non‐inferiority (FDA 2010). If retaining at least 80% of the activity of the active control is required to demonstrate non‐inferiority, the upper bound of the 95% CI for the pooled HR for DFS in our review indicates that this would be met. Overall survival (OS) also did not differ between participants treated with oral versus IV fluoropyrimidines, and pooled HRs for OS and DFS were very similar.
Adverse events
Our review found lower odds of any grade ≥ 3 adverse events (AEs) and grade ≥ 3 neutropenia/granulocytopenia and stomatitis in participants treated with oral fluoropyrimidines. Conversely, odds of grade ≥ 3 hand foot syndrome were higher in the oral fluoropyrimidine group. Grade ≥ 3 diarrhoea, febrile neutropenia, vomiting, nausea, mucositis, and hyperbilirubinaemia did not differ between participants treated with oral versus IV fluoropyrimidines. However, caution in interpreting the results for febrile neutropenia, mucositis, and hyperbilirubinaemia is advised, as the number of events for these outcomes was small, and power to detect a difference between oral and IV fluoropyrimidine groups was low. Heterogeneity was substantial or considerable for grade ≥ 3 diarrhoea, hand foot syndrome (HFS), neutropenia/granulocytopenia, stomatitis, and any grade ≥ 3 AEs. Nevertheless, we observed that for any grade ≥ 3 AEs and for grade ≥ 3 stomatitis, odds ratios (ORs) and associated 95% CIs for the included studies either favoured oral fluoropyrimidines or crossed the null value of 1.00. For grade ≥ 3 neutropenia/granulocytopenia, these either favoured oral fluoropyrimidines or crossed the null value of 1.00, with the exception of one outlier study. For grade ≥ 3 diarrhoea and HFS, these either crossed the null value of 1.00 or indicated worse outcomes with oral fluoropyrimidine treatment.
Factors that potentially contributed to heterogeneity in grade ≥ 3 AEs include the following.
-
Clinical heterogeneity in study treatment regimens. This included differences in doses and schedules of fluoropyrimidines, and, when relevant, different types, doses, and schedules of additional chemotherapy, biological agents, and/or radiotherapy regimens (Characteristics of included studies).
-
Variability in the relationship of reported AEs to treatment (Table 4).
-
Heterogeneity in the toxicity assessment criteria used (Included studies).
-
Variability in reporting bias by both reporting participants and recording study personnel (Haller 2008; Punt 2008). This may have varied between study populations owing to regional (Haller 2008) or other differences.
-
Variability in actions taken by participants and treating clinicians in response to AEs (Haller 2008; Punt 2008). In the case of clinicians, this should have been attenuated by the inclusion of guidelines for dose reduction, dose modification, and dose delays in trial protocols.
-
Differences in the countries and regions of sites participating in the included studies (Included studies). Regional differences in the tolerability profiles of fluoropyrimidines used for curative and palliative intent treatment of CRC have been reported, with greater treatment‐related toxicity observed in the USA than in the rest of the world (Haller 2008). This may be due to differences in patients’ body mass index or body surface area, genetic polymorphisms, cultural and regional differences in medical practice and patient behaviour, and dietary folate intake (Haller 2008; Midgley 2009).
Patients treated with palliative intent for inoperable advanced or metastatic CRC with palliative chemotherapy
Efficacy
Among participants treated with palliative intent for inoperable advanced or metastatic CRC with chemotherapy, we found that overall, the co‐primary outcome progression‐free survival (PFS) was worse in those treated with oral fluoropyrimidines. However, results show significant subgroup differences for the PFS outcome by oral fluoropyrimidine backbone. In the ‘Capecitabine’,‘S‐1’, and ‘Doxifluridine’ subgroups, PFS did not differ between individuals treated with oral versus IV fluoropyrimidines, whilst in the ‘UFT/Ftorafur’ and ‘Eniluracil + oral 5‐fluorouracil (FU)’ subgroups, PFS was worse in the oral fluoropyrimidine group. In our review, the pooled HR for PFS was 1.06 (95% CI 1.02 to 1.11). Previous data showed that use of IV fluorouracil‐based palliative chemotherapy for CRC led to a five‐month benefit in PFS compared with primary expectancy (Nordic 1992), with an estimated risk reduction of 62%. To retain 50%, 70%, 80%, or 90% of the activity of the active control would lead to non‐inferiority margins of 1.62, 1.34, 1.21, and 1.10, respectively, had the original design been one of non‐inferiority (FDA 2010). If retaining at least 80% of the activity of the active control is required to demonstrate non‐inferiority, the upper bound of the 95% CI for the pooled HR for PFS in our review indicates that this would be met.
OS did not differ between individuals treated with oral versus IV fluoropyrimidines, and subgroup analyses revealed no significant subgroup differences. However, whilst OS did not differ between individuals treated with oral versus IV fluoropyrimidines when ‘Capecitabine’, ‘UFT/Ftorafur’, ‘S‐1’, and ‘Doxifluridine’ were used, in the ‘Eniluracil + oral 5‐FU’ subgroup, OS was worse in the oral fluoropyrimidine group. The difference in findings for PFS and OS outcomes may be due to variability in utilisation and effects of second‐ or subsequent‐line treatments. We did not have complete information about this for every study included in our review (Risk of bias in included studies). Similar to PFS, time to progression (TTP) was worse in participants treated with oral compared with IV fluoropyrimidines.
Objective response rate (ORR) did not differ between participants treated with oral versus IV fluoropyrimidines. Heterogeneity was moderate between the studies included in this outcome. Factors that potentially contributed to heterogeneity include the following.
-
Clinical heterogeneity in study treatment regimens. This included differences in doses and schedules of fluoropyrimidines, and, when relevant, different types, doses, and schedules of additional chemotherapy, biological agents, and/or radiotherapy regimens (Characteristics of included studies).
-
Variability in the reporting of numbers of participants who were assessable or evaluable for response in the included studies. In studies that did not specifically report this number, if in fact some participants were not evaluable or assessable for response, they were treated as non‐responders in the analysis. This may have potentially underestimated the response rate in a given arm. The subsequent magnitude of effect on the pooled effect estimate for ORR would be dependent on the number of participants who were not evaluable or assessable for response in these studies, and the relative distribution of these participants between oral and IV fluoropyrimidine arms.
-
Variability in the response assessment criteria used across included studies (Included studies).
Adverse events
Our review found lower odds of any grade ≥ 3 AEs, grade ≥ 3 neutropenia/granulocytopenia, febrile neutropenia, stomatitis, and mucositis in participants treated with oral fluoropyrimidines. Conversely, odds of grade ≥ 3 diarrhoea and HFS were higher in the oral fluoropyrimidine group. Grade ≥ 3 vomiting, nausea, and hyperbilirubinaemia did not differ between participants treated with oral versus IV fluoropyrimidines. However, heterogeneity was substantial or considerable for all of the grade ≥ 3 AE outcomes, except HFS, vomiting, nausea, and hyperbilirubinaemia. Nevertheless, we observed that for grade ≥ 3 neutropenia/granulocytopenia, stomatitis, and mucositis, ORs and associated 95% CIs for the included studies either favoured oral fluoropyrimidines or crossed the null value of 1.00. For grade ≥ 3 febrile neutropenia and any grade ≥ 3 AEs, these either favoured oral fluoropyrimidines or crossed the null value of 1.00, with the exception of one and three outlier studies, respectively. For grade ≥ 3 diarrhoea, these either crossed the null value of 1.00 or indicated worse outcomes with oral fluoropyrimidine treatment, with the exception of one outlier study.
Overall completeness and applicability of evidence
The body of evidence that we found was directly relevant and was comprehensive enough to sufficiently address the objectives of this review.
Identified studies included the relevant patient population. Additionally, most of the oral fluoropyrimidines were examined in a wide range of geographical locations. However, the four studies that compared the oral fluoropyrimidine S‐1 versus IV fluoropyrimidines in patients treated with palliative intent for CRC (Yasui 2015; Kato 2012; Yamazaki 2015; Yamada 2013) recruited patients only from Japan. Caucasians receiving S‐1 have been shown to experience more diarrhoea and dehydration, as well as higher rates of toxicity‐related dose reductions, compared with their East Asian counterparts, despite similar 5‐FU exposure (Chuah 2011). Moreover, given the relatively high rates of diarrhoea reported in the oral fluoropyrimidine arm for one of the included studies, which used combination chemotherapy with S‐1 and irinotecan (Yasui 2015), further investigation is required before these results for S‐1 can be applied to other populations (Schmoll 2010). We also identified studies of doxifluridine that had been performed only in Asia and Europe (Ahn 2003; Bajetta 1996; Kim 2001a), but not in other geographical settings (Included studies).
Levels of compliance in clinical trials may not apply to clinical practice outside of trials (Schünemann 2011). In the context of this review, this is a particularly important issue for oral therapy. Lack of patient compliance may have an negative impact on efficacy. Conversely, patients may even demonstrate ‘over‐compliance’, whereby they continue treatment regardless of adverse effects and/or advice and education, and this may impact toxicity (Midgley 2009; Cassidy 2005). These factors may be subject to cultural variation (Haller 2008). Eleven of the 44 completed studies in this review incorporated procedures for monitoring compliance with oral medications. Outside of clinical trials, levels of monitoring in different hospitals and clinics may be subject to wide variability.
The interventions assessed in this review were overall very inclusive. Studies of curative intent treatment for CRC included neoadjuvant treatment alone for rectal carcinoma, neoadjuvant and adjuvant treatment for rectal carcinoma, and adjuvant treatment alone for colon and/or rectal carcinoma. Of note, the addition of oxaliplatin to IV 5‐FU and leucovorin (LV) has been shown to improve DFS and OS in the adjuvant treatment of stage III colon cancer (André 2009). However, we identified only one study that compared oral versus IV fluoropyrimidines in combination with oxaliplatin, without bevacizumab (BEV), for adjuvant treatment of colon cancer (Pectasides 2015), and this study was discontinued prematurely owing to slow accrual. The AVANT (Bevacizumab Plus Oxaliplatin‐Based Chemotherapy as Adjuvant Treatment for Colon Cancer) study (De Gramont 2012) was a large parallel three‐arm study that was designed to show the superiority of adding BEV to oxaliplatin, leucovorin, and 5‐fluorouracil (FOLFOX4) or capecitabine plus oxaliplatin (XELOX), compared with FOLFOX alone. We included in our review the BEV‐XELOX and BEV‐FOLFOX4 treatment arms from this study. However, notably, the addition of BEV was not shown to be of benefit in the AVANT study but was found to be associated with potential detriment for OS.
In studies of individuals treated with palliative intent for CRC, oral versus IV fluoropyrimidines were examined as single agents or in combination with irinotecan or oxaliplatin. Included studies examined bolus as well as infusional IV fluoropyrimidine regimens. In addition, our review identified eight studies that included treatment with BEV and combination chemotherapy (Cassidy 2011a; Ducreux 2013; Hochster TREE‐2 2008; Kato 2012; Pectasides 2012; Shigeta 2016; Souglakos 2012; Yamada 2013). However, we did not identify any studies that examined chemotherapy together with an epidermal growth factor receptor (EGFR) inhibitor in a study population that had been appropriately selected a priori for KRAS wild‐type (wt) status. We also did not identify any studies that included the targeted therapies ziv‐aflibercept, ramucirumab, and panitumumab, which currently are used in clinical practice.
Identified studies addressed the prespecified outcomes for this review. In this review, we compared only efficacy and grade ≥ 3 adverse event outcomes for oral versus IV fluoropyrimidines, as it was not within the scope of the review to examine differences in patient preference, quality of life, and cost‐effectiveness. These factors may influence the decision to use one option over another, and could be included as outcomes in future updates of this review.
The current review aimed to comprehensively assess oral versus IV fluoropyrimidines, regardless of the current state of development of the fluoropyrimidines identified. Of note, development of eniluracil was discontinued in 2000 (Malet‐Martino 2002). The most recent randomised controlled trial (RCT) that examined eniluracil with oral 5‐FU (ECOG E5296 2012) was terminated early on the basis of negative results from two earlier studies of eniluracil with oral 5‐FU (Schilsky 2002a and Van Cutsem 2001a, included in this review). Clinical development of IV doxifluridine for CRC has been abandoned (Saletti 2008).
Capecitabine is currently approved by the US Food and Drug Administration (FDA) and the European Medicines Agency (EMA), and is registered by the Therapeutic Goods Administration (TGA) in Australia for treatment of both metastatic CRC and high‐risk stage II/III colon cancer (Pazdur 2016; EMA 2016; TGA 2016). S‐1 is widely used as adjuvant and palliative chemotherapy for CRC in Japan (Miyamoto 2014). Recent guidelines on treatment of Asian patients with mCRC recommended that infusional 5‐FU could be substituted with capecitabine, UFT, or S‐1 (Cheng 2014). These guidelines were developed to reflect current Asian clinical practice, following a consensus meeting in 2012, which included representatives from ten Asian countries (China, Hong Kong, India, Indonesia, Malaysia, the Philippines, Singapore, South Korea, Taiwan, and Thailand) and from two European countries (Germany and Italy).
Quality of the evidence
Efficacy
In patients treated with curative intent for CRC with neoadjuvant and/or adjuvant chemotherapy, we assessed all of the seven studies included in the quantitative synthesis for the primary outcome DFS as having high risk of bias for reasons including lack of blinding of the outcome assessor (detection bias). We did not identify inconsistency in results (P = 0.48; I2 = 0%), indirectness of evidence, or imprecision for this outcome (> 2000 events, 95% CI for the pooled HR excluded appreciable benefit and harm), and the quality of evidence was moderate.
For patients treated with palliative intent for inoperable advanced or metastatic CRC with chemotherapy, we assessed 17 of the 23 studies included in the quantitative synthesis for the primary outcome PFS as having high risk of bias. Fifteen of these studies had high risk of bias for reasons including lack of blinding of outcome assessors, and the remaining two studies had high risk of bias owing to differences in schedules of assessment and/or follow‐up between arms. A sensitivity analysis that excluded the 17 studies at high risk of bias did not lead to substantial changes in direction of the effect estimate nor in its magnitude, although the 95% CI crossed the null value of 1.00. We did not identify inconsistency in results (P = 0.25; I2 = 15%), indirectness of evidence, or imprecision (> 4000 events, and optimum information size was met) for this outcome, and the quality of evidence was moderate.
We assessed all of the other secondary efficacy outcomes in this review as having high or moderate quality of evidence. For OS in both curative intent and palliative intent studies, we did not identify any factors that reduced the quality of evidence, which was assessed as high. In patients treated with palliative intent for inoperable advanced or metastatic CRC with chemotherapy, we assessed the quality of evidence for both TTP and ORR as moderate owing to downgrading by one level for risk of bias (predominantly due to lack of blinding of outcome assessors).
Adverse events
For patients treated with curative intent for CRC with neoadjuvant and/or adjuvant chemotherapy, all of the studies that contributed to the seven subjective AE outcomes grade ≥ 3 diarrhoea, HFS, vomiting, nausea, stomatitis, mucositis, and any grade ≥ 3 AEs had high risk of bias for reasons including lack of blinding of participants, personnel, and outcome assessors. We assessed the quality of evidence as low for five of the seven subjective outcomes ‐ for three outcomes (grade ≥ 3 HFS, stomatitis, and any grade ≥ 3 AEs), we downgraded the quality by one level each for high risk of bias and inconsistency of results, and for two outcomes (grade ≥ 3 vomiting and nausea), we downgraded the quality by one level each for high risk of bias and imprecision. We assessed the quality of evidence as very low for two of the seven subjective outcomes (grade ≥ 3 diarrhoea and mucositis). For grade ≥ 3 diarrhoea, we downgraded the quality by one level each for risk of bias, inconsistency of results, and imprecision; for grade ≥ 3 mucositis, we downgraded the quality by one level for risk of bias and by two levels for imprecision.
With respect to the objective outcomes, we assessed the quality of evidence for grade ≥ 3 neutropenia/granulocytopenia as moderate (downgraded by one level for inconsistency of results), for grade ≥ 3 febrile neutropenia as low (downgraded by two levels for imprecision), and for grade ≥ 3 hyperbilirubinaemia as very low (downgraded by one level for risk of bias, and by two levels for imprecision).
For patients treated with palliative intent for inoperable advanced or metastatic CRC with chemotherapy, all of the studies that contributed to the seven subjective AE outcomes also had high risk of bias for reasons including lack of blinding of participants, personnel, and outcome assessors. We assessed the quality of evidence as moderate for one of the seven subjective outcomes (grade ≥ 3 HFS), and we downgraded quality by one level for risk of bias alone. We assessed the quality of evidence as low for the remaining six subjective outcomes ‐ for four outcomes (grade ≥ 3 diarrhoea, stomatitis, mucositis, and any grade ≥ 3 AEs), we downgraded the quality by one level each for risk of bias and inconsistency of results, and for two outcomes (grade ≥ 3 vomiting and nausea), we downgraded the quality by one level each for risk of bias and imprecision.
With respect to the objective outcomes, we assessed the quality of evidence for grade ≥ 3 febrile neutropenia as moderate (downgraded by one level for inconsistency of results), for grade ≥ 3 neutropenia/granulocytopenia as low (downgraded by one level each for risk of bias and inconsistency of results), and for hyperbilirubinaemia as low (downgraded by one level each for risk of bias and imprecision).
Summary
Overall, the quality of evidence for efficacy outcomes was higher (high or moderate quality) than for adverse event outcomes (very low to moderate quality). Seven of the ten AE outcomes were subjective and were at risk of performance and detection bias from lack of blinding, and all of the studies that contributed to these subjective outcomes were unblinded. Additionally, we further downgraded the quality of evidence for most of these subjective AE outcomes for inconsistency of results and/or imprecision.
Potential biases in the review process
We adhered to having at least two independent review authors select studies, extract data, and conduct risk of bias assessments. These review authors encountered no disagreements that required resolution by a third review author, but a third review author resolved any uncertainties that arose.
In our original protocol, we did not hypothesise that one route of fluoropyrimidine administration (oral or IV) was superior to the other, and we did not state a priori levels of benefit. For the primary outcomes of DFS and PFS, we determined non‐inferiority margins post hoc, whereby 50%, 70%, 80%, and 90% of the activity of the active control (IV fluoropyrimidines) was retained had the original design been one of non‐inferiority. We determined these non‐inferiority margins independent of studies comparing oral versus IV fluoropyrimidine, and we reported all margins. Assessments regarding whether non‐inferiority was demonstrated in this review are potentially at risk of bias, as they are dependent on subjective post hoc judgements about what proportion of the activity of the active control is required to be retained for non‐inferiority to be met.
Agreements and disagreements with other studies or reviews
Reviews including RCTs of multiple oral fluoropyrimidines
A systematic review and meta‐analysis by Sasse et al examined RCTs using capecitabine or UFT/Ftorafur as single agents or in combination therapy (Sasse 2009a). This review used only databases in the systematic search strategy (performed in December 2008) and included no studies using doxifluridine, S‐1, or eniluracil with oral 5‐FU as an oral fluoropyrimidine backbone. Results show some overlap of participants in the list of included studies (Cassidy 2002; Hoff 2001; Van Cutsem 2001b), and this list included a study wherein the co‐intervention was not common to the oral and IV fluoropyrimidine arms (Schmoll 2007). Results presented in the abstract and in the presentation slides show some differences (Sasse 2009a; Sasse 2009b). Quantitative synthesis for the outcomes OS, RR, and PFS included 16 studies, 15 studies, and nine studies respectively (Sasse 2009b). This study combined OS outcome data for patients treated with curative intent and patients treated with palliative intent for CRC. The abstract reported lower ORR and shorter PFS but no significant difference in OS for capecitabine versus infusional IV fluoropyrimidines (cIV); and lower ORR but no difference in PFS or OS for capecitabine versus bolus IV fluoropyrimidines (Sasse 2009a). The abstract reported similar ORR, OS, and PFS for UFT/Ftorafur and bolus 5‐FU (Sasse 2009a). Review authors concluded that "oral fluoropyrimidines are equivalent to bolus 5‐FU in terms of efficacy, but provide less benefit than cIV 5FU." In contrast, our review found no significant subgroup differences between ‘Bolus IV fluoropyrimidine’ and ‘Infusional IV fluoropyrimidine’ subgroups for the PFS outcome.
Reviews of RCTs comparing capecitabine versus IV 5‐FU
A previous systematic review and meta‐analysis pooled results from RCTs comparing capecitabine versus 5‐FU, either alone or in combination therapy for colorectal cancer (Petrelli 2012). Another published individual patient data (IPD) meta‐analysis included six non‐inferiority RCTs from the Roche clinical trials database and included one advanced gastric cancer study (Cassidy 2011b).
Petrelli et al searched databases and American Society of Clinical Oncology (ASCO) conference proceedings and included in their review 17 studies in patients treated with palliative intent for CRC with chemotherapy, including 15 of the studies identified for our review (Cassidy 2011a; Comella 2009; Diaz‐Rubio 2007; Ducreux 2011; Fuchs 2007; Hochster TREE‐1 2008; Hochster TREE‐2 2008; Hoff 2001; Kohne 2008; Martoni 2006; Pectasides 2012; Porschen 2007; Rothenberg 2008; Souglakos 2012; Van Cutsem 2001b). Two studies that we had excluded from our review with reasons were also included (Munoz 2008; Skof 2009). Toxicity outcomes were not restricted to grade ≥ 3 AEs. For efficacy outcomes, review authors also reported significant heterogeneity between the included studies for ORR. Consistent with our findings for the ‘Capecitabine’ subgroup, the pooled HR for both PFS (seven studies) and OS (six studies) in Petrelli 2012 showed no difference between oral and IV fluoropyrimidines.
Reviews of RCTs comparing capecitabine and infusional 5‐FU in combination with irinotecan, and capecitabine and infusional 5‐FU in combination with oxaliplatin
For a systematic review and meta‐analysis published by Montagnani et al, review authors searched databases and conference proceedings for European Society of Medical Oncology (ESMO) and ASCO, and identified only three RCTs comparing capecitabine and infusional 5‐FU in combination with irinotecan for treatment of metastatic CRC (Montagnani 2010). We included two of these studies in our review (Fuchs 2007; Kohne 2008), and we excluded one study (Skof 2009) from our review. The study population for Skof 2009 included selected patients with unresectable liver‐only metastases who had Eastern Cooperative Oncology Group Performance Status (ECOG PS) of 0 to 1.
Review authors did not report an assessment of heterogeneity for ORR. PFS was worse with oral fluoropyrimidine use (using the pooled HR for PFS reported in the text of the study report). This differed from our findings in the ‘Irinotecan‐based’ subgroup (including any oral fluoropyrimidine), which indicated no difference between oral and IV fluoropyrimidines. For grade ≥ 3 diarrhoea, the findings of Montagnani were consistent with the findings of our analyses for the ‘Irinotecan‐based’ subgroup.
Arkenau et al published a systematic review and meta‐analysis of RCTs comparing capecitabine and infusional 5‐FU in combination with oxaliplatin for treatment of metastatic CRC, with a search strategy including databases, trial registries, and conference proceedings (Arkenau 2008). We included all of the seven RCTs from this study in our review (Cassidy 2011a; Diaz‐Rubio 2007; Ducreux 2011; Hochster TREE‐1 2008; Hochster TREE‐2 2008; Martoni 2006; Porschen 2007).
The HRs for PFS and OS in Arkenau 2008, which showed no evidence of a difference for oral versus IV fluoropyrimidines, were in agreement with results for the ‘Oxaliplatin‐based’ subgroup in our review. Other meta‐analyses of studies that included oxaliplatin‐based combination regimens with a capecitabine arm have reported similar findings for PFS and OS (Cassidy 2008; Cuppone 2008). The pooled estimate for grade ≥ 3 diarrhoea, which indicated worse outcomes with oral fluoropyrimidine treatment, was also similar to that in our 'Oxaliplatin‐based' subgroup.
Schmoll et al published an IPD meta‐analysis of four large RCTs comparing effects of adjuvant treatment with capecitabine or fluorouracil, with or without oxaliplatin, on survival outcomes in resected stage III colon cancer (Schmoll 2014). A total of 8734 participants from two trials that we had included in our review (De Gramont 2012; Twelves 2012), as well as from the NSABP C‐08 and XELOXA (NO16968) trials (Allegra 2011; Haller 2011), were included in a pooled analysis of disease‐free, relapse‐free, and overall survival. The XELOXA study compared capecitabine plus oxaliplatin versus bolus IV FU/folinic acid (FA), and the NSABP C‐08 study compared modified FOLFOX6 (mFOLFOX6) versus mFOLFOX6 with BEV.
In keeping with the findings of our review, the IPD meta‐analysis by Schmoll et al revealed no significant differences in adjusted DFS and OS for capecitabine with or without oxaliplatin compared with IV 5‐FU/LV with or without oxaliplatin.

Study flow diagram.

Risk of bias graph: review authors' judgements about each risk of bias item presented as percentages across all included studies.1
1 In this graph, the risk of bias for each domain was calculated using the worst assessment documented for that domain in the contributing studies.

Risk of bias summary: review authors' judgements about each risk of bias item for each included study.1
1 In this summary, the risk of bias for each domain was scored using the worst assessment documented for that domain in the study.

Forest plot of disease‐free survival.

Forest plot of comparison: 4 Progression‐free survival with, outcome: 4.4 Progression‐free survival with subgroup analysis ‐ oral fluoropyrimidine backbone.
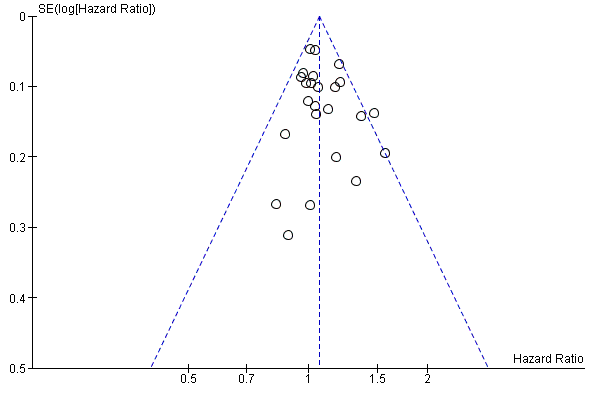
Funnel plot of progression‐free survival.

Comparison 1 Disease‐free survival, Outcome 1 Disease‐free survival.

Comparison 1 Disease‐free survival, Outcome 2 Disease‐free survival with subgroup analysis ‐ Chemotherapy vs chemo‐radiotherapy.
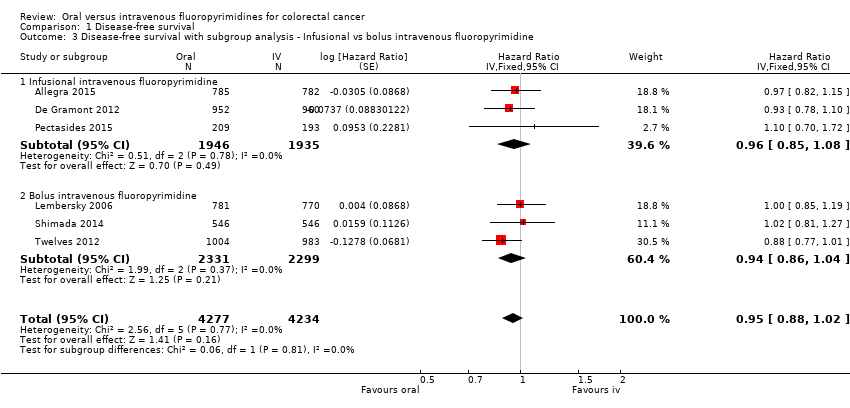
Comparison 1 Disease‐free survival, Outcome 3 Disease‐free survival with subgroup analysis ‐ Infusional vs bolus intravenous fluoropyrimidine.

Comparison 1 Disease‐free survival, Outcome 4 Disease‐free survival with subgroup analysis ‐ Oral fluoropyrimidine backbone.
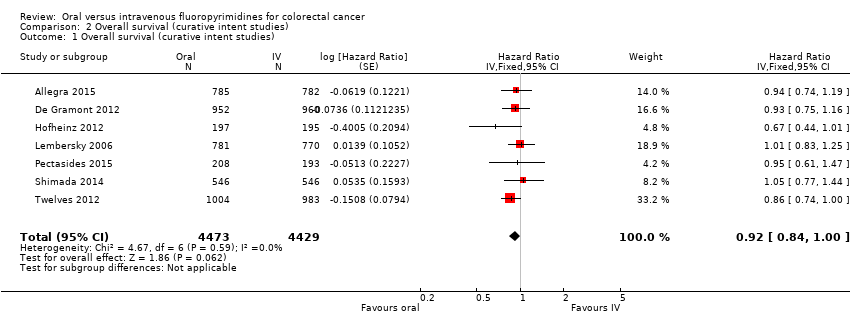
Comparison 2 Overall survival (curative intent studies), Outcome 1 Overall survival (curative intent studies).
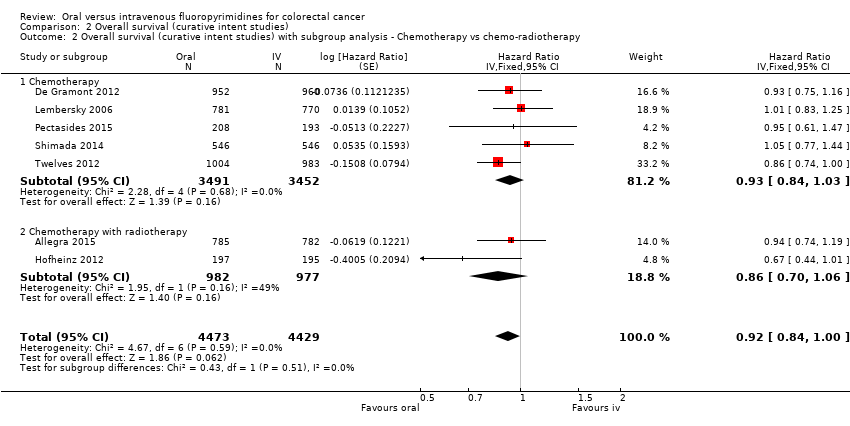
Comparison 2 Overall survival (curative intent studies), Outcome 2 Overall survival (curative intent studies) with subgroup analysis ‐ Chemotherapy vs chemo‐radiotherapy.

Comparison 2 Overall survival (curative intent studies), Outcome 3 Overall survival (curative intent studies) with subgroup analysis ‐ Infusional vs bolus intravenous fluoropyrimidine.
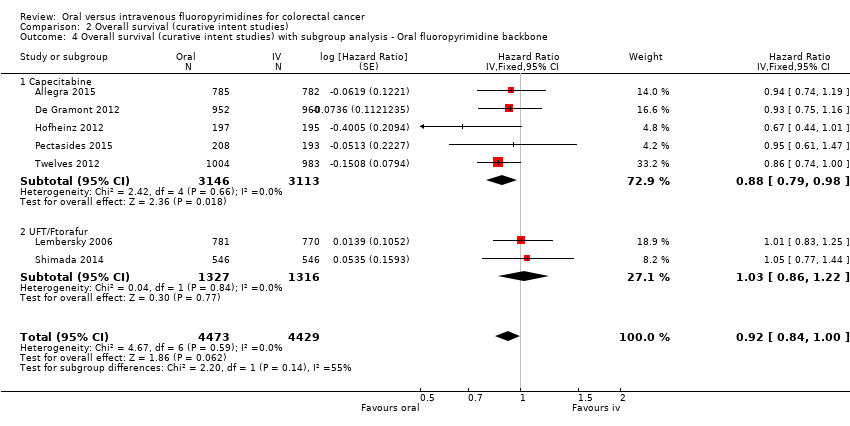
Comparison 2 Overall survival (curative intent studies), Outcome 4 Overall survival (curative intent studies) with subgroup analysis ‐ Oral fluoropyrimidine backbone.

Comparison 3 Grade ≥ 3 adverse events (curative intent studies), Outcome 1 Grade ≥ 3 diarrhoea (curative intent studies).
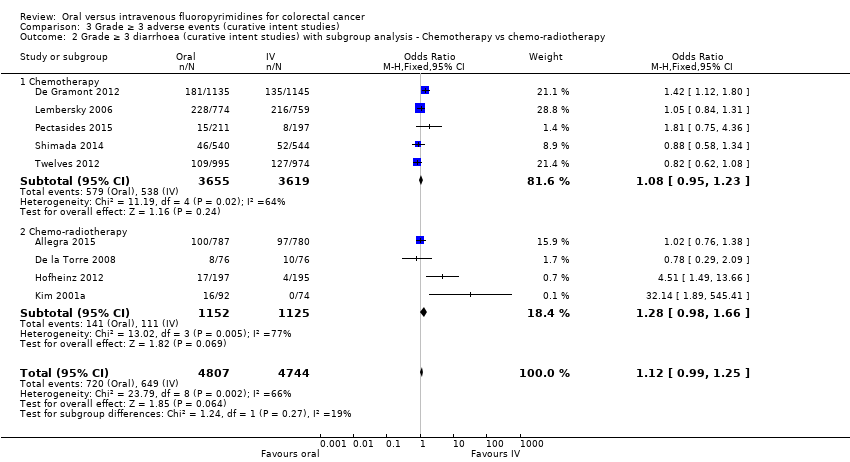
Comparison 3 Grade ≥ 3 adverse events (curative intent studies), Outcome 2 Grade ≥ 3 diarrhoea (curative intent studies) with subgroup analysis ‐ Chemotherapy vs chemo‐radiotherapy.

Comparison 3 Grade ≥ 3 adverse events (curative intent studies), Outcome 3 Grade ≥ 3 diarrhoea (curative intent studies) with subgroup analysis ‐ Infusional vs bolus intravenous fluoropyrimidine.
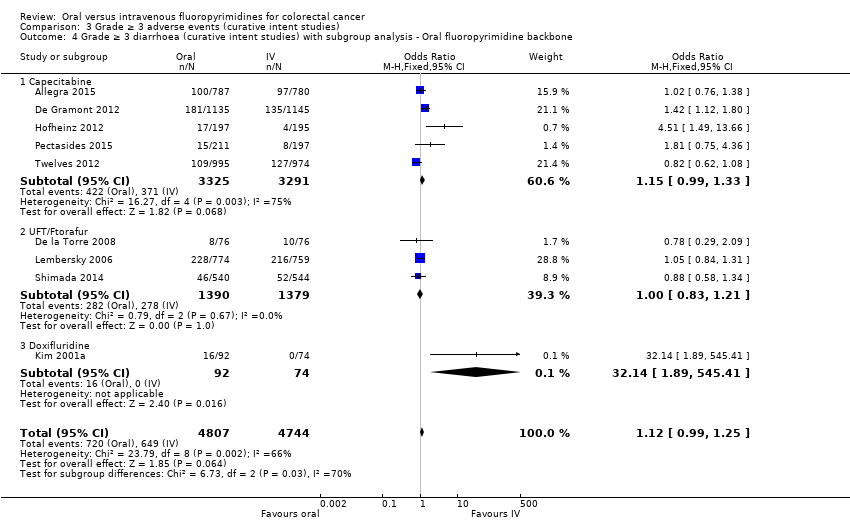
Comparison 3 Grade ≥ 3 adverse events (curative intent studies), Outcome 4 Grade ≥ 3 diarrhoea (curative intent studies) with subgroup analysis ‐ Oral fluoropyrimidine backbone.

Comparison 3 Grade ≥ 3 adverse events (curative intent studies), Outcome 5 Grade ≥ 3 hand foot syndrome (curative intent studies).
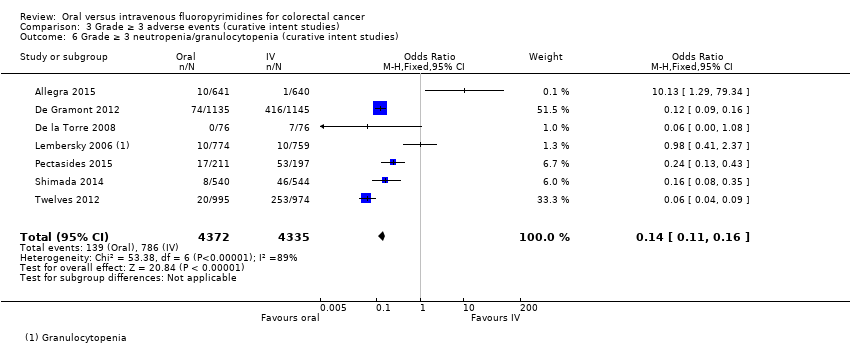
Comparison 3 Grade ≥ 3 adverse events (curative intent studies), Outcome 6 Grade ≥ 3 neutropenia/granulocytopenia (curative intent studies).
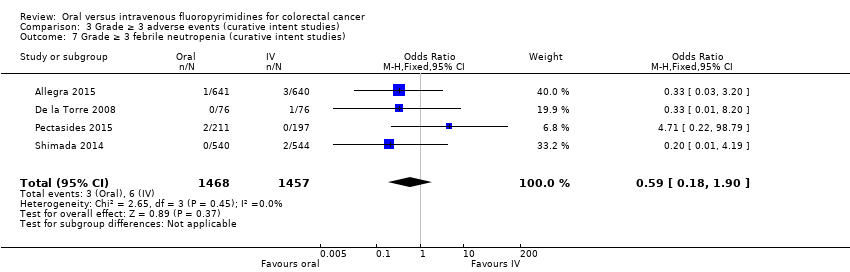
Comparison 3 Grade ≥ 3 adverse events (curative intent studies), Outcome 7 Grade ≥ 3 febrile neutropenia (curative intent studies).
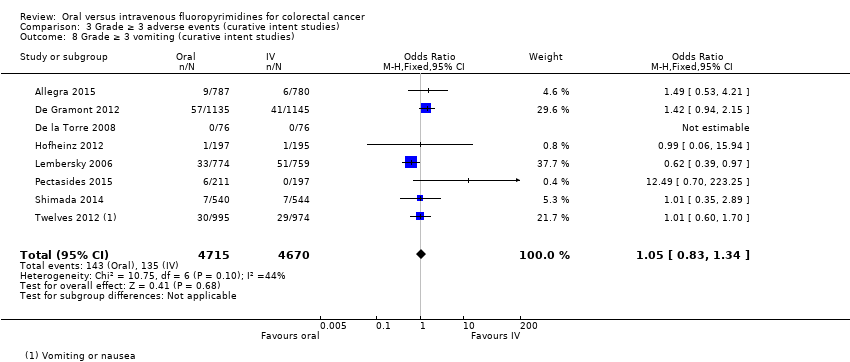
Comparison 3 Grade ≥ 3 adverse events (curative intent studies), Outcome 8 Grade ≥ 3 vomiting (curative intent studies).
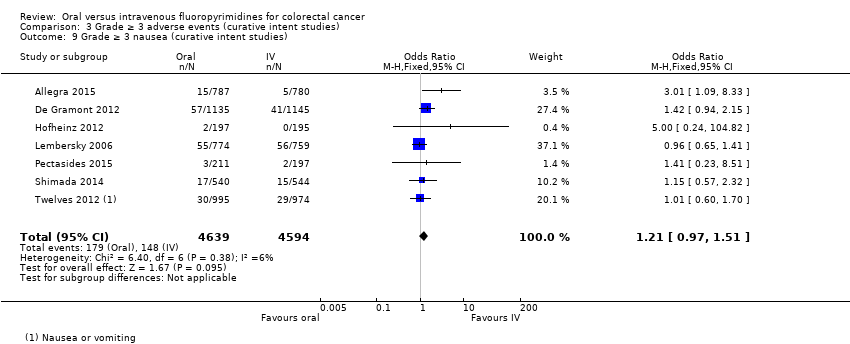
Comparison 3 Grade ≥ 3 adverse events (curative intent studies), Outcome 9 Grade ≥ 3 nausea (curative intent studies).
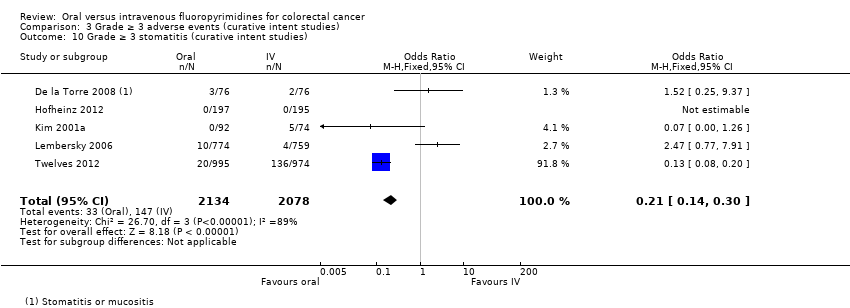
Comparison 3 Grade ≥ 3 adverse events (curative intent studies), Outcome 10 Grade ≥ 3 stomatitis (curative intent studies).
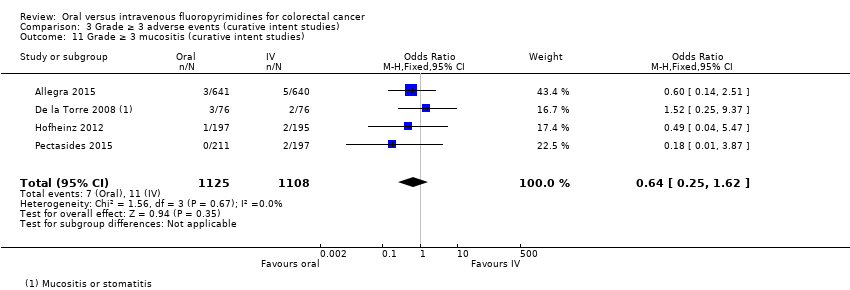
Comparison 3 Grade ≥ 3 adverse events (curative intent studies), Outcome 11 Grade ≥ 3 mucositis (curative intent studies).
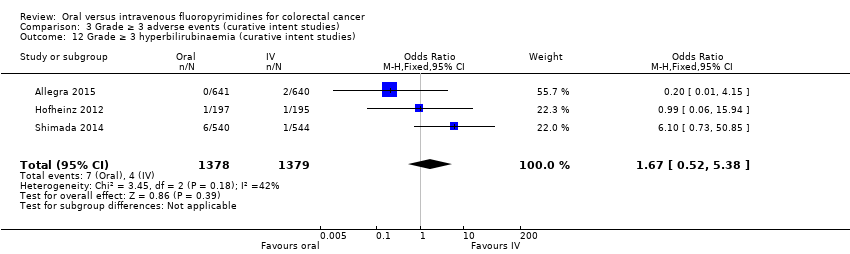
Comparison 3 Grade ≥ 3 adverse events (curative intent studies), Outcome 12 Grade ≥ 3 hyperbilirubinaemia (curative intent studies).
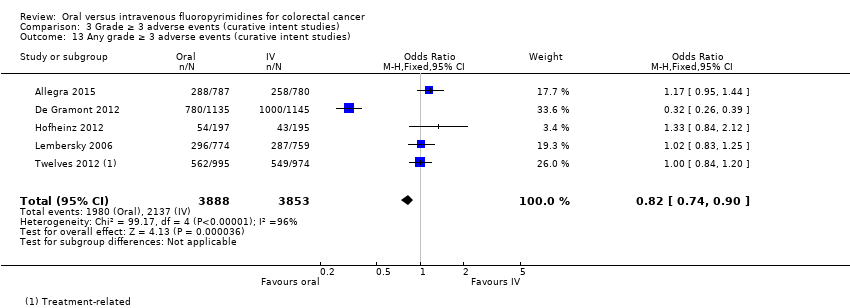
Comparison 3 Grade ≥ 3 adverse events (curative intent studies), Outcome 13 Any grade ≥ 3 adverse events (curative intent studies).

Comparison 4 Progression‐free survival, Outcome 1 Progression‐free survival.
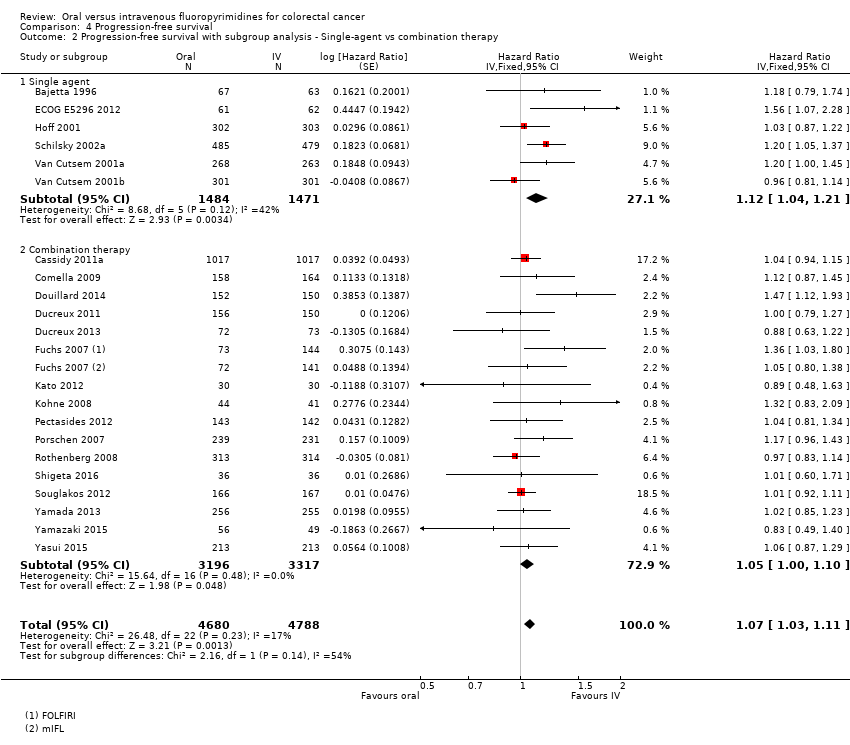
Comparison 4 Progression‐free survival, Outcome 2 Progression‐free survival with subgroup analysis ‐ Single‐agent vs combination therapy.

Comparison 4 Progression‐free survival, Outcome 3 Progression‐free survival with subgroup analysis ‐ Infusional vs bolus intravenous fluoropyrimidine.

Comparison 4 Progression‐free survival, Outcome 4 Progression‐free survival with subgroup analysis ‐ Oral fluoropyrimidine backbone.

Comparison 4 Progression‐free survival, Outcome 5 Progression‐free survival for combination therapy with subgroup analysis ‐ Oxaliplatin‐based vs irinotecan‐based.
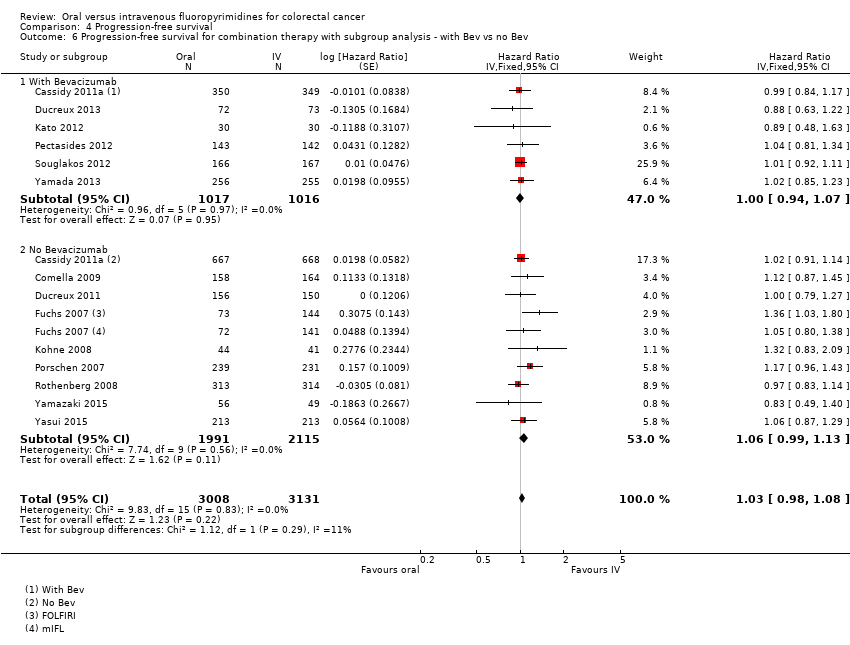
Comparison 4 Progression‐free survival, Outcome 6 Progression‐free survival for combination therapy with subgroup analysis ‐ with Bev vs no Bev.
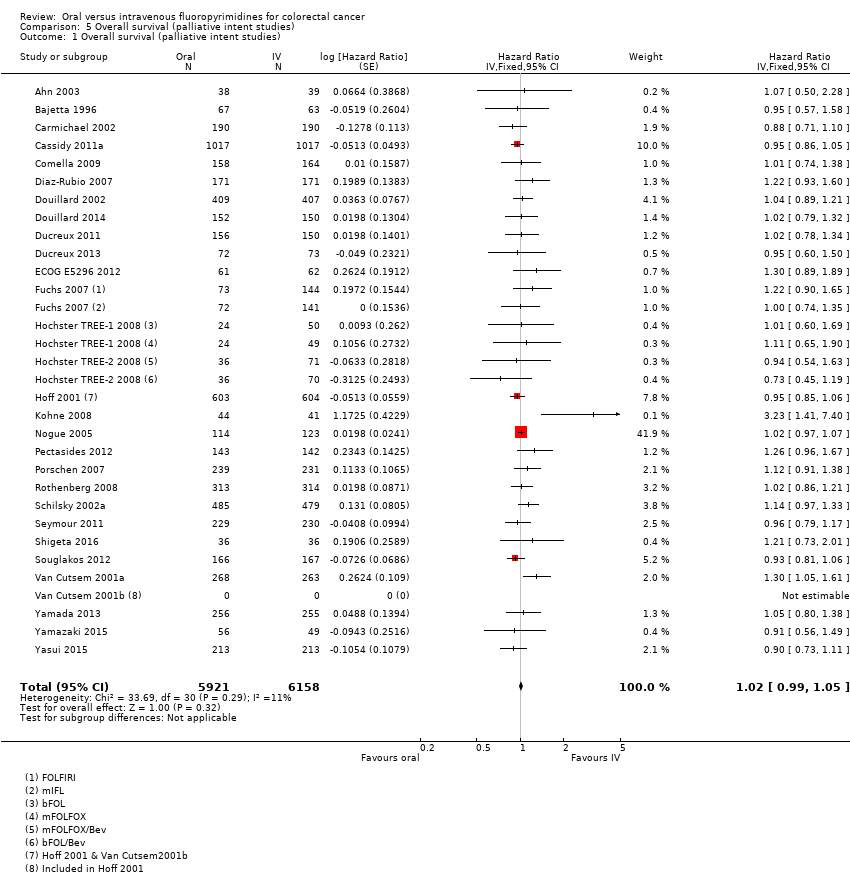
Comparison 5 Overall survival (palliative intent studies), Outcome 1 Overall survival (palliative intent studies).

Comparison 5 Overall survival (palliative intent studies), Outcome 2 Overall survival (palliative intent studies) with subgroup analysis ‐ Single‐agent vs combination therapy.

Comparison 5 Overall survival (palliative intent studies), Outcome 3 Overall survival (palliative intent studies) with subgroup analysis ‐ Infusional vs bolus intravenous fluoropyrimidine.
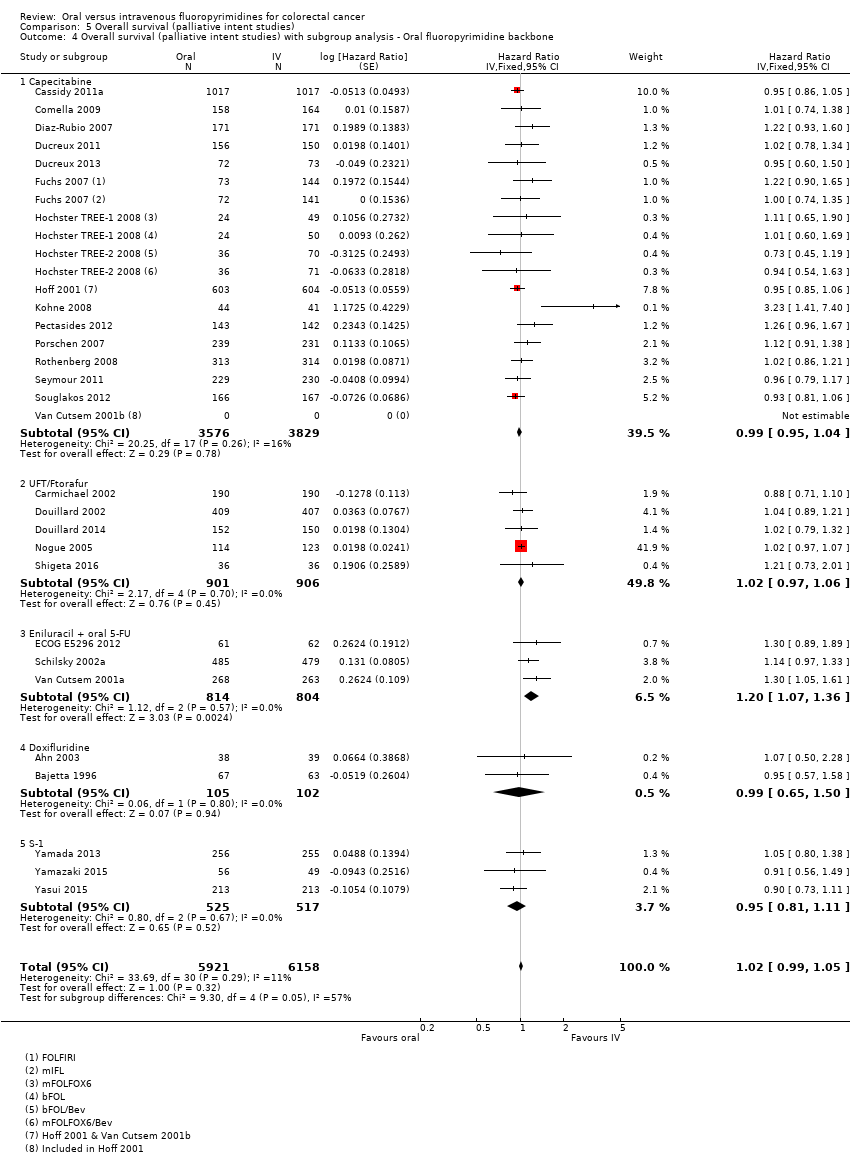
Comparison 5 Overall survival (palliative intent studies), Outcome 4 Overall survival (palliative intent studies) with subgroup analysis ‐ Oral fluoropyrimidine backbone.
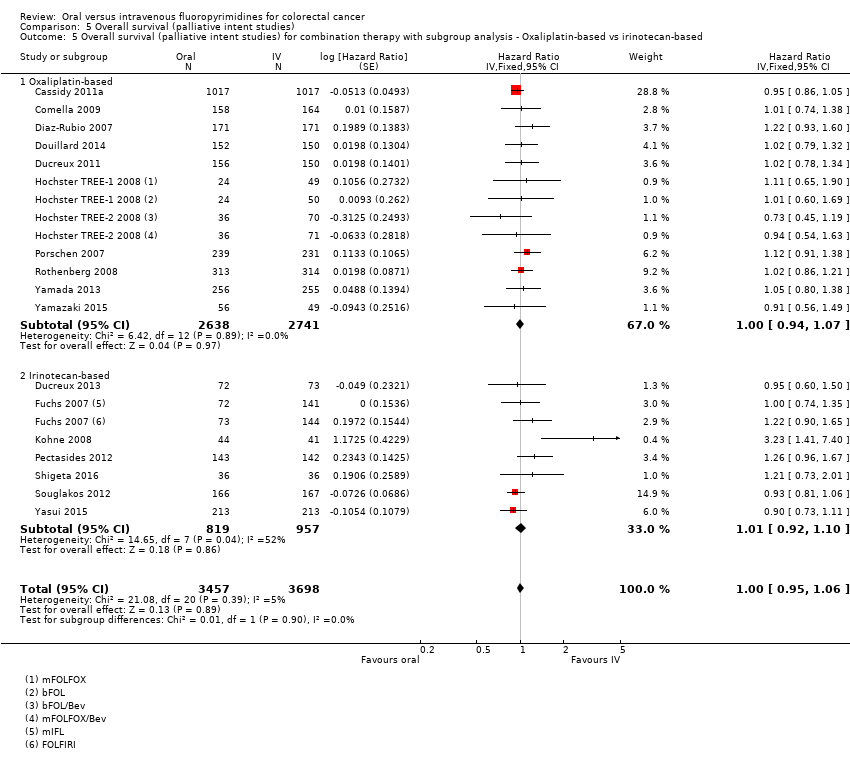
Comparison 5 Overall survival (palliative intent studies), Outcome 5 Overall survival (palliative intent studies) for combination therapy with subgroup analysis ‐ Oxaliplatin‐based vs irinotecan‐based.
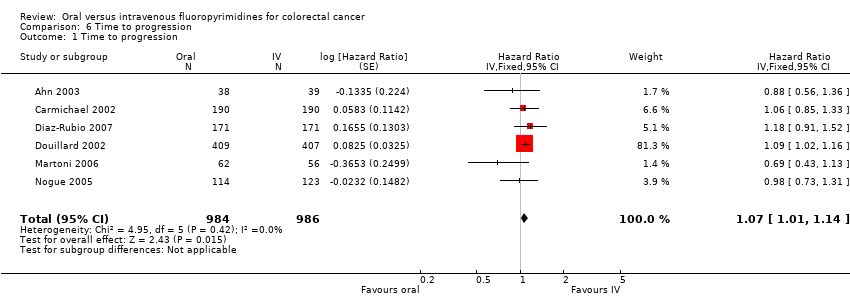
Comparison 6 Time to progression, Outcome 1 Time to progression.
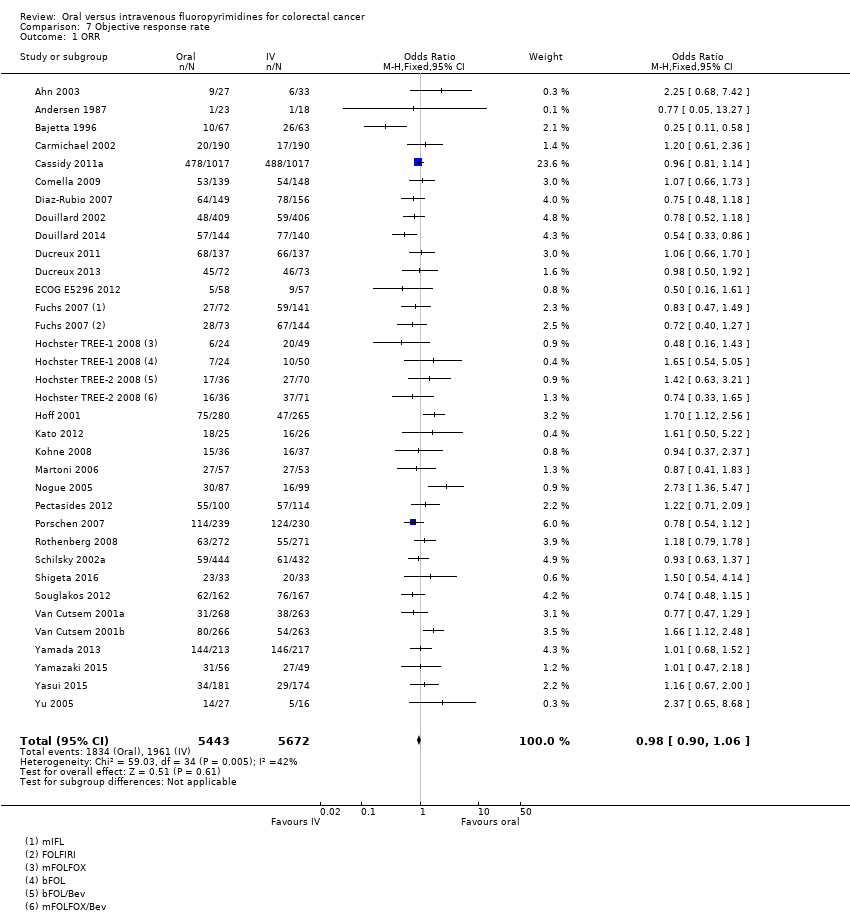
Comparison 7 Objective response rate, Outcome 1 ORR.
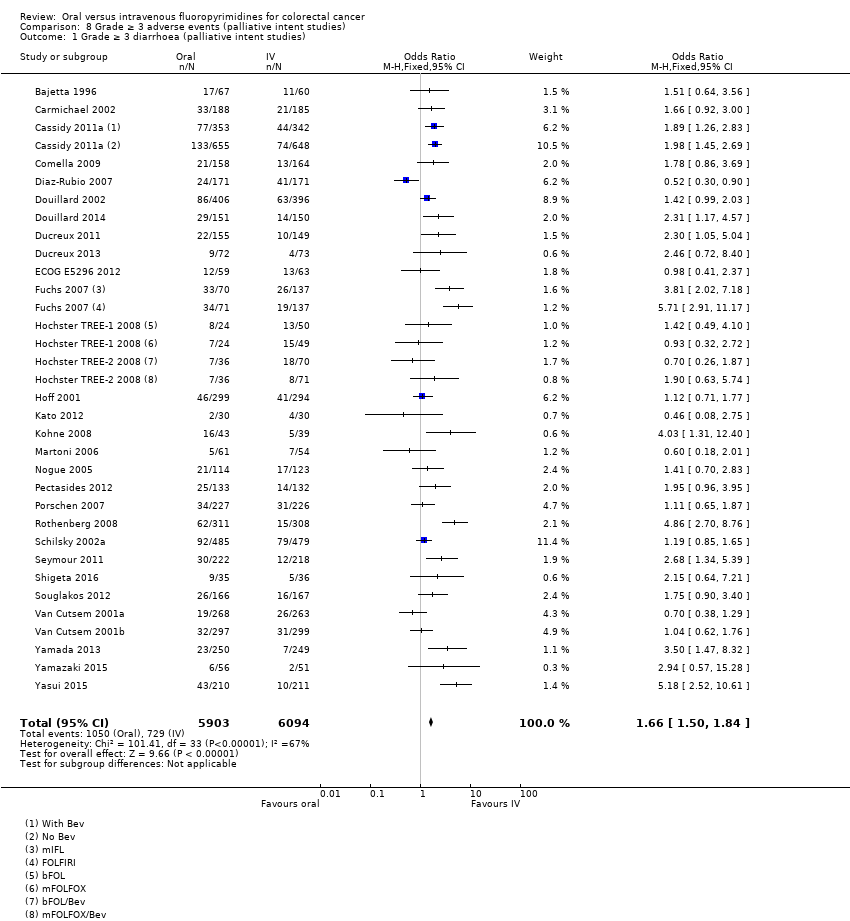
Comparison 8 Grade ≥ 3 adverse events (palliative intent studies), Outcome 1 Grade ≥ 3 diarrhoea (palliative intent studies).

Comparison 8 Grade ≥ 3 adverse events (palliative intent studies), Outcome 2 Grade ≥ 3 diarrhoea (palliative intent studies) with subgroup analysis ‐ Single‐agent vs combination therapy.

Comparison 8 Grade ≥ 3 adverse events (palliative intent studies), Outcome 3 Grade ≥ 3 diarrhea (palliative intent studies) with subgroup analysis ‐ Infusional vs bolus intravenous fluoropyrimidine.
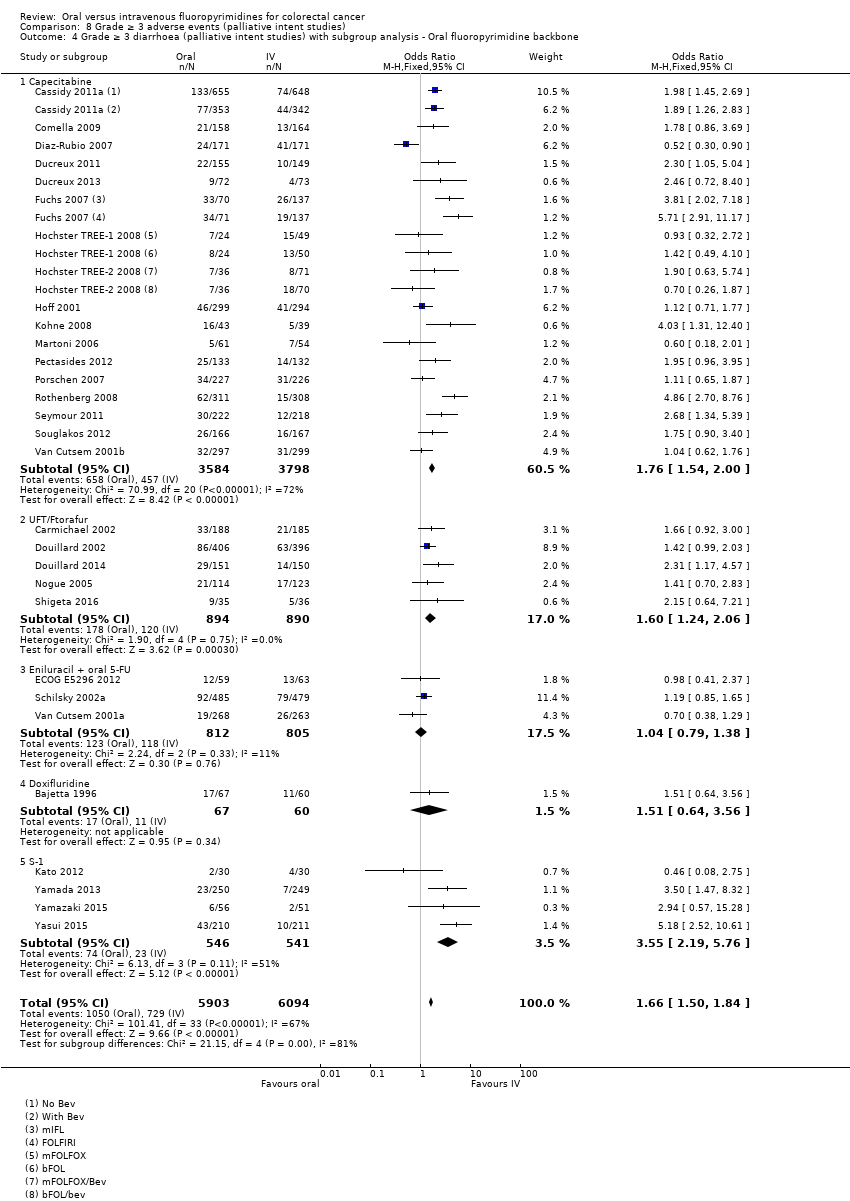
Comparison 8 Grade ≥ 3 adverse events (palliative intent studies), Outcome 4 Grade ≥ 3 diarrhoea (palliative intent studies) with subgroup analysis ‐ Oral fluoropyrimidine backbone.
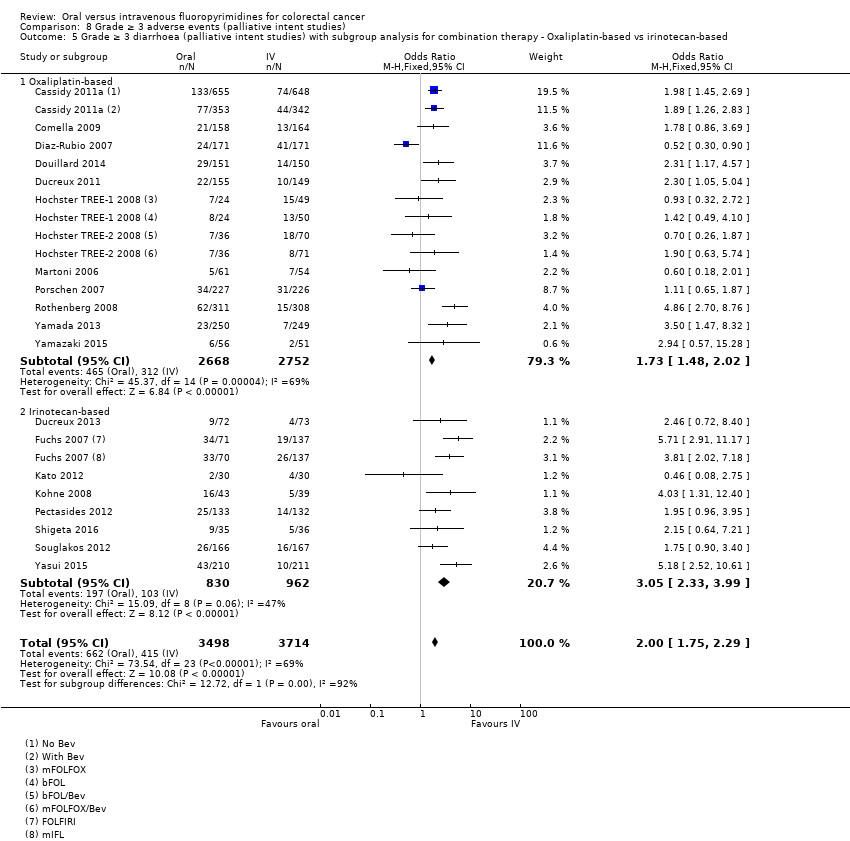
Comparison 8 Grade ≥ 3 adverse events (palliative intent studies), Outcome 5 Grade ≥ 3 diarrhoea (palliative intent studies) with subgroup analysis for combination therapy ‐ Oxaliplatin‐based vs irinotecan‐based.

Comparison 8 Grade ≥ 3 adverse events (palliative intent studies), Outcome 6 Grade ≥ 3 hand foot syndrome (palliative intent studies).
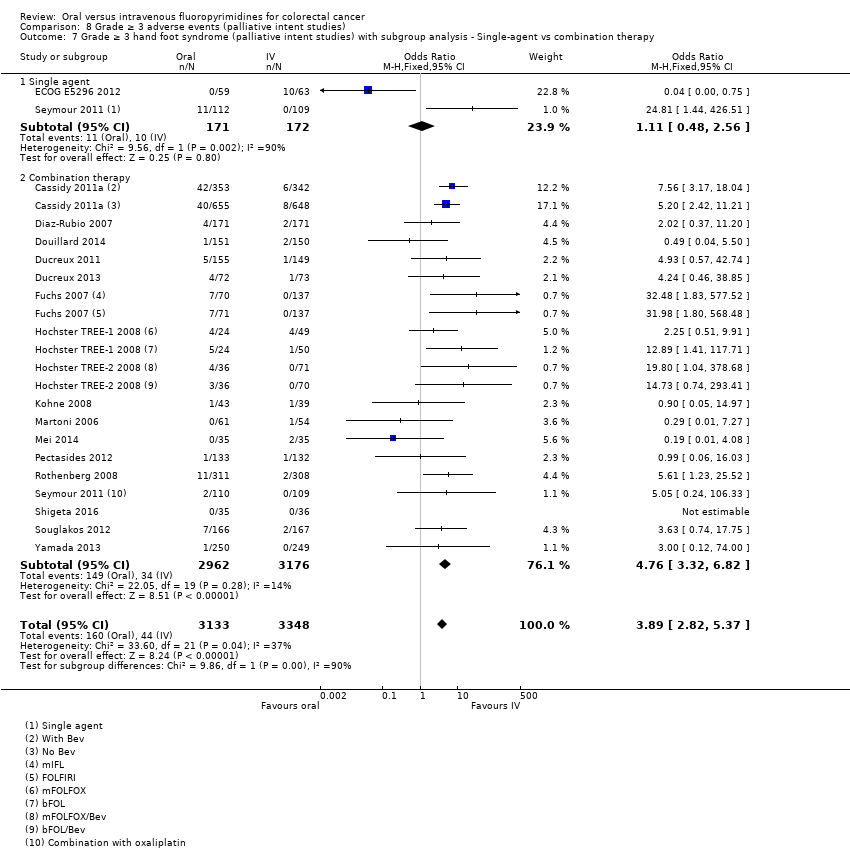
Comparison 8 Grade ≥ 3 adverse events (palliative intent studies), Outcome 7 Grade ≥ 3 hand foot syndrome (palliative intent studies) with subgroup analysis ‐ Single‐agent vs combination therapy.

Comparison 8 Grade ≥ 3 adverse events (palliative intent studies), Outcome 8 Grade ≥ 3 hand foot syndrome (palliative intent studies) with subgroup analysis ‐ Infusional vs bolus intravenous fluoropyrimidine.
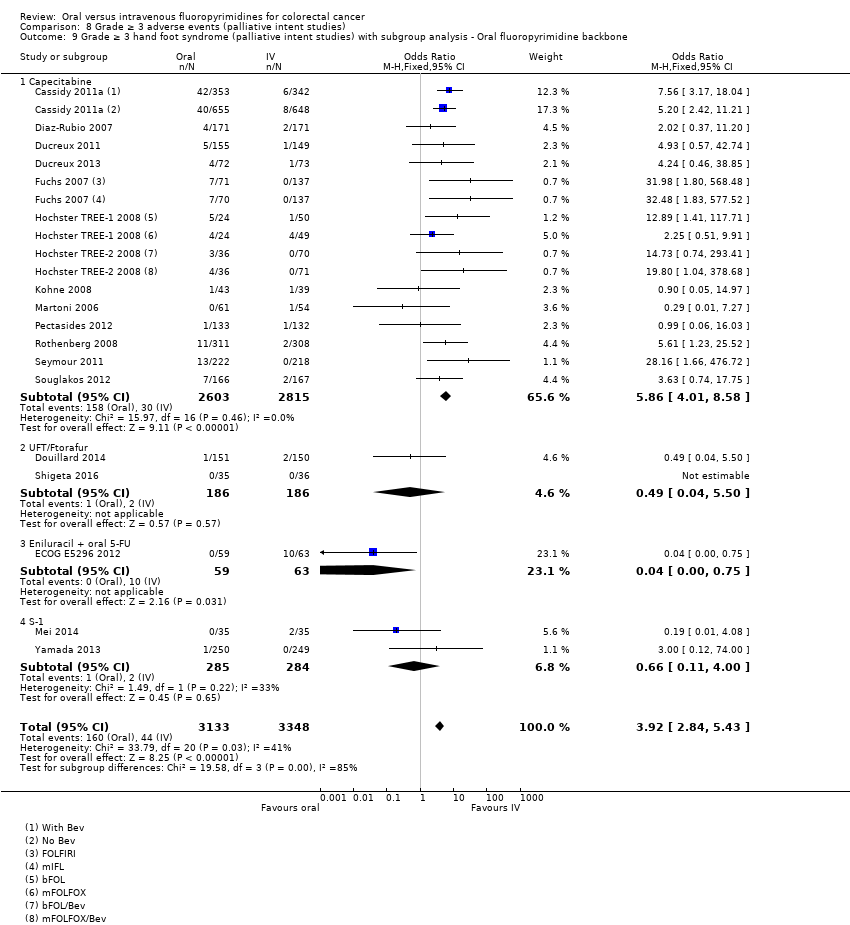
Comparison 8 Grade ≥ 3 adverse events (palliative intent studies), Outcome 9 Grade ≥ 3 hand foot syndrome (palliative intent studies) with subgroup analysis ‐ Oral fluoropyrimidine backbone.
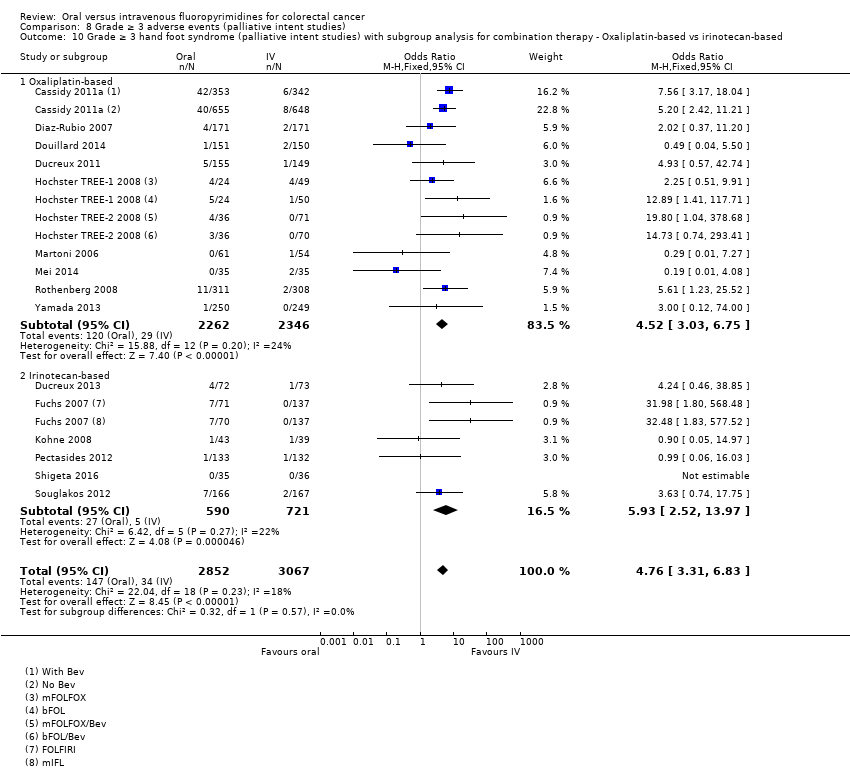
Comparison 8 Grade ≥ 3 adverse events (palliative intent studies), Outcome 10 Grade ≥ 3 hand foot syndrome (palliative intent studies) with subgroup analysis for combination therapy ‐ Oxaliplatin‐based vs irinotecan‐based.
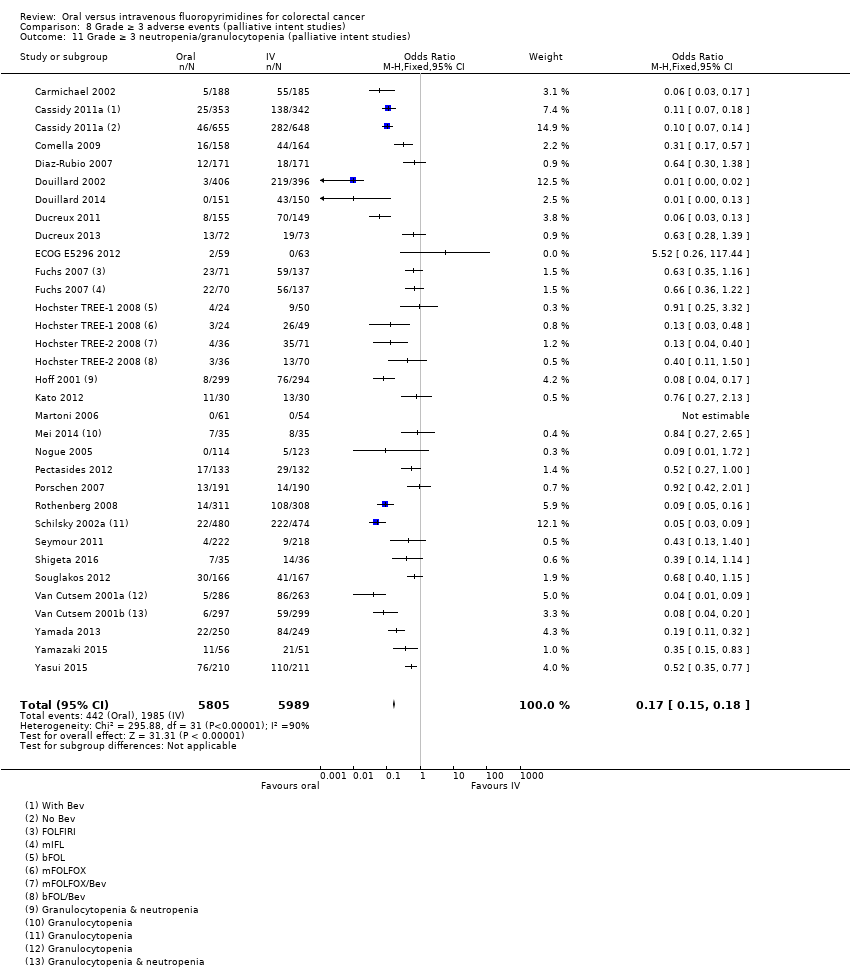
Comparison 8 Grade ≥ 3 adverse events (palliative intent studies), Outcome 11 Grade ≥ 3 neutropenia/granulocytopenia (palliative intent studies).
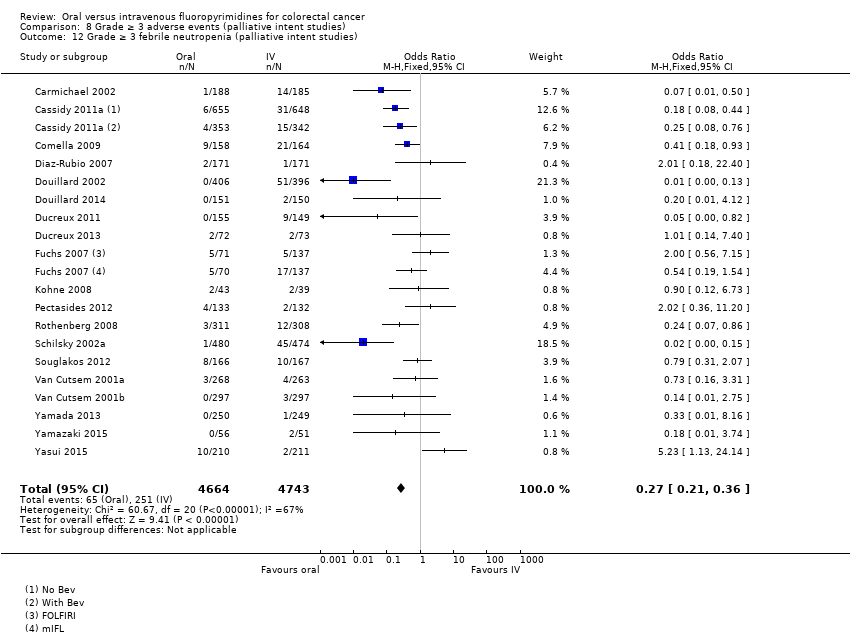
Comparison 8 Grade ≥ 3 adverse events (palliative intent studies), Outcome 12 Grade ≥ 3 febrile neutropenia (palliative intent studies).

Comparison 8 Grade ≥ 3 adverse events (palliative intent studies), Outcome 13 Grade ≥ 3 vomiting (palliative intent studies).
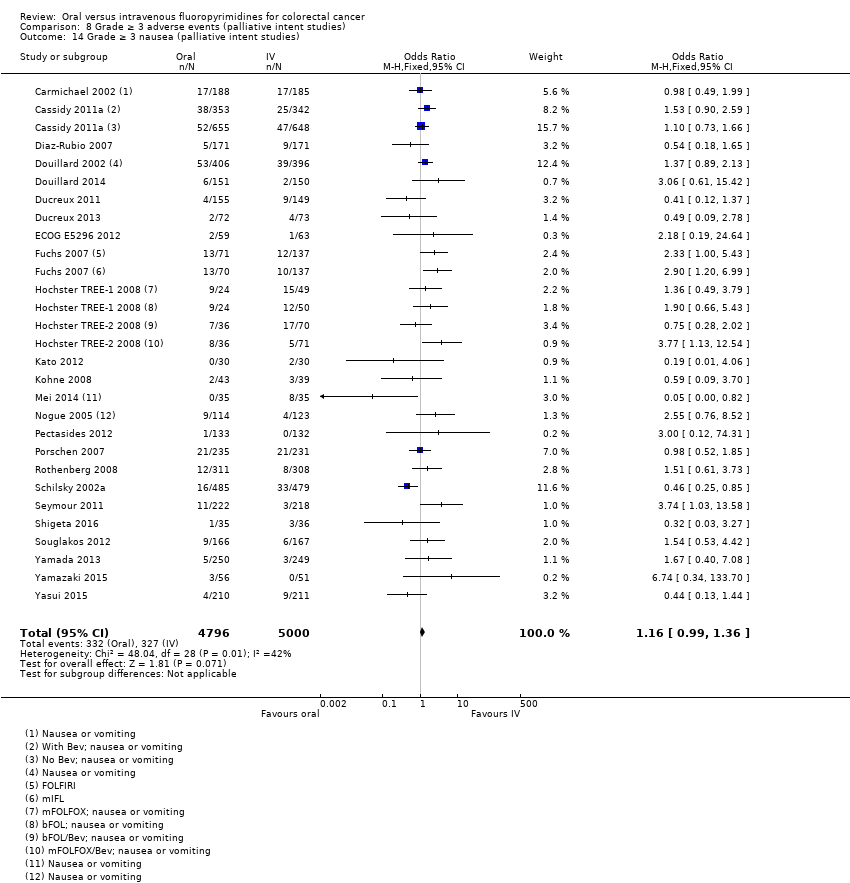
Comparison 8 Grade ≥ 3 adverse events (palliative intent studies), Outcome 14 Grade ≥ 3 nausea (palliative intent studies).
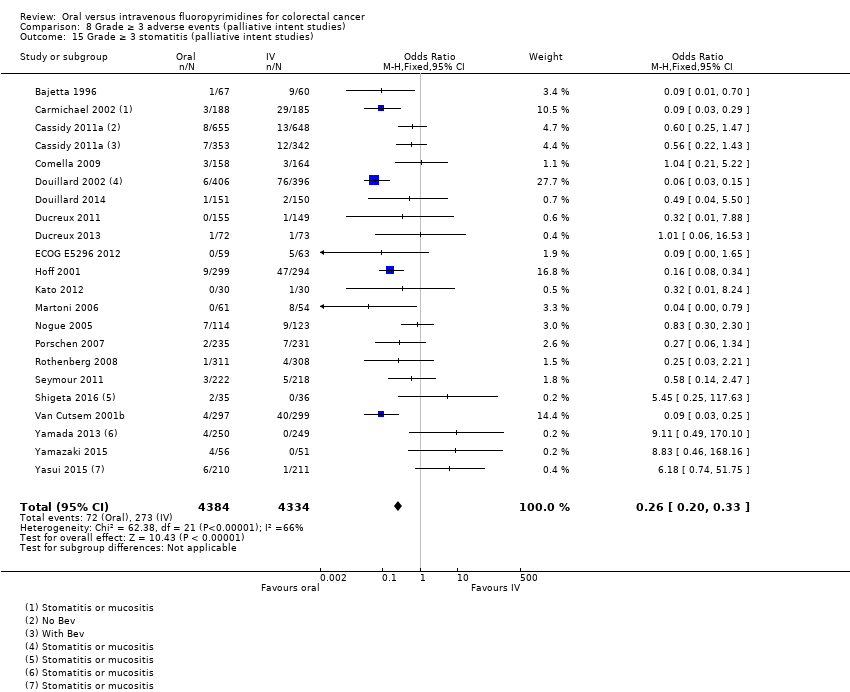
Comparison 8 Grade ≥ 3 adverse events (palliative intent studies), Outcome 15 Grade ≥ 3 stomatitis (palliative intent studies).
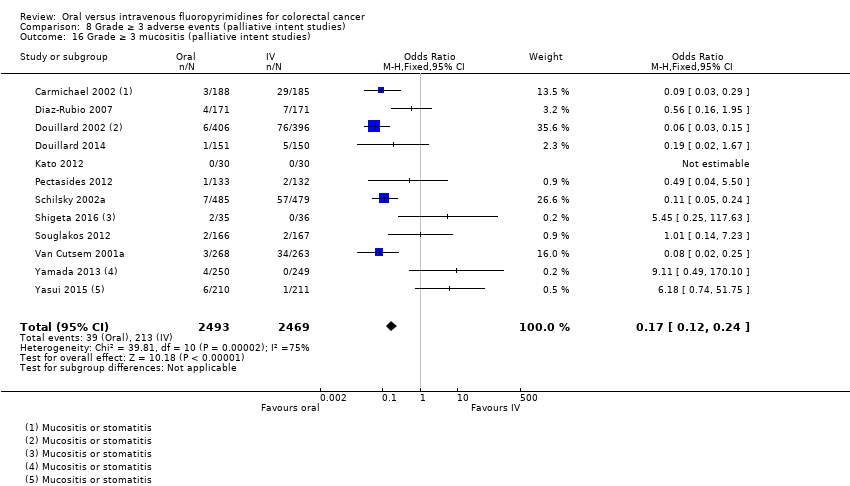
Comparison 8 Grade ≥ 3 adverse events (palliative intent studies), Outcome 16 Grade ≥ 3 mucositis (palliative intent studies).

Comparison 8 Grade ≥ 3 adverse events (palliative intent studies), Outcome 17 Grade ≥ 3 hyperbilirubinaemia (palliative intent studies).
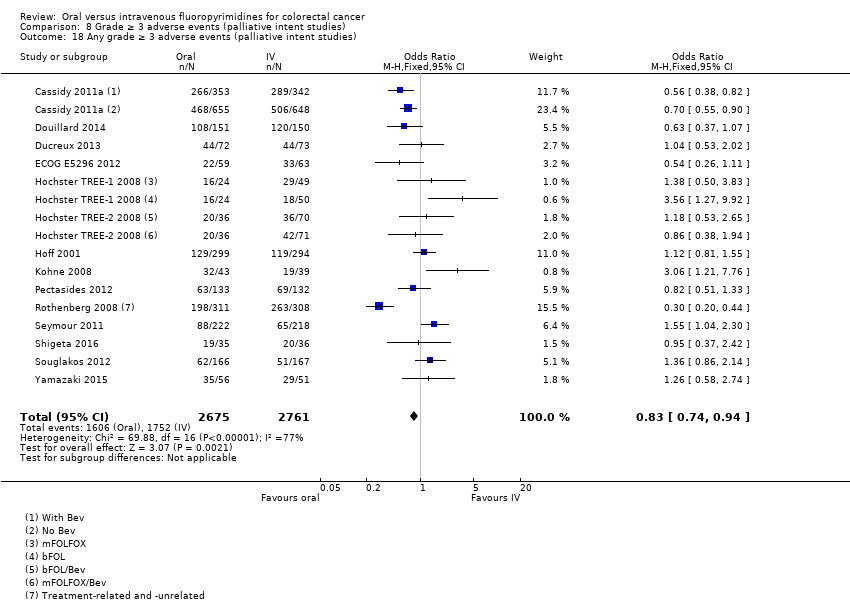
Comparison 8 Grade ≥ 3 adverse events (palliative intent studies), Outcome 18 Any grade ≥ 3 adverse events (palliative intent studies).
| Oral compared with intravenous fluoropyrimidines for colorectal cancer ‐ Patients treated with curative intent | |||||
| Patient or population: Patients treated with curative intent for colorectal cancer with neoadjuvant and/or adjuvant chemotherapy Setting: Hospital Intervention: Oral fluoropyrimidines Comparison: Intravenous fluoropyrimidines | |||||
| Outcomes | Illustrative comparative risks (95% CI) | Relative effect | No. of participants | Quality of the evidence | |
| Assumed risk* | Corresponding risk** | ||||
| Intravenous fluoropyrimidines | Oral fluoropyrimidines | ||||
| Disease‐free survival | 313 per 1000a | 291 per 1000 (272 to 313) | HR 0.93 | 8903 | ⊕⊕⊕⊝ |
| Overall survival | 222 per 1000c | 204 per 1000 (186 to 222) | HR 0.92 (0.84 to 1.00) | 8902 (7 RCTs) | ⊕⊕⊕⊕ |
| Grade ≥ 3 diarrhoea | 137 per 1000d | 153 per 1000 (135 to 171) | OR 1.12 | 9551 | ⊕⊝⊝⊝ |
| Grade ≥ 3 hand foot syndrome | 8 per 1000d | 37 per 1000 (24 to 57) | OR 4.59g | 5731 | ⊕⊕⊝⊝ |
| Grade ≥ 3 neutropenia/granulocytopenia | 181 per 1000d | 25 per 1000 (20 to 29) | OR 0.14 (0.11 to 0.16) | 8087 (7 RCTs) | ⊕⊕⊕⊝ |
| *The basis for the assumed risk is provided in footnotes. **The corresponding risk (and its 95% CI) is based on the assumed risk in the comparison group and the relative effect of the intervention (and its 95% CI). Pooled estimates from fixed‐effects meta‐analysis are reported in the table | |||||
| GRADE Working Group grades of evidence | |||||
| aThe assumed risk for disease‐free survival was based on the 3‐year disease‐free survival rate in the control group from studies in the meta‐analysis (68.7%) bDowngraded by one level owing to a high risk of bias in included studies. cThe assumed risk for overall survival was based on the 5‐year overall survival rate in the control group from studies in the meta‐analysis (77.8%) dThe assumed risk for each grade ≥ 3 AE was the mean risk in the control group from studies in the meta‐analysis eDowngraded by one level owing to inconsistency of results that was supported by non‐overlapping CIs, high I2 values, and statistically significant heterogeneity of effect estimates fDowngraded by one level owing to imprecision gRandom‐effects estimate, OR 2.36 (95% CI 0.52 to 10.74). Pooled effect estimate was sensitive to the meta‐analysis model used | |||||
| Oral compared with intravenous fluoropyrimidines for colorectal cancer ‐ Patients treated with palliative intent | |||||
| Patient or population: Patients treated with palliative intent for inoperable advanced or metastatic colorectal cancer with chemotherapy Setting: Hospital Intervention: Oral fluoropyrimidines Comparison: Intravenous fluoropyrimidines | |||||
| Outcomes | Illustrative comparative risks (95% CI) | Relative effect | No. of participants | Quality of the evidence | |
| Assumed risk* | Corresponding risk** | ||||
| Intravenous fluoropyrimidines | Oral fluoropyrimidines | ||||
| Progression‐free survival | 398 per 1000a | 422 per 1000 (406 to 442) | HR 1.06 | 9927 | ⊕⊕⊕⊝ |
| Overall survival | 336 per 1000c | 343 per 1000 (333 to 353) | HR 1.02 (0.99 to 1.05) | 12,079 (29 RCTs) | ⊕⊕⊕⊕ |
| Grade ≥ 3 diarrhoea | 120 per 1000d | 199 per 1000 (180 to 221) | OR 1.66 | 11,997 | ⊕⊕⊝⊝ |
| Grade ≥ 3 hand foot syndrome | 13 per 1000d | 51 per 1000 (37 to 71) | OR 3.92 | 6481 | ⊕⊕⊕⊝ |
| Grade ≥ 3 neutropenia/granulocytopenia | 331 per 1000d | 56 per 1000 (50 to 60) | OR 0.17 (0.15 to 0.18) | 11,794 (29 RCTs) | ⊕⊕⊝⊝ |
| *The basis for the assumed risk is provided in footnotes. **The corresponding risk (and its 95% CI) is based on the assumed risk in the comparison group and the relative effect of the intervention (and its 95% CI). Pooled estimates from fixed‐effects meta‐analysis are reported in the table | |||||
| GRADE Working Group grades of evidence | |||||
| aThe assumed risk for progression‐free survival was based on the 6‐month progression‐free survival rate in the control group from studies in the meta‐analysis (60.2%) bDowngraded by one level owing to a high risk of bias in included studies cThe assumed risk for overall survival was based on the 12‐month overall survival rate in the control group from studies in the meta‐analysis (66.4%) dThe assumed risk for each grade ≥ 3 AE was the mean risk in the control group from the studies in the meta‐analysis eDowngraded by one level owing to inconsistency of results that was supported by non‐overlapping CIs, high I2 values, and statistically significant heterogeneity of effect estimates | |||||
| Treatment setting | Study ID | Phase | Treatment type | Treatment arm/s (oral), n randomised | Treatment arm/s (IV), n randomised | IV arm: bolus vs Infusional |
| Neoadjuvant | Rectal | |||||
| III | Fluoropyrimidine combined with RT | Capecitabine (Grp 2), n = 146 Capecitabine (Grp 5), n = 326 Capecitabine + oxaliplatin (Grp 6), n = 330 | 5‐FU (Grp 1), n = 147 5‐FU (Grp 3), n = 330 5‐FU + oxaliplatin (Grp 4), n = 329 | Infusional | ||
| III | Fluoropyrimidine combined with RT | UFT (Tegafur/Uracil) + LV with RT, n = 78 | 5‐FU + LV with RT, n = 77 | Bolus | ||
| Neoadjuvant/ Adjuvant | Rectal | |||||
| III | Fluoropyrimidine combined with RT | Capecitabine with RT, n = 197 ∙ Adjuvant cohort: n = 116 ∙ Neoadjuvant cohort: n = 81 | 5‐FU with RT, n = 195 ∙ Adjuvant cohort: n = 115 ∙ Neoadjuvant cohort: n = 80 | Bolus and infusional | ||
| Adjuvant | Rectal | |||||
| ND | Fluoropyrimidine combined with RT (after completion of 2C of fluoropyrimidine alone) | 5‐dFUR + LV, n = 92 | 5‐FU + LV, n = 74 | Bolus | ||
| Colon | ||||||
| III | Combination chemotherapy ‐ Oxaliplatin + Bevacizumab (BEV) | BEV‐XELOX, n = 952 | BEV‐FOLFOX4, n = 960 | Infusional | ||
| III | Fluoropyrimidine alone | UFT + LV, n = 805 | 5‐FU + LV, n = 803 | Bolus | ||
| III | Fluoropyrimidine alone | UFT + LV, n = 551 | 5‐FU + LV, n = 550 | Bolus | ||
| III | Fluoropyrimidine alone | Capecitabine, n = 1004 | 5‐FU + LV, n = 983 | Bolus | ||
| Colorectal | ||||||
| III | Combination chemotherapy ‐ fluoropyrimidine + oxaliplatin | CAPOX (capecitabine + oxaliplatin), n = 197 | mFOLFOX6, n = 211 | Infusional | ||
| IV: intravenous RT: radiotherapy 5‐FU: 5‐fluorouracil UFT: tegafur/uracil LV: leucovorin ND: no data available 5‐dFUR: doxifluridine BEV: bevacizumab | ||||||
| Oral fluoropyrimidine backbone | Study ID | Phase | Treatment line | Treatment arm/s (Oral), n randomised | Treatment arm/s (IV), n randomised | IV arm: Bolus vs Infusional |
| Capecitabine | III | First | Capecitabine, n = 302 | 5‐FU + LV, n = 303 | Bolus | |
| III | First | Capecitabine, n = 301 | 5‐FU + LV, n = 301 | Bolus | ||
| Doxifluridine (5‐dFUR) | II | First | 5‐dFUR + LV, n = 38 | 5‐FU + LV, n = 39 | Bolus | |
| II | First | 5‐dFUR + LV, n = 67 | 5‐dFUR + LV, n = 63 | Bolus | ||
| Eniluracil + oral 5‐FU | III | First | Eniluracil/Oral 5‐FU, n = 61 | 5‐FU, n = 64 | Infusional | |
| III | First | Eniluracil/Oral 5‐FU, n = 488 | 5‐FU + LV, n = 493 | Bolus | ||
| III | First | Eniluracil/Oral 5‐FU, n = 268 | 5‐FU + LV, n = 263 | Bolus | ||
| Ftorafur/tegafur (FT) | ND | First | Ftorafur, n = 30 | 5‐FU, n = 30 | Bolus | |
| Unclear; described as Phase IV in abstracts | First | FT + LV, n = 114 | 5‐FU + LV, n = 123 | Bolus | ||
| Ftorafur + uracil (UFT) | III | First | UFT + LV, n = 190 | 5FU + LV, n = 190 | Bolus | |
| III | First | UFT + LV, n = 409 | 5‐FU + LV, n = 407 | Bolus | ||
| IV: intravenous 5‐FU: 5‐fluorouracil LV: leucovorin 5‐dFUR: doxifluridine ND: no data available FT: tegafur UFT: tegafur + uracil | ||||||
| Chemotherapy | Study ID | Phase | Study design ‐ other details | Treatment line | Treatment arm/s (Oral), n randomised | Treatment arm/s (IV), n randomised | IV arm: Bolus vs Infusional |
| Oxaliplatin | Combination with capecitabine | ||||||
| III | 2 × 2 factorial ‐ following protocol amendment | First | XELOX alone, n = 317 | FOLFOX‐4 alone, n = 317 | Infusional | ||
| XELOX + Placebo, n = 350 | FOLFOX‐4 + Placebo, n = 351 | Infusional | |||||
| XELOX + BEV, n = 350 | FOLFOX‐4 + BEV, n = 350 | Infusional | |||||
| III | First | OXXEL (Capecitabine + oxaliplatin), n = 158 | OXAFAFU (5‐FU/LV + Oxaliplatin), n = 164 | Bolus | |||
| III | First | XELOX, n = 174 | FUOX (5‐FU + Oxaliplatin), n = 174 | Infusional | |||
| III | First | XELOX, n = 156 | FOLFOX‐6, n = 150 | Infusional | |||
| ND | First | CapeOx, n = 50 | mFOLFOX6, n = 50 | Infusional | |||
| bFOL, n = 50 | Bolus | ||||||
| ND | First | CapeOx + BEV, n = 74 | mFOLFOX6 + BEV, n = 75 | Infusional | |||
| bFOL + BEV, n = 74 | Bolus | ||||||
| II | First | XELOX, n = 62 | pviFOX, n = 56 | Infusional | |||
| III | First | CAPOX, n = 242 | FUFOX, n = 234 | Infusional | |||
| III | Second | XELOX, n = 313 | FOLFOX‐4, n = 314 | Infusional | |||
| ND | 2 × 2 factorial, cross‐over (only from no oxaliplatin to oxaliplatin) | First | Capecitabine or OxCap, n = 229 ∙ Capecitabine, n = 115 ∙ OxCap, n = 114 | 5‐FU or OxFU, n = 230 ∙ 5‐FU, n = 115 ∙ OxFU, n = 115 | Infusional | ||
| Combination with Ftorafur/uracil (UFT) | |||||||
| II | First | UFOX + Cetuximab, n = 152 | FOLFOX4 + Cetuximab, n = 150 | Infusional | |||
| Combination with S‐1 | |||||||
| ND | First | SOX, n = 35 | FOLFOX4, n = 35 | Infusional | |||
| III | First | SOX‐BEV, n = 256 | mFOLFOX6‐BEV, n = 256 | Infusional | |||
| II | First | SOL (S‐1 + oxaliplatin + oral LV), n = 56 | mFOLFOX6, n = 51 | Infusional | |||
| Irinotecan | Combination with capecitabine | ||||||
| II | First | XELIRI + BEV, n = 72 | FOLFIRI + BEV, n = 73 | Infusional | |||
| III | 3 × 2 factorial (Period 1) | First | CapeIRI + Celecoxib/Placebo, n = 145 | FOLFIRI + Celecoxib/Placebo, n = 144 | Infusional | ||
| mIFL + Celecoxib/Placebo, n = 141 | Bolus | ||||||
| III | 2 × 2 factorial | First | CAPIRI + Celecoxib/Placebo, n = 44 | FOLFIRI + Celecoxib/Placebo, n = 41 | Infusional | ||
| III | First | XELIRI + BEV, n = 143 | FOLFIRI + BEV, n = 142 | Infusional | |||
| II | First | XELIRI, n = ND | FOLFIRI, n = ND | Infusional | |||
| II | First | CAPIRI + BEV, n = 168 | FOLFIRI + BEV, n = 168 | Infusional | |||
| ND | First and second | Capecitabine + Irinotecan, n = 27 | 5‐FU + Irinotecan, n = 16 | Infusional | |||
| Combination with Ftorafur/uracil (UFT) | |||||||
| II | First | TEGAFIRI (UFT, leucovorin, irinotecan) ± BEV, n = 35 | FOLFIRI ± BEV, n = 36 | Infusional | |||
| Combination with S‐1 | |||||||
| II | First and second | Sequential IRIS‐BEV, n = 30 | mFOLFIRI‐BEV, n = 30 | Infusional | |||
| II/III | Second | IRIS (Irinotecan + S‐1), n = 213 | FOLFIRI, n = 213 | Infusional | |||
| IV: intravenous BEV: bevacizumab ND: no data available UFT: tegafur/uracil | |||||||
| Setting | Related | Related and unrelated | Not specified |
| Patients treated with curative intent for CRC with neoadjuvant and/or adjuvant chemotherapy | |||
| Patients treated with palliative intent for inoperable advanced or metastatic CRC with chemotherapy
|
| ||
| CRC: colorectal cancer | |||
| Study ID | Outcome | |||||||||||
| Efficacy | Grade ≥ 3 AE | |||||||||||
| DFS | OS | Diarrhoea | HFS | Neutropenia/ granulocytopenia | Febrile neutropenia | Vomiting | Nausea | Stomatitis | Mucositis | Hyperbilirubinemia | Any | |
| X | X | X | X | X | X | X | X | X | X | X | ||
| X | X | X | X | X | X | X | X | |||||
| Oa | Oa | X | Ob | X | X | X | Xc | Xc | ||||
| X | X | X | X | X | X | X | X | X | X | |||
| X | X | |||||||||||
| X | X | X | X | X | X | X | X | |||||
| X | X | X | X | X | X | X | X | X | ||||
| X | X | X | X | X | X | X | X | X | ||||
| X | X | X | Ob | X | Xd | Xd | X | Oe | X | |||
| X: Study contributed to the pooled effect estimate for the outcome O: Study reported the outcome but did not contribute to the pooled effect estimate for the outcome aInsufficient follow‐up time ‐ median 22 months in each arm (< 3 years) bAssessed grade ≥ 3 HFS using criteria not considered to be sufficiently similar to National Cancer Institute Common Terminology Criteria for Adverse Events (NCI CTCAE) (versions 2.0 to 4.0) cReported combined data for grade ≥ 3 stomatitis and mucositis dReported combined data for grade ≥ 3 vomiting and nausea eAssessed grade 3 ≥ hyperbilirubinaemia using criteria not considered to be sufficiently similar to NCI CTCAE (versions 2.0 to 4.0 and 1981) and World Health Organisation (WHO) (1981 version) AE: adverse event DFS: disease‐free survival OS: overall survival HFS: hand foot syndrome | ||||||||||||
| Study ID | Outcome | |||||||||||||
| Efficacy | Grade ≥ 3 AE | |||||||||||||
| PFS | TTP | OS | ORR | Diarrhoea | HFS | Neutropenia/ granulocytopenia | Febrile neutropenia | Vomiting | Nausea | Stomatitis | Mucositis | Hyperbilirubinemia | Any | |
| X | X | X | Oa | Oa | Oa | Oa | ||||||||
| Ob | X | |||||||||||||
| X | X | X | X | X | ||||||||||
| X | X | X | X | X | X | Xc | Xc | Xd | Xd | Oe | ||||
| X | X | X | X | X | X | X | Xc | Xc | X | X | ||||
| X | X | X | X | X | X | X | ||||||||
| X | X | X | X | X | X | X | X | X | X | X | ||||
| X | X | X | X | Of | X | X | Xc | Xc | Xd | Xd | Oe | |||
| X | X | X | X | X | X | X | X | X | X | X | X | X | ||
| X | X | X | X | X | X | X | X | X | X | |||||
| X | X | X | X | X | X | X | X | X | X | X | ||||
| X | X | X | X | X | X | X | X | X | X | X | ||||
| X | X | X | X | X | X | X | X | X | ||||||
| Ob | X | X | X | X | X | Xc | Xc | X | ||||||
| Ob | X | X | X | X | X | Xc | Xc | X | ||||||
| X | X | X | X | Og | X | X | X | X | X | |||||
| X | X | X | X | X | X | X | X | X | ||||||
| X | X | X | X | X | X | X | X | X | ||||||
| X | X | X | X | X | X | X | ||||||||
| Oh | X | X | Xc | Xc | ||||||||||
| X | X | X | X | X | Xc | Xc | X | |||||||
| X | X | X | X | X | X | X | X | X | X | X | ||||
| X | X | X | X | X | X | X | X | |||||||
| X | X | X | X | X | X | X | X | X | X | Oi | X | |||
| X | X | X | X | Og | X | X | X | X | X | |||||
| X | X | Oj | X | X | X | X | X | X | X | |||||
| X | X | X | X | X | X | X | X | Xd | Xd | X | X | |||
| Ob | Oa | Oa | Oa | |||||||||||
| X | X | X | X | X | X | X | X | X | X | |||||
| X | X | X | X | X | X | X | ||||||||
| X | X | X | X | Og | X | X | X | X | ||||||
| X | X | X | X | X | X | X | X | X | Xd | Xd | X | |||
| X | X | X | X | X | X | X | X | X | ||||||
| X | X | X | X | X | X | X | Xd | Xd | ||||||
| Ob | Ob | X | Oa | Oa | Oa | Oa | Oa | |||||||
| X: Study contributed to the pooled effect estimate for the outcome O: Study reported the outcome but did not contribute to the pooled effect estimate for the outcome aUnclear number of participants assessed for outcomes in both arms bHazard ratios could not be estimated either directly or indirectly from the provided information cReported combined data for grade ≥3 vomiting and nausea dReported combined data for grade ≥3 stomatitis and mucositis eAssessed grade ≥ 3 hyperbilirubinaemia using Common Toxicity Criteria (CTC), version not specified fAssessed grade ≥ 3 HFS using CTC, version not specified gAssessed grade ≥ 3 HFS using criteria not considered to be sufficiently similar to National Cancer Institute Common Terminology Criteria for Adverse Events (NCI CTCAE) (versions 2.0 to 4.0) hORR reported after 2 cycles of chemotherapy iAssessed grade ≥3 hyperbilirubinaemia using criteria not considered to be sufficiently similar to NCI CTCAE (versions 2.0 to 4.0 and 1981) and World Health Organisation (WHO) (1981 version) jORR reported 12 to 14 weeks after start of treatment AE: adverse event PFS: progression‐free survival TTP: time to progression OS: overall survival ORR: objective response rate HFS: hand foot syndrome | ||||||||||||||
| Risk of bias assessment | ||
| Low | Unclear | High |
| No studies | No studies | |
| Risk of bias assessment | ||
| Low | Unclear | High |
| Sensitivity analyses for PFS outcome | Original analysis: (effect estimatea, fixed | Sensitivity analysis: (effect estimatea, fixed |
| Excluding studies with 'High' risk of bias | 1.06 (1.02 to 1.11) | 1.01 (95% CI 0.96 to 1.07) |
| Excluding Seymour 2011 study (frail and elderly study population) | 1.06 (1.02 to 1.11) | 1.07 (1.03 to 1.11) |
| Excluding second‐line studies in patients treated with palliative intent for inoperable or metastatic colorectal cancerb | 1.06 (1.02 to 1.11) | 1.07 (1.03 to 1.12) |
| aEffect estimates presented as inverse‐variance hazard ratios for time‐to‐event outcomes, and Mantel‐Haenszel odds ratios for adverse events bAnalysis excluding Kato 2012, Rothenberg 2008, Yasui 2015, and Yu 2005. Kato 2012 and Yu 2005 included patients receiving first‐ or second‐line treatment PFS: progression‐free survival CI: confidence interval | ||
| Outcome or subgroup title | No. of studies | No. of participants | Statistical method | Effect size |
| 1 Disease‐free survival Show forest plot | 7 | 8903 | Hazard Ratio (Fixed, 95% CI) | 0.93 [0.87, 1.00] |
| 2 Disease‐free survival with subgroup analysis ‐ Chemotherapy vs chemo‐radiotherapy Show forest plot | 7 | 8903 | Hazard Ratio (Fixed, 95% CI) | 0.93 [0.87, 1.00] |
| 2.1 Chemotherapy | 5 | 6944 | Hazard Ratio (Fixed, 95% CI) | 0.94 [0.87, 1.02] |
| 2.2 Chemo‐radiotherapy | 2 | 1959 | Hazard Ratio (Fixed, 95% CI) | 0.91 [0.78, 1.05] |
| 3 Disease‐free survival with subgroup analysis ‐ Infusional vs bolus intravenous fluoropyrimidine Show forest plot | 6 | 8511 | Hazard Ratio (Fixed, 95% CI) | 0.95 [0.88, 1.02] |
| 3.1 Infusional intravenous fluoropyrimidine | 3 | 3881 | Hazard Ratio (Fixed, 95% CI) | 0.96 [0.85, 1.08] |
| 3.2 Bolus intravenous fluoropyrimidine | 3 | 4630 | Hazard Ratio (Fixed, 95% CI) | 0.94 [0.86, 1.04] |
| 4 Disease‐free survival with subgroup analysis ‐ Oral fluoropyrimidine backbone Show forest plot | 7 | 8903 | Hazard Ratio (Fixed, 95% CI) | 0.93 [0.87, 1.00] |
| 4.1 Capecitabine | 5 | 6260 | Hazard Ratio (Fixed, 95% CI) | 0.91 [0.83, 0.99] |
| 4.2 UFT/Ftorafur | 2 | 2643 | Hazard Ratio (Fixed, 95% CI) | 1.01 [0.88, 1.15] |
| Outcome or subgroup title | No. of studies | No. of participants | Statistical method | Effect size |
| 1 Overall survival (curative intent studies) Show forest plot | 7 | 8902 | Hazard Ratio (Fixed, 95% CI) | 0.92 [0.84, 1.00] |
| 2 Overall survival (curative intent studies) with subgroup analysis ‐ Chemotherapy vs chemo‐radiotherapy Show forest plot | 7 | 8902 | Hazard Ratio (Fixed, 95% CI) | 0.92 [0.84, 1.00] |
| 2.1 Chemotherapy | 5 | 6943 | Hazard Ratio (Fixed, 95% CI) | 0.93 [0.84, 1.03] |
| 2.2 Chemotherapy with radiotherapy | 2 | 1959 | Hazard Ratio (Fixed, 95% CI) | 0.86 [0.70, 1.06] |
| 3 Overall survival (curative intent studies) with subgroup analysis ‐ Infusional vs bolus intravenous fluoropyrimidine Show forest plot | 6 | 8510 | Hazard Ratio (Fixed, 95% CI) | 0.93 [0.85, 1.02] |
| 3.1 Infusional intravenous fluoropyrimidine | 3 | 3880 | Hazard Ratio (Fixed, 95% CI) | 0.94 [0.80, 1.09] |
| 3.2 Bolus intravenous fluoropyrimidine | 3 | 4630 | Hazard Ratio (Fixed, 95% CI) | 0.93 [0.83, 1.05] |
| 4 Overall survival (curative intent studies) with subgroup analysis ‐ Oral fluoropyrimidine backbone Show forest plot | 7 | 8902 | Hazard Ratio (Fixed, 95% CI) | 0.92 [0.84, 1.00] |
| 4.1 Capecitabine | 5 | 6259 | Hazard Ratio (Fixed, 95% CI) | 0.88 [0.79, 0.98] |
| 4.2 UFT/Ftorafur | 2 | 2643 | Hazard Ratio (Fixed, 95% CI) | 1.03 [0.86, 1.22] |
| Outcome or subgroup title | No. of studies | No. of participants | Statistical method | Effect size |
| 1 Grade ≥ 3 diarrhoea (curative intent studies) Show forest plot | 9 | 9551 | Odds Ratio (M‐H, Fixed, 95% CI) | 1.12 [0.99, 1.25] |
| 2 Grade ≥ 3 diarrhoea (curative intent studies) with subgroup analysis ‐ Chemotherapy vs chemo‐radiotherapy Show forest plot | 9 | 9551 | Odds Ratio (M‐H, Fixed, 95% CI) | 1.12 [0.99, 1.25] |
| 2.1 Chemotherapy | 5 | 7274 | Odds Ratio (M‐H, Fixed, 95% CI) | 1.08 [0.95, 1.23] |
| 2.2 Chemo‐radiotherapy | 4 | 2277 | Odds Ratio (M‐H, Fixed, 95% CI) | 1.28 [0.98, 1.66] |
| 3 Grade ≥ 3 diarrhoea (curative intent studies) with subgroup analysis ‐ Infusional vs bolus intravenous fluoropyrimidine Show forest plot | 8 | 9159 | Odds Ratio (M‐H, Fixed, 95% CI) | 1.09 [0.97, 1.23] |
| 3.1 Infusional intravenous fluoropyrimidine | 3 | 4255 | Odds Ratio (M‐H, Fixed, 95% CI) | 1.27 [1.06, 1.53] |
| 3.2 Bolus intravenous fluoropyrimidine | 5 | 4904 | Odds Ratio (M‐H, Fixed, 95% CI) | 0.98 [0.84, 1.14] |
| 4 Grade ≥ 3 diarrhoea (curative intent studies) with subgroup analysis ‐ Oral fluoropyrimidine backbone Show forest plot | 9 | 9551 | Odds Ratio (M‐H, Fixed, 95% CI) | 1.12 [0.99, 1.25] |
| 4.1 Capecitabine | 5 | 6616 | Odds Ratio (M‐H, Fixed, 95% CI) | 1.15 [0.99, 1.33] |
| 4.2 UFT/Ftorafur | 3 | 2769 | Odds Ratio (M‐H, Fixed, 95% CI) | 1.00 [0.83, 1.21] |
| 4.3 Doxifluridine | 1 | 166 | Odds Ratio (M‐H, Fixed, 95% CI) | 32.14 [1.89, 545.41] |
| 5 Grade ≥ 3 hand foot syndrome (curative intent studies) Show forest plot | 5 | 5731 | Odds Ratio (M‐H, Fixed, 95% CI) | 4.59 [2.97, 7.10] |
| 6 Grade ≥ 3 neutropenia/granulocytopenia (curative intent studies) Show forest plot | 7 | 8707 | Odds Ratio (M‐H, Fixed, 95% CI) | 0.14 [0.11, 0.16] |
| 7 Grade ≥ 3 febrile neutropenia (curative intent studies) Show forest plot | 4 | 2925 | Odds Ratio (M‐H, Fixed, 95% CI) | 0.59 [0.18, 1.90] |
| 8 Grade ≥ 3 vomiting (curative intent studies) Show forest plot | 8 | 9385 | Odds Ratio (M‐H, Fixed, 95% CI) | 1.05 [0.83, 1.34] |
| 9 Grade ≥ 3 nausea (curative intent studies) Show forest plot | 7 | 9233 | Odds Ratio (M‐H, Fixed, 95% CI) | 1.21 [0.97, 1.51] |
| 10 Grade ≥ 3 stomatitis (curative intent studies) Show forest plot | 5 | 4212 | Odds Ratio (M‐H, Fixed, 95% CI) | 0.21 [0.14, 0.30] |
| 11 Grade ≥ 3 mucositis (curative intent studies) Show forest plot | 4 | 2233 | Odds Ratio (M‐H, Fixed, 95% CI) | 0.64 [0.25, 1.62] |
| 12 Grade ≥ 3 hyperbilirubinaemia (curative intent studies) Show forest plot | 3 | 2757 | Odds Ratio (M‐H, Fixed, 95% CI) | 1.67 [0.52, 5.38] |
| 13 Any grade ≥ 3 adverse events (curative intent studies) Show forest plot | 5 | 7741 | Odds Ratio (M‐H, Fixed, 95% CI) | 0.82 [0.74, 0.90] |
| Outcome or subgroup title | No. of studies | No. of participants | Statistical method | Effect size |
| 1 Progression‐free survival Show forest plot | 23 | 9927 | Hazard Ratio (Fixed, 95% CI) | 1.06 [1.02, 1.11] |
| 2 Progression‐free survival with subgroup analysis ‐ Single‐agent vs combination therapy Show forest plot | 22 | 9468 | Hazard Ratio (Fixed, 95% CI) | 1.07 [1.03, 1.11] |
| 2.1 Single agent | 6 | 2955 | Hazard Ratio (Fixed, 95% CI) | 1.12 [1.04, 1.21] |
| 2.2 Combination therapy | 16 | 6513 | Hazard Ratio (Fixed, 95% CI) | 1.05 [1.00, 1.10] |
| 3 Progression‐free survival with subgroup analysis ‐ Infusional vs bolus intravenous fluoropyrimidine Show forest plot | 23 | 9927 | Hazard Ratio (Fixed, 95% CI) | 1.06 [1.02, 1.11] |
| 3.1 Infusional intravenous fluoropyrimidine | 17 | 6560 | Hazard Ratio (Fixed, 95% CI) | 1.05 [1.00, 1.10] |
| 3.2 Bolus intravenous fluoropyrimidine | 7 | 3367 | Hazard Ratio (Fixed, 95% CI) | 1.10 [1.03, 1.19] |
| 4 Progression‐free survival with subgroup analysis ‐ Oral fluoropyrimidine backbone Show forest plot | 23 | 9927 | Hazard Ratio (Fixed, 95% CI) | 1.06 [1.02, 1.11] |
| 4.1 Capecitabine | 13 | 6703 | Hazard Ratio (Fixed, 95% CI) | 1.03 [0.98, 1.08] |
| 4.2 UFT/Ftorafur | 2 | 374 | Hazard Ratio (Fixed, 95% CI) | 1.36 [1.07, 1.73] |
| 4.3 Eniluracil + oral 5‐FU | 3 | 1618 | Hazard Ratio (Fixed, 95% CI) | 1.22 [1.10, 1.36] |
| 4.4 Doxifluridine | 1 | 130 | Hazard Ratio (Fixed, 95% CI) | 1.18 [0.79, 1.74] |
| 4.5 S‐1 | 4 | 1102 | Hazard Ratio (Fixed, 95% CI) | 1.02 [0.89, 1.16] |
| 5 Progression‐free survival for combination therapy with subgroup analysis ‐ Oxaliplatin‐based vs irinotecan‐based Show forest plot | 16 | 6513 | Hazard Ratio (Fixed, 95% CI) | 1.05 [1.00, 1.10] |
| 5.1 Oxaliplatin‐based | 8 | 4677 | Hazard Ratio (Fixed, 95% CI) | 1.06 [0.99, 1.13] |
| 5.2 Irinotecan‐based | 8 | 1836 | Hazard Ratio (Fixed, 95% CI) | 1.04 [0.97, 1.11] |
| 6 Progression‐free survival for combination therapy with subgroup analysis ‐ with Bev vs no Bev Show forest plot | 14 | 6139 | Hazard Ratio (Fixed, 95% CI) | 1.03 [0.98, 1.08] |
| 6.1 With Bevacizumab | 6 | 2033 | Hazard Ratio (Fixed, 95% CI) | 1.00 [0.94, 1.07] |
| 6.2 No Bevacizumab | 9 | 4106 | Hazard Ratio (Fixed, 95% CI) | 1.06 [0.99, 1.13] |
| Outcome or subgroup title | No. of studies | No. of participants | Statistical method | Effect size |
| 1 Overall survival (palliative intent studies) Show forest plot | 29 | 12079 | Hazard Ratio (Fixed, 95% CI) | 1.02 [0.99, 1.05] |
| 2 Overall survival (palliative intent studies) with subgroup analysis ‐ Single‐agent vs combination therapy Show forest plot | 28 | 11620 | Hazard Ratio (Fixed, 95% CI) | 1.02 [0.99, 1.05] |
| 2.1 Single agent | 10 | 4465 | Hazard Ratio (Fixed, 95% CI) | 1.02 [0.99, 1.07] |
| 2.2 Combination therapy | 18 | 7155 | Hazard Ratio (Fixed, 95% CI) | 1.00 [0.95, 1.06] |
| 3 Overall survival (palliative intent studies) with subgroup analysis ‐ Infusional vs bolus intravenous fluoropyrimidine Show forest plot | 29 | 12079 | Hazard Ratio (Fixed, 95% CI) | 1.02 [0.99, 1.05] |
| 3.1 Infusional intravenous fluoropyrimidine | 19 | 7022 | Hazard Ratio (Fixed, 95% CI) | 1.01 [0.96, 1.06] |
| 3.2 Bolus intravenous fluoropyrimidine | 13 | 5057 | Hazard Ratio (Fixed, 95% CI) | 1.02 [0.98, 1.06] |
| 4 Overall survival (palliative intent studies) with subgroup analysis ‐ Oral fluoropyrimidine backbone Show forest plot | 29 | 12079 | Hazard Ratio (Fixed, 95% CI) | 1.02 [0.99, 1.05] |
| 4.1 Capecitabine | 16 | 7405 | Hazard Ratio (Fixed, 95% CI) | 0.99 [0.95, 1.04] |
| 4.2 UFT/Ftorafur | 5 | 1807 | Hazard Ratio (Fixed, 95% CI) | 1.02 [0.97, 1.06] |
| 4.3 Eniluracil + oral 5‐FU | 3 | 1618 | Hazard Ratio (Fixed, 95% CI) | 1.20 [1.07, 1.36] |
| 4.4 Doxifluridine | 2 | 207 | Hazard Ratio (Fixed, 95% CI) | 0.99 [0.65, 1.50] |
| 4.5 S‐1 | 3 | 1042 | Hazard Ratio (Fixed, 95% CI) | 0.95 [0.81, 1.11] |
| 5 Overall survival (palliative intent studies) for combination therapy with subgroup analysis ‐ Oxaliplatin‐based vs irinotecan‐based Show forest plot | 18 | 7155 | Hazard Ratio (Fixed, 95% CI) | 1.00 [0.95, 1.06] |
| 5.1 Oxaliplatin‐based | 11 | 5379 | Hazard Ratio (Fixed, 95% CI) | 1.00 [0.94, 1.07] |
| 5.2 Irinotecan‐based | 7 | 1776 | Hazard Ratio (Fixed, 95% CI) | 1.01 [0.92, 1.10] |
| Outcome or subgroup title | No. of studies | No. of participants | Statistical method | Effect size |
| 1 Time to progression Show forest plot | 6 | 1970 | Hazard Ratio (Fixed, 95% CI) | 1.07 [1.01, 1.14] |
| Outcome or subgroup title | No. of studies | No. of participants | Statistical method | Effect size |
| 1 ORR Show forest plot | 32 | 11115 | Odds Ratio (M‐H, Fixed, 95% CI) | 0.98 [0.90, 1.06] |
| Outcome or subgroup title | No. of studies | No. of participants | Statistical method | Effect size |
| 1 Grade ≥ 3 diarrhoea (palliative intent studies) Show forest plot | 30 | 11997 | Odds Ratio (M‐H, Fixed, 95% CI) | 1.66 [1.50, 1.84] |
| 2 Grade ≥ 3 diarrhoea (palliative intent studies) with subgroup analysis ‐ Single‐agent vs combination therapy Show forest plot | 30 | 11997 | Odds Ratio (M‐H, Fixed, 95% CI) | 1.66 [1.50, 1.84] |
| 2.1 Single agent | 10 | 4566 | Odds Ratio (M‐H, Fixed, 95% CI) | 1.22 [1.04, 1.44] |
| 2.2 Combination therapy | 21 | 7431 | Odds Ratio (M‐H, Fixed, 95% CI) | 2.03 [1.77, 2.32] |
| 3 Grade ≥ 3 diarrhea (palliative intent studies) with subgroup analysis ‐ Infusional vs bolus intravenous fluoropyrimidine Show forest plot | 30 | 11997 | Odds Ratio (M‐H, Fixed, 95% CI) | 1.66 [1.50, 1.84] |
| 3.1 Infusional intravenous fluoropyrimidine | 21 | 7065 | Odds Ratio (M‐H, Fixed, 95% CI) | 2.00 [1.74, 2.30] |
| 3.2 Bolus intravenous fluoropyrimidine | 12 | 4932 | Odds Ratio (M‐H, Fixed, 95% CI) | 1.31 [1.12, 1.53] |
| 4 Grade ≥ 3 diarrhoea (palliative intent studies) with subgroup analysis ‐ Oral fluoropyrimidine backbone Show forest plot | 30 | 11997 | Odds Ratio (M‐H, Fixed, 95% CI) | 1.66 [1.50, 1.84] |
| 4.1 Capecitabine | 17 | 7382 | Odds Ratio (M‐H, Fixed, 95% CI) | 1.76 [1.54, 2.00] |
| 4.2 UFT/Ftorafur | 5 | 1784 | Odds Ratio (M‐H, Fixed, 95% CI) | 1.60 [1.24, 2.06] |
| 4.3 Eniluracil + oral 5‐FU | 3 | 1617 | Odds Ratio (M‐H, Fixed, 95% CI) | 1.04 [0.79, 1.38] |
| 4.4 Doxifluridine | 1 | 127 | Odds Ratio (M‐H, Fixed, 95% CI) | 1.51 [0.64, 3.56] |
| 4.5 S‐1 | 4 | 1087 | Odds Ratio (M‐H, Fixed, 95% CI) | 3.55 [2.19, 5.76] |
| 5 Grade ≥ 3 diarrhoea (palliative intent studies) with subgroup analysis for combination therapy ‐ Oxaliplatin‐based vs irinotecan‐based Show forest plot | 20 | 7212 | Odds Ratio (M‐H, Fixed, 95% CI) | 2.00 [1.75, 2.29] |
| 5.1 Oxaliplatin‐based | 12 | 5420 | Odds Ratio (M‐H, Fixed, 95% CI) | 1.73 [1.48, 2.02] |
| 5.2 Irinotecan‐based | 8 | 1792 | Odds Ratio (M‐H, Fixed, 95% CI) | 3.05 [2.33, 3.99] |
| 6 Grade ≥ 3 hand foot syndrome (palliative intent studies) Show forest plot | 18 | 6481 | Odds Ratio (M‐H, Fixed, 95% CI) | 3.92 [2.84, 5.43] |
| 7 Grade ≥ 3 hand foot syndrome (palliative intent studies) with subgroup analysis ‐ Single‐agent vs combination therapy Show forest plot | 18 | 6481 | Odds Ratio (M‐H, Fixed, 95% CI) | 3.89 [2.82, 5.37] |
| 7.1 Single agent | 2 | 343 | Odds Ratio (M‐H, Fixed, 95% CI) | 1.11 [0.48, 2.56] |
| 7.2 Combination therapy | 17 | 6138 | Odds Ratio (M‐H, Fixed, 95% CI) | 4.76 [3.32, 6.82] |
| 8 Grade ≥ 3 hand foot syndrome (palliative intent studies) with subgroup analysis ‐ Infusional vs bolus intravenous fluoropyrimidine Show forest plot | 18 | 6481 | Odds Ratio (M‐H, Fixed, 95% CI) | 3.92 [2.84, 5.43] |
| 8.1 Infusional intravenous fluoropyrimidine | 18 | 6094 | Odds Ratio (M‐H, Fixed, 95% CI) | 3.53 [2.53, 4.94] |
| 8.2 Bolus intravenous fluoropyrimidine | 3 | 387 | Odds Ratio (M‐H, Fixed, 95% CI) | 18.68 [4.15, 84.10] |
| 9 Grade ≥ 3 hand foot syndrome (palliative intent studies) with subgroup analysis ‐ Oral fluoropyrimidine backbone Show forest plot | 18 | 6481 | Odds Ratio (M‐H, Fixed, 95% CI) | 3.92 [2.84, 5.43] |
| 9.1 Capecitabine | 13 | 5418 | Odds Ratio (M‐H, Fixed, 95% CI) | 5.86 [4.01, 8.58] |
| 9.2 UFT/Ftorafur | 2 | 372 | Odds Ratio (M‐H, Fixed, 95% CI) | 0.49 [0.04, 5.50] |
| 9.3 Eniluracil + oral 5‐FU | 1 | 122 | Odds Ratio (M‐H, Fixed, 95% CI) | 0.04 [0.00, 0.75] |
| 9.4 S‐1 | 2 | 569 | Odds Ratio (M‐H, Fixed, 95% CI) | 0.66 [0.11, 4.00] |
| 10 Grade ≥ 3 hand foot syndrome (palliative intent studies) with subgroup analysis for combination therapy ‐ Oxaliplatin‐based vs irinotecan‐based Show forest plot | 16 | 5919 | Odds Ratio (M‐H, Fixed, 95% CI) | 4.76 [3.31, 6.83] |
| 10.1 Oxaliplatin‐based | 10 | 4608 | Odds Ratio (M‐H, Fixed, 95% CI) | 4.52 [3.03, 6.75] |
| 10.2 Irinotecan‐based | 6 | 1311 | Odds Ratio (M‐H, Fixed, 95% CI) | 5.93 [2.52, 13.97] |
| 11 Grade ≥ 3 neutropenia/granulocytopenia (palliative intent studies) Show forest plot | 29 | 11794 | Odds Ratio (M‐H, Fixed, 95% CI) | 0.17 [0.15, 0.18] |
| 12 Grade ≥ 3 febrile neutropenia (palliative intent studies) Show forest plot | 19 | 9407 | Odds Ratio (M‐H, Fixed, 95% CI) | 0.27 [0.21, 0.36] |
| 13 Grade ≥ 3 vomiting (palliative intent studies) Show forest plot | 23 | 9528 | Odds Ratio (M‐H, Fixed, 95% CI) | 1.18 [1.00, 1.40] |
| 14 Grade ≥ 3 nausea (palliative intent studies) Show forest plot | 25 | 9796 | Odds Ratio (M‐H, Fixed, 95% CI) | 1.16 [0.99, 1.36] |
| 15 Grade ≥ 3 stomatitis (palliative intent studies) Show forest plot | 21 | 8718 | Odds Ratio (M‐H, Fixed, 95% CI) | 0.26 [0.20, 0.33] |
| 16 Grade ≥ 3 mucositis (palliative intent studies) Show forest plot | 12 | 4962 | Odds Ratio (M‐H, Fixed, 95% CI) | 0.17 [0.12, 0.24] |
| 17 Grade ≥ 3 hyperbilirubinaemia (palliative intent studies) Show forest plot | 9 | 2699 | Odds Ratio (M‐H, Fixed, 95% CI) | 1.62 [0.99, 2.64] |
| 18 Any grade ≥ 3 adverse events (palliative intent studies) Show forest plot | 14 | 5436 | Odds Ratio (M‐H, Fixed, 95% CI) | 0.83 [0.74, 0.94] |