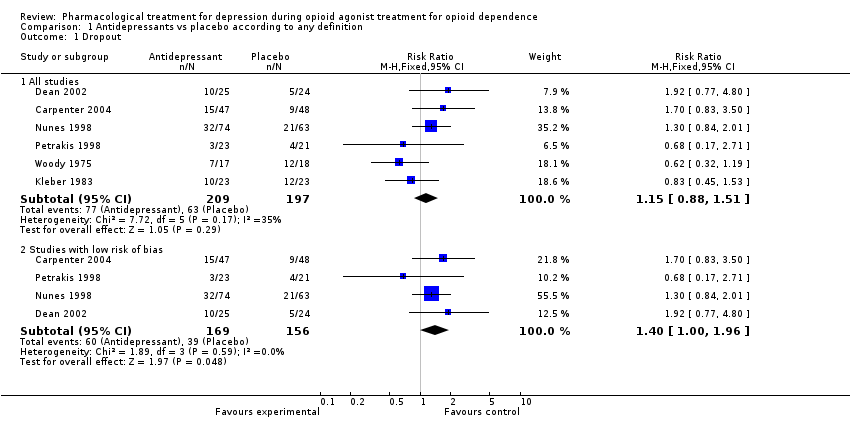
| 1 Drupout Show forest plot | 6 | | Risk Ratio (M‐H, Fixed, 95% CI) | Subtotals only |
|
| 1.1 Tricyclics versus placebo | 3 | 218 | Risk Ratio (M‐H, Fixed, 95% CI) | 1.01 [0.74, 1.37] |
| 1.2 SSRI versus placebo | 3 | 188 | Risk Ratio (M‐H, Fixed, 95% CI) | 1.53 [0.91, 2.56] |
| 2 Severity of depression dichotomous measures Show forest plot | 3 | | Risk Ratio (M‐H, Fixed, 95% CI) | Subtotals only |
|
| 2.1 Tricyclics versus placebo: "very much" or "much" improvement on the Clinical Global Impression scale | 2 | 183 | Risk Ratio (M‐H, Fixed, 95% CI) | 1.92 [1.26, 2.94] |
| 2.2 SSRI versus placebo:>50% reduction in depressive severity from baseline (HDRS score) | 1 | 95 | Risk Ratio (M‐H, Fixed, 95% CI) | 0.96 [0.54, 1.71] |
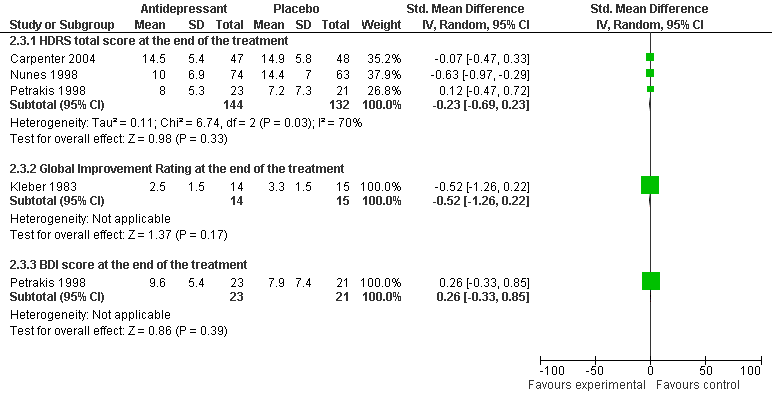
| 3 Severity of depression continuous measures Show forest plot | 7 | | Std. Mean Difference (IV, Random, 95% CI) | Subtotals only |
|
| 3.1 HDRS total score at the end of the treatment: Tricyclics versus placebo | 3 | 207 | Std. Mean Difference (IV, Random, 95% CI) | ‐0.57 [‐0.85, ‐0.29] |
| 3.2 HDRS total score at the end of the treatment: SSRI versus placebo | 2 | 139 | Std. Mean Difference (IV, Random, 95% CI) | ‐0.01 [‐0.34, 0.32] |
| 3.3 MADRS score at the end of the treatment: SSRI versus placebo | 1 | 49 | Std. Mean Difference (IV, Random, 95% CI) | 0.18 [‐0.39, 0.74] |
| 3.4 POMS score at the end of the treatment: Tricyclics versus placebo | 1 | 44 | Std. Mean Difference (IV, Random, 95% CI) | ‐0.50 [‐1.12, 0.11] |
| 3.5 AUSSI at the end of the treatment: SSRI versus placebo | 1 | 49 | Std. Mean Difference (IV, Random, 95% CI) | 0.32 [‐0.24, 0.89] |
| 3.6 Global Improvement Rating at the end of the treatment: Tricyclic versus placebo | 1 | 29 | Std. Mean Difference (IV, Random, 95% CI) | ‐0.52 [‐1.26, 0.22] |
| 3.7 BDI score at the end of the treatment: Tricyclics versus placebo | 1 | 24 | Std. Mean Difference (IV, Random, 95% CI) | ‐1.50 [‐2.43, ‐0.57] |
| 3.8 BDI score at the end of the treatment: SSRI versus placebo | 1 | 44 | Std. Mean Difference (IV, Random, 95% CI) | 0.26 [‐0.33, 0.85] |
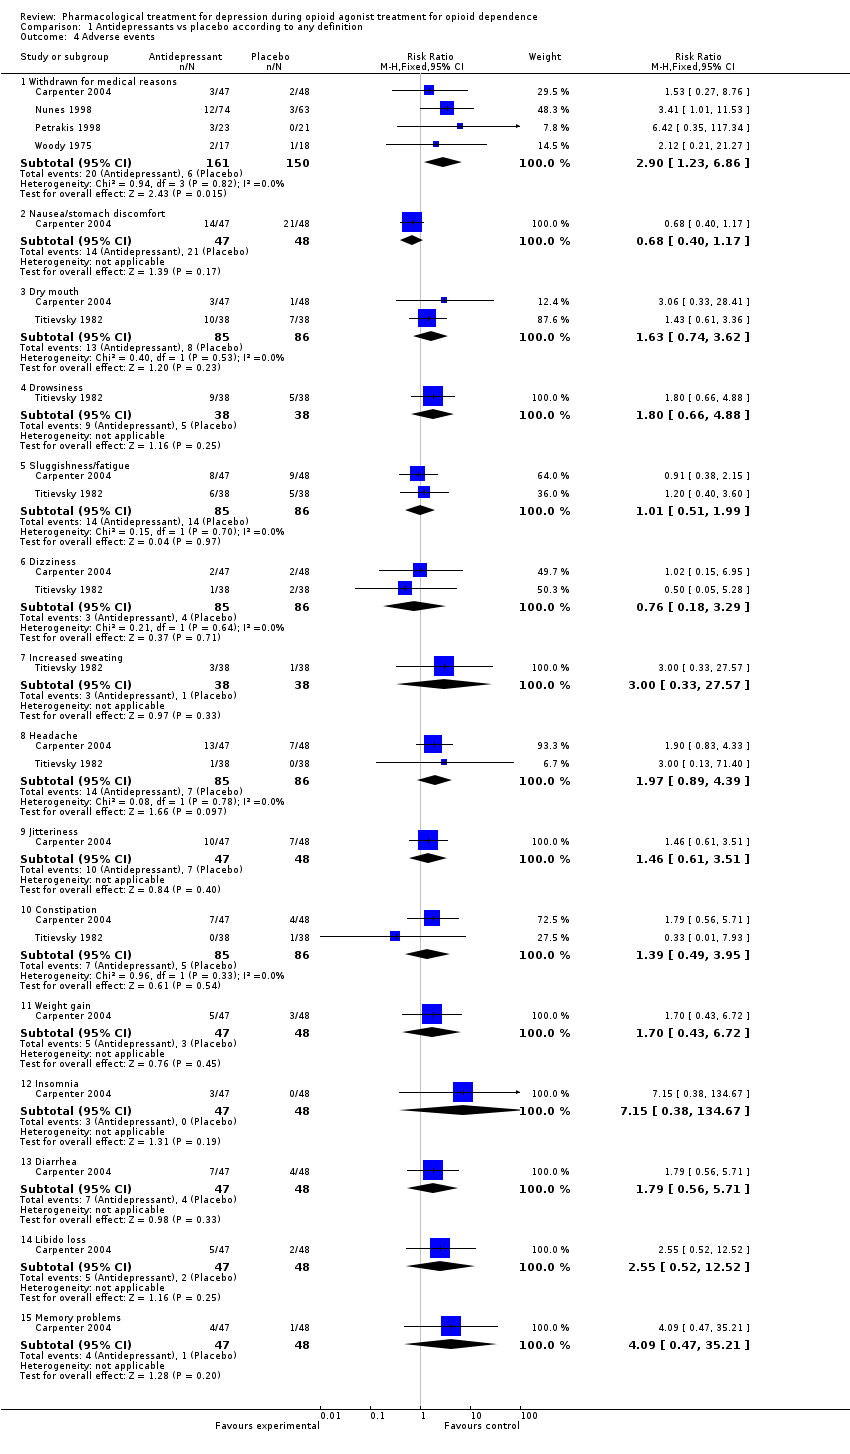
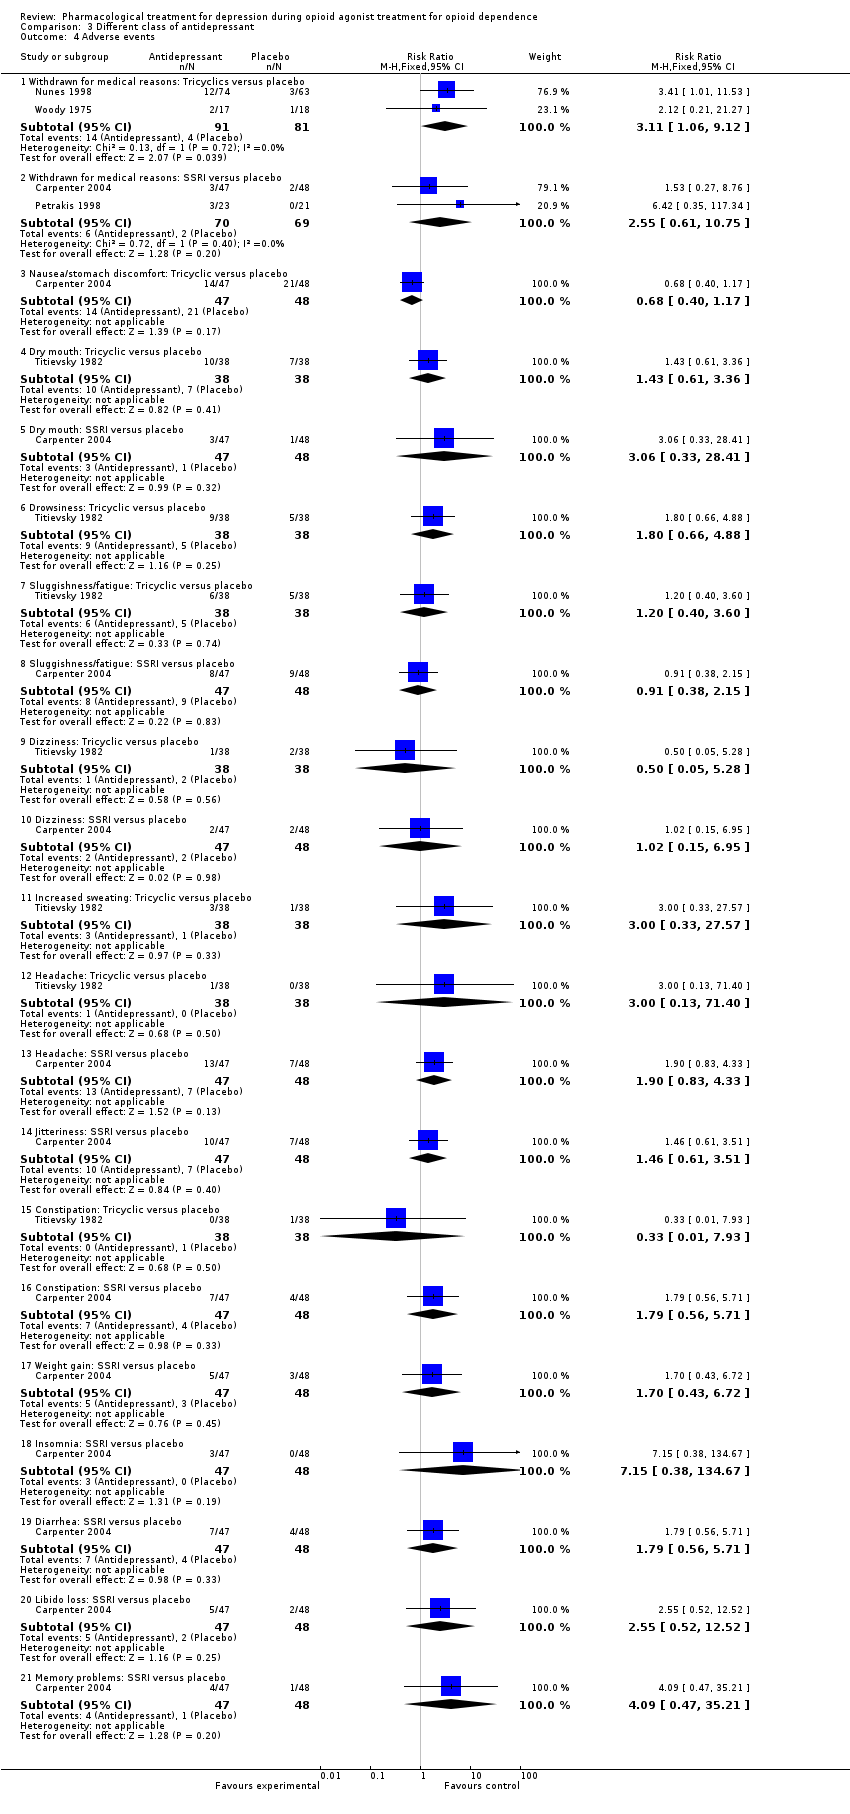
| 4 Adverse events Show forest plot | 5 | | Risk Ratio (M‐H, Fixed, 95% CI) | Subtotals only |
|
| 4.1 Withdrawn for medical reasons: Tricyclics versus placebo | 2 | 172 | Risk Ratio (M‐H, Fixed, 95% CI) | 3.11 [1.06, 9.12] |
| 4.2 Withdrawn for medical reasons: SSRI versus placebo | 2 | 139 | Risk Ratio (M‐H, Fixed, 95% CI) | 2.55 [0.61, 10.75] |
| 4.3 Nausea/stomach discomfort: Tricyclic versus placebo | 1 | 95 | Risk Ratio (M‐H, Fixed, 95% CI) | 0.68 [0.40, 1.17] |
| 4.4 Dry mouth: Tricyclic versus placebo | 1 | 76 | Risk Ratio (M‐H, Fixed, 95% CI) | 1.43 [0.61, 3.36] |
| 4.5 Dry mouth: SSRI versus placebo | 1 | 95 | Risk Ratio (M‐H, Fixed, 95% CI) | 3.06 [0.33, 28.41] |
| 4.6 Drowsiness: Tricyclic versus placebo | 1 | 76 | Risk Ratio (M‐H, Fixed, 95% CI) | 1.8 [0.66, 4.88] |
| 4.7 Sluggishness/fatigue: Tricyclic versus placebo | 1 | 76 | Risk Ratio (M‐H, Fixed, 95% CI) | 1.2 [0.40, 3.60] |
| 4.8 Sluggishness/fatigue: SSRI versus placebo | 1 | 95 | Risk Ratio (M‐H, Fixed, 95% CI) | 0.91 [0.38, 2.15] |
| 4.9 Dizziness: Tricyclic versus placebo | 1 | 76 | Risk Ratio (M‐H, Fixed, 95% CI) | 0.5 [0.05, 5.28] |
| 4.10 Dizziness: SSRI versus placebo | 1 | 95 | Risk Ratio (M‐H, Fixed, 95% CI) | 1.02 [0.15, 6.95] |
| 4.11 Increased sweating: Tricyclic versus placebo | 1 | 76 | Risk Ratio (M‐H, Fixed, 95% CI) | 3.0 [0.33, 27.57] |
| 4.12 Headache: Tricyclic versus placebo | 1 | 76 | Risk Ratio (M‐H, Fixed, 95% CI) | 3.0 [0.13, 71.40] |
| 4.13 Headache: SSRI versus placebo | 1 | 95 | Risk Ratio (M‐H, Fixed, 95% CI) | 1.90 [0.83, 4.33] |
| 4.14 Jitteriness: SSRI versus placebo | 1 | 95 | Risk Ratio (M‐H, Fixed, 95% CI) | 1.46 [0.61, 3.51] |
| 4.15 Constipation: Tricyclic versus placebo | 1 | 76 | Risk Ratio (M‐H, Fixed, 95% CI) | 0.33 [0.01, 7.93] |
| 4.16 Constipation: SSRI versus placebo | 1 | 95 | Risk Ratio (M‐H, Fixed, 95% CI) | 1.79 [0.56, 5.71] |
| 4.17 Weight gain: SSRI versus placebo | 1 | 95 | Risk Ratio (M‐H, Fixed, 95% CI) | 1.70 [0.43, 6.72] |
| 4.18 Insomnia: SSRI versus placebo | 1 | 95 | Risk Ratio (M‐H, Fixed, 95% CI) | 7.15 [0.38, 134.67] |
| 4.19 Diarrhea: SSRI versus placebo | 1 | 95 | Risk Ratio (M‐H, Fixed, 95% CI) | 1.79 [0.56, 5.71] |
| 4.20 Libido loss: SSRI versus placebo | 1 | 95 | Risk Ratio (M‐H, Fixed, 95% CI) | 2.55 [0.52, 12.52] |
| 4.21 Memory problems: SSRI versus placebo | 1 | 95 | Risk Ratio (M‐H, Fixed, 95% CI) | 4.09 [0.47, 35.21] |
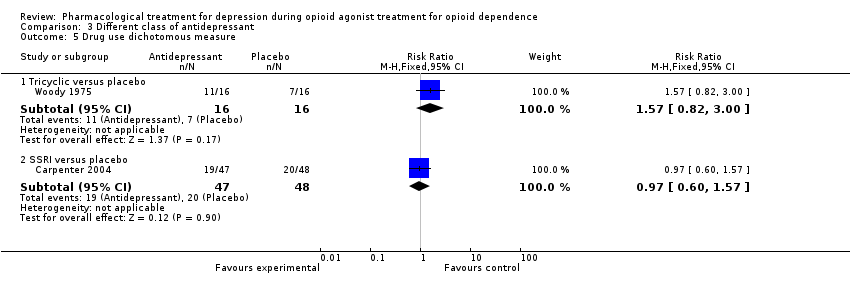
| 5 Drug use dichotomous measure Show forest plot | 2 | | Risk Ratio (M‐H, Fixed, 95% CI) | Subtotals only |
|
| 5.1 Tricyclic versus placebo | 1 | 32 | Risk Ratio (M‐H, Fixed, 95% CI) | 1.57 [0.82, 3.00] |
| 5.2 SSRI versus placebo | 1 | 95 | Risk Ratio (M‐H, Fixed, 95% CI) | 0.97 [0.60, 1.57] |
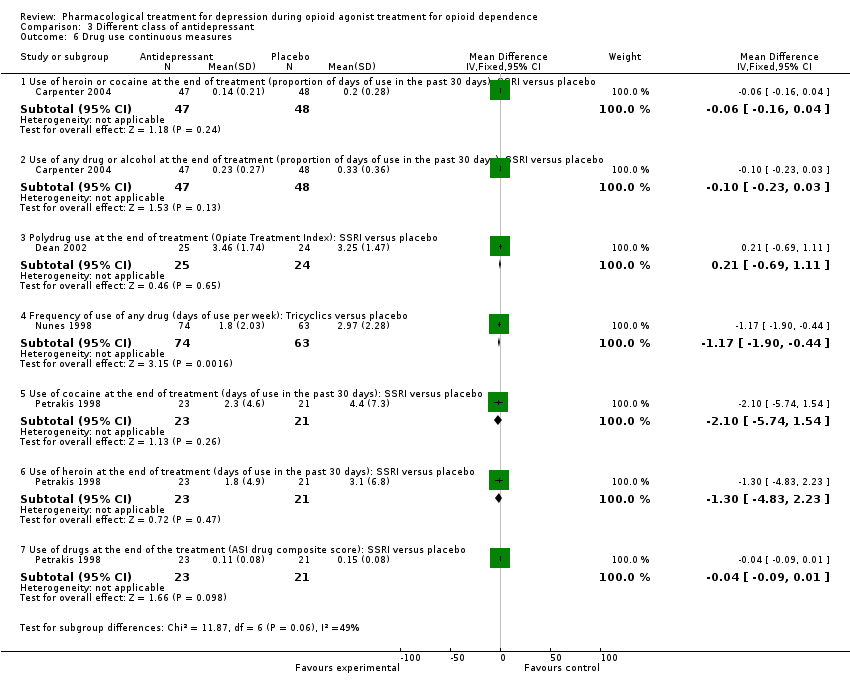
| 6 Drug use continuous measures Show forest plot | 4 | | Mean Difference (IV, Fixed, 95% CI) | Subtotals only |
|
| 6.1 Use of heroin or cocaine at the end of treatment (proportion of days of use in the past 30 days): SSRI versus placebo | 1 | 95 | Mean Difference (IV, Fixed, 95% CI) | ‐0.06 [‐0.16, 0.04] |
| 6.2 Use of any drug or alcohol at the end of treatment (proportion of days of use in the past 30 days): SSRI versus placebo | 1 | 95 | Mean Difference (IV, Fixed, 95% CI) | ‐0.1 [‐0.23, 0.03] |
| 6.3 Polydrug use at the end of treatment (Opiate Treatment Index): SSRI versus placebo | 1 | 49 | Mean Difference (IV, Fixed, 95% CI) | 0.21 [‐0.69, 1.11] |
| 6.4 Frequency of use of any drug (days of use per week): Tricyclics versus placebo | 1 | 137 | Mean Difference (IV, Fixed, 95% CI) | ‐1.17 [‐1.90, ‐0.44] |
| 6.5 Use of cocaine at the end of treatment (days of use in the past 30 days): SSRI versus placebo | 1 | 44 | Mean Difference (IV, Fixed, 95% CI) | ‐2.10 [‐5.74, 1.54] |
| 6.6 Use of heroin at the end of treatment (days of use in the past 30 days): SSRI versus placebo | 1 | 44 | Mean Difference (IV, Fixed, 95% CI) | ‐1.3 [‐4.83, 2.23] |
| 6.7 Use of drugs at the end of the treatment (ASI drug composite score): SSRI versus placebo | 1 | 44 | Mean Difference (IV, Fixed, 95% CI) | ‐0.04 [‐0.09, 0.01] |
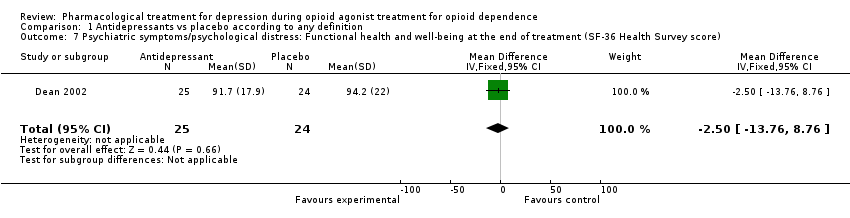
| 7 Psychiatric symptoms/psychological distress: Functional health and well‐being at the end of treatment (SF‐36 Health Survey score): SSRI versus placebo Show forest plot | 1 | | Mean Difference (IV, Fixed, 95% CI) | Subtotals only |
|