Profilaktyczna podaż witaminy K w zapobieganiu krwawieniom z niedoboru witaminy K u wcześniaków
Referencias
References to studies included in this review
References to studies excluded from this review
Additional references
References to other published versions of this review
Characteristics of studies
Characteristics of included studies [ordered by study ID]
Ir a:
| Methods | Randomized controlled trial (RCT) Computer generated allocation sequence using variable block sizes of 6 and 12 Blinding of treatment assignment: treatment allocation was sealed in sequentially numbered opaque envelopes that were opened at the central coordinating unit Stratified by gestational period (< 28 weeks; 28 to 31 + 6 weeks) Blinding of treatment: unclear Blinding of outcome measurement: unclear Completeness of follow‐up: 82% of enrolled infants were analyzed | |
| Participants | Eligible infants were < 32 weeks' gestational age. Exclusion criteria included fetal intracranial hemorrhage, maternal antiplatelet antibody, maternal drug treatment with known vitamin K antagonists, major congenital anomalies, and marked bruising at birth. During the study period the study authors identified 152 eligible infants, of whom 98 were randomized. | |
| Interventions | Eligible infants were randomly assigned to receive 1 of 3 regimens of vitamin K prophylaxis (0.5 mg IM, 0.2 mg IM, 0.2 mg IV). For the purpose of this comparison, we compared both groups that received IM vitamin K to the single group that received IV vitamin K (the 0.2 mg IM (N = 32) dose to the 0.2 mg IV dose (N = 29) as well as the 0.5 mg IM dose (N = 29) to the 0.2 mg IV dose (N = 29)). The vitamin K preparation used was Konakion Neonatal (Roche Ltd, Basel, Switzerland) which has phytomenadione (2 mg/mL) solubilized in Cremophor EL. The allocated vitamin K regimen was prescribed by the attending physician and given either by medical or nursing staff as soon as possible after admission. One rescue dose of vitamin K 0.2 mg IM was given to any infant who, at any time, had an abnormal coagulation test (prolonged prothrombin time beyond the 95 percentile preterm reference for age) or clinical signs of bleeding. | |
| Outcomes | Outcomes measured included serum vitamin K1 levels, vitamin Vitamin K1 2,3‐epoxide (K10) and PIVKA II. vitamin K1 and K1O were measured using high performance liquid chromatography on day 5 and day 25 of life. vitamin K1 levels in the enrolled infants were compared to levels in adults (0.17 to 0.68 ng/mL, if fasting, 0.15 to 1.55 ng/mL in non‐fasting). There are no adult reference values for K1O because it is not a normal metabolite of healthy adults. PIVKA II levels were evaluated on cord blood samples and serum samples on day 5 and day 25 of life. PIVKA II was measured using enzyme‐linked immunosorbent assay using a conformation specific monoclonal antibody that selectively binds under‐carboxylated species of prothrombin. PIVKA II levels < 1 arbitrary units/mL were considered clinically insignificant. Secondary outcome measures were PT and factor II (FII) concentrations measured on citrated plasma on day 5 and at full feeds. PT was measured using a semi‐automated coagulation analyzer. At day 5 there were 90 valid samples and at day 25 there were 80 valid samples for all 3 treatment groups. | |
| Notes | ||
| Risk of bias | ||
| Bias | Authors' judgement | Support for judgement |
| Random sequence generation (selection bias) | Low risk | RCT. Computer generated allocation sequence using variable block sizes of 6 and 12 |
| Allocation concealment (selection bias) | Unclear risk | Blinding of treatment assignment: treatment allocation was sealed in sequentially numbered opaque envelopes that were opened at the central coordinating unit. Stratified by gestational period (< 28 weeks; 28 to 31 + 6 weeks) |
| Blinding of participants and personnel (performance bias) | Unclear risk | Blinding of treatment: unclear |
| Blinding of outcome assessment (detection bias) | Unclear risk | Blinding of outcome measurement: unclear |
| Incomplete outcome data (attrition bias) | Low risk | Completeness of follow‐up: 82% of enrolled infants were analyzed |
| Selective reporting (reporting bias) | Low risk | No study protocol available, but all clinically relevant outcomes are reported and it is unlikely that any selective reporting bias occurred. |
| Other bias | Low risk | There are no concerns regarding other potential sources of bias. |
Abbreviations: IM: intramuscular; IV: intravenous; PIVKA: plasma protein‐induced in vitamin K absence; RCT: randomized controlled trial.
Characteristics of excluded studies [ordered by study ID]
Ir a:
| Study | Reason for exclusion |
| Costakos 2003 studied infants 22 to 32 weeks' gestational age born to mothers who wished to breast feed. Group 1 received 1 mg of vitamin K and Group 2 received 0.5 mg of vitamin K. During the time period of the study 81 infants of 22 to 32 weeks' gestation were admitted to the NICU. Treatment assignment was based on physician choice (non‐random assignment). The more immature and lowest birth weight infants tended to get the lower dose of vitamin K. | |
| Kumar 2001 assessed vitamin K status in preterm infants (≤ 36 weeks' gestation) by measuring plasma vitamin K and plasma protein‐induced in vitamin K absence (PIVKA II) from birth until 40 weeks' postconceptional age. Preterm infants were divided at birth into groups by gestational age (group 1, ≤ 28 weeks; group 2, 29 to 32 weeks; group 3, 33 to 36 weeks). Supplemental vitamin K (1 mg IM) was administered at birth followed by 60 µg/day (weight < 1000 g) or 130 µg/day (weight ≥ 1000 g) via total parenteral nutrition. After hyperalimentation, most received vitamin K‐fortified enteral feedings with the remainder receiving unfortified breast milk. Blood was obtained for PIVKA II in cord blood and for PIVKA II and vitamin K at 2 weeks and 6 weeks after birth and at 40 weeks postconception. | |
| Ogata 1988 measured Factor II coagulant antigen (FII‐AG), the protein induced by vitamin K absence or antagonist II (PIVKA‐II), and coagulant activity (Normotest) in low birth weight infants. Infants whose Normotest levels were less than 30% at 1 day (group A) received vitamin K2, and the others whose Normotest levels were greater than 30% at 1 day (group B) were not treated. | |
| Rossi 1996 studied infants that were 27 to 42 weeks' gestation at birth. The population included preterm infants and high risk term infants (unclear what deemed the term infants high risk). Non‐randomized report of biochemical markers after recommended dosing changes in preterm infants. | |
| Seydewitz 1984 studied infants that were preterm or small‐for‐date, or both. Data on only the preterm infants included in the study were unavailable. Infants were randomized into 2 groups: 1 group received 1 mg IM vitamin K after a first plasma sample was obtained; the second group received 1 mg IM vitamin K after a second plasma sample was obtained (time between the first sampling and second sampling was 4 hours in 1 series and 24 hours in another series). | |
| Vakrilova 1995 conducted a prospective study of newborn infants with birth weight below 2500 g comparing the effect of IM vitamin K to oral vitamin K for preventing hemorrhagic disease of the newborn. Additional comparison group included healthy term infants who had not received vitamin K. Treatment assignment unclear. |
Abbreviations: IM: intramuscular; PIVKA: plasma protein‐induced in vitamin K absence.
Data and analyses
| Outcome or subgroup title | No. of studies | No. of participants | Statistical method | Effect size |
| 1 Bleeding complications Show forest plot | 1 | Risk Ratio (M‐H, Fixed, 95% CI) | Subtotals only | |
| Analysis 1.1  Comparison 1 Intravenous versus intramuscular vitamin K, Outcome 1 Bleeding complications. | ||||
| 1.1 0.2 mg IV versus 0.2 mg IM | 1 | 52 | Risk Ratio (M‐H, Fixed, 95% CI) | 7.0 [0.38, 129.11] |
| 1.2 0.2 mg IV versus 0.5 mg IM | 1 | 54 | Risk Ratio (M‐H, Fixed, 95% CI) | 0.81 [0.20, 3.27] |
| 1.3 Any IV Vitamin K (0.2 mg) versus any IM Vitamin K (0.2 mg and 0.5 mg) | 1 | 80 | Risk Ratio (M‐H, Fixed, 95% CI) | 1.56 [0.38, 6.46] |
| 2 Intraventricular hemorrhage > Grade II Show forest plot | 1 | Risk Ratio (M‐H, Fixed, 95% CI) | Subtotals only | |
| Analysis 1.2 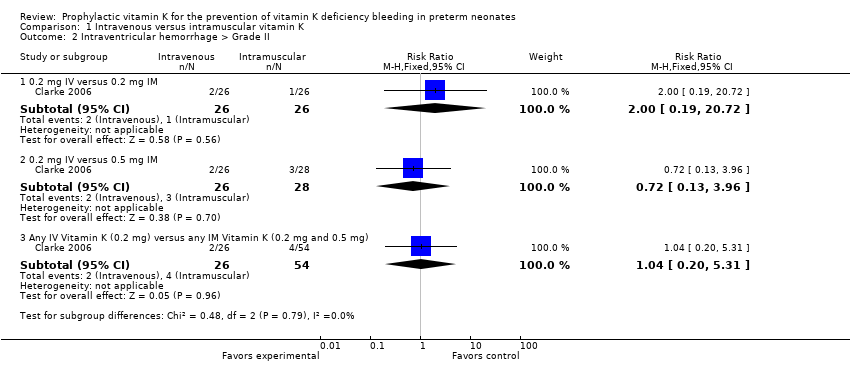 Comparison 1 Intravenous versus intramuscular vitamin K, Outcome 2 Intraventricular hemorrhage > Grade II. | ||||
| 2.1 0.2 mg IV versus 0.2 mg IM | 1 | 52 | Risk Ratio (M‐H, Fixed, 95% CI) | 2.0 [0.19, 20.72] |
| 2.2 0.2 mg IV versus 0.5 mg IM | 1 | 54 | Risk Ratio (M‐H, Fixed, 95% CI) | 0.72 [0.13, 3.96] |
| 2.3 Any IV Vitamin K (0.2 mg) versus any IM Vitamin K (0.2 mg and 0.5 mg) | 1 | 80 | Risk Ratio (M‐H, Fixed, 95% CI) | 1.04 [0.20, 5.31] |
| 3 Presence of PIVKA II at day 5 Show forest plot | 1 | Risk Ratio (M‐H, Fixed, 95% CI) | Subtotals only | |
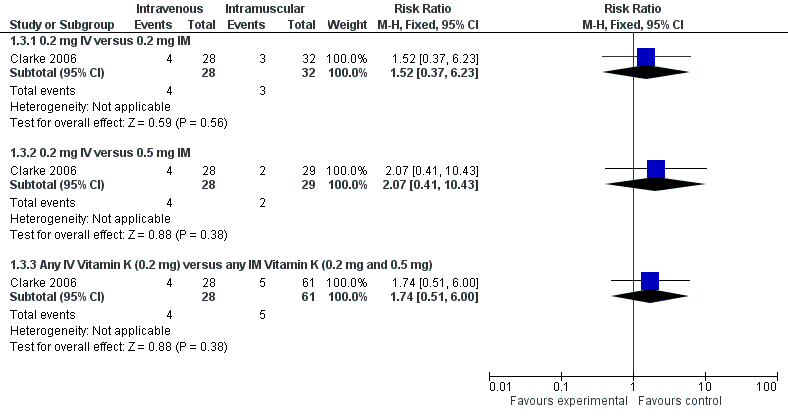
| Analysis 1.3  Comparison 1 Intravenous versus intramuscular vitamin K, Outcome 3 Presence of PIVKA II at day 5. | ||||
| 3.1 0.2 mg IV versus 0.2 mg IM | 1 | 60 | Risk Ratio (M‐H, Fixed, 95% CI) | 1.52 [0.37, 6.23] |
| 3.2 0.2 mg IV versus 0.5 mg IM | 1 | 57 | Risk Ratio (M‐H, Fixed, 95% CI) | 2.07 [0.41, 10.43] |
| 3.3 Any IV Vitamin K (0.2 mg) versus any IM Vitamin K (0.2 mg and 0.5 mg) | 1 | 89 | Risk Ratio (M‐H, Fixed, 95% CI) | 1.74 [0.51, 6.00] |
| 4 Presence of PIVKA II at day 25 Show forest plot | 1 | Risk Ratio (M‐H, Fixed, 95% CI) | Subtotals only | |
| Analysis 1.4  Comparison 1 Intravenous versus intramuscular vitamin K, Outcome 4 Presence of PIVKA II at day 25. | ||||
| 4.1 0.2 mg IV versus 0.2 mg IM | 1 | 52 | Risk Ratio (M‐H, Fixed, 95% CI) | 1.08 [0.07, 16.36] |
| 4.2 0.2 mg IV versus 0.5 mg IM | 1 | 51 | Risk Ratio (M‐H, Fixed, 95% CI) | 1.04 [0.07, 15.74] |
| 4.3 Any IV Vitamin K (0.2 mg) versus any IM Vitamin K (0.2 mg and 0.5 mg) | 1 | 78 | Risk Ratio (M‐H, Fixed, 95% CI) | 1.06 [0.10, 11.15] |
| 5 Prolonged PT at day 5 Show forest plot | 1 | Risk Ratio (M‐H, Fixed, 95% CI) | Subtotals only | |
| Analysis 1.5  Comparison 1 Intravenous versus intramuscular vitamin K, Outcome 5 Prolonged PT at day 5. | ||||
| 5.1 0.2 mg IV versus 0.2 mg IM | 1 | 63 | Risk Ratio (M‐H, Fixed, 95% CI) | 0.65 [0.24, 1.76] |
| 5.2 0.2 mg IV versus 0.5 mg IM | 1 | 60 | Risk Ratio (M‐H, Fixed, 95% CI) | 0.94 [0.30, 2.90] |
| 5.3 Any IV Vitamin K (0.2 mg) versus any IM Vitamin K (0.2 mg and 0.5 mg) | 1 | 92 | Risk Ratio (M‐H, Fixed, 95% CI) | 0.76 [0.30, 1.93] |
| 6 Vitamin K1 epoxide detected (≥ 10 ng/mL on day 5) Show forest plot | 1 | Risk Ratio (M‐H, Fixed, 95% CI) | Subtotals only | |
| Analysis 1.6  Comparison 1 Intravenous versus intramuscular vitamin K, Outcome 6 Vitamin K1 epoxide detected (≥ 10 ng/mL on day 5). | ||||
| 6.1 0.2 mg IV versus 0.2 mg IM | 1 | 61 | Risk Ratio (M‐H, Fixed, 95% CI) | 9.9 [0.56, 176.29] |
| 6.2 0.2 mg IV versus 0.5 mg IM | 1 | 58 | Risk Ratio (M‐H, Fixed, 95% CI) | 0.57 [0.19, 1.74] |
| 6.3 Any IV Vitamin K (0.2 mg) versus any IM Vitamin K (0.2 mg and 0.5 mg) | 1 | 90 | Risk Ratio (M‐H, Fixed, 95% CI) | 1.20 [0.38, 3.78] |
| 7 Vitamin K1 epoxide detected (≥ 0.3 ng/mL on day 25) Show forest plot | 1 | Risk Ratio (M‐H, Fixed, 95% CI) | Subtotals only | |
| Analysis 1.7  Comparison 1 Intravenous versus intramuscular vitamin K, Outcome 7 Vitamin K1 epoxide detected (≥ 0.3 ng/mL on day 25). | ||||
| 7.1 0.2 mg IV versus 0.2 mg IM | 1 | 52 | Risk Ratio (M‐H, Fixed, 95% CI) | 0.33 [0.01, 7.82] |
| 7.2 0.2 mg IV versus 0.5 mg IM | 1 | 54 | Risk Ratio (M‐H, Fixed, 95% CI) | 0.12 [0.01, 2.11] |
| 7.3 Any IV Vitamin K (0.2 mg) versus any IM Vitamin K (0.2 mg and 0.5 mg) | 1 | 80 | Risk Ratio (M‐H, Fixed, 95% CI) | 0.19 [0.01, 3.23] |
| 8 Necrotizing enterocolitis Show forest plot | 1 | Risk Ratio (M‐H, Fixed, 95% CI) | Subtotals only | |
| Analysis 1.8  Comparison 1 Intravenous versus intramuscular vitamin K, Outcome 8 Necrotizing enterocolitis. | ||||
| 8.1 0.2 mg IV versus 0.2 mg IM | 1 | 52 | Risk Ratio (M‐H, Fixed, 95% CI) | 1.0 [0.15, 6.57] |
| 8.2 0.2 mg IV versus 0.5 mg IM | 1 | 54 | Risk Ratio (M‐H, Fixed, 95% CI) | 1.08 [0.16, 7.10] |
| 8.3 Any IV Vitamin K (0.2 mg) versus any IM Vitamin K (0.2 mg and 0.5 mg) | 1 | 80 | Risk Ratio (M‐H, Fixed, 95% CI) | 1.04 [0.20, 5.31] |
| 9 Sepsis Show forest plot | 1 | Risk Ratio (M‐H, Fixed, 95% CI) | Subtotals only | |
| Analysis 1.9 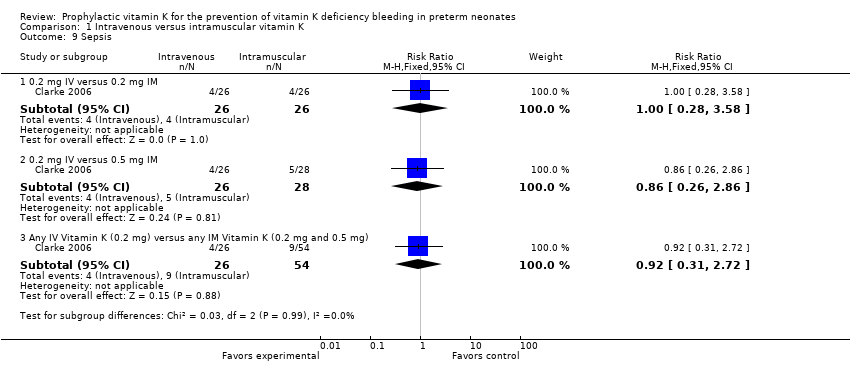 Comparison 1 Intravenous versus intramuscular vitamin K, Outcome 9 Sepsis. | ||||
| 9.1 0.2 mg IV versus 0.2 mg IM | 1 | 52 | Risk Ratio (M‐H, Fixed, 95% CI) | 1.0 [0.28, 3.58] |
| 9.2 0.2 mg IV versus 0.5 mg IM | 1 | 54 | Risk Ratio (M‐H, Fixed, 95% CI) | 0.86 [0.26, 2.86] |
| 9.3 Any IV Vitamin K (0.2 mg) versus any IM Vitamin K (0.2 mg and 0.5 mg) | 1 | 80 | Risk Ratio (M‐H, Fixed, 95% CI) | 0.92 [0.31, 2.72] |
| 10 Mortality (all infants) Show forest plot | 1 | Risk Ratio (M‐H, Fixed, 95% CI) | Subtotals only | |
| Analysis 1.10  Comparison 1 Intravenous versus intramuscular vitamin K, Outcome 10 Mortality (all infants). | ||||
| 10.1 0.2 mg IV versus 0.2 mg IM | 1 | 67 | Risk Ratio (M‐H, Fixed, 95% CI) | 1.32 [0.56, 3.14] |
| 10.2 0.2 mg IV versus 0.5 mg IM | 1 | 64 | Risk Ratio (M‐H, Fixed, 95% CI) | 2.82 [0.84, 9.46] |
| 10.3 Any IV Vitamin K (0.2 mg) versus any IM Vitamin K (0.2 mg and 0.5 mg) | 1 | 98 | Risk Ratio (M‐H, Fixed, 95% CI) | 1.77 [0.80, 3.93] |
| Outcome or subgroup title | No. of studies | No. of participants | Statistical method | Effect size |
| 1 Bleeding complications Show forest plot | 1 | Risk Ratio (M‐H, Fixed, 95% CI) | Subtotals only | |
| Analysis 2.1  Comparison 2 Vitamin K dosage, Outcome 1 Bleeding complications. | ||||
| 1.1 0.2 mg IM versus 0.5 mg IM | 1 | 54 | Risk Ratio (M‐H, Fixed, 95% CI) | 0.12 [0.01, 2.11] |
| 2 Intraventricular hemorrhage > Grade II Show forest plot | 1 | Risk Ratio (M‐H, Fixed, 95% CI) | Subtotals only | |
| Analysis 2.2  Comparison 2 Vitamin K dosage, Outcome 2 Intraventricular hemorrhage > Grade II. | ||||
| 2.1 0.2 mg IM versus 0.5 mg IM | 1 | 54 | Risk Ratio (M‐H, Fixed, 95% CI) | 0.36 [0.04, 3.24] |
| 3 Presence of PIVKA II at day 5 Show forest plot | 1 | Risk Ratio (M‐H, Fixed, 95% CI) | Subtotals only | |
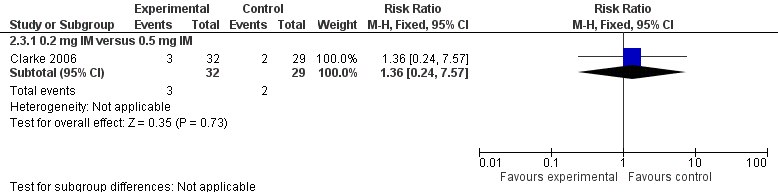
| Analysis 2.3  Comparison 2 Vitamin K dosage, Outcome 3 Presence of PIVKA II at day 5. | ||||
| 3.1 0.2 mg IM versus 0.5 mg IM | 1 | 61 | Risk Ratio (M‐H, Fixed, 95% CI) | 1.36 [0.24, 7.57] |
| 4 Presence of PIVKA II at day 25 Show forest plot | 1 | Risk Ratio (M‐H, Fixed, 95% CI) | Subtotals only | |
| Analysis 2.4  Comparison 2 Vitamin K dosage, Outcome 4 Presence of PIVKA II at day 25. | ||||
| 4.1 0.2 mg IM versus 0.5 mg IM | 1 | 53 | Risk Ratio (M‐H, Fixed, 95% CI) | 0.96 [0.06, 14.60] |
| 5 Prolonged PT at day 5 Show forest plot | 1 | Risk Ratio (M‐H, Fixed, 95% CI) | Subtotals only | |
| Analysis 2.5  Comparison 2 Vitamin K dosage, Outcome 5 Prolonged PT at day 5. | ||||
| 5.1 0.2 mg IM versus 0.5 mg IM | 1 | 61 | Risk Ratio (M‐H, Fixed, 95% CI) | 1.45 [0.53, 3.93] |
| 6 Vitamin K1 epoxide detected (≥ 10 ng/mL on day 5) Show forest plot | 1 | Risk Ratio (M‐H, Fixed, 95% CI) | Subtotals only | |
| Analysis 2.6 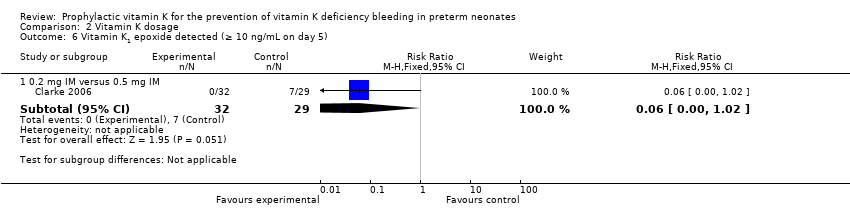 Comparison 2 Vitamin K dosage, Outcome 6 Vitamin K1 epoxide detected (≥ 10 ng/mL on day 5). | ||||
| 6.1 0.2 mg IM versus 0.5 mg IM | 1 | 61 | Risk Ratio (M‐H, Fixed, 95% CI) | 0.06 [0.00, 1.02] |
| 7 Vitamin K1 epoxide detected (≥ 0.3 ng/mL on day 25) Show forest plot | 1 | Risk Ratio (M‐H, Fixed, 95% CI) | Subtotals only | |
| Analysis 2.7  Comparison 2 Vitamin K dosage, Outcome 7 Vitamin K1 epoxide detected (≥ 0.3 ng/mL on day 25). | ||||
| 7.1 0.2 mg IM versus 0.5 mg IM | 1 | 54 | Risk Ratio (M‐H, Fixed, 95% CI) | 0.27 [0.03, 2.25] |
| 8 Necrotizing enterocolitis Show forest plot | 1 | Risk Ratio (M‐H, Fixed, 95% CI) | Subtotals only | |
| Analysis 2.8 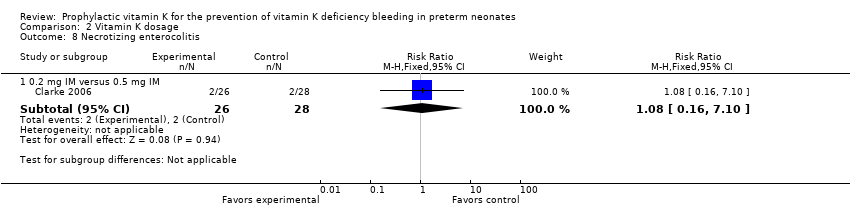 Comparison 2 Vitamin K dosage, Outcome 8 Necrotizing enterocolitis. | ||||
| 8.1 0.2 mg IM versus 0.5 mg IM | 1 | 54 | Risk Ratio (M‐H, Fixed, 95% CI) | 1.08 [0.16, 7.10] |
| 9 Sepsis Show forest plot | 1 | Risk Ratio (M‐H, Fixed, 95% CI) | Subtotals only | |
| Analysis 2.9  Comparison 2 Vitamin K dosage, Outcome 9 Sepsis. | ||||
| 9.1 0.2 mg IM versus 0.5 mg IM | 1 | 54 | Risk Ratio (M‐H, Fixed, 95% CI) | 0.86 [0.26, 2.86] |
| 10 Mortality (all infants) Show forest plot | 1 | Risk Ratio (M‐H, Fixed, 95% CI) | Subtotals only | |
| Analysis 2.10  Comparison 2 Vitamin K dosage, Outcome 10 Mortality (all infants). | ||||
| 10.1 0.2 mg IM versus 0.5 mg IM | 1 | 65 | Risk Ratio (M‐H, Fixed, 95% CI) | 2.13 [0.60, 7.51] |
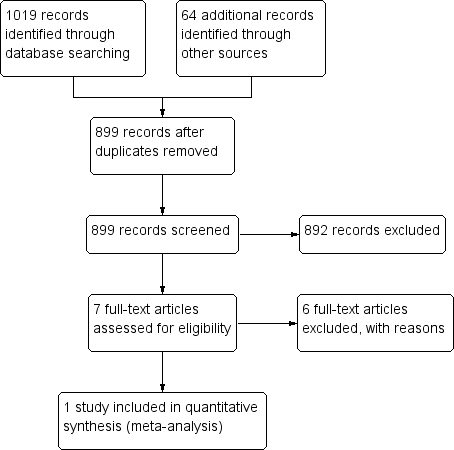
PRISMA flow diagram
Forest plot of comparison: 1 Intravenous versus intramuscular vitamin K, outcome: 1.3 Presence of PIVKA II at day 5.
Forest plot of comparison: 2 Vitamin K dosage, outcome: 2.3 Presence of PIVKA II at day 5.

Comparison 1 Intravenous versus intramuscular vitamin K, Outcome 1 Bleeding complications.

Comparison 1 Intravenous versus intramuscular vitamin K, Outcome 2 Intraventricular hemorrhage > Grade II.
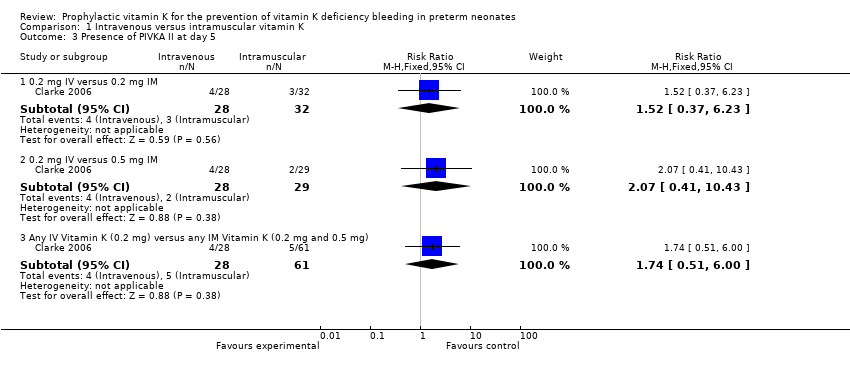
Comparison 1 Intravenous versus intramuscular vitamin K, Outcome 3 Presence of PIVKA II at day 5.

Comparison 1 Intravenous versus intramuscular vitamin K, Outcome 4 Presence of PIVKA II at day 25.
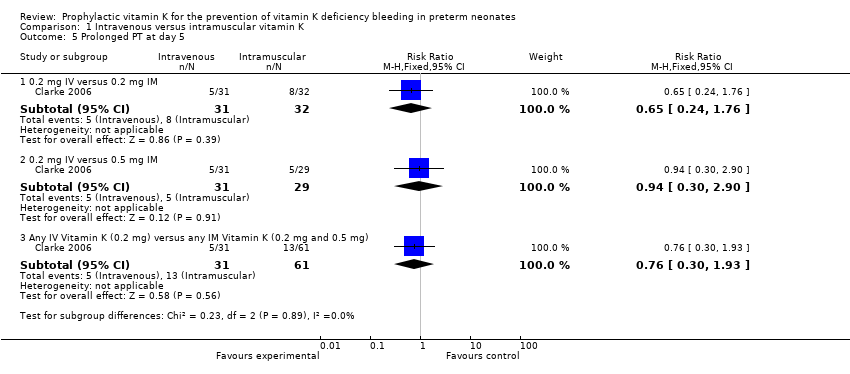
Comparison 1 Intravenous versus intramuscular vitamin K, Outcome 5 Prolonged PT at day 5.
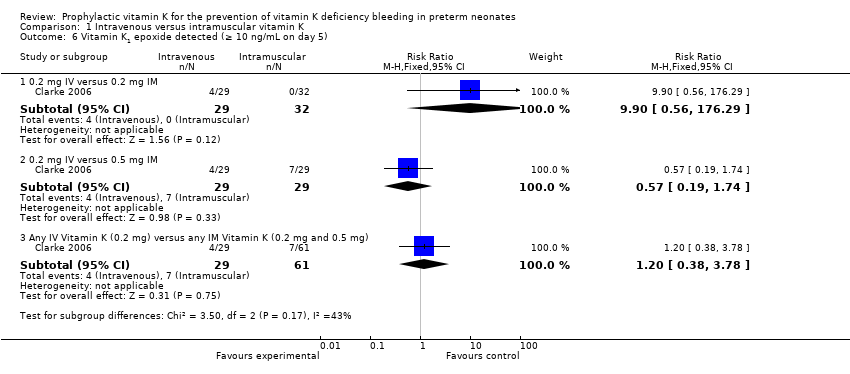
Comparison 1 Intravenous versus intramuscular vitamin K, Outcome 6 Vitamin K1 epoxide detected (≥ 10 ng/mL on day 5).
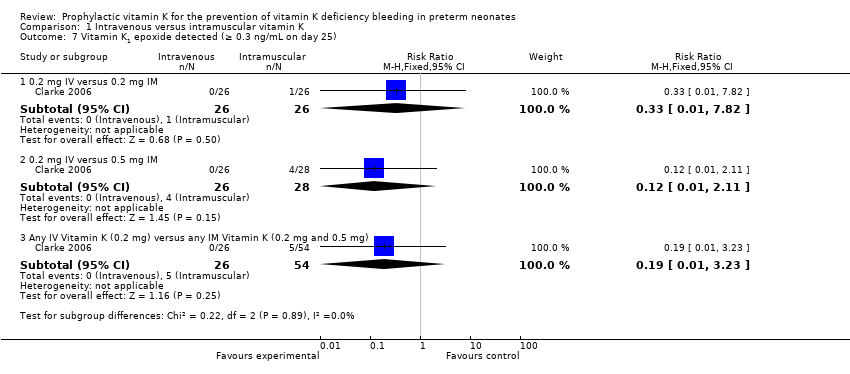
Comparison 1 Intravenous versus intramuscular vitamin K, Outcome 7 Vitamin K1 epoxide detected (≥ 0.3 ng/mL on day 25).

Comparison 1 Intravenous versus intramuscular vitamin K, Outcome 8 Necrotizing enterocolitis.

Comparison 1 Intravenous versus intramuscular vitamin K, Outcome 9 Sepsis.

Comparison 1 Intravenous versus intramuscular vitamin K, Outcome 10 Mortality (all infants).
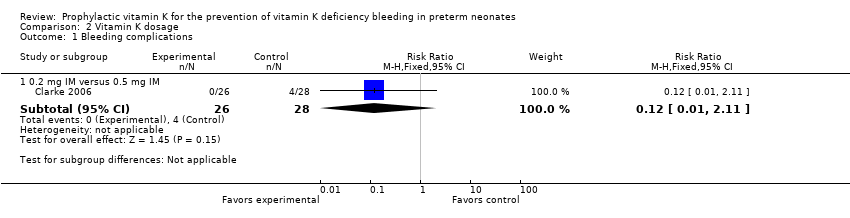
Comparison 2 Vitamin K dosage, Outcome 1 Bleeding complications.

Comparison 2 Vitamin K dosage, Outcome 2 Intraventricular hemorrhage > Grade II.
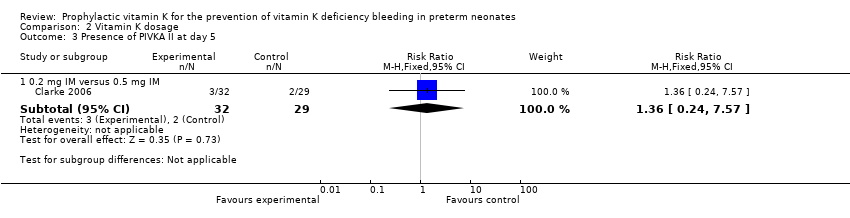
Comparison 2 Vitamin K dosage, Outcome 3 Presence of PIVKA II at day 5.

Comparison 2 Vitamin K dosage, Outcome 4 Presence of PIVKA II at day 25.

Comparison 2 Vitamin K dosage, Outcome 5 Prolonged PT at day 5.

Comparison 2 Vitamin K dosage, Outcome 6 Vitamin K1 epoxide detected (≥ 10 ng/mL on day 5).

Comparison 2 Vitamin K dosage, Outcome 7 Vitamin K1 epoxide detected (≥ 0.3 ng/mL on day 25).

Comparison 2 Vitamin K dosage, Outcome 8 Necrotizing enterocolitis.
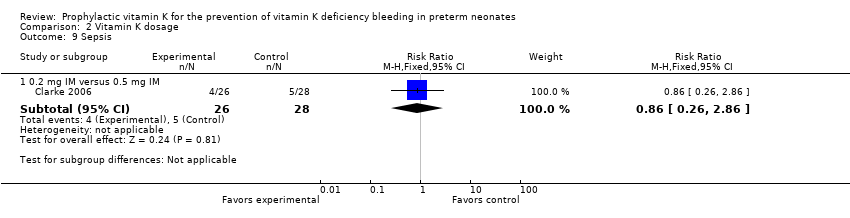
Comparison 2 Vitamin K dosage, Outcome 9 Sepsis.

Comparison 2 Vitamin K dosage, Outcome 10 Mortality (all infants).
| Intramuscular vitamin K versus intravenous vitamin K | |||||
| Patient or population: preterm infants | |||||
| Outcomes | Anticipated absolute effects* (95% CI) | Relative effect | Number of participants | Quality of the evidence | |
| Risk with prophylactic IV vitamin K treatment | Risk with prophylactic IM vitamin K | ||||
| Bleeding complications: | Study population | RR 7.00 | 52 | ⊕⊕⊝⊝ | |
| 0 per 1000 | 0 per 1000 | ||||
| Bleeding complications: | Study population | RR 0.81 | 54 | ⊕⊕⊝⊝ | |
| 143 per 1000 | 116 per 1000 | ||||
| Intraventricular hemorrhage > Grade II: | Study population | RR 2.00 | 52 | ⊕⊕⊝⊝ | |
| 38 per 1000 | 77 per 1000 | ||||
| Intraventricular hemorrhage > Grade II: | Study population | RR 0.72 | 54 | ⊕⊕⊝⊝ | |
| 107 per 1000 | 77 per 1000 | ||||
| Presence of PIVKA II at day 5: | Study population | RR 1.52 | 60 | ⊕⊕⊝⊝ | |
| 94 per 1000 | 143 per 1000 | ||||
| Presence of PIVKA II at day 5: | Study population | RR 2.07 | 57 | ⊕⊕⊝⊝ | |
| 69 per 1000 | 143 per 1000 | ||||
| Presence of PIVKA II at day 25: | Study population | RR 1.08 | 52 | ⊕⊕⊝⊝ | |
| 37 per 1000 | 40 per 1000 | ||||
| Presence of PIVKA II at day 25 ‐ 0.2 mg IV versus 0.5 mg IM | Study population | RR 1.04 | 51 | ⊕⊕⊝⊝ | |
| 38 per 1000 | 40 per 1000 | ||||
| Necrotizing enterocolitis ‐ 0.2 mg IV versus 0.2 mg IM | Study population | RR 1.00 | 52 | ⊕⊕⊝⊝ | |
| 77 per 1000 | 77 per 1000 | ||||
| Necrotizing enterocolitis: 0.2 mg IV versus 0.5 mg IM | Study population | RR 1.08 | 54 | ⊕⊕⊝⊝ | |
| 71 per 1000 | 77 per 1000 | ||||
| Sepsis: 0.2 mg IV versus 0.2 mg IM | Study population | RR 1.00 | 52 | ⊕⊕⊝⊝ | |
| 154 per 1000 | 154 per 1000 | ||||
| Sepsis: 0.2 mg IV versus 0.5 mg IM | Study population | RR 0.86 | 54 | ⊕⊕⊝⊝ | |
| 179 per 1000 | 154 per 1000 | ||||
| Mortality (all infants): | Study population | RR 1.32 | 67 | ⊕⊕⊝⊝ | |
| 206 per 1000 | 272 per 1000 | ||||
| Mortality (all infants): 0.2 mg IV versus 0.5 mg IM | Study population | RR 2.82 | 64 | ⊕⊕⊝⊝ | |
| 97 per 1000 | 273 per 1000 | ||||
| *The risk in the intervention group (and its 95% CI) is based on the assumed risk in the comparison group and the relative effect of the intervention (and its 95% CI). | |||||
| GRADE Working Group grades of evidence | |||||
| 1We downgraded by two levels due to the small sample size from one included trial. | |||||
| Higher dose vitamin K compared to lower dose vitamin K for preterm infants | ||||||
| Patient or population: preterm infants | ||||||
| Outcomes | Anticipated absolute effects* (95% CI) | Relative effect | Number of participants | Quality of the evidence | Comments | |
| Risk with lower dose vitamin K | Risk with higher dose vitamin K | |||||
| Bleeding complications: | Study population | RR 0.12 | 54 | ⊕⊕⊝⊝ | ||
| 143 per 1000 | 17 per 1000 | |||||
| Intraventricular hemorrhage > Grade II: | Study population | RR 0.36 | 54 | ⊕⊕⊝⊝ | ||
| 107 per 1000 | 39 per 1000 | |||||
| Presence of PIVKA II at day 5: | Study population | RR 1.36 | 61 | ⊕⊕⊝⊝ | ||
| 69 per 1000 | 94 per 1000 | |||||
| Presence of PIVKA II at day 25: | Study population | RR 0.96 | 53 | ⊕⊕⊝⊝ | ||
| 38 per 1000 | 37 per 1000 | |||||
| Necrotizing enterocolitis: | Study population | RR 1.08 | 54 | ⊕⊕⊝⊝ | ||
| 71 per 1000 | 77 per 1000 | |||||
| Sepsis: | Study population | RR 0.86 | 54 | ⊕⊕⊝⊝ | ||
| 179 per 1000 | 154 per 1000 | |||||
| Mortality (all infants): | Study population | RR 2.13 | 65 | ⊕⊕⊝⊝ | ||
| 97 per 1000 | 206 per 1000 | |||||
| *The risk in the intervention group (and its 95% CI) is based on the assumed risk in the comparison group and the relative effect of the intervention (and its 95% CI). | ||||||
| GRADE Working Group grades of evidence | ||||||
| 1We downgraded by two levels due to the small sample size from one included trial. | ||||||
| Outcome or subgroup title | No. of studies | No. of participants | Statistical method | Effect size |
| 1 Bleeding complications Show forest plot | 1 | Risk Ratio (M‐H, Fixed, 95% CI) | Subtotals only | |
| 1.1 0.2 mg IV versus 0.2 mg IM | 1 | 52 | Risk Ratio (M‐H, Fixed, 95% CI) | 7.0 [0.38, 129.11] |
| 1.2 0.2 mg IV versus 0.5 mg IM | 1 | 54 | Risk Ratio (M‐H, Fixed, 95% CI) | 0.81 [0.20, 3.27] |
| 1.3 Any IV Vitamin K (0.2 mg) versus any IM Vitamin K (0.2 mg and 0.5 mg) | 1 | 80 | Risk Ratio (M‐H, Fixed, 95% CI) | 1.56 [0.38, 6.46] |
| 2 Intraventricular hemorrhage > Grade II Show forest plot | 1 | Risk Ratio (M‐H, Fixed, 95% CI) | Subtotals only | |
| 2.1 0.2 mg IV versus 0.2 mg IM | 1 | 52 | Risk Ratio (M‐H, Fixed, 95% CI) | 2.0 [0.19, 20.72] |
| 2.2 0.2 mg IV versus 0.5 mg IM | 1 | 54 | Risk Ratio (M‐H, Fixed, 95% CI) | 0.72 [0.13, 3.96] |
| 2.3 Any IV Vitamin K (0.2 mg) versus any IM Vitamin K (0.2 mg and 0.5 mg) | 1 | 80 | Risk Ratio (M‐H, Fixed, 95% CI) | 1.04 [0.20, 5.31] |
| 3 Presence of PIVKA II at day 5 Show forest plot | 1 | Risk Ratio (M‐H, Fixed, 95% CI) | Subtotals only | |
| 3.1 0.2 mg IV versus 0.2 mg IM | 1 | 60 | Risk Ratio (M‐H, Fixed, 95% CI) | 1.52 [0.37, 6.23] |
| 3.2 0.2 mg IV versus 0.5 mg IM | 1 | 57 | Risk Ratio (M‐H, Fixed, 95% CI) | 2.07 [0.41, 10.43] |
| 3.3 Any IV Vitamin K (0.2 mg) versus any IM Vitamin K (0.2 mg and 0.5 mg) | 1 | 89 | Risk Ratio (M‐H, Fixed, 95% CI) | 1.74 [0.51, 6.00] |
| 4 Presence of PIVKA II at day 25 Show forest plot | 1 | Risk Ratio (M‐H, Fixed, 95% CI) | Subtotals only | |
| 4.1 0.2 mg IV versus 0.2 mg IM | 1 | 52 | Risk Ratio (M‐H, Fixed, 95% CI) | 1.08 [0.07, 16.36] |
| 4.2 0.2 mg IV versus 0.5 mg IM | 1 | 51 | Risk Ratio (M‐H, Fixed, 95% CI) | 1.04 [0.07, 15.74] |
| 4.3 Any IV Vitamin K (0.2 mg) versus any IM Vitamin K (0.2 mg and 0.5 mg) | 1 | 78 | Risk Ratio (M‐H, Fixed, 95% CI) | 1.06 [0.10, 11.15] |
| 5 Prolonged PT at day 5 Show forest plot | 1 | Risk Ratio (M‐H, Fixed, 95% CI) | Subtotals only | |
| 5.1 0.2 mg IV versus 0.2 mg IM | 1 | 63 | Risk Ratio (M‐H, Fixed, 95% CI) | 0.65 [0.24, 1.76] |
| 5.2 0.2 mg IV versus 0.5 mg IM | 1 | 60 | Risk Ratio (M‐H, Fixed, 95% CI) | 0.94 [0.30, 2.90] |
| 5.3 Any IV Vitamin K (0.2 mg) versus any IM Vitamin K (0.2 mg and 0.5 mg) | 1 | 92 | Risk Ratio (M‐H, Fixed, 95% CI) | 0.76 [0.30, 1.93] |
| 6 Vitamin K1 epoxide detected (≥ 10 ng/mL on day 5) Show forest plot | 1 | Risk Ratio (M‐H, Fixed, 95% CI) | Subtotals only | |
| 6.1 0.2 mg IV versus 0.2 mg IM | 1 | 61 | Risk Ratio (M‐H, Fixed, 95% CI) | 9.9 [0.56, 176.29] |
| 6.2 0.2 mg IV versus 0.5 mg IM | 1 | 58 | Risk Ratio (M‐H, Fixed, 95% CI) | 0.57 [0.19, 1.74] |
| 6.3 Any IV Vitamin K (0.2 mg) versus any IM Vitamin K (0.2 mg and 0.5 mg) | 1 | 90 | Risk Ratio (M‐H, Fixed, 95% CI) | 1.20 [0.38, 3.78] |
| 7 Vitamin K1 epoxide detected (≥ 0.3 ng/mL on day 25) Show forest plot | 1 | Risk Ratio (M‐H, Fixed, 95% CI) | Subtotals only | |
| 7.1 0.2 mg IV versus 0.2 mg IM | 1 | 52 | Risk Ratio (M‐H, Fixed, 95% CI) | 0.33 [0.01, 7.82] |
| 7.2 0.2 mg IV versus 0.5 mg IM | 1 | 54 | Risk Ratio (M‐H, Fixed, 95% CI) | 0.12 [0.01, 2.11] |
| 7.3 Any IV Vitamin K (0.2 mg) versus any IM Vitamin K (0.2 mg and 0.5 mg) | 1 | 80 | Risk Ratio (M‐H, Fixed, 95% CI) | 0.19 [0.01, 3.23] |
| 8 Necrotizing enterocolitis Show forest plot | 1 | Risk Ratio (M‐H, Fixed, 95% CI) | Subtotals only | |
| 8.1 0.2 mg IV versus 0.2 mg IM | 1 | 52 | Risk Ratio (M‐H, Fixed, 95% CI) | 1.0 [0.15, 6.57] |
| 8.2 0.2 mg IV versus 0.5 mg IM | 1 | 54 | Risk Ratio (M‐H, Fixed, 95% CI) | 1.08 [0.16, 7.10] |
| 8.3 Any IV Vitamin K (0.2 mg) versus any IM Vitamin K (0.2 mg and 0.5 mg) | 1 | 80 | Risk Ratio (M‐H, Fixed, 95% CI) | 1.04 [0.20, 5.31] |
| 9 Sepsis Show forest plot | 1 | Risk Ratio (M‐H, Fixed, 95% CI) | Subtotals only | |
| 9.1 0.2 mg IV versus 0.2 mg IM | 1 | 52 | Risk Ratio (M‐H, Fixed, 95% CI) | 1.0 [0.28, 3.58] |
| 9.2 0.2 mg IV versus 0.5 mg IM | 1 | 54 | Risk Ratio (M‐H, Fixed, 95% CI) | 0.86 [0.26, 2.86] |
| 9.3 Any IV Vitamin K (0.2 mg) versus any IM Vitamin K (0.2 mg and 0.5 mg) | 1 | 80 | Risk Ratio (M‐H, Fixed, 95% CI) | 0.92 [0.31, 2.72] |
| 10 Mortality (all infants) Show forest plot | 1 | Risk Ratio (M‐H, Fixed, 95% CI) | Subtotals only | |
| 10.1 0.2 mg IV versus 0.2 mg IM | 1 | 67 | Risk Ratio (M‐H, Fixed, 95% CI) | 1.32 [0.56, 3.14] |
| 10.2 0.2 mg IV versus 0.5 mg IM | 1 | 64 | Risk Ratio (M‐H, Fixed, 95% CI) | 2.82 [0.84, 9.46] |
| 10.3 Any IV Vitamin K (0.2 mg) versus any IM Vitamin K (0.2 mg and 0.5 mg) | 1 | 98 | Risk Ratio (M‐H, Fixed, 95% CI) | 1.77 [0.80, 3.93] |
| Outcome or subgroup title | No. of studies | No. of participants | Statistical method | Effect size |
| 1 Bleeding complications Show forest plot | 1 | Risk Ratio (M‐H, Fixed, 95% CI) | Subtotals only | |
| 1.1 0.2 mg IM versus 0.5 mg IM | 1 | 54 | Risk Ratio (M‐H, Fixed, 95% CI) | 0.12 [0.01, 2.11] |
| 2 Intraventricular hemorrhage > Grade II Show forest plot | 1 | Risk Ratio (M‐H, Fixed, 95% CI) | Subtotals only | |
| 2.1 0.2 mg IM versus 0.5 mg IM | 1 | 54 | Risk Ratio (M‐H, Fixed, 95% CI) | 0.36 [0.04, 3.24] |
| 3 Presence of PIVKA II at day 5 Show forest plot | 1 | Risk Ratio (M‐H, Fixed, 95% CI) | Subtotals only | |
| 3.1 0.2 mg IM versus 0.5 mg IM | 1 | 61 | Risk Ratio (M‐H, Fixed, 95% CI) | 1.36 [0.24, 7.57] |
| 4 Presence of PIVKA II at day 25 Show forest plot | 1 | Risk Ratio (M‐H, Fixed, 95% CI) | Subtotals only | |
| 4.1 0.2 mg IM versus 0.5 mg IM | 1 | 53 | Risk Ratio (M‐H, Fixed, 95% CI) | 0.96 [0.06, 14.60] |
| 5 Prolonged PT at day 5 Show forest plot | 1 | Risk Ratio (M‐H, Fixed, 95% CI) | Subtotals only | |
| 5.1 0.2 mg IM versus 0.5 mg IM | 1 | 61 | Risk Ratio (M‐H, Fixed, 95% CI) | 1.45 [0.53, 3.93] |
| 6 Vitamin K1 epoxide detected (≥ 10 ng/mL on day 5) Show forest plot | 1 | Risk Ratio (M‐H, Fixed, 95% CI) | Subtotals only | |
| 6.1 0.2 mg IM versus 0.5 mg IM | 1 | 61 | Risk Ratio (M‐H, Fixed, 95% CI) | 0.06 [0.00, 1.02] |
| 7 Vitamin K1 epoxide detected (≥ 0.3 ng/mL on day 25) Show forest plot | 1 | Risk Ratio (M‐H, Fixed, 95% CI) | Subtotals only | |
| 7.1 0.2 mg IM versus 0.5 mg IM | 1 | 54 | Risk Ratio (M‐H, Fixed, 95% CI) | 0.27 [0.03, 2.25] |
| 8 Necrotizing enterocolitis Show forest plot | 1 | Risk Ratio (M‐H, Fixed, 95% CI) | Subtotals only | |
| 8.1 0.2 mg IM versus 0.5 mg IM | 1 | 54 | Risk Ratio (M‐H, Fixed, 95% CI) | 1.08 [0.16, 7.10] |
| 9 Sepsis Show forest plot | 1 | Risk Ratio (M‐H, Fixed, 95% CI) | Subtotals only | |
| 9.1 0.2 mg IM versus 0.5 mg IM | 1 | 54 | Risk Ratio (M‐H, Fixed, 95% CI) | 0.86 [0.26, 2.86] |
| 10 Mortality (all infants) Show forest plot | 1 | Risk Ratio (M‐H, Fixed, 95% CI) | Subtotals only | |
| 10.1 0.2 mg IM versus 0.5 mg IM | 1 | 65 | Risk Ratio (M‐H, Fixed, 95% CI) | 2.13 [0.60, 7.51] |