Vitamina K profiláctica para la prevención de la hemorragia por deficiencia de vitamina K en recién nacidos prematuros
Información
- DOI:
- https://doi.org/10.1002/14651858.CD008342.pub2Copiar DOI

- Base de datos:
-
- Cochrane Database of Systematic Reviews
- Versión publicada:
-
- 05 febrero 2018see what's new
- Tipo:
-
- Intervention
- Etapa:
-
- Review
- Grupo Editorial Cochrane:
-
Grupo Cochrane de Neonatología
- Copyright:
-
- Copyright © 2018 The Cochrane Collaboration. Published by John Wiley & Sons, Ltd.
Cifras del artículo
Altmetric:
Citado por:
Autores
Contributions of authors
SA wrote the Background section and helped draft the Methods section.
RS drafted the Methods section and edited the Background section.
CO assisted with selecting studies, checking data, and editing the review.
MO is the principal author of the original published version of this review. He reviewed and edited all sections of the current review.
Declarations of interest
SA has no conflict to declare.
RS has no conflict to declare.
CO has no conflict to declare.
MO has no conflict to declare.
Acknowledgements
We thank the Cochrane Neonatal editorial team for their help in providing searches and editorial assistance.
Version history
| Published | Title | Stage | Authors | Version |
| 2018 Feb 05 | Prophylactic vitamin K for the prevention of vitamin K deficiency bleeding in preterm neonates | Review | Stephanie Ardell, Martin Offringa, Colleen Ovelman, Roger Soll | |
| 2010 Jan 20 | Prophylactic vitamin K for the prevention of vitamin K deficiency bleeding in preterm neonates | Protocol | Stephanie Ardell, Martin Offringa, Roger Soll | |
Differences between protocol and review
-
We added dosage of vitamin K as a main comparison;
-
we amended the 'Types of participants' from preterm infants of gestational age < 34 weeks to preterm infants of gestational age < 37 weeks;
-
the description of 'Types of interventions' was refined to better define vitamin K prophylaxis as administered prior to evidence of VKDB;
-
the following secondary outcomes were added post hoc:
-
vitamin K1 2,3‐epoxide;
-
necrotizing enterocolitis;
-
sepsis;
-
mortality;
-
neurodevelopmental status at 18 to 24 months;
-
-
we did not separately search for conference abstracts as suggested in the protocol, as these abstracts are now included in CENTRAL;
-
we updated the 'Risk of bias' criteria to align with the Cochrane Handbook for Systematic Reviews of Interventions (Higgins 2011);
-
we added the quality of evidence assessment following the GRADE approach and reported these assessments in the 'Summary of findings' tables.
Keywords
MeSH
Medical Subject Headings (MeSH) Keywords
- Biomarkers [metabolism];
- Infant Mortality;
- Infant, Premature;
- Injections, Intramuscular;
- Injections, Intravenous;
- Liver [metabolism];
- Protein Precursors [metabolism];
- Prothrombin [analysis, metabolism];
- Vitamin K [*administration & dosage, blood];
- Vitamin K 1 [analogs & derivatives, blood];
- Vitamin K Deficiency Bleeding [*prevention & control];
- Vitamins [*administration & dosage];
Medical Subject Headings Check Words
Humans; Infant; Infant, Newborn;
PICO
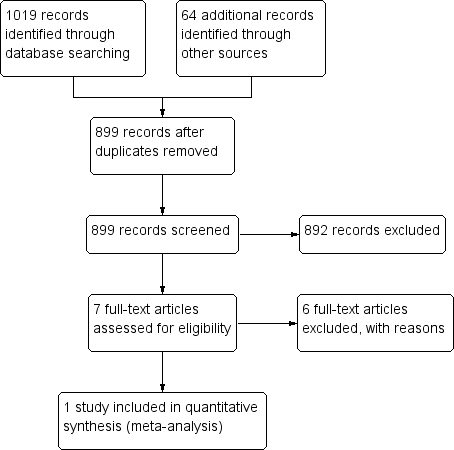
PRISMA flow diagram
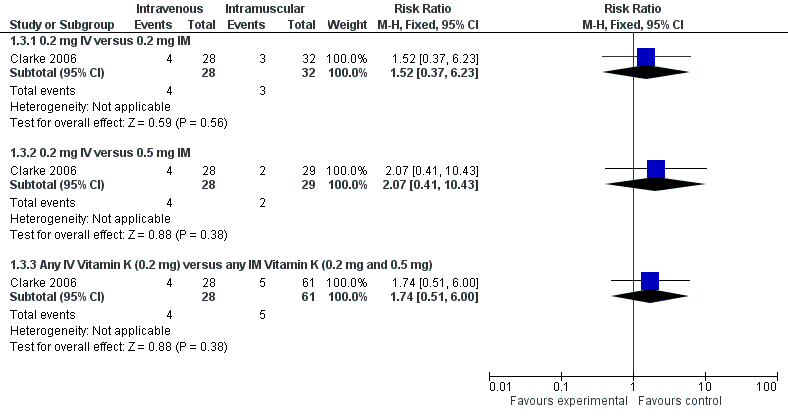
Forest plot of comparison: 1 Intravenous versus intramuscular vitamin K, outcome: 1.3 Presence of PIVKA II at day 5.
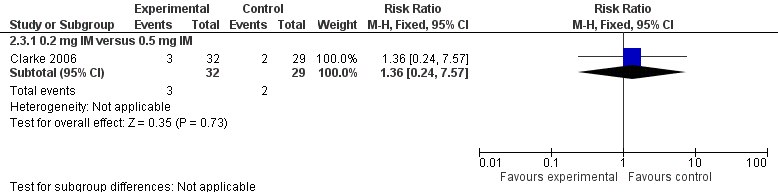
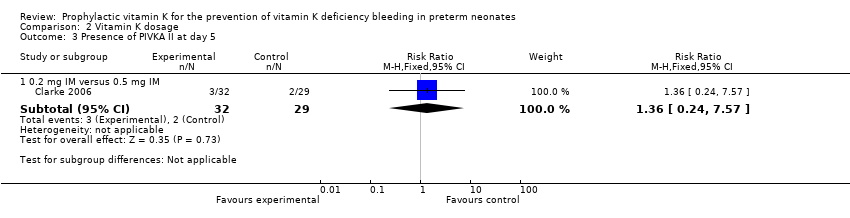
Forest plot of comparison: 2 Vitamin K dosage, outcome: 2.3 Presence of PIVKA II at day 5.

Comparison 1 Intravenous versus intramuscular vitamin K, Outcome 1 Bleeding complications.

Comparison 1 Intravenous versus intramuscular vitamin K, Outcome 2 Intraventricular hemorrhage > Grade II.
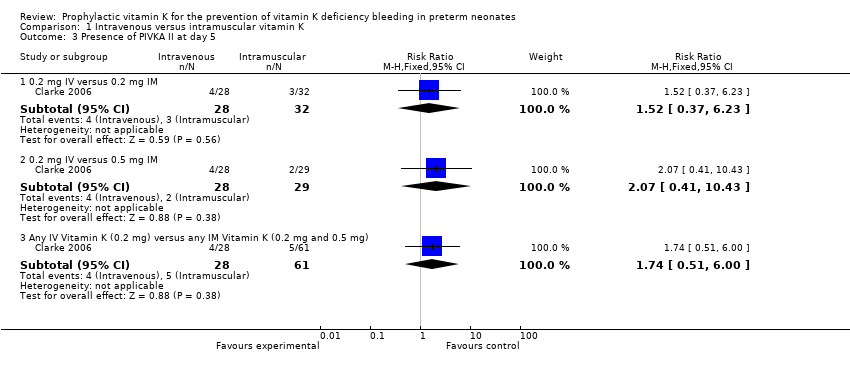
Comparison 1 Intravenous versus intramuscular vitamin K, Outcome 3 Presence of PIVKA II at day 5.

Comparison 1 Intravenous versus intramuscular vitamin K, Outcome 4 Presence of PIVKA II at day 25.
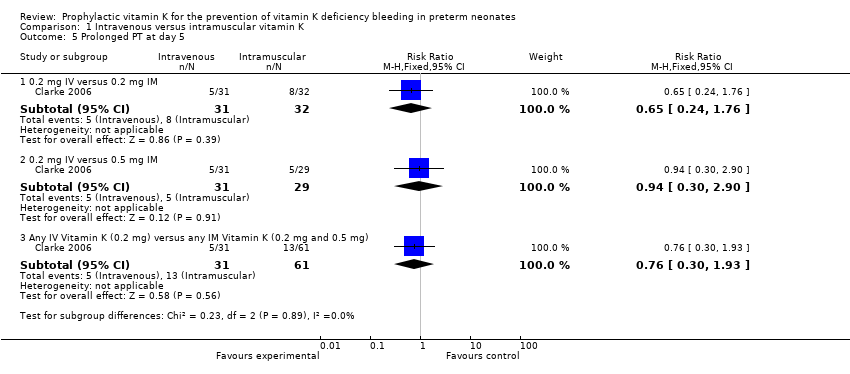
Comparison 1 Intravenous versus intramuscular vitamin K, Outcome 5 Prolonged PT at day 5.
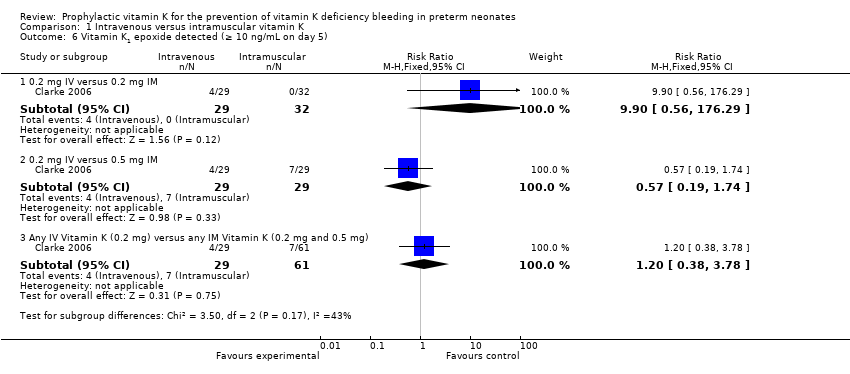
Comparison 1 Intravenous versus intramuscular vitamin K, Outcome 6 Vitamin K1 epoxide detected (≥ 10 ng/mL on day 5).
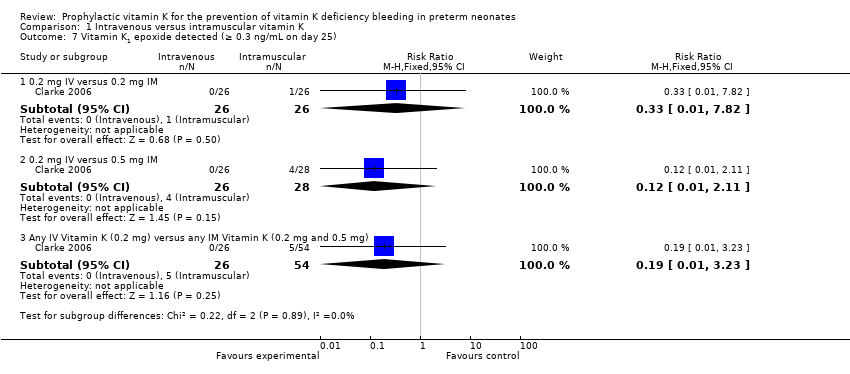
Comparison 1 Intravenous versus intramuscular vitamin K, Outcome 7 Vitamin K1 epoxide detected (≥ 0.3 ng/mL on day 25).

Comparison 1 Intravenous versus intramuscular vitamin K, Outcome 8 Necrotizing enterocolitis.

Comparison 1 Intravenous versus intramuscular vitamin K, Outcome 9 Sepsis.

Comparison 1 Intravenous versus intramuscular vitamin K, Outcome 10 Mortality (all infants).
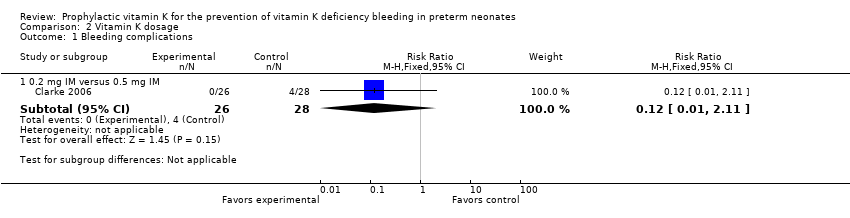
Comparison 2 Vitamin K dosage, Outcome 1 Bleeding complications.

Comparison 2 Vitamin K dosage, Outcome 2 Intraventricular hemorrhage > Grade II.
Comparison 2 Vitamin K dosage, Outcome 3 Presence of PIVKA II at day 5.

Comparison 2 Vitamin K dosage, Outcome 4 Presence of PIVKA II at day 25.

Comparison 2 Vitamin K dosage, Outcome 5 Prolonged PT at day 5.

Comparison 2 Vitamin K dosage, Outcome 6 Vitamin K1 epoxide detected (≥ 10 ng/mL on day 5).

Comparison 2 Vitamin K dosage, Outcome 7 Vitamin K1 epoxide detected (≥ 0.3 ng/mL on day 25).
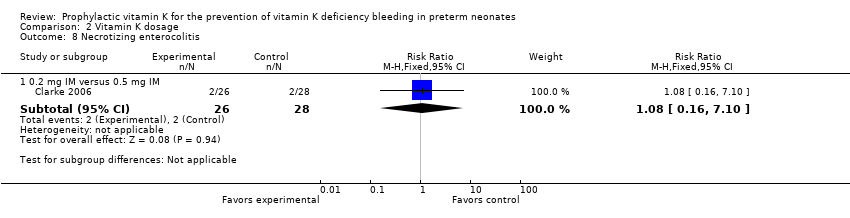
Comparison 2 Vitamin K dosage, Outcome 8 Necrotizing enterocolitis.
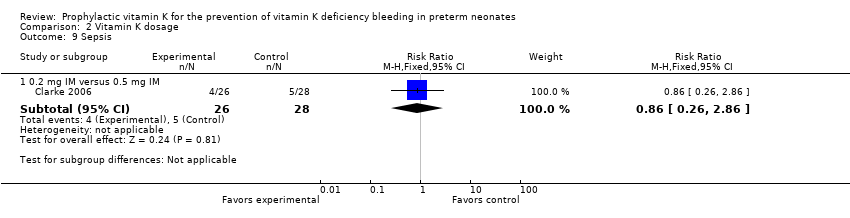
Comparison 2 Vitamin K dosage, Outcome 9 Sepsis.

Comparison 2 Vitamin K dosage, Outcome 10 Mortality (all infants).
| Intramuscular vitamin K versus intravenous vitamin K | |||||
| Patient or population: preterm infants | |||||
| Outcomes | Anticipated absolute effects* (95% CI) | Relative effect | Number of participants | Quality of the evidence | |
| Risk with prophylactic IV vitamin K treatment | Risk with prophylactic IM vitamin K | ||||
| Bleeding complications: | Study population | RR 7.00 | 52 | ⊕⊕⊝⊝ | |
| 0 per 1000 | 0 per 1000 | ||||
| Bleeding complications: | Study population | RR 0.81 | 54 | ⊕⊕⊝⊝ | |
| 143 per 1000 | 116 per 1000 | ||||
| Intraventricular hemorrhage > Grade II: | Study population | RR 2.00 | 52 | ⊕⊕⊝⊝ | |
| 38 per 1000 | 77 per 1000 | ||||
| Intraventricular hemorrhage > Grade II: | Study population | RR 0.72 | 54 | ⊕⊕⊝⊝ | |
| 107 per 1000 | 77 per 1000 | ||||
| Presence of PIVKA II at day 5: | Study population | RR 1.52 | 60 | ⊕⊕⊝⊝ | |
| 94 per 1000 | 143 per 1000 | ||||
| Presence of PIVKA II at day 5: | Study population | RR 2.07 | 57 | ⊕⊕⊝⊝ | |
| 69 per 1000 | 143 per 1000 | ||||
| Presence of PIVKA II at day 25: | Study population | RR 1.08 | 52 | ⊕⊕⊝⊝ | |
| 37 per 1000 | 40 per 1000 | ||||
| Presence of PIVKA II at day 25 ‐ 0.2 mg IV versus 0.5 mg IM | Study population | RR 1.04 | 51 | ⊕⊕⊝⊝ | |
| 38 per 1000 | 40 per 1000 | ||||
| Necrotizing enterocolitis ‐ 0.2 mg IV versus 0.2 mg IM | Study population | RR 1.00 | 52 | ⊕⊕⊝⊝ | |
| 77 per 1000 | 77 per 1000 | ||||
| Necrotizing enterocolitis: 0.2 mg IV versus 0.5 mg IM | Study population | RR 1.08 | 54 | ⊕⊕⊝⊝ | |
| 71 per 1000 | 77 per 1000 | ||||
| Sepsis: 0.2 mg IV versus 0.2 mg IM | Study population | RR 1.00 | 52 | ⊕⊕⊝⊝ | |
| 154 per 1000 | 154 per 1000 | ||||
| Sepsis: 0.2 mg IV versus 0.5 mg IM | Study population | RR 0.86 | 54 | ⊕⊕⊝⊝ | |
| 179 per 1000 | 154 per 1000 | ||||
| Mortality (all infants): | Study population | RR 1.32 | 67 | ⊕⊕⊝⊝ | |
| 206 per 1000 | 272 per 1000 | ||||
| Mortality (all infants): 0.2 mg IV versus 0.5 mg IM | Study population | RR 2.82 | 64 | ⊕⊕⊝⊝ | |
| 97 per 1000 | 273 per 1000 | ||||
| *The risk in the intervention group (and its 95% CI) is based on the assumed risk in the comparison group and the relative effect of the intervention (and its 95% CI). | |||||
| GRADE Working Group grades of evidence | |||||
| 1We downgraded by two levels due to the small sample size from one included trial. | |||||
| Higher dose vitamin K compared to lower dose vitamin K for preterm infants | ||||||
| Patient or population: preterm infants | ||||||
| Outcomes | Anticipated absolute effects* (95% CI) | Relative effect | Number of participants | Quality of the evidence | Comments | |
| Risk with lower dose vitamin K | Risk with higher dose vitamin K | |||||
| Bleeding complications: | Study population | RR 0.12 | 54 | ⊕⊕⊝⊝ | ||
| 143 per 1000 | 17 per 1000 | |||||
| Intraventricular hemorrhage > Grade II: | Study population | RR 0.36 | 54 | ⊕⊕⊝⊝ | ||
| 107 per 1000 | 39 per 1000 | |||||
| Presence of PIVKA II at day 5: | Study population | RR 1.36 | 61 | ⊕⊕⊝⊝ | ||
| 69 per 1000 | 94 per 1000 | |||||
| Presence of PIVKA II at day 25: | Study population | RR 0.96 | 53 | ⊕⊕⊝⊝ | ||
| 38 per 1000 | 37 per 1000 | |||||
| Necrotizing enterocolitis: | Study population | RR 1.08 | 54 | ⊕⊕⊝⊝ | ||
| 71 per 1000 | 77 per 1000 | |||||
| Sepsis: | Study population | RR 0.86 | 54 | ⊕⊕⊝⊝ | ||
| 179 per 1000 | 154 per 1000 | |||||
| Mortality (all infants): | Study population | RR 2.13 | 65 | ⊕⊕⊝⊝ | ||
| 97 per 1000 | 206 per 1000 | |||||
| *The risk in the intervention group (and its 95% CI) is based on the assumed risk in the comparison group and the relative effect of the intervention (and its 95% CI). | ||||||
| GRADE Working Group grades of evidence | ||||||
| 1We downgraded by two levels due to the small sample size from one included trial. | ||||||
| Outcome or subgroup title | No. of studies | No. of participants | Statistical method | Effect size |
| 1 Bleeding complications Show forest plot | 1 | Risk Ratio (M‐H, Fixed, 95% CI) | Subtotals only | |
| 1.1 0.2 mg IV versus 0.2 mg IM | 1 | 52 | Risk Ratio (M‐H, Fixed, 95% CI) | 7.0 [0.38, 129.11] |
| 1.2 0.2 mg IV versus 0.5 mg IM | 1 | 54 | Risk Ratio (M‐H, Fixed, 95% CI) | 0.81 [0.20, 3.27] |
| 1.3 Any IV Vitamin K (0.2 mg) versus any IM Vitamin K (0.2 mg and 0.5 mg) | 1 | 80 | Risk Ratio (M‐H, Fixed, 95% CI) | 1.56 [0.38, 6.46] |
| 2 Intraventricular hemorrhage > Grade II Show forest plot | 1 | Risk Ratio (M‐H, Fixed, 95% CI) | Subtotals only | |
| 2.1 0.2 mg IV versus 0.2 mg IM | 1 | 52 | Risk Ratio (M‐H, Fixed, 95% CI) | 2.0 [0.19, 20.72] |
| 2.2 0.2 mg IV versus 0.5 mg IM | 1 | 54 | Risk Ratio (M‐H, Fixed, 95% CI) | 0.72 [0.13, 3.96] |
| 2.3 Any IV Vitamin K (0.2 mg) versus any IM Vitamin K (0.2 mg and 0.5 mg) | 1 | 80 | Risk Ratio (M‐H, Fixed, 95% CI) | 1.04 [0.20, 5.31] |
| 3 Presence of PIVKA II at day 5 Show forest plot | 1 | Risk Ratio (M‐H, Fixed, 95% CI) | Subtotals only | |
| 3.1 0.2 mg IV versus 0.2 mg IM | 1 | 60 | Risk Ratio (M‐H, Fixed, 95% CI) | 1.52 [0.37, 6.23] |
| 3.2 0.2 mg IV versus 0.5 mg IM | 1 | 57 | Risk Ratio (M‐H, Fixed, 95% CI) | 2.07 [0.41, 10.43] |
| 3.3 Any IV Vitamin K (0.2 mg) versus any IM Vitamin K (0.2 mg and 0.5 mg) | 1 | 89 | Risk Ratio (M‐H, Fixed, 95% CI) | 1.74 [0.51, 6.00] |
| 4 Presence of PIVKA II at day 25 Show forest plot | 1 | Risk Ratio (M‐H, Fixed, 95% CI) | Subtotals only | |
| 4.1 0.2 mg IV versus 0.2 mg IM | 1 | 52 | Risk Ratio (M‐H, Fixed, 95% CI) | 1.08 [0.07, 16.36] |
| 4.2 0.2 mg IV versus 0.5 mg IM | 1 | 51 | Risk Ratio (M‐H, Fixed, 95% CI) | 1.04 [0.07, 15.74] |
| 4.3 Any IV Vitamin K (0.2 mg) versus any IM Vitamin K (0.2 mg and 0.5 mg) | 1 | 78 | Risk Ratio (M‐H, Fixed, 95% CI) | 1.06 [0.10, 11.15] |
| 5 Prolonged PT at day 5 Show forest plot | 1 | Risk Ratio (M‐H, Fixed, 95% CI) | Subtotals only | |
| 5.1 0.2 mg IV versus 0.2 mg IM | 1 | 63 | Risk Ratio (M‐H, Fixed, 95% CI) | 0.65 [0.24, 1.76] |
| 5.2 0.2 mg IV versus 0.5 mg IM | 1 | 60 | Risk Ratio (M‐H, Fixed, 95% CI) | 0.94 [0.30, 2.90] |
| 5.3 Any IV Vitamin K (0.2 mg) versus any IM Vitamin K (0.2 mg and 0.5 mg) | 1 | 92 | Risk Ratio (M‐H, Fixed, 95% CI) | 0.76 [0.30, 1.93] |
| 6 Vitamin K1 epoxide detected (≥ 10 ng/mL on day 5) Show forest plot | 1 | Risk Ratio (M‐H, Fixed, 95% CI) | Subtotals only | |
| 6.1 0.2 mg IV versus 0.2 mg IM | 1 | 61 | Risk Ratio (M‐H, Fixed, 95% CI) | 9.9 [0.56, 176.29] |
| 6.2 0.2 mg IV versus 0.5 mg IM | 1 | 58 | Risk Ratio (M‐H, Fixed, 95% CI) | 0.57 [0.19, 1.74] |
| 6.3 Any IV Vitamin K (0.2 mg) versus any IM Vitamin K (0.2 mg and 0.5 mg) | 1 | 90 | Risk Ratio (M‐H, Fixed, 95% CI) | 1.20 [0.38, 3.78] |
| 7 Vitamin K1 epoxide detected (≥ 0.3 ng/mL on day 25) Show forest plot | 1 | Risk Ratio (M‐H, Fixed, 95% CI) | Subtotals only | |
| 7.1 0.2 mg IV versus 0.2 mg IM | 1 | 52 | Risk Ratio (M‐H, Fixed, 95% CI) | 0.33 [0.01, 7.82] |
| 7.2 0.2 mg IV versus 0.5 mg IM | 1 | 54 | Risk Ratio (M‐H, Fixed, 95% CI) | 0.12 [0.01, 2.11] |
| 7.3 Any IV Vitamin K (0.2 mg) versus any IM Vitamin K (0.2 mg and 0.5 mg) | 1 | 80 | Risk Ratio (M‐H, Fixed, 95% CI) | 0.19 [0.01, 3.23] |
| 8 Necrotizing enterocolitis Show forest plot | 1 | Risk Ratio (M‐H, Fixed, 95% CI) | Subtotals only | |
| 8.1 0.2 mg IV versus 0.2 mg IM | 1 | 52 | Risk Ratio (M‐H, Fixed, 95% CI) | 1.0 [0.15, 6.57] |
| 8.2 0.2 mg IV versus 0.5 mg IM | 1 | 54 | Risk Ratio (M‐H, Fixed, 95% CI) | 1.08 [0.16, 7.10] |
| 8.3 Any IV Vitamin K (0.2 mg) versus any IM Vitamin K (0.2 mg and 0.5 mg) | 1 | 80 | Risk Ratio (M‐H, Fixed, 95% CI) | 1.04 [0.20, 5.31] |
| 9 Sepsis Show forest plot | 1 | Risk Ratio (M‐H, Fixed, 95% CI) | Subtotals only | |
| 9.1 0.2 mg IV versus 0.2 mg IM | 1 | 52 | Risk Ratio (M‐H, Fixed, 95% CI) | 1.0 [0.28, 3.58] |
| 9.2 0.2 mg IV versus 0.5 mg IM | 1 | 54 | Risk Ratio (M‐H, Fixed, 95% CI) | 0.86 [0.26, 2.86] |
| 9.3 Any IV Vitamin K (0.2 mg) versus any IM Vitamin K (0.2 mg and 0.5 mg) | 1 | 80 | Risk Ratio (M‐H, Fixed, 95% CI) | 0.92 [0.31, 2.72] |
| 10 Mortality (all infants) Show forest plot | 1 | Risk Ratio (M‐H, Fixed, 95% CI) | Subtotals only | |
| 10.1 0.2 mg IV versus 0.2 mg IM | 1 | 67 | Risk Ratio (M‐H, Fixed, 95% CI) | 1.32 [0.56, 3.14] |
| 10.2 0.2 mg IV versus 0.5 mg IM | 1 | 64 | Risk Ratio (M‐H, Fixed, 95% CI) | 2.82 [0.84, 9.46] |
| 10.3 Any IV Vitamin K (0.2 mg) versus any IM Vitamin K (0.2 mg and 0.5 mg) | 1 | 98 | Risk Ratio (M‐H, Fixed, 95% CI) | 1.77 [0.80, 3.93] |
| Outcome or subgroup title | No. of studies | No. of participants | Statistical method | Effect size |
| 1 Bleeding complications Show forest plot | 1 | Risk Ratio (M‐H, Fixed, 95% CI) | Subtotals only | |
| 1.1 0.2 mg IM versus 0.5 mg IM | 1 | 54 | Risk Ratio (M‐H, Fixed, 95% CI) | 0.12 [0.01, 2.11] |
| 2 Intraventricular hemorrhage > Grade II Show forest plot | 1 | Risk Ratio (M‐H, Fixed, 95% CI) | Subtotals only | |
| 2.1 0.2 mg IM versus 0.5 mg IM | 1 | 54 | Risk Ratio (M‐H, Fixed, 95% CI) | 0.36 [0.04, 3.24] |
| 3 Presence of PIVKA II at day 5 Show forest plot | 1 | Risk Ratio (M‐H, Fixed, 95% CI) | Subtotals only | |
| 3.1 0.2 mg IM versus 0.5 mg IM | 1 | 61 | Risk Ratio (M‐H, Fixed, 95% CI) | 1.36 [0.24, 7.57] |
| 4 Presence of PIVKA II at day 25 Show forest plot | 1 | Risk Ratio (M‐H, Fixed, 95% CI) | Subtotals only | |
| 4.1 0.2 mg IM versus 0.5 mg IM | 1 | 53 | Risk Ratio (M‐H, Fixed, 95% CI) | 0.96 [0.06, 14.60] |
| 5 Prolonged PT at day 5 Show forest plot | 1 | Risk Ratio (M‐H, Fixed, 95% CI) | Subtotals only | |
| 5.1 0.2 mg IM versus 0.5 mg IM | 1 | 61 | Risk Ratio (M‐H, Fixed, 95% CI) | 1.45 [0.53, 3.93] |
| 6 Vitamin K1 epoxide detected (≥ 10 ng/mL on day 5) Show forest plot | 1 | Risk Ratio (M‐H, Fixed, 95% CI) | Subtotals only | |
| 6.1 0.2 mg IM versus 0.5 mg IM | 1 | 61 | Risk Ratio (M‐H, Fixed, 95% CI) | 0.06 [0.00, 1.02] |
| 7 Vitamin K1 epoxide detected (≥ 0.3 ng/mL on day 25) Show forest plot | 1 | Risk Ratio (M‐H, Fixed, 95% CI) | Subtotals only | |
| 7.1 0.2 mg IM versus 0.5 mg IM | 1 | 54 | Risk Ratio (M‐H, Fixed, 95% CI) | 0.27 [0.03, 2.25] |
| 8 Necrotizing enterocolitis Show forest plot | 1 | Risk Ratio (M‐H, Fixed, 95% CI) | Subtotals only | |
| 8.1 0.2 mg IM versus 0.5 mg IM | 1 | 54 | Risk Ratio (M‐H, Fixed, 95% CI) | 1.08 [0.16, 7.10] |
| 9 Sepsis Show forest plot | 1 | Risk Ratio (M‐H, Fixed, 95% CI) | Subtotals only | |
| 9.1 0.2 mg IM versus 0.5 mg IM | 1 | 54 | Risk Ratio (M‐H, Fixed, 95% CI) | 0.86 [0.26, 2.86] |
| 10 Mortality (all infants) Show forest plot | 1 | Risk Ratio (M‐H, Fixed, 95% CI) | Subtotals only | |
| 10.1 0.2 mg IM versus 0.5 mg IM | 1 | 65 | Risk Ratio (M‐H, Fixed, 95% CI) | 2.13 [0.60, 7.51] |