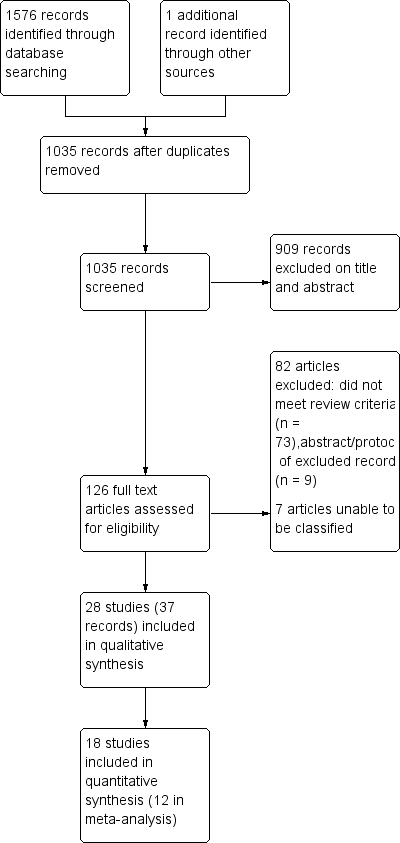
| 1 Number of AECOPDs (long‐term) Show forest plot | 1 | | Mean Difference (IV, Fixed, 95% CI) | Totals not selected |
|
| 1.1 Non‐PEP techniques | 1 | | Mean Difference (IV, Fixed, 95% CI) | 0.0 [0.0, 0.0] |
| 2 Number of AECOPDs (long‐term) Show forest plot | 1 | | Odds Ratio (M‐H, Fixed, 95% CI) | Totals not selected |
|
| 2.1 Non‐PEP techniques | 1 | | Odds Ratio (M‐H, Fixed, 95% CI) | 0.0 [0.0, 0.0] |
| 3 Need for respiratory hospital admission (long‐term) Show forest plot | 1 | | Mean Difference (IV, Fixed, 95% CI) | Totals not selected |
|
| 3.1 Non‐PEP techniques | 1 | | Mean Difference (IV, Fixed, 95% CI) | 0.0 [0.0, 0.0] |
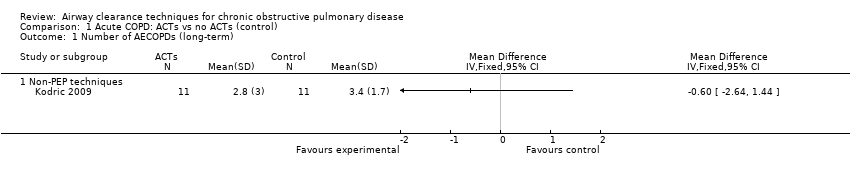
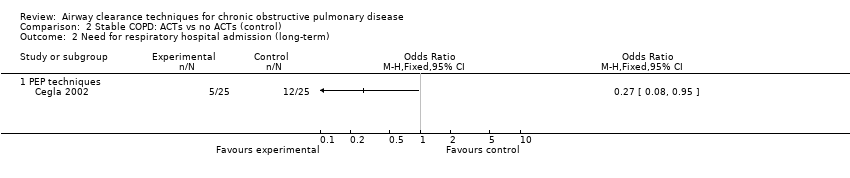
| 4 Need for respiratory hospital admission (long‐term) Show forest plot | 1 | | Odds Ratio (M‐H, Fixed, 95% CI) | Totals not selected |
|
| 4.1 Non‐PEP techniques | 1 | | Odds Ratio (M‐H, Fixed, 95% CI) | 0.0 [0.0, 0.0] |
| 5 Need for increased ventilatory assistance (invasive or non‐invasive) Show forest plot | 4 | 171 | Odds Ratio (M‐H, Fixed, 95% CI) | 0.21 [0.05, 0.85] |
|
| 5.1 PEP techniques | 2 | 60 | Odds Ratio (M‐H, Fixed, 95% CI) | 0.11 [0.01, 0.87] |
| 5.2 Non‐PEP techniques | 2 | 111 | Odds Ratio (M‐H, Fixed, 95% CI) | 0.47 [0.07, 3.36] |
| 6 Duration of ventilatory assistance (days) Show forest plot | 2 | 54 | Mean Difference (IV, Fixed, 95% CI) | ‐2.05 [‐2.60, ‐1.51] |
|
| 6.1 PEP techniques | 1 | 27 | Mean Difference (IV, Fixed, 95% CI) | ‐2.10 [‐2.67, ‐1.53] |
| 6.2 Non‐PEP techniques | 1 | 27 | Mean Difference (IV, Fixed, 95% CI) | ‐1.49 [‐3.49, 0.51] |
| 7 Length of ICU stay (days) Show forest plot | 1 | | Mean Difference (IV, Fixed, 95% CI) | Totals not selected |
|
| 7.1 Non‐PEP techniques | 1 | | Mean Difference (IV, Fixed, 95% CI) | 0.0 [0.0, 0.0] |
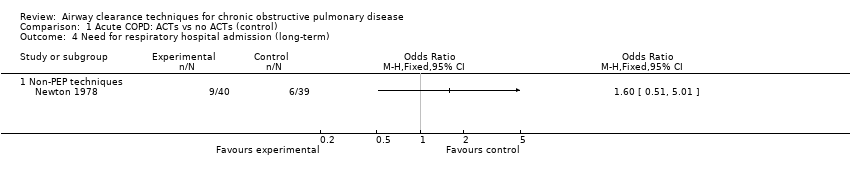
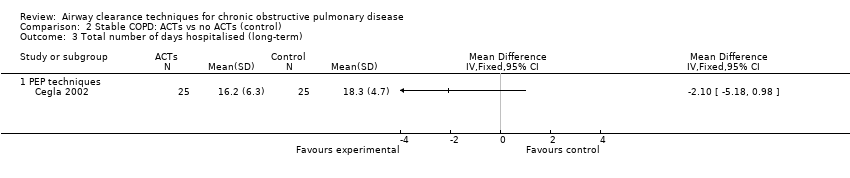
| 8 Length of hospital stay (days) Show forest plot | 3 | 171 | Mean Difference (IV, Fixed, 95% CI) | ‐0.75 [‐1.38, ‐0.11] |
|
| 8.1 PEP techniques | 1 | 33 | Mean Difference (IV, Fixed, 95% CI) | ‐1.10 [‐1.89, ‐0.31] |
| 8.2 Non‐PEP techniques | 2 | 138 | Mean Difference (IV, Fixed, 95% CI) | ‐0.09 [‐1.17, 0.99] |
| 9 QOL ‐ SGRQ total (short‐term) Show forest plot | 1 | | Mean Difference (IV, Fixed, 95% CI) | Totals not selected |
|
| 9.1 Non‐PEP techniques | 1 | | Mean Difference (IV, Fixed, 95% CI) | 0.0 [0.0, 0.0] |
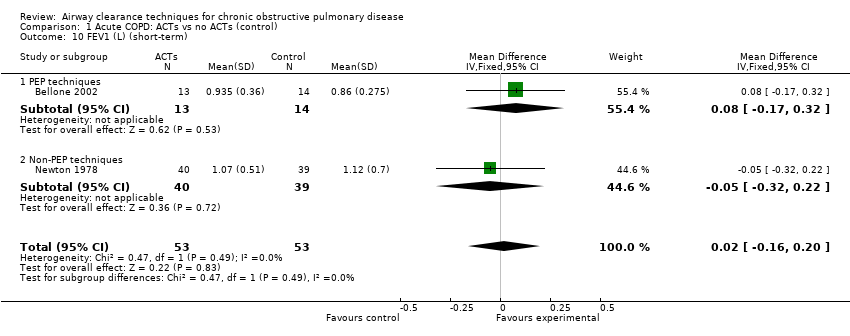
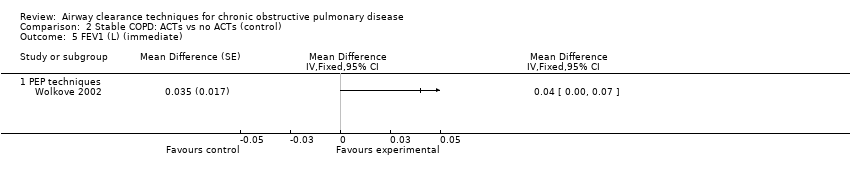
| 10 FEV1 (L) (short‐term) Show forest plot | 2 | 106 | Mean Difference (IV, Fixed, 95% CI) | 0.02 [‐0.16, 0.20] |
|
| 10.1 PEP techniques | 1 | 27 | Mean Difference (IV, Fixed, 95% CI) | 0.08 [‐0.17, 0.32] |
| 10.2 Non‐PEP techniques | 1 | 79 | Mean Difference (IV, Fixed, 95% CI) | ‐0.05 [‐0.32, 0.22] |
| 11 VC (L) (short‐term) Show forest plot | 1 | | Mean Difference (IV, Fixed, 95% CI) | Totals not selected |
|
| 11.1 Non‐PEP techniques | 1 | | Mean Difference (IV, Fixed, 95% CI) | 0.0 [0.0, 0.0] |
| 12 FEV1/FVC (%) (short‐term) Show forest plot | 2 | 86 | Mean Difference (IV, Fixed, 95% CI) | 4.33 [‐1.99, 10.64] |
|
| 12.1 PEP techniques | 1 | 27 | Mean Difference (IV, Fixed, 95% CI) | 1.0 [‐11.37, 13.37] |
| 12.2 Non‐PEP techniques | 1 | 59 | Mean Difference (IV, Fixed, 95% CI) | 5.5 [‐1.85, 12.85] |
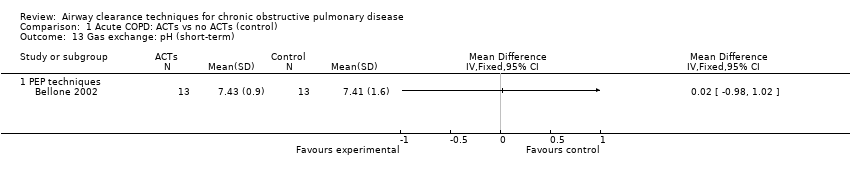
| 13 Gas exchange: pH (short‐term) Show forest plot | 1 | | Mean Difference (IV, Fixed, 95% CI) | Totals not selected |
|
| 13.1 PEP techniques | 1 | | Mean Difference (IV, Fixed, 95% CI) | 0.0 [0.0, 0.0] |
| 14 Gas exchange: PaO2 (mmHg) (short‐term) Show forest plot | 2 | 106 | Mean Difference (IV, Fixed, 95% CI) | ‐0.66 [‐5.02, 3.71] |
|
| 14.1 PEP techniques | 1 | 27 | Mean Difference (IV, Fixed, 95% CI) | 0.80 [‐6.86, 8.46] |
| 14.2 Non‐PEP techniques | 1 | 79 | Mean Difference (IV, Fixed, 95% CI) | ‐1.36 [‐6.67, 3.95] |
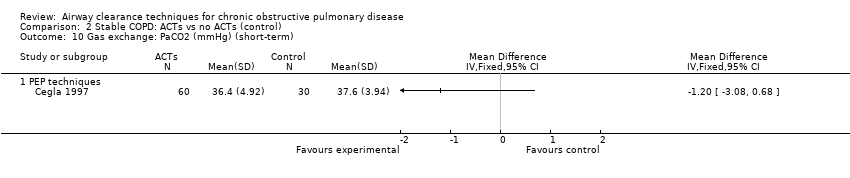
| 15 Gas exchange: PaCO2 (mmHg) (short‐term) Show forest plot | 2 | 105 | Mean Difference (IV, Fixed, 95% CI) | ‐1.10 [‐5.56, 3.37] |
|
| 15.1 PEP techniques | 1 | 26 | Mean Difference (IV, Fixed, 95% CI) | ‐3.80 [‐17.83, 10.23] |
| 15.2 Non‐PEP techniques | 1 | 79 | Mean Difference (IV, Fixed, 95% CI) | ‐0.79 [‐5.50, 3.92] |
| 16 Gas exchange: SpO2 (%) (short‐term) Show forest plot | 1 | | Mean Difference (IV, Fixed, 95% CI) | Totals not selected |
|
| 16.1 Non‐PEP techniques | 1 | | Mean Difference (IV, Fixed, 95% CI) | 0.0 [0.0, 0.0] |
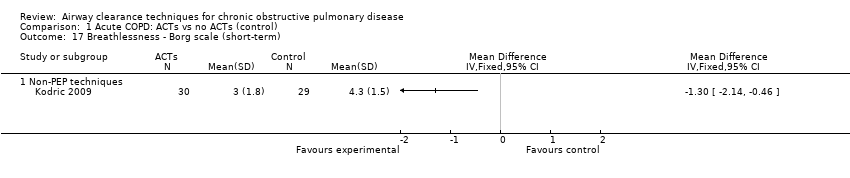
| 17 Breathlessness ‐ Borg scale (short‐term) Show forest plot | 1 | | Mean Difference (IV, Fixed, 95% CI) | Totals not selected |
|
| 17.1 Non‐PEP techniques | 1 | | Mean Difference (IV, Fixed, 95% CI) | 0.0 [0.0, 0.0] |
| 18 Sputum weight, g (immediate) Show forest plot | 1 | | Mean Difference (IV, Fixed, 95% CI) | Totals not selected |
|
| 18.1 PEP techniques | 1 | | Mean Difference (IV, Fixed, 95% CI) | 0.0 [0.0, 0.0] |
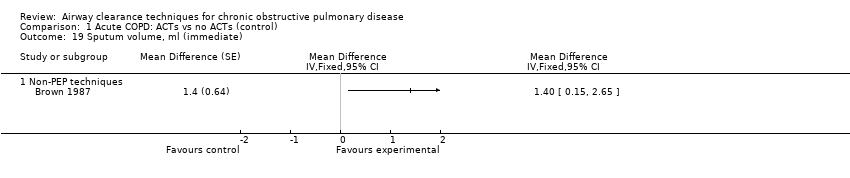
| 19 Sputum volume, ml (immediate) Show forest plot | 1 | | Mean Difference (Fixed, 95% CI) | Totals not selected |
|
| 19.1 Non‐PEP techniques | 1 | | Mean Difference (Fixed, 95% CI) | 0.0 [0.0, 0.0] |
| 20 Sputum volume, ml (24/24) (short‐term) Show forest plot | 2 | 138 | Mean Difference (IV, Fixed, 95% CI) | 0.04 [‐3.73, 3.80] |
|
| 20.1 Non‐PEP techniques | 2 | 138 | Mean Difference (IV, Fixed, 95% CI) | 0.04 [‐3.73, 3.80] |
| 21 Mortality (short‐term) Show forest plot | 4 | 171 | Odds Ratio (M‐H, Fixed, 95% CI) | 0.72 [0.14, 3.80] |
|
| 21.1 PEP techniques | 2 | 60 | Odds Ratio (M‐H, Fixed, 95% CI) | 0.33 [0.01, 8.93] |
| 21.2 Non‐PEP techniques | 2 | 111 | Odds Ratio (M‐H, Fixed, 95% CI) | 1.0 [0.13, 7.45] |
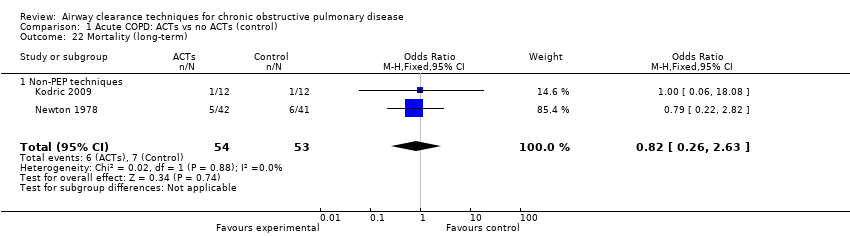
| 22 Mortality (long‐term) Show forest plot | 2 | 107 | Odds Ratio (M‐H, Fixed, 95% CI) | 0.82 [0.26, 2.63] |
|
| 22.1 Non‐PEP techniques | 2 | 107 | Odds Ratio (M‐H, Fixed, 95% CI) | 0.82 [0.26, 2.63] |
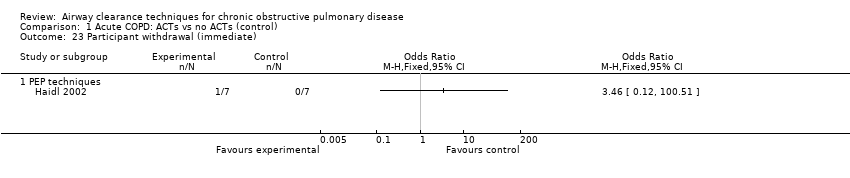
| 23 Participant withdrawal (immediate) Show forest plot | 1 | | Odds Ratio (M‐H, Fixed, 95% CI) | Totals not selected |
|
| 23.1 PEP techniques | 1 | | Odds Ratio (M‐H, Fixed, 95% CI) | 0.0 [0.0, 0.0] |
| 24 Participant withdrawal (short‐term) Show forest plot | 4 | 203 | Odds Ratio (M‐H, Fixed, 95% CI) | 0.55 [0.11, 2.69] |
|
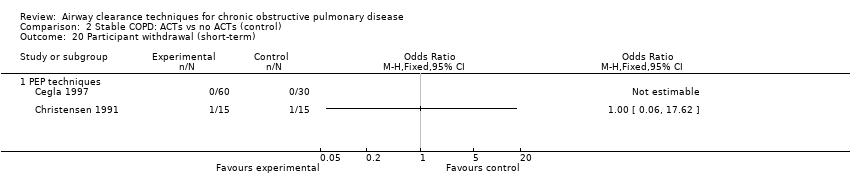
| 24.1 PEP techniques | 2 | 60 | Odds Ratio (M‐H, Fixed, 95% CI) | 0.33 [0.01, 8.93] |
| 24.2 Non‐PEP techniques | 2 | 143 | Odds Ratio (M‐H, Fixed, 95% CI) | 0.65 [0.10, 4.10] |
| 25 Participant withdrawal (long‐term) Show forest plot | 2 | 143 | Odds Ratio (M‐H, Fixed, 95% CI) | 0.87 [0.39, 1.94] |
|
| 25.1 Non‐PEP techniques | 2 | 143 | Odds Ratio (M‐H, Fixed, 95% CI) | 0.87 [0.39, 1.94] |