Psychothérapies versus antidépresseurs, séparément et en combinaison, pour la dépression chez l'enfant et l'adolescent
Résumé scientifique
Contexte
Les troubles dépressifs sont fréquents chez les enfants et les adolescents et, si on ne les traite pas, ils sont susceptibles de se reproduire à l'âge adulte. La dépression est très invalidante, car elle affecte le fonctionnement psychosocial, familial et scolaire.
Objectifs
Évaluer l'efficacité des psychothérapies et des médicaments antidépresseurs, seuls ou en combinaison, pour le traitement des troubles dépressifs chez l'enfant et l'adolescent. Nous avons examiné des résultats cliniques, notamment la rémission, les mesures de la dépression effectuées par le patient et par le clinicien, et des critères relatifs au suicide.
Stratégie de recherche documentaire
Nous avons effectué des recherches dans le registre spécialisé du groupe thématique Cochrane sur la dépression, l'anxiété et la névrose (CCDANCTR) (jusqu'au 11 juin 2014). Ce registre contient des rapports d'essais contrôlés randomisés (ECR) pertinents du registre Cochrane des essais contrôlés (CENTRAL), de MEDLINE (de 1950 à aujourd'hui), d'EMBASE (de 1974 à aujourd'hui) et de PsycINFO (de 1967 à aujourd'hui).
Critères de sélection
Les ECR étaient éligibles à l'inclusion s'ils avaient comparé i) une psychothérapie à un médicament antidépresseur, ou ii) une combinaison de psychothérapie et de médicament antidépresseur à la seule psychothérapie ou au seul médicament antidépresseur, or iii) une combinaison de psychothérapie et de médicament antidépresseur à un placebo ou au traitement habituel, ou (iv) une combinaison de psychothérapie et de médicament antidépresseur à une psychothérapie ou à un médicament antidépresseur plus un placebo.
Nous avons inclus des études si leurs participants avaient entre 6 et 18 ans et avaient été diagnostiqués par un médecin comme souffrant d'un trouble dépressif majeur (TDM) sur la base des critères du Manuel diagnostique et statistique (DSM) ou de la Classification internationale des maladies (ICD).
Recueil et analyse des données
Deux auteurs de la revue ont, de manière indépendante, sélectionné les études, extrait les données et évalué la qualité des études. Nous avons appliqué une méta‐analyse à effets aléatoires, en utilisant le rapport de cotes (RC) pour décrire les critères de résultat dichotomiques, la différence moyenne (DM) pour décrire les critères de résultat continus lorsque les mêmes mesures étaient utilisées, et la différence moyenne standard (DMS) lorsque les résultats avaient été mesurés sur des échelles différentes.
Résultats principaux
Nous avons inclus dans cette revue onze études totalisant 1 307 participants. Nous avons également identifié une étude en cours ainsi que deux études en cours supplémentaires qui pourraient être éligibles pour inclusion. Les études avaient recruté des participants souffrant de troubles de niveaux de gravité différents et avec divers troubles morbides, notamment l'anxiété et la toxicomanie, limitant ainsi la comparabilité des résultats. En ce qui concerne le risque de biais dans les études, l'assignation secrète était satisfaisante dans tout juste la moitié des études (pour les autres il n'y avait pas suffisamment d'informations pour établir l'assignation secrète), les évaluateurs de résultats étaient masqués à l'intervention des participants dans six études et, en général, les études avaient rendu compte incomplètement des méthodes d'analyse des données, utilisant principalement des analyses en intention de traiter. Pour la majorité des critères de résultat il n'y avait pas de différences statistiquement significatives entre les interventions comparées. Il y avait des preuves limitées (sur la base de deux études totalisant 220 participants) qu'immédiatement après l'intervention les médicaments antidépresseurs étaient plus efficaces que la psychothérapie pour les mesures de la rémission définie par le clinicien (rapport de cotes (RC) 0,52 ; intervalle de confiance (IC) à 95 % 0,27 à 0,98), avec 67,8 % des participants dans le groupe à médicaments et de 53,7 % dans le groupe à psychothérapie considérés comme étant en rémission. Il y avait des preuves limitées (sur la base de trois études totalisant 378 participants) que le traitement combiné était plus efficace qu'un médicament antidépresseur seul pour obtenir une plus grande rémission d'un épisode dépressif immédiatement après l'intervention (RC 1,56 ; IC à 95 % 0,98 à 2,47), avec 65,9 % des participants ayant reçu le traitement combiné et 57,8 % de ceux traités avec des médicaments, considérés comme étant en rémission. Sur la base de l'évaluation de la rémission effectuée par le clinicien immédiatement après l'intervention, rien ne suggérait que le traitement combiné avait été plus efficace que la psychothérapie seule (RC 1,82 ; IC à 95 % 0,38 à 8,68).
Les événements indésirables graves liés au suicide étaient rapportés de diverses manières dans les différentes études et n'ont pas pu être combinés dans des méta‐analyses. Toutefois, les pensées suicidaires ont été mesurées dans quelques études à l'aide d'outils d'évaluation standardisés permettant une méta‐analyse. Dans une étude portant sur 188 participants, les taux de pensées suicidaires étaient significativement plus élevés dans le groupe à médicaments antidépresseurs (18,6 %) que dans le groupe à psychothérapie (5,4 %) (RC 0,26 ; IC à 95 % 0,09 à 0,72) et cet effet semblait perdurer après six à neuf mois (RC 0,26 ; IC à 95 % 0,07 à 0,98), avec 13,6 % des participants du groupe à médicaments et 3,9 % des participants du groupe à psychothérapie faisant état de pensées suicidaires. L'effet du traitement combiné sur les taux de pensées suicidaires, en comparaison avec un antidépresseur seul ou une psychothérapie seule, n'était pas clair. L'impact des schémas de traitement sur les sorties d'étude manquait aussi le plus souvent de clarté pour les différentes comparaisons de la revue.
Des données limitées et des résultats contradictoires basés sur d'autres mesures des résultats rendent difficile de tirer des conclusions quant à l'efficacité d'une intervention spécifique sur la base de ces résultats.
Conclusions des auteurs
Les données sur lesquelles baser des conclusions sur l'efficacité relative des interventions psychologiques, des antidépresseurs et de la combinaison de ces interventions, sont très limitées. Les données disponibles ne permettent pas de déterminer l'efficacité de ces interventions pour le traitement des troubles dépressifs chez l'enfant et l'adolescent. D'autres ECR de puissance suffisante seront nécessaires.
PICO
Résumé simplifié
Psychothérapies versus antidépresseurs, séparément et en combinaison, pour la dépression chez l'enfant et l'adolescent
Les troubles dépressifs sont courants chez les enfants et les adolescents, avec des taux de prévalence globaux estimés à 5,7 % pour les adolescents (de 13 à 18 ans) et à 2,8 % pour les enfants (de moins de 13 ans). Les symptômes habituels de la dépression chez l'enfant et l'adolescent sont notamment l'humeur maussade, la perte d'intérêt pour des activités précédemment appréciées, la difficulté à être concentré et motivé, les changements au niveau de l'appétit et du sommeil, l'irritabilité, des symptômes physiques tels que les maux de tête ou d'estomac et, dans certains cas, des pensées suicidaires. S'ils ne sont pas traités, les troubles dépressifs dans les jeunes années sont susceptibles de perdurer à l'âge adulte et risquent de devenir de plus en plus difficiles à traiter au fur et à mesure que le temps passe. La dépression chez l'enfant et l'adolescent peut‐être traitée tant par psychothérapie qu'au moyen d'antidépresseurs. Les psychothérapies, parfois appelées « thérapies par la parole », impliquent de travailler avec un thérapeute qualifié pour traiter la dépression. Les psychothérapies d'usage courant sont la thérapie cognitivo‐comportementale (TCC), la psychothérapie interpersonnelle (PTI) et la thérapie psychodynamique. Il existe de nombreux types différents de médicaments antidépresseurs qui ont tous été développés spécifiquement pour interférer dans le cerveau avec des substances chimiques que l'on croit liées à la dépression. Des recherches ont été menées sur des psychothérapies et des médicaments antidépresseurs, séparément ou en combinaison, pour évaluer les effets de ces interventions sur la dépression chez l'enfant et l'adolescent.
Afin d'évaluer si une des interventions ou une combinaison des deux est plus efficace, nous avons inclus des études ayant comparé : (1) une psychothérapie à un médicament antidépresseur ; (2) une combinaison de ces thérapies (psychothérapie plus médicament antidépresseur) à la seule psychothérapie ou au seul médicament antidépresseur ; (3) une combinaison de ces thérapies (psychothérapie plus médicament antidépresseur) à un placebo ou au traitement habituel ; (4) une combinaison de ces thérapies (psychothérapie plus médicament antidépresseur) à l'une d'entre elles plus un placebo.
Nous avons inclus dans cette revue 11 essais contrôlés randomisés (ECR) impliquant 1 307 participants. Ces essais avaient réalisé toute une variété de comparaisons et, pour chaque comparaison effectuée dans la revue, seul un petit nombre d'essais ont fourni des informations. Bien que la plupart des analyses incluaient plus d'un essai, les résultats de ces essais différaient parfois grandement ou étaient même contradictoires. En termes d'effets indésirables du traitement, dans un essai, les taux de pensées suicidaires étaient plus élevés chez ceux qui prenaient des antidépresseurs que chez ceux bénéficiant d'une psychothérapie. Dans l'ensemble, il n'a pas été possible de tirer de conclusions solides des méta‐analyses, ni d'établir quelle stratégie d'intervention était la plus efficace.
En résumé, sur la base des données disponibles, nous ne savons pas si la psychothérapie, les médicaments antidépresseurs ou une combinaison des deux est plus efficace pour traiter les troubles dépressifs chez l'enfant et l'adolescent.
Authors' conclusions
Background
Description of the condition
As recently as the 1970s, it was widely believed that depressive disorder in young people was very rare (Baker 2006). However, it is now well established that depression is a common disorder in this population. A 2006 meta‐analysis suggested overall prevalence rates for adolescents (13 to 18 years) to be 5.7% and for children (under 13 years) to be 2.8% (Costello 2006), born between 1965 and 1996. Lifetime estimates range between 15% and 20% (Birmaher 1996). Depressive disorder is debilitating and affects psychosocial, family and academic functioning (Lewinsohn 1998). Major depressive disorder (MDD) is one of the leading causes of disability, morbidity and mortality (WHO 2008) and is a major risk factor for suicide. Children and adolescents with MDD are seven times more likely to complete suicide than those without (Gould 1998). Furthermore, approximately 70% of adolescents with MDD will relapse within five years, and adolescents who experience depression are four times more likely to develop a depressive disorder in adulthood compared to adolescents who do not suffer from depression (Richmond 2005). Early onset depression is also associated with treatment resistant depression later in life (Hatcher‐Kay 2003).
Diagnostic criteria for depressive disorders are essentially the same for adults and children, although specific signs and symptoms may differ in children and adolescents. In adults, a diagnosis is reached through a consultation between the patient and the clinician, while for children and adolescents a diagnosis is often made using information from multiple sources including parents, teachers, counsellors, healthcare professionals, as well as the child or young person themselves (Emslie 2005). Compared with adults, depressed children and adolescents may exhibit higher levels of anxiety and irritability, ‘temper tantrums’, behavioural problems, social withdrawal, phobias, and exaggerated somatic symptoms. Symptoms of melancholia, psychosis, suicide attempts, lethality of suicide attempt, and impairment of functioning appear to increase with age (Birmaher 1996), and it has been established that treatments are not uniformly effective across age groups (Emslie 2005).
Description of the intervention
A number of psychological therapies have been trialed as a treatment for MDD in children and adolescents. Cognitive behavioural therapy (CBT) has been the most widely studied, and trials have also been conducted into the effectiveness of interpersonal therapy (IPT), behaviour therapy, and problem‐solving therapy. A recent systematic review (Watanabe 2007) indicated that overall, psychotherapy was more effective than control comparisons immediately post‐intervention, although this benefit was no longer evident at six months and 12 months follow‐up. Subgroup analysis suggested that psychotherapy might be more effective than control for adolescents (13 to 19 years) but not for younger children (six to 12 years), and might be more beneficial than wait‐list control, but no more effective than attention/placebo.
The majority of guidelines on the treatment of depressive disorders in young people recommend the judicious use of medication, specifically selective serotonin reuptake inhibitors (SSRIs), in the context of careful monitoring of symptoms and side effects (AACAP 2007; Cheung 2008a; NICE 2005; Zuckerbrot 2007). The SSRI for which there is the most consistent evidence of a statistically significant reduction in depressive symptoms compared with placebo is fluoxetine (Hetrick 2007; Richmond 2005; Whittington 2004). The Committee on the Safety of Medicines (CSM) (CSM 2004) and the Food and Drug Administration (FDA) (FDA 2004) recommend it as the preferred SSRI for use in young people, and the National Institute for Health and Clinical Excellence (NICE) guidelines state specifically that fluoxetine should be the first antidepressant medication option (NICE 2005).
How the intervention might work
In psychological therapies the aim is to build a relationship with the client through a structured and purposeful encounter, and although a range of specific techniques are employed, life issues and problems can be discussed and addressed. Just as there are many approaches to psychological therapies, the assumed mechanism of action for each varies. However, common to most is the aim to increase awareness, with the implicit or explicit aim of changing thoughts, behaviours or emotions to improve the mental health well‐being of the client.
Antidepressant medications are postulated to work via their effect on neurotransmitters. Each type of medication has a slightly different effect on various neurotransmitters. For example, tricyclic antidepressants (TCAs) prevent the reuptake by nerve cells of the neurotransmitters norepinephrine (noradrenaline), serotonin (5‐hydroxytryptimine, or 5‐HT) and to a lesser extent, dopamine. SSRIs block the reuptake of serotonin into the presynaptic (brain) cell, increasing the level of serotonin available to bind to the postsynaptic receptor. SSRIs also affect the neurotransmitters norepinephrine and dopamine. Newer antidepressants such as serotonin‐norepinephrine reuptake inhibitors (SNRIs), work on both norepinephrine as well as serotonin reuptake processes.
Why it is important to do this review
Given the prevalence and impact of depressive disorders in children and adolescents, it is essential that effective interventions are identified and implemented. A number of randomised controlled trials (RCTs) are available to guide treatment decisions for adult depressive disorder, but the evidence‐base for the treatment of child and adolescent depressive disorder is much less established. Nevertheless, an increasing number of RCTs of psychological interventions and antidepressant medications are being undertaken in this population, and several Cochrane reviews of treatments for depressive disorders in children and adolescents are already available or underway (Hazell 2002; Hetrick 2007; Watanabe 2004).
Findings from RCTs have suggested that some psychological therapies might be more effective than a variety of control comparators. Cognitive behavioural therapy (CBT) has been shown to be more effective than wait‐list control (Lewinsohn 1990; Stark 1987), 'no treatment' (Weisz 1997) and life‐skills tutoring (Rhode 2004). Trial data also indicate the efficacy of cognitive therapy (CT), behavioural therapy (BT), interpersonal therapy (IPT) and problem‐solving therapy when compared to delayed treatment (Ackerson 1998), wait‐list control (Kahn 1990; Stark 1987), clinical monitoring only (Mufson 1999) and 'treatment as usual' (Mufson 2004).
Trials and reviews conducted into the effectiveness of antidepressant medication in this population have been mixed. Tricyclic antidepressants (TCAs) have been reported to be ineffective for depression in children and adolescents (Hazell 2002; Papanikolaou 2006; Weller 2000). Although there is evidence that selective serotonin reuptake inhibitors (SSRIs) might be more effective than placebo in this population (Papanikolaou 2006), high dropout rates, inappropriate outcome measurements, and various potential reporting biases, mean that these findings should be viewed with great caution (Dubicka 2006; Hetrick 2007; Whittington 2004). In addition, a recent review compared all classes of antidepressant medications with placebo (Tsapakis 2008) and meta‐regression analyses indicated no evidence to support the hypothesis that SSRIs were more effective than TCAs. The lack of robust evidence for the effectiveness of medication continues to stimulate the debate around its use in treating depression in children and adolescents (Goodyer 2010; Hetrick 2010).
In the context of the FDA 'black box' warning on SSRIs about the increased risk of self injurious ideations and behaviour of young people on SSRIs (FDA 2004), some guidelines recommend initial intervention using psychological therapies, for depressive disorders of mild to moderate severity (NICE 2005). Medication is reserved for more severe disorders and the recommendations highlight that, when used, antidepressant medication should be used in conjunction with ongoing psychological intervention (NICE 2005). Two major studies have investigated this approach; the Treatment for Adolescents with Depression Study (TADS) (March 2004) and Adolescent Depression Antidepressant and Psychotherapy (ADAPT) (Goodyer 2007). In ADAPT, the addition of CBT to fluoxetine plus standard care did not appear to improve outcomes compared to fluoxetine plus standard care Goodyer 2007. In TADS, fluoxetine alone was superior to CBT alone, and the combination of fluoxetine and CBT was statistically significantly better than either alone in the short‐term (March 2004). A recent meta‐analysis of trials in adult populations found no difference in efficacy between psychological therapies and antidepressant medication (Bortolotti 2008). Data from the adult literature also suggest that combination therapy is superior to antidepressant medication alone (Pampallona 2004) and psychotherapy alone (de Maat 2007).
The recommendations for treatment of depressive disorders in children and adolescents exist in the context of relatively little high quality research, and there have been calls for large, well conducted studies to be undertaken (Hetrick 2007; NICE 2005). A Cochrane review is timely in providing a review of evidence to date, examining the potential benefits and harms of psychological therapies, antidepressant medication and their combination for child and adolescent depressive disorders, and findings could inform the design and conduct of future trials.
Objectives
-
To determine the effectiveness of psychological therapies compared with antidepressant medication for treating depressive disorders in children and adolescents.
-
To determine the effectiveness of a combination of psychological therapy and antidepressant medication compared with antidepressant medication alone for treating depressive disorders in children and adolescents.
-
To determine the effectiveness of a combination of psychological therapy and antidepressant medication compared with psychological therapy alone for treating depressive disorders in children and adolescents.
-
To determine whether the effectiveness of these interventions differs between children and adolescents.
-
To determine whether the effectiveness of these interventions differs according to the severity of depressive disorder.
-
To determine whether there is an increased risk of suicide‐related outcomes in children and adolescents treated with antidepressant medication alone, compared with psychological therapy alone, or a combination of treatments.
We added the final objective (6) to the review following the publication of the protocol. Given the concern that antidepressant medication may increase suicide‐related behaviour in children and adolescents, we felt it was important to assess the degree of suicide‐related behaviour related to antidepressant medication.
Methods
Criteria for considering studies for this review
Types of studies
We included published and unpublished RCTs, available in any language, that compared antidepressant medications, psychological therapies or their combination. We did not include quasi‐RCTs, or cross‐over trials. We included cluster‐RCTs and cross‐over trials as a post hoc amendment and we will consider them for inclusion in the update of the review.
Types of participants
We included children (six to 12 years) and adolescents (13 to 18 years) with a primary diagnosis of depressive disorder, diagnosed by a clinician using Diagnostic and Statistical Manual (DSM) or International Classification of Diseases (ICD) categories (APA 2000; WHO 2007). We excluded studies including adults.
While subsyndromal depression can still have a severe impact on an individuals’ social and educational functioning, because of heterogeneity, and because of the lack of data on this group, we did not include studies of participants with subthreshold depressive disorder, or studies where depressive disorder was not formally diagnosed.
Comorbid conditions are frequently neglected in reviews. We aimed to include studies where participants had comorbid secondary medical or other mental health conditions, including suicidal behaviours. It is often difficult to deduce which mental health condition is deemed primary in clinical practice, and trial authors did not give information regarding 'primary' or 'secondary' diagnoses as such. Thus, we included trials where all participants were diagnosed with depressive disorder regardless of the accompanying severity of the comorbid diagnosis.
Types of interventions
We included trials if they compared:
-
any psychological therapy with any antidepressant medication;
-
a combination of interventions (psychological therapy plus antidepressant medication) with either psychological therapies or antidepressant medication alone;
-
a combination of interventions (psychological therapy plus antidepressant medication) compared with either intervention (psychological therapy or antidepressants) plus a placebo; and
-
a combination of interventions (psychological therapy plus antidepressant medication) with a placebo or'treatment as usual'.
Psychological therapies
-
Cognitive behavioural therapy (CBT) uses cognitive restructuring training and teaching behavioural changes.
-
Behavioural therapy (BT) focuses attention on increasing access to pleasant events and positive reinforcers through the use of activity scheduling and social skills development.
-
Mindfulness training is a common feature of the newer 'third wave' CBT interventions and involves concentrating on and attending to, without judgement, whatever is being experienced at the time of intervention.
-
Cognitive therapy (CT) uses cognitive restructuring training.
-
Interpersonal therapy (IPT), whereby the relationship between mood and relationship problems is explored and the focus is on improving relationship skills.
-
Problem‐solving therapy (PST), focuses on current problems faced by the participant with evaluation and subsequent development of solutions to such problems.
-
Play therapy (PT) refers to techniques used to engage participants in activities, such as playing, listening to music, or outdoor activities, to assist them in coping and dealing with their problems. It often has psychodynamic underpinnings (Lebo 1958).
-
Humanistic therapy (HT) can be described as 'supportive' therapy, and offers an empathic, non‐directive and non‐judgemental approach, based on client‐centred principles.
-
Psychodynamic therapy (PDT) is where the therapeutic relationship is used to explore and resolve unconscious conflict through the use of interpretation and transference.
In order to simplify and reduce the number of categories, we aimed to group these therapies into four broader groups, based on their theoretical underpinning. The categories are as follows.
-
CBT (including BT, CT, PST as well as mindfulness training and other third wave psychotherapies).
-
Integrative therapy (including IPT and cognitive analytic therapy).
-
Humanistic therapy (including interventions described as supportive therapy).
-
Psychodynamic therapy (including play therapy).
Antidepressant medications
-
Selective serotonin reuptake inhibitors (SSRIs).
-
Selective serotonin‐norepinephrine reuptake inhibitors (SNRIs).
-
Noradrenergic and specific serotonin antidepressants (NaSSAs).
-
Norepinephrine (noradrenaline) reuptake inhibitors (NRIs).
-
Norepinephrine‐dopamine reuptake inhibitors (NDRIs).
-
Selective serotonin reuptake enhancers (SSREs).
-
Monoamine oxidase inhibitors (MAOIs).
-
Tricyclic antidepressants (TCAs).
Given the potentially variable effects of different psychological therapies and antidepressant medications, we intended to conduct subgroup analyses where possible for the (aforementioned) psychological therapy categories and antidepressant medication classes listed above.
Combination interventions
We included combination interventions where antidepressant medication (of any class described above) was combined with psychological therapy (of any type described above).
'Treatment as usual' and placebo comparison groups
The 'treatment as usual' condition that was eligible for inclusion was standard care. We also planned to include wait‐list control as a comparison condition, however there were no instances where this comparison was used.
Participants in 'treatment as usual' arms of studies may have been receiving a psychological therapy, taking antidepressant drugs naturalistically, or both. For this reason, it was our intention to obtain as much information as possible from the authors regarding the details of participants’ 'treatment as usual'. Similarly, if details of the placebo control were not specified, we sought this information. Where possible, information on 'treatment as usual' and placebo control conditions was described and reported in conjunction with statistical analyses, as we believe variability in 'treatment as usual' groups may lead to unclear and potentially misleading results.
Follow‐up
We searched for studies that examined acute effects of treatment with at least pre‐ and post‐intervention assessments, and, where data were available, for longer‐term follow‐up (maximum of up to 12 months).
We also included trials where there was an a priori plan for ongoing treatment and follow‐up, as well as those where there was no a priori plan, but in which there was a post‐acute, naturalistic follow‐up phase. We endeavoured to obtain as much information as possible about the treatments that were received by participants in the studies with naturalistic follow‐up. Where planned post‐acute phase treatments (continuation or maintenance phase) took place, such as formal booster sessions or augmentations, we documented the treatment.
Types of outcome measures
Primary outcomes
-
Remission from depressive disorder according to a clinical interview by a mental health professional, using DSM (APA 2000) or ICD (WHO 2007) criteria (dichotomous) for full remission (eight weeks asymptomatic or free from any significant mood symptoms respectively). Computerised diagnostic assessments such as the computerised Diagnostic Interview Schedule for Children (C‐DISC) could also be included.
-
Acceptability of treatment measured by number of dropouts for any reason.
-
Suicide‐related serious adverse events (SAEs). Any suicide‐related SAE, encompassing ideation, attempted suicide including acts with unknown intent was recorded. However, due to the diversity of tools in which these data were presented, we did not combine them in a meta‐analysis.
Secondary outcomes
-
Suicide‐related outcomes; we considered these as both a dichotomous and continuous outcome. For the dichotomous outcome, we extracted the number of participants with suicidal ideation, as measured on a standardised, validated reliable scale such as the Suicidal Ideation Questionnaire‐Junior High School version (SIQ‐JR; Reynolds 1987). For the continuous outcome, we also extracted suicidal ideation, measured on a standardised, validated measure such as the SIQ‐JR.
-
Remission, defined by a cut‐off or percentage improvement on measures such as the Children's Depression Rating Scale‐Revised (CDRS‐R) (Poznanski 1996), Montgomery‐Åsberg Depression Rating Scale (MADRS) (Montgomery 1979), Kiddie Schedule for Affective Disorders and Schizophrenia for School‐Age Children‐Present Episode Version (K‐SADS‐P) (Brooks 2001), or the Hamilton Depression Rating Scale (HAM‐D) (Hamilton 1960).
-
Improvement in depressive symptoms on clinician rated and self rated symptom measures (standardised, validated, reliable scales such as the CDRS‐R, MADRS, K‐SADS‐P, and HAM‐D).
-
Level of function measured on clinician rated measures of general functioning, such as the Global Assessment of Functioning (GAF; Hilsenroth 2000) and the Children's Global Assessment Scale (C‐GAS; Shaffer 1983).
-
Number of dropouts due to at least one adverse effect.
Hetrick 2007 provided a list of measures used in the studies that were included in their SSRI review. It was reasonable to assume the measures used in the current review would be similar to those commonly used in SSRI trials. Presented below is a brief overview of some of these scales.
The CDRS‐R is a 17‐item clinician interview‐based tool to diagnose and establish severity of depression in six to 12 year olds. The first 14 questions are based on response from the child or a parent or guardian closely related to the child. The final three questions are rated by the clinician based on non‐verbal observations. Questions are rated on a five or seven‐point scale and a final score is produced by summation of all 17 items (range 17 to 113). This scale has well documented psychometric properties and has shown adequate to high reliability and validity across multiple studies (Brooks 2001).
The MADRS is a 10‐item clinician rated scale assessing depressive symptoms from the past three or seven days. Each item is scored on a fixed seven‐point scale with a total score ranging from 0 to 60. Psychometric properties for adolescent depression treatment outcomes have yet to be established (Jain 2007).
The K‐SADS‐P contains a nine‐item depression module completed by the clinician on the basis of interview. Four of these items contain two subgroups, each with three questions. A final score can range from 9 to 56. It covers symptoms from the previous two weeks and specifically assesses symptoms against the Diagnostic and Statistical Manual for Mental Disorders (DSM; IIIR and IV) (Brooks 2001). The depression module shows high inter‐rater reliability (Kaufman 1997).
The HAM‐D is a clinician rated scale and contains 17 variables measured on a scale of between zero and two or four (Hamilton 1960). Not all items contain objective criteria for the interviewer and he or she must use subjective judgement to differentiate responses as “mild”, “moderate”, or “severe” (Brooks 2001). Items target depressive symptoms from the previous week. This scale shows excellent reliability (Myers 2002).
The SIQ‐JR is a 15‐item self report scale designed to assess the presence of suicidal ideation in school‐aged adolescents.
The GAF is a robust measure of social and general functioning that exists as the Axis‐V of the DSM IV.
The C‐GAS is an amended version of the GAF for children and adolescents under the age of 18 years. It too has a scale of 1 to 100, with 10 levels of functioning, each numeric interval of 10.
If several scales were used to measure the same outcome in a trial, we chose the measure most commonly used across trials.
We analysed both short‐ and long‐term outcomes, including post‐treatment and follow‐up data. We undertook follow‐up examination to show if there were (a) treatments that provide short‐term benefits in terms of response or remission; (b) treatments that provide short‐term benefits that remain over long‐term follow‐up; and (c) treatments that do not show short‐term improvement, however, where the participants’ condition improves over time (delayed treatment onset). We defined ‘long‐term’ in the current review as greater than six months post‐intervention. Due to the variability in long‐term follow‐up points, and the fact that some studies assessed outcomes at multiple follow‐up time points, we subcategorised follow‐up data into those that were measured between six and nine months from baseline, and those that were measured at 12 months. This allowed us to included multiple data from single studies in order to assess the time course of depressive symptoms and remission rates more stringently.
Search methods for identification of studies
Electronic searches
CCDAN's Specialised Register (CCDANCTR)
The Cochrane Depression, Anxiety and Neurosis Group (CCDAN) maintain two clinical trials registers at their editorial base in Bristol, UK; a references register and a studies‐based register. The CCDANCTR‐References Register contains over 35,000 reports of RCTs for depression, anxiety and neurosis. Approximately 60% of these references have been tagged to individual, coded trials. The coded trials are held in the CCDANCTR‐Studies Register and records are linked between the two registers through the use of unique study ID tags. Coding of trials is based on the EU‐Psi coding manual. (Please contact the CCDAN Trials Search Co‐ordinator for further details). Reports of trials for inclusion in the Group's registers are collated from routine (weekly), generic searches of MEDLINE (1950‐), EMBASE (1974‐) and PsycINFO (1967‐); quarterly searches of the Cochrane Central Register of Controlled Trials (CENTRAL) and review specific searches of additional databases. Reports of trials are also sourced from international trials registers c/o the World Health Organization’s trials portal (ICTRP), drug companies, the handsearching of key journals, conference proceedings and other (non‐Cochrane) systematic reviews and meta‐analyses.
Details of CCDAN's generic search strategies can be found on the Group‘s website.
The CCDANCTR (Studies and References Register) was searched to 11 June 2014 using a sensitive list of terms for antidepressive agents, psychotherapies and children/adolescents (Appendix 1).
Earlier searches of the CCDANCTR, MEDLINE, EMBASE and PsycINFO, conducted for the first version of this review, can be found in Appendix 2
Searching other resources
Reference list
We checked the reference lists of all included trials retrieved from the searches to identify additional published or unpublished research.
Personal communication
We contacted the authors of all included studies and recognised experts in the field to ensure no study was missed (published or unpublished).
Data collection and analysis
Selection of studies
At least three review authors (out of RC, PC, SH and GC) independently conducted the screening process of titles and abstracts. We noted the trials that appeared to fulfil the selection criterion and subsequently retrieved the full articles. The same review authors assessed full articles for adherence to selection criteria. We have provided justification for exclusion of trials for which full copies were retrieved. To be included in the initial screen, references had to pass the following simple criteria.
-
It had to be a RCT.
-
Include participants with a diagnosis of a depressive disorder using DSM or ICD criteria (as diagnosed by a clinician).
-
At a minimum, compare an antidepressant medication with a psychological therapy.
If discrepancies arose, we reached consensus through discussion, with the aid of a fourth review author, if needed.
Data extraction and management
At least two review authors (out of PC, GC, SH and KSW) independently extracted primary and secondary outcome‐related data from full articles and recorded data on hard copy data collection forms. When disagreement arose, consensus was reached following discussion, with the aid of a third review author (SH or RC), where necessary. Where required data were not present or were in a form that was not compatible with our meta‐analysis, we attempted to contact the authors to obtain or clarify data.
Main comparisons made in the review.
-
Psychological therapies alone versus antidepressant medication alone.
-
Combination therapy versus psychological therapies alone.
-
Combination therapy versus antidepressant medication alone.
-
Combination therapy versus psychological therapies plus pill placebo.
A further two comparisons were possible given the inclusion criteria (although no data were available for these comparisons).
-
Combination therapy versus antidepressant medication plus psychosocial/attention only placebo.
-
Combination therapy versus 'treatment as usual'.
Assessment of risk of bias in included studies
At least two independent review authors (PC, GC, SH and KSW) conducted 'Risk of bias' assessment based on Chapter 8 of the Cochrane Handbook for Systematic Reviews of Interventions (Higgins 2011). We discussed discrepancies in rating and reached consensus, with the aid of a third review author (SH) where necessary. We assessed risk of bias as "low risk", "unclear risk", or "high risk", in accordance with the updated guidance and software from The Cochrane Collaboration for the following domains.
-
Sequence Generation.
-
Allocation concealment.
-
Blinding of participants, personnel, and outcome assessors.
-
Incomplete outcome data.
-
Selective outcome reporting.
-
Other sources of bias.
We included all studies meeting the inclusion criteria, regardless of the outcome of the assessment of risk of bias.
Measures of treatment effect
We entered data from collection forms into Review Manager 5 (RevMan 2011). We calculated odds ratios (ORs) with 95% confidence intervals (CIs) for dichotomous outcomes such as remission, and suicide‐related outcomes. With regards to continuous scales, there were many types of depression measures utilised in trials and therefore we used the standardised mean difference (SMD) with 95% CIs to calculate treatment effects in comparisons containing different assessment scales. In some cases, the same scales were used across studies, and on these occasions, we used the mean difference (MD).
Unit of analysis issues
Where a study had more than one active treatment arm, we extracted data from the appropriate arm for each of our main comparisons.
For future updates where we will consider including cluster‐RCTs and cross‐over RCTS, given the potential for carry‐over affects, particularly for psychological interventions, we will only include the first phase of data from cross‐over trials in any analysis.
For studies using a clustered randomisation method, if not reported, we will contact trial authors to obtain the intracluster correlation coefficient (ICC) for the sample. If we are unable to obtain this information from the authors, we will use an ICC estimate based on the average of the ICCs obtained from the other studies included in the analysis, or if necessary from relevant external studies. We will then adjust the study population numbers to take into account the effect of the clustering. We will undertake sensitivity analysis to check the robustness of the data, and to make decisions about which ICC adjustment to include in the data.
Dealing with missing data
Missing statistics
We obtained missing data from trial authors wherever possible.
In some cases, dichotomous outcomes such as remission rates, were reported as percentages (Bernstein 2000; Clarke 2005). We converted these percentages into dichotomous outcomes using information regarding the total (N) in the analysis reported in the publication. Where applicable, we contacted authors to confirm we had calculated the raw numerator and denominator correctly.
In one case (Riggs 2007), only the standard error was reported for continuous outcome measures. We calculated the standard deviation for each group mean based on the sample size and standard error and have documented this as appropriate.
Missing participants
For continuous outcomes, if available, we extracted intention‐to‐treat (ITT) data and noted the method used for imputing missing data in the 'Risk of bias' table for each individual trial.
For remission by clinical interview, data were often reported for 'observed cases' (OC) only (Melvin 2006; TADS 2004). In this case we used the numbers randomised in an ITT analysis (making the assumption that those who dropped out did not improve) and compared this with an analysis based on the OC data provided as a sensitivity analysis. In one case (Clarke 2005), remission rates based on a cut‐off score were reported based on an ITT analysis. This study was the only one that contributed data to the comparison, and we included these data.
Assessment of heterogeneity
We assessed heterogeneity on the basis of the Handbook's recommendations (I2 values of 0 to 40%: might not be important; 30% to 60%: may represent moderate heterogeneity; 50% to 90%: may represent substantial heterogeneity; and 75% to 100%: represents considerable heterogeneity). Because the importance of the observed I2 statistic depends on (i) magnitude and direction of effects and (ii) strength of evidence for heterogeneity, in addition to the I2 value (Higgins 2003), we have presented the χ2 and its P value and have considered the direction and magnitude of the treatment effects in assessing heterogeneity. Because the χ2 test is underpowered to detect heterogeneity in meta‐analysis that includes only a few studies, a P value of 0.10 is used as a threshold of statistical significance.
Assessment of reporting biases
We had planned to assess small study effects and potential publication bias using a funnel plot if 10 or more studies were included in the meta‐analysis, however, given we had so few trials we did not do this. We assessed selective reporting of outcomes using the 'Risk of bias' tool and have reported this in the 'Risk of bias' tables.
Data synthesis
For all meta‐analyses, we used a random‐effects model (der Simonian 1986). The random‐effects method incorporates an assumption that the different studies are estimating different, yet related, intervention effects, (which we were anticipating, particularly given the inclusion of different psychotherapy and medication interventions).
Subgroup analysis and investigation of heterogeneity
It was our intention to conduct separate analyses on the subgroups below.
-
Children (six to 12 years) and adolescents (13 to 19 years).
-
Severity of illness (severe, moderate, or mild).
Sensitivity analysis
We intended to conduct the sensitivity analyses below to investigate the effect that different statistical analyses may have exerted on the effect size.
-
Using observed case (OC) data (excluding studies which use Last Observation Carried Forward (LOCF)).
-
Excluding trials with 'no' or 'unclear' ratings for allocation concealment.
Timeline
We will update this review in accordance with Cochrane Collaboration guidelines for updating.
Results
Description of studies
Results of the search
In the first version of this review (published 2012), we retrieved 10,413 references from electronic searches to April 2011 (Appendix 2). One review author (PC) screened the titles and abstracts of these references against inclusion and exclusion criteria. Of these, we retained 89 and retrieved the full‐text of each study. Two authors (PC and SH) screened the full‐text of 89 references. We included, excluded and consolidated references into studies. We included a total of nine studies in the review.
We conducted an update search on the CCDANCTR (11 November 2011), retrieving 428 references. Two authors (PC and GC) screened these references and retrieved the full‐text papers for 18 references, of which we included one in the review. We screened a total of 10,841 references, from which we retrieved 51 full‐text articles, and included ten studies in the analyses.
For this update (2014), the search of the CCDANCTR retrieved 331 references (November 2011 to June 2014). The Trials Search Co‐ordinator of the Cochrane Depression, Anxiety and Neurosis group screened the titles and abstracts of these references against inclusion and exclusion criteria. Of these, 29 records were retained and full‐text articles retrieved and screened for eligibility (this was done by GC, SH and RC). Details of the selection process can be seen in the PRISMA flowchart (Figure 1).
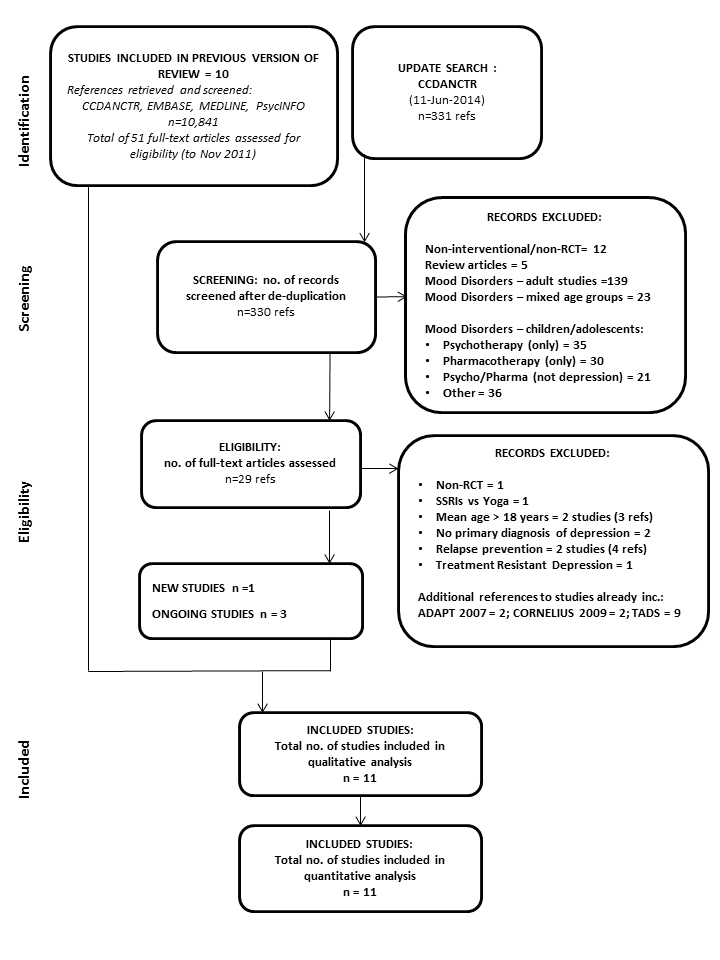
PRISMA flow diagram: CCDANCTR update search June 2014
From the update search we included one new study (Kim 2012) and added three ongoing studies (Craighead 2012; Gunlicks‐Stoessel 2013 a; Gunlicks‐Stoessel 2013 b). On the basis of the information available, it was not clear whether the latter two studies will fulfill the inclusion criteria for this review. Details of a further ongoing study already known to us (Davey 2012) have also been added.
Additional references were also retrieved for the following included studies:ADAPT 2007, Cornelius 2009 and TADS 2004, but only two new reports of Cornelius 2009 were added to the list of references.
Included studies
Eight of the eleven trials were undertaken in the USA (Bernstein 2000; Clarke 2005; Cornelius 2009; Deas 2000; Mandoki 1997; Riggs 2007; TADS 2004; TASA 2009); one in the UK (ADAPT 2007), one in Australia (Melvin 2006) and one in South Korea (Kim 2012). There were eight trials of selective serotonin reuptake inhibitors (SSRIs) (ADAPT 2007; Clarke 2005; Cornelius 2009; Deas 2000; Melvin 2006; Riggs 2007; TADS 2004; TASA 2009), one of a tricyclic antidepressant (TCA) (Bernstein 2000), one of a serotonin‐norepinephrine reuptake inhibitor (SNRI) (Mandoki 1997) and one of a norepinephrine‐dopamine reuptake inhibitors (NDRI) (Kim 2012). The majority of trials contained two comparison arms, two trials contained three arms (Melvin 2006; TASA 2009) and one contained four comparison arms (TADS 2004). The TADS 2004 trial implemented a placebo arm for the first stage of intervention (up to 12 weeks), after which the placebo group were unblinded to condition, and offered an alternative treatment. As a result, all follow‐up data after 12 weeks are based on three comparison conditions.
Five trials compared combination therapy to psychological therapies with placebo medication (Bernstein 2000; Cornelius 2009; Deas 2000; Mandoki 1997; Riggs 2007); five trials compared combination therapies to antidepressant medication alone (ADAPT 2007; Melvin 2006; TADS 2004; TASA 2009; Kim 2012); one trial compared combination therapy to a placebo condition (TADS 2004) and one compared combination therapy to 'treatment as usual', involving routine medication of SSRIs (Clarke 2005). In the three trials with more than two comparison arms, psychological therapy alone was compared to antidepressant medication alone and a combination of medication and psychological therapy (Melvin 2006; TADS 2004; TASA 2009).
Therefore for objective one there were three trials that had relevant psychological therapy alone and medication alone arms (Melvin 2006; TADS 2004; TASA 2009), although TASA 2009 did not contribute any data. For objective two there were five trials that included a combination therapy and medication alone arms (ADAPT 2007; Clarke 2005; Melvin 2006; TADS 2004; Kim 2012), each of which contributed some data to some outcomes. For objective three, two studies included combination therapy and psychological therapy alone arms, and both contributed data (Melvin 2006; TADS 2004), and five studies included combination therapy and psychological therapy plus placebo arms (Bernstein 2000; Cornelius 2009; Deas 2000; Mandoki 1997; Riggs 2007); only Mandoki 1997 contributed no data to any outcome.
Participants
One trial involved children and adolescents aged eight to 17 years (Mandoki 1997), and ten contained adolescents over the age of 11 years. Five trials had an age range of between 11 or 12 to 17 or 18 years (ADAPT 2007; Bernstein 2000; Clarke 2005; Melvin 2006; TADS 2004TASA 2009); one between 13 and 19 years (Riggs 2007); one between 13 and 18 (Kim 2012) and one between 15 and 18 years (Deas 2000) and one slightly older sample of 15 to 20 years (Cornelius 2009). The mean age ranged from 12.7 years to 17.6 years. Three trials contained similar proportions of males and females (Bernstein 2000; Cornelius 2009; TADS 2004), three contained around three times as many females as males (ADAPT 2007; Clarke 2005; TASA 2009), three contained around twice as many males as females (Deas 2000; Mandoki 1997; Riggs 2007) and one trial was undertaken in males only (Kim 2012).
Ten trials included participants with major depressive disorder (MDD), with diagnoses made on either DSM‐III or DSM‐IV criteria, deduced from structured interviews such as the K‐SADS‐PL. Deas 2000 used both the K‐SADS and the HAM‐D to measure baseline depression severity. Two trials used a cut‐off score of 35 or 36 on the CDRS‐R (Bernstein 2000; TASA 2009), and TADS 2004 used a higher cut‐off score of 45 on the CDRS‐R to determine eligibility. One trial used a cut‐off of eight or more on the Health of the Nation Outcome scales for children and adolescents (HoNOSCA; ADAPT 2007) and one trial used a cut‐off of 19 on the Beck Depression Inventory (BDI) (Beck 1961). Baseline severity of depressive symptoms was measured using the CDRS‐R in six trials (ADAPT 2007; Bernstein 2000; Mandoki 1997; Riggs 2007; TADS 2004; TASA 2009), the CES‐D in one trial (Clarke 2005), the HAM‐D in two trials (Cornelius 2009; Deas 2000) and the BDI in one trial (Kim 2012). Melvin 2006 reported baseline severity split by depressive diagnosis as determined by the K‐SADS. Three of the six trials that measured baseline severity using the CDRS‐R (ADAPT 2007; Riggs 2007; TASA 2009) reported mean t‐scores that ranged from 73.03 to 76.14.
It should be noted that while studies of young people with treatment resistant depression were excluded, in the ADAPT 2007 trial, an early description of the study methodology described its aim as treating “persistent adolescent major depression” (Harrington 2002) with entry criteria being a failure to respond, in the initial phase of the trial, to two brief initial sessions of support and educational interventions with a psychiatrist. The sample included 34 adolescents with “proven non‐response” in that they had failed a trial of psychosocial intervention before being referred to the trial. This was a pragmatic trial conducted in tertiary specialist mental health outpatient clinics and the authors note that “Most participants had already been treated and would have received psychosocial interventions before medication” (pg. 4 ADAPT 2007).
Four studies reported data on the proportion or percentage of young people who experienced any comorbid disorder (ADAPT 2007; Melvin 2006; TADS 2004; TASA 2009). In these trials, dysthymic disorders, anxiety disorders, and disruptive behavioural disorders (Oppositional Definant Disorder (ODD) /Conduct Disorder (CD)) were the most common comorbid conditions. Bernstein 2000 reported the rate of comorbid anxiety, as it was part of the trial's inclusion criteria that participants were experiencing a current anxiety disorder, and major depressive disorder based on DSM‐III‐R criteria. The study by Riggs 2007 included participants with comorbid substance use disorder, and lifetime conduct disorder, while all participants in Deas 2000 and Cornelius 2009 had a dual diagnosis of major depression and an alcohol use disorder; however, no other comorbid disorders were measured in either trial. The trial by Kim 2012 was of young males with problematic online gaming. The majority of trials excluded participants based on certain comorbid conditions; however, one trial did not report data on any excluded comorbid conditions (Deas 2000). All but one of the trials excluded participants on the basis of psychotic features or disorders (Bernstein 2000). Pervasive developmental disorders, general intellectual disabilities or mental retardation were excluded in seven trials, and bi‐polar disorder, either past or present, in seven trials. Those with substance abuse or dependence were excluded in four trials (Bernstein 2000; Cornelius 2009; Melvin 2006; TASA 2009), those with conduct disorder in two trials (Bernstein 2000; TADS 2004), and those with attention deficit hyperactivity disorder (ADHD) or an eating disorder in one trial (Bernstein 2000). Kim 2012 excluded all other psychiatric disorders.
Participants who were 'actively suicidal' were excluded in two trials (Mandoki 1997; TADS 2004). Three trials included participants who reported high levels of suicidal behaviour (Clarke 2005; Melvin 2006; Riggs 2007), however, these trials still excluded those who were 'actively suicidal' or likely to make a suicide attempt during the course of the trial. The ADAPT 2007 trial included participants who were actively suicidal, and a prerequisite of the TASA 2009 trial, was that participants had made a suicide attempt within the past 90 days. Five of these studies measured suicidal behaviour at baseline (ADAPT 2007; Melvin 2006; Riggs 2007; TADS 2004; TASA 2009).
Please see Characteristics of included studies for details by individual study.
Interventions
Treatment programmes ranged from six weeks (Clarke 2005) to 24 weeks in length (TASA 2009), and participants received between six and 24 sessions of psychological therapy. After an acute phase of treatment, four trials described a continuation or maintenance phase, or both. In two trials, participants were offered 'booster sessions', that were less frequent (ADAPT 2007; Melvin 2006). Clarke 2005 stated that proceeding onto the second module of their cognitive behavioural therapy (CBT) treatment was based on "the degree of youth recovery from depression, enduring youth problems other than depression, and/or to consolidate gains". The trial also contained a 'continuation phase', whereby young people received a brief telephone 'check‐in' by their therapists at one, two, three, five, seven, and nine months after completing the acute phase. The TADS 2004 trial was divided into three stages; stage one: up to 12 weeks; stage 2: up to 18 weeks; and stage 3: up to 36 weeks. Participants in the placebo group were unblinded after stage one and offered either telephone follow‐up, or their choice of treatment. Participants in the CBT alone, and CBT + fluoxetine groups received weekly CBT sessions up to stage one. In stage two participants were further defined as either 'partial responders' or 'full responders'. Partial responders received six additional CBT sessions and full responders, three (biweekly) sessions. At stage three, participants in both treatment arms received CBT once every six weeks.
All psychological therapies contained core elements of CBT, or behavioural therapy (BT), or both, such as cognitive restructuring, goal setting and pleasant events scheduling. The TASA 2009 study consisted of a CBT‐suicide prevention (CBT‐SP) programme, in which known risk factors for suicidal behaviour, such as depression were addressed. The CBT‐SP programme included 'chain analysis of the index suicide attempt' and safety planning to reduce current suicide risk. Clarke 2005 allowed participants to choose one of two therapy approaches to try first; either cognitive restructuring or behavioural activation; 67.5% of participants chose behavioural activation. Some programmes had a primary focus on another disorder, with depression being addressed as a secondary aim. Bernstein 2000 employed a CBT programme based on a school refusal treatment programme by Last 1998, which centred around negative thoughts surrounding school, and 'behavioural contracting' to increase school attendance. Cornelius 2009 utilised CBT for the treatment of adolescent depression, described by Brent 1997 in addition to motivational enhancement therapy (MET) described in Miller 1992 for the treatment of alcohol use disorders. The trial by Riggs 2007 focused on substance abuse, and contained one module on the management of depression, and how the identification of negative mood states could trigger substance abuse. The trial by Kim 2012 tested the efficacy of a version of CBT that focused on the negative consequences of online gaming and irrational beliefs about online gaming. The majority of the studies were manualised; three trials did not give any information (Clarke 2005; Mandoki 1997; Kim 2012) and one was non‐manualised (Deas 2000).
In nine trials the therapy included individual CBT sessions, and in two trials there were group sessions (Deas 2000; Kim 2012). Three trials formally included youth‐parent sessions (Bernstein 2000; Melvin 2006; TADS 2004; TASA 2009), while others encouraged parental involvement outside of the therapy sessions themselves (ADAPT 2007) and the trial by Kim 2012 included one session as 'family therapy'. Clarke 2005 held parent meetings for reviewing the general topics given in therapy sessions. Three trials included fidelity checks on therapists' adherence to protocol by video/audio taping sessions rated by independent raters (ADAPT 2007; Clarke 2005; Riggs 2007). Adherence was high, at over 80%. CBT sessions were delivered by a variety of professionals including a psychiatrist (Deas 2000), a clinical psychologist (Bernstein 2000), masters level psychologists (Clarke 2005), a social worker with experience in CBT, a probationary psychologist and general medical practitioners (Melvin 2006), study therapists trained by the manuals' developers (Riggs 2007) and trained psychotherapists (TASA 2009). In the Kim 2012 trial CBT could have been delivered by a psychiatrist, nurse, psychologist, or a social worker.
Six trials administered SSRI treatment of either fluoxetine (ADAPT 2007; Cornelius 2009; Riggs 2007; TADS 2004) or sertraline (Deas 2000; Melvin 2006). Bernstein 2000 used a TCA (imipramine); Mandoki 1997 used a SNRI (venlafaxine) and Kim 2012 used bupropion (an NDRI). Six trials employed a flexible dosing scheme (ADAPT 2007; Bernstein 2000; Deas 2000; Melvin 2006; TADS 2004; TASA 2009). The 'treatment as usual' condition in the Clarke 2005 study allowed participants to receive antidepressant medication prescribed either by the Health Maintenance Organisation or outside agencies; therefore dosage and medication type varied on an individual basis.
Please see Characteristics of included studies for details by individual study.
Outcomes
There were three primary outcomes of this review; remission of a depressive disorder according to a clinical interview by a mental health professional; acceptability of treatment as measured by dropouts; and suicide‐related serious adverse outcomes. Remisssion in these three trials was determined by the K‐SADS scale (Clarke 2005; Melvin 2006; TADS 2004). Only in Melvin 2006 was it clear that DSM‐IV criteria for full remission were used.
Suicide‐related SAEs were reported in the TADS 2004 trial as 'spontaneously reported suicide‐related events', and were measured using the Columbia Classification Algorithm of Suicide Assessment. ADAPT 2007 measured suicidal acts using the K‐SADS‐PL depression section, and Melvin 2006 reported adverse outcomes from the trial but did not state the criteria they used. Riggs 2007 measured suicidality using question 13 on the CDRS‐R.
In most trials remission from depressive disorder was defined as a drop below a predetermined cut‐off on a continuous measure of symptoms. A cut‐off score of ≤ 28 on the CDRS‐R scale was used in three studies (Riggs 2007; TADS 2004; TASA 2009), while a more liberal cut‐off of ≤ 35 was used by Bernstein 2000, and Clarke 2005 used a score of ≤ 15 on the Centre for Epidemiological Studies‐Depression (CES‐D) scale.
All six trials which included a clinician rating of depressive symptom severity, used the CDRS‐R. A variety of tools were used to measure self rated depressive symptom severity, including the Beck Depression Inventory (BDI) (Bernstein 2000; Cornelius 2009; TASA 2009; Kim 2012), Reynolds Adolescent Depression Scale (RADS) (Melvin 2006; TADS 2004), Mood and Feelings Questionnaire (MFQ) (ADAPT 2007), CES‐D (Clarke 2005), and HAM‐D (Deas 2000).
The most common measure of functioning was the C‐GAS (ADAPT 2007; Clarke 2005; TASA 2009). The GAF (Melvin 2006) and Clinical Global Impression Improvement (CGI‐I) scale (Riggs 2007) were also used.
Melvin 2006 and TADS 2004 reported suicidal ideation as a continuous outcome using the SIQ‐JR scale. TADS 2004 also reported suicidal ideation as a dichotomous measure, defining participants who scored above 31 on the SIQ‐JR scale as displaying the behaviour.
Missing outcome data
We successfully obtained further outcome data for the trials described in Melvin 2006 and Riggs 2007. The trial authors for the TADS 2004 study referred us to the National Institute of Mental Health (NIMH), from whom no further information could be obtained. The trial authors for Clarke 2005 and Cornelius 2009 wrote that they were unable to provide us with further data. We did not have any response from other trial authors. We have not requested any additional data from Kim 2012.
Excluded studies
Of the 51 full‐text articles retrieved for the earlier version of this review (published 2012), references were consolidated into respective studies for which there were multiple references (ADAPT 2007; Bernstein 2000; TADS 2004; TASA 2009; TORDIA 2008), after which we excluded 10 trials from the review. We excluded seven trials as they did not contain an appropriate comparison condition (Cheung 2008; Emslie 2002 (Eli 2002); Findling 2008; Fristad 2009; King 2009; Tang 2009; Wagner 2003); one was not a RCT (Emslie 2004); one implemented a cross‐over design (Dujovne 1994); and we further excluded one study as it contained a 'treatment resistant' population (TORDIA 2008).
Of the 29 full‐text references retrieved by the 2014 update search, we formally excluded an additional nine studies: Cornelius 2010 and Siddique 2012 were excluded because the mean age of the participants was too high (21 and 29 years respectively); the age of participants in Lubman 2005 was also too high (16 to 26 years) and the participants also had treatment resistant depression and comorbid substance abuse. On closer inspection Forbes 2012 was not an RCT; participants in Warden 2012 and Wu 2013 did not have a primary diagnosis of depression; and the adjunctive treatment in Pallavi 2014 was yoga.
References to Goodyer 2011 and Emslie 2013 were also retrieved in the update search; these are relapse prevention studies including adjunctive fluoxetine (although participants in Goodyer's study could receive fluoxetine in any arm of the study, based on symptom severity). These studies are currently listed as ongoing in another Cochrane review (Cox 2012).
Additional references to TORDIA 2008 were alo retrieved in the update search, but these were excluded at the abstract screening stage (this is a large study with multiple publications and the primary references have already been cited in this review).
Risk of bias in included studies
The original intention was to conduct a sensitivity analysis on the primary outcome measures, excluding trials with 'high risk' or 'unclear risk' ratings for allocation concealment. However, only four trials were rated as such. One trial (TASA 2009) did not contain any data suitable for meta‐analysis, and the remaining three were contained in comparisons with only limited data, therefore we did not conduct a sensitivity analysis. We have summarised and described all risk of bias items in Figure 2.

Methodological quality graph: review authors' judgements about each methodological quality item presented as percentages across all included studies.
Allocation
Of the 11 included studies, five reported sufficient information to determine that adequate methods of sequence generation were used (Clarke 2005; Cornelius 2009; Deas 2000; Melvin 2006; TADS 2004). There were three in which the sequence generation methods were rated as not being adequate (Bernstein 2000; Riggs 2007; TASA 2009). Adequate sequence generation was rated as 'unclear' in three trials (ADAPT 2007; Mandoki 1997; Kim 2012).
The allocation of intervention arms were judged to be concealed in four trials (ADAPT 2007; Deas 2000; Riggs 2007; TADS 2004). TASA 2009 did not adequately conceal allocation, while the remaining six trials (Bernstein 2000; Clarke 2005; Cornelius 2009; Mandoki 1997; Melvin 2006; Kim 2012) did not contain adequate information to determine whether allocation to intervention arms was concealed.
Blinding
Six trials contained sufficient information to determine that outcome assessors were blind to the intervention group of participants (ADAPT 2007; Bernstein 2000; Clarke 2005; Mandoki 1997; TADS 2004; TASA 2009). There was insufficient information to determine blinding of outcome assessors in two trials (Deas 2000; Riggs 2007), while the remaining two trials did not use blinded outcome assessors (Cornelius 2009; Melvin 2006). The Kim 2012 trial did not have any assessor rated outcomes.
Two studies tested psychotherapy alone against medication alone. In TADS 2004, in which a total of four arms were included, the psychotherapy was not blinded (one arm received cognitive behavioural therapy (CBT) alone and one arm received CBT and fluoxetine), but the medication arm was blinded (one arm received fluoxetine alone and one arm received placebo alone). In Melvin 2006 there were only three arms in total: one CBT alone, one sertraline alone, and one a combination of these; there was no medication placebo arm or placebo psychotherapy arm.
Therefore, in these two studies, which also tested medication alone against combination therapy, the psychotherapy was not blind. In three further studies testing this combination (ADAPT 2007; Clarke 2005; Kim 2012) the psychotherapy was not blinded.
For studies testing the efficacy of psychotherapy alone against combination therapy, in five studies a placebo pill was used and participants were blind to medication intervention (Bernstein 2000; Cornelius 2009; Deas 2000; Mandoki 1997; Riggs 2007). In two studies testing this combination a placebo pill was not used in the psychotherapy condition (Melvin 2006; TADS 2004).
In one study, after an initial period of randomisation, participants selected the treatment arm they preferred (TASA 2009).
Melvin 2006 was the only study in which outcome assessment was not clearly blinded.
Incomplete outcome data
Nine of eleven trials addressed incomplete data including description of ITT analyses and recording and explanation of participant dropouts adequately (ADAPT 2007; Bernstein 2000; Clarke 2005; Cornelius 2009; Deas 2000; Melvin 2006; Riggs 2007; TADS 2004; TASA 2009) while this was not adequately addressed in two trials (Mandoki 1997; Kim 2012).
There was unbalanced drop out in two trials (Melvin 2006; TADS 2004) and reasons for dropout were not reported in three trials (Clarke 2005; Cornelius 2009; Deas 2000).
Selective reporting
Four trials were judged to have been free of selective reporting (ADAPT 2007; Cornelius 2009; Deas 2000; TADS 2004). We were unclear whether there was selective reporting in four trials (Bernstein 2000; Clarke 2005; Melvin 2006; Kim 2012), as some trial outcomes were only reported at particular time points, or were difficult to interpret or we did not have access to the protocol. Clarke 2005 reported using an ITT analysis, however when we did manual calculations for remission rates we found that remission was analysed for observed cases only. Mandoki 1997 was judged to have selective reporting, as the results contained no numerical data and all outcomes were presented in graph format. TASA 2009 also reported only selected data, providing results for the combination treatment group and overall results, but not for other comparison arms.
Other potential sources of bias
Five trials were determined to be free of additional sources of bias (ADAPT 2007; Cornelius 2009; Mandoki 1997; Melvin 2006; Riggs 2007). Clarke 2005 reported that telephone administration of self report measures may have created bias.
Effects of interventions
We report on results by objectives (one to three) with each relevant comparison for each objective listed. We do not report on heterogeneity for non‐significant results.
Are psychological therapies or antidepressant medication more effective?
Data relevant to this research question are contained within the analyses undertaken in comparison 1.
Comparison 1: Psychological therapy versus antidepressant medications
Two studies (n = 220) compared psychological therapies versus antidepressant medication (Melvin 2006; TADS 2004) and contained data suitable for this comparison.
1.1 to 1.4: Remission from depressive disorder by clinical interview
Both studies (Melvin 2006; TADS 2004) reported remission rates based on observed case data. We undertook analysis based on numbers randomised in the first instance .
-
At post‐intervention the effect of antidepressants on the rate of remission was unclear (OR 0.62, 95% CI 0.28 to 1.35) Analysis 1.1. When observed case data was evidence of a small effect in favour of antidepressants (OR 0.52, 95% CI 0.27 to 0.98) Analysis 1.2. There was a large dropout from the CBT group in the TADS 2004 trial (28%), compared to the Melvin 2006 trial (5%); whereas at 6‐9 months follow‐up the dropout from the medication group in the TADS 2004 trial was 20% compared with 19% in the Melvin 2006 trial.
-
One trial (n = 20) reported data for six to nine months follow‐up (Melvin 2006) Analysis 1.3. The effect of taking medication compared with psychological therapy was unclear (OR 0.83, 95% CI 0.27 to 2.60) and there was little difference in the outcome when OC data was used (OR 0.67, 95% CI 0.18 to 2.49) Analysis 1.4.
-
No trial provided data on remission at 12 months follow‐up.
1.5 and 1.6: Dropouts
Both studies (Melvin 2006; TADS 2004) reported the number of dropouts during the intervention.
-
At post‐intervention, the effect on dropout of receiving psychological therapy compared with receiving antidepressant medication was unclear (OR 0.61, 95% CI 0.11 to 3.28) Analysis 1.5.
-
At six to nine months follow‐up there continued to be an unclear effect on dropout rates across the two treatment conditions (OR 1.17, 95% CI 0.63 to 2.19) Analysis 1.6.
-
No trial provided data on dropouts at 12 months follow‐up.
Suicide‐related SAEs
TADS 2004 also reported on 'spontaneously reported suicide‐related events', measured using the Columbia Classification Algorithm of Suicide Assessment. At post‐intervention, 10 out of 109 participants in the medication treatment arm had experienced a suicide‐related event; this included two suicide attempts, and eight instances of suicidal ideation. Five out of 111 participants receiving psychological therapy reported a suicidal event, of which one was a suicide attempt, and four were suicidal ideation.
The TADS 2004 trial also reported on the total number of suicide‐related events that occurred up to the 36‐week follow‐up point. Sixteen out of 109 participants who received medication experienced a suicide‐related event during the entire trial, and seven out of 111 participants in the psychological therapy arm experienced a suicide‐related event.
1.7 to 1.11 Suicide‐related outcomes
TADS 2004 reported dichotomous data regarding suicidal ideation, as defined by a score of more than 31 on the SIQ‐JR.
-
At post‐intervention (n = 188) there were significantly fewer participants experiencing suicidal ideation in the psychological therapy group than in the medication group (OR 0.26, 95% CI 0.09 to 0.72) Analysis 1.7.
-
At six to nine months follow‐up, this effect was still evident (OR 0.26, 95% CI 0.07 to 0.98) Analysis 1.8.
-
There were no data available for 12 months follow‐up.
Two trials (Melvin 2006; TADS 2004) reported continuous suicidal ideation data, and used the SIQ‐JR.
-
At post‐intervention, there was a small effect favouring psychological therapy compared with medication (MD ‐3.12, 95% CI ‐5.91 to ‐0.33) Analysis 1.9.
-
The effect remained at six to nine months follow‐up (MD ‐2.89, 95% CI ‐5.49 to ‐0.28) Analysis 1.10.
-
Only one trial (TADS 2004) provided data at 12 months follow‐up. The reduction in suicidal ideation experienced by those receiving psychological therapy did not reach statistical significance (MD ‐2.50, 95% CI ‐5.09 to 0.09) Analysis 1.11.
1.12 to 1.14 Remission from depressive disorder by cut‐off
One trial (TADS 2004) reported data regarding remission from depressive disorder by cut‐off score, using an upper threshold of < 28 on the CDRS‐R scale.
-
At post‐intervention, the effect on remission rates of receiving medication or psychological therapy was unclear (OR 0.65, 95% CI 0.33 to 1.28) Analysis 1.12.
-
The effect remained unclear at six to nine months follow‐up (OR 1.50, 95% CI 0.88 to 2.58) Analysis 1.13.
-
It was also unclear at 12 months follow‐up (OR 0.84, 95% CI 0.49 to 1.47) Analysis 1.14.
1.15 to 1.17 Depressive symptoms: Clinician rated
Data on clinician rated depression symptoms were only available for the TADS 2004 trial (n = 220), and were measured using the CDRS‐R.
-
At post‐intervention, there was evidence of a small effect on CDRS‐R scores for those receiving medication, compared with those receiving psychological therapy (MD 5.76, 95% CI 3.46 to 8.06) Analysis 1.15.
-
At six to nine months follow‐up, the effect of receiving medication or psychological therapy was unclear (MD 0.05, 95% CI ‐2.11 to 2.21) Analysis 1.16.
-
At 12 months follow‐up, the effect remained unclear (MD 0.90, 95% CI ‐0.93 to 2.73) Analysis 1.17.
1.18 to 1.20 Depressive symptoms: Self rated
Two trials provided data for this outcome (Melvin 2006; TADS 2004), with a total of 144 participants.
-
At post‐intervention, the effect on self reported depressive symptoms of receiving medication or psychological therapy was unclear (SMD 0.16, 95% CI ‐0.69 to 1.01) Analysis 1.18. There was a difference in the direction of the effect of the interventions in the two trials included in the meta‐analysis (and considerable heterogeneity between the trials (I2 = 81%, P = 0.02)), with Melvin 2006 favouring psychological therapy, and TADS 2004 favouring medication.
-
At six to nine months follow‐up, the effect remained unclear (SMD ‐0.04, 95% CI ‐0.51 to 0.42) Analysis 1.19, and heterogeneity between them was non‐significant (I2 = 57%, P = 0.13).
-
At 12 months follow‐up, only TADS 2004 had suitable data for meta‐analysis and the effect of medication or psychological therapy on levels of self reported depressive symptoms remained unclear (MD 0.50, 95% CI ‐2.74 to 3.74) Analysis 1.20.
1.21 and 1.22 Functioning
One trial assessed functioning in this comparison (Melvin 2006).
-
At post‐intervention (n = 42) the effect of medication compared with psychological therapy in improving functioning was unclear (MD 2.19, 95% CI ‐3.36 to 7.74) Analysis 1.21.
-
The effect remained unclear at six to nine months follow‐up (MD ‐0.39, 95% CI ‐6.66 to 5.88) Analysis 1.22.
-
No data were available for 12 months follow‐up.
Is combination therapy more effective than antidepressant medication?
Data relevant to this research question are contained within the analyses undertaken in comparison 2.
Comparison 2: Combination therapy versus antidepressant medication
Four studies (n = 618) provided useable data for this comparison (ADAPT 2007; Clarke 2005; Melvin 2006; TADS 2004).
2.1 to 2.5 Remission from depressive disorder by clinical interview
Three studies reported data on rates of remission by clinical interview (Clarke 2005; Melvin 2006; TADS 2004). The Melvin 2006 and TADS 2004 trials reported observed case data. We used numbers randomised in the analysis in the first instance.
-
At post‐intervention, based on data from three trials with 419 participants (Clarke 2005; Melvin 2006; TADS 2004), there was an effect on remission rates favouring combination therapy that did not reach significance compared with those who received medication alone (OR 1.50, 95% CI 0.99 to 2.27) Analysis 2.1. There was little difference in outcome when OC data were used (three trials; 378 participants; OR 1.56, 95% CI 0.98 to 2.47) Analysis 2.2.
-
At six to nine months follow‐up, data from two trials with 265 participants (Clarke 2005; Melvin 2006) again showed some effect of combination therapy that did not reach significance (OR 1.93, 95% CI 0.93 to 4.00) Analysis 2.3, with no real change in outcome when OC data were used (OR 1.94, 95% CI 0.88 to 4.27) Analysis 2.4.
-
At 12 months, only one trial had data suitable for meta‐analysis (Clarke 2005). The effect of the intervention was in the opposite direction, favouring medication alone, however this effect was small and did not reach significance (OR 0.49, 95% CI 0.14 to 1.69) Analysis 2.5.
2.6 to 2.8 Dropouts
Five studies provided data concerning dropouts at post‐intervention and three to six months follow‐up (ADAPT 2007; Clarke 2005; Melvin 2006; TADS 2004; Kim 2012).
-
At post‐intervention (n = 627) the effect of combination therapy compared with medication alone was unclear (OR 0.84, 95% CI 0.51 to 1.39) Analysis 2.6.
-
At three to six months (n = 420) there appeared to be no difference between the two treatment approaches (OR 0.94, 95% CI 0.54 to 1.64) Analysis 2.7.
-
At 12 months only one study provided data (Clarke 2005), with significantly fewer participants dropping out from medication alone, compared with combination therapy (OR 2.42, 95% CI 1.05 to 5.59) Analysis 2.8.
Suicide‐related SAEs
At post‐intervention, TADS 2004 reported that six out of 107 participants in the combination therapy group experienced a suicide‐related event; two were suicide attempts, one act was of unknown intent, and three participants reported suicidal ideation. For participants in the medication alone group, 10 out of 109 experienced an event, with two being an attempt and eight being episodes of suicidal ideation.
In total, nine out of 107 participants in the combination therapy group experienced a suicidal event at any point during the study. For participants in the medication alone group, 16 out of 109 experienced a suicidal event.
ADAPT 2007 measured suicidal acts using the K‐SADS‐PL depression section. At 12 weeks, 8% of participants in the medication alone group reported attempting suicide, compared with 6.9% of the combination therapy group. At 28‐week follow‐up 6.4% of the medication alone group and 7.1% of the combination therapy group had reported attempting suicide.
Melvin 2006 report that one participant in the combination therapy group and four in the medication alone group attended treatment sessions with 'high levels of suicidality' (pg. 1159), however no one had to discontinue treatment due to these symptoms, and no suicidal behaviours were reported as part of the adverse events.
2.9 to 2.14 Suicidal‐related behaviours
Dichotomous data from the ADAPT 2007 and TADS 2004 trials were included in this analysis. ADAPT 2007 data is based on the ideation outcome of the K‐SADS‐PL, and TADS 2004 is based on a cut‐off score of the SIQ‐JR.
-
At post‐intervention, the effect of combination therapy compared with medication alone is unclear (OR 0.75, 95% CI 0.26 to 2.16) Analysis 2.9. There was significant heterogeneity (I2 = 68%, P = 0.08).
-
At six to nine months follow‐up, the effect of the two intervention approaches remains unclear (OR 0.53, 95% CI 0.06 to 4.58) Analysis 2.10. There was significant heterogeneity (I2 = 83%; P = 0.08).
-
Data at 12 months follow‐up was only available from the TADS 2004 trial, and this favoured combination therapy, with fewer individuals reporting suicidal ideation, compared with those treated with medication alone; however this did not reach significance Analysis 2.11.
Two trials (Melvin 2006; TADS 2004) provided continuous suicidal ideation data.
-
There were no differences in treatment approaches post‐intervention (MD ‐2.57, 95% CI ‐5.53 to 0.40) Analysis 2.12, at six to nine months (MD ‐1.89, 95% CI ‐4.50 to 0.72) Analysis 2.13; or at 12 months follow‐up (only TADS 2004 provided data for this time point) (MD ‐1.60, 95% CI ‐4.18 to 0.98) Analysis 2.14.
2.15 to 2.17 Remission from depressive disorder by cut‐off
Data from one study (TADS 2004) containing 216 participants was suitable for the post‐intervention and six to nine months time points, and is based on a CDRS‐R score of less than 28. At 12 months follow‐up, data from two studies was combined in a meta‐analysis (Clarke 2005; TADS 2004).
-
At post‐intervention, significantly more participants receiving combination therapy were in remission compared with those who received medication alone (OR 2.01, 95% CI 1.11 to 3.63) Analysis 2.15.
-
At six to nine months follow‐up, the effect of the two treatment approaches is unclear (OR 0.90, 95% CI 0.53 to 1.53) Analysis 2.16.
-
The effect remains unclear at 12 months follow‐up (OR 1.45, 95% CI 0.60 to 3.52) Analysis 2.17.
2.18 to 2.20 Depressive symptoms: Clinician rated
Two trials (ADAPT 2007; TADS 2004, 415 participants) provided data at post‐intervention and six to nine months follow‐up on clinician rated depressive symptom scales.
-
At post‐intervention, the effect of combination therapy compared to medication alone on clinician rated depressive symptoms was unclear (MD ‐0.27, 95% CI ‐4.95 to 4.41) Analysis 2.18. The direction of effect of the two trials included in the meta‐analysis was opposite (and there was significant heterogeneity between the trials (I2 = 74%, P = 0.05)), with TADS 2004 favouring combination therapy, and ADAPT 2007 favouring medication alone.
-
At six to nine months follow‐up, the effect of the two interventions remained unclear (MD‐0.27, 95% CI ‐2.26 to 1.72) Analysis 2.19.
-
At 12 months follow‐up data were only available from the TADS 2004 trial, and the effect of the two treatment approaches was unclear (MD ‐0.70, 95% CI ‐2.46 to 1.06) Analysis 2.20.
2.21 to 2.23 Depression symptoms: Self rated
Five trials were included in this analysis (ADAPT 2007; Clarke 2005; Melvin 2006; TADS 2004; Kim 2012, 683 participants).
-
At post‐intervention, the effect of the two intervention approaches on self reported depressive symptoms was unclear (SMD ‐0.14, 95% CI ‐0.36 to 0.09) Analysis 2.21.
-
The effect remained unclear at six to nine months follow‐up (SMD ‐0.06, 95% CI ‐0.28 to 0.17) Analysis 2.22.
-
At 12 months, two trials with 368 participants provided data for meta‐analysis, and there was evidence of a small effect favouring the use of combination therapy over medication alone in producing lower levels of self reported depressive symptoms (SMD ‐0.26, 95% CI ‐0.46 to ‐0.05) Analysis 2.23.
2.24 to 2.26 Functioning
Data regarding level of functioning was provided by three trials (ADAPT 2007; Clarke 2005; Melvin 2006) at post‐intervention and six to nine months follow‐up.
-
At post‐intervention (n = 396), the effect of receiving combination therapy compared with medication alone was unclear (SMD 0.09, 95% CI ‐0.11 to 0.28) Analysis 2.24.
-
At six to nine months follow‐up the effect remained unclear (SMD 0.08, 95% CI ‐0.12 to 0.28) Analysis 2.25.
-
Only data from the Clarke 2005 trial were available at 12 months follow‐up; this showed a small effect favouring combination therapy compared with medication alone (MD 3.00, 95% CI 0.40 to 5.60) Analysis 2.26.
Is combination therapy more effective than psychological therapies
Data relevant to this clinical question are contained within the analyses undertaken as part of comparisons 3 and 4. The most appropriate trial design to answer this research question is the comparison between combination therapy and psychological therapies plus placebo, contained in comparison 4.
Comparison 3: Combination therapy versus psychological therapy
We included two trials for this comparison (Melvin 2006; TADS 2004).
3.1 and 3.4 Remission from depressive disorder by clinical interview
Both trials (Melvin 2006; TADS 2004) contained data on remission by clinical interview based on observed case data. We used numbers randomised in the analysis.
-
At post‐intervention (n = 265), the effect of combination therapy, compared with those who received psychological therapy alone was unclear (OR 1.61, 95% CI 0.38 to 6.90) Analysis 3.1 with no real change in outcome when OC data were used (N = 222) (OR 1.82, 95% CI 0.38 to 8.68) Analysis 3.2. The direction of effect of the two trials included in the meta‐analysis was opposite (there was significant heterogeneity between the trials (I2 = 72%, P = 0.05)), with Melvin 2006 favouring psychological therapy alone and TADS 2004 favouring combination treatment.
-
At six to nine months follow‐up, data from one study was available for meta‐analysis (Melvin 2006, 47 participants). The effect favoured combination therapy but did not reach significance (OR 2.55, 95% CI 0.78 to 8.36) Analysis 3.3 with wider CIs when OC data used (OR 3.40, 95% CI 0.81 to 14.24) Analysis 3.4.
-
No study reported data at 12 months follow‐up.
3.5 to 3.6 Dropouts
Two studies contained data suitable for this comparison (Melvin 2006; TADS 2004).
-
At post‐intervention, the effect of receiving combination therapy compared with receiving psychological therapy alone was unclear (OR 1.23, 95% CI 0.12 to 12.71) Analysis 3.5. The direction of effect of the two trials included in the meta‐analysis was opposite (there was statistical heterogeneity between the trials (I2 = 77%, P = 0.04)), with Melvin 2006 favouring psychological therapy alone and TADS 2004 favouring combination treatment.
-
At six to nine months follow‐up there appears to be no difference in the rate of dropout between the two intervention types (OR 0.75, 95% CI 0.40 to 1.42) Analysis 3.6.
-
No data was available for meta‐analysis at 12 months follow up.
Suicide‐related SAEs
In the TADS 2004 study, at post‐intervention, 5.6% of participants in the combination group and 4.5% of participants in the psychological therapy only group reported a suicide‐related event. During the 36‐week study period, 8.4% of combination treatment participants and 6.3% of psychological therapy only participants had experienced a suicidal event.
3.7 to 3.11 Suicidal‐related behaviours
Only TADS 2004 provided dichotomous suicidal ideation data, at post‐intervention, and six to nine months follow‐up. Suicidal ideation events were based on a cut‐off score on the SIQ‐JR.
-
At post‐intervention, there is little evidence of any difference between treatment approaches (OR 1.68, 95% CI 0.53 to 5.34) Analysis 3.7.
-
The effect is unclear at six to nine months follow‐up (OR 0.63, 95% CI 0.10 to 3.89) Analysis 3.8.
Continous suicidal ideation data from Melvin 2006 and TADS 2004 were available for post‐intervention and six to nine months follow‐up. Both used the SIQ‐JR scale. At 12 months follow‐up only the TADS 2004 study was available.
-
There appears to be little effect of either intervention in level of suicidal ideation at post‐intervention (MD 0.60, 95% CI ‐2.25 to 3.45) Analysis 3.9, six to nine months follow‐up (MD 1.78, 95% CI ‐2.29 to 5.85) Analysis 3.10or 12 months follow‐up (MD 0.90, 95% CI ‐1.37 to 3.17) Analysis 3.11.
3.12 to 3.14 Remission from depressive disorder by cut‐off
One trial (TADS 2004) reported data for remission from depressive disorder utilising a CDRS‐R cut‐off of less than 28.
-
At post‐intervention, results indicated an effect in favour of combination treatment, compared with psychological therapy alone (OR 3.08, 95% CI 1.63 to 5.84) Analysis 3.12.
-
At six to nine months follow‐up, the effect is unclear (OR 0.60; 95% CI 0.35 to 1.02) Analysis 3.13.
-
At 12 months, the effect remains unclear (OR 1.15; 95% CI 0.66 to 2.00) Analysis 3.14.
3.15 to 3.17 Depressive symptoms: Clinician rated
The TADS 2004 trial (n = 218) was the only study to provide data for this outcome.
-
At post‐intervention, there was evidence of an effect favouring combination treatment in producing lower levels of clinician rated depressive symptoms compared with psychological therapy alone (MD ‐8.27, 95% CI ‐10.58 to ‐5.96) Analysis 3.15.
-
At six to nine months follow‐up, the effect is in the same direction, favouring combination treatment, however the effect no longer reaches significance (MD ‐0.87, 95% CI ‐3.10 to 1.36) Analysis 3.16.
-
At 12 months there remains a small effect favouring combination treatment that does not reach significance (MD ‐1.60, 95% CI ‐3.49 to 0.29) Analysis 3.17.
3.18 to 3.20 Depression symptoms: Self rated
Self rated depression symptom scores were obtained for two trials (Melvin 2006; TADS 2004) in this comparison (n = 265).
-
At post‐intervention, the effect of the two treatment approaches on self rated depression scores is unclear (SMD ‐0.28, 95% CI ‐1.41 to 0.84) Analysis 3.18. The direction of the effect of the two trials included in the meta‐analysis is opposite (there was significant heterogeneity between the trials (I2 = 92%, P = 0.0004)), with TADS 2004 favouring combination therapy and Melvin 2006 favouring psychological therapy alone.
-
At six to nine months follow‐up, the effect remains unclear with the direction of effect the opposite for each trial included in the meta‐analysis (SMD ‐0.16, 95% CI ‐0.63 to 0.31) Analysis 3.19.
-
At 12 months follow‐up only data from TADS 2004 was available and the effect is unclear (MD ‐3.10, 95% CI ‐6.38 to 0.18) Analysis 3.20.
3.21 to 3.22 Functioning
Functioning data was only obtained from Melvin 2006.
-
At post‐intervention, the effect of psychological therapy alone compared with combination therapy is unclear (MD ‐2.38, 95% CI ‐8.65 to 3.89) Analysis 3.21.
-
At six to nine months, the effect of each intervention approach is unclear (MD 0.43, 95% CI ‐7.04 to 7.90) Analysis 3.22.
-
No data was available for 12 months follow‐up.
Comparison 4: Combination therapy versus psychological therapy plus placebo
All of the trials in this comparison were unique to those described in the above comparisons in that they targeted comorbid diagnoses, rather than depression in isolation. Additionally the Bernstein 2000 trial contained participants with a diagnosis of school refusal syndrome in addition to a comorbid diagnosis of depression and anxiety.
We included four studies (n = 249) for this comparison (Bernstein 2000; Cornelius 2009; Deas 2000; Riggs 2007).
Remission from depressive disorder by clinical interview
No data were reported for this outcome measure.
4.1 Dropouts
All four studies provided data for dropouts at post‐intervention.
-
At post‐intervention (n = 249) the effect on the dropout rate for participants receiving a combination treatment compared with a psychological therapy plus placebo treatment was unclear (OR 0.98, 95% CI 0.42 to 2.28) Analysis 4.1.
-
No data were available for comparisons at six to nine months or 12 months follow‐up.
Suicide‐related SAEs
Riggs 2007 reports that there were no serious suicide attempts or completed suicides during the trial; however, five participants were seen in the emergency room for 'worsening suicidality'; four participants were in the medication group and one was in the placebo group.
4.2 Suicide‐related behaviours
One trial (Riggs 2007) containing 126 participants reported data based on question 13 of the CDRS‐R about suicidal ideation.
-
At post‐intervention, the effect of combination treatment compared with psychological therapy plus placebo was unclear (MD ‐0.06, 95% CI ‐0.36 to 0.24) Analysis 4.2.
4.3 and 4.4 Remission from depressive disorder by cut‐off
Two studies (Bernstein 2000; Riggs 2007) containing 173 participants provided data for this outcome.
-
At post‐intervention, there was evidence of an effect favouring combination treatment compared with psychological therapy plus placebo (OR 2.15, 95% CI 1.15 to 4.02) Analysis 4.3.
-
No data were reported for the six to nine months follow‐up.
-
At 12 months follow‐up, data from Riggs 2007 were available. The effect of the two treatment approaches was unclear (OR 1.20, 95% CI 0.29 to 5.02) Analysis 4.4.
4.5 Depressive symptoms: Clinician rated
Data concerning clinician rated depressive symptoms were available from three studies (Bernstein 2000; Cornelius 2009; Riggs 2007) containing a total of 239 participants.
-
At post‐intervention, there was evidence that combination therapy, resulted in significantly lower levels of clinician rated depressive symptoms compared with psychological therapy plus placebo (SMD ‐0.52, 95% CI ‐0.78 to ‐0.26) Analysis 4.5.
-
No data were available for six to nine months or 12 months follow‐up.
4.6 Depressive symptoms: Self rated
Three studies (Bernstein 2000; Cornelius 2009; Deas 2000) containing a total of 123 participants provided data for self reported depressive symptoms.
-
At post‐intervention, although self reported depressive symptoms were lower in the combination condition, this did not reach significance (SMD ‐0.34, 95% CI ‐0.70 to 0.02) Analysis 4.6.
-
There were no data available for six to nine months or 12 months follow‐up.
Functioning
There were no suitable data for this outcome.
While included as objectives, we did not have the data and so we were unable to explore subgroup analyses of the potential modifying effects of age and severity of depression on the results reported above.
Discussion
Summary of main results
We have compared psychological therapy alone, antidepressant medication alone, and a combination of the two, for the treatment of depression in children and adolescents. We included 10 studies in our review, with participants aged 8 to 19 years.
We could not draw clear conclusions from our analysis; we could pool few data for meta‐analysis because of the variety of interventions, there were small numbers of studies in each comparison, and data were conflicting at times.
Psychological therapy versus antidepressant medication
The effect of antidepressants on remission rates (as defined by clinical interview) was unclear compared with psychological intervention. This is based on two studies using ITT data, and assumes that those who dropped out during treatment did not achieve remission (Melvin 2006; TADS 2004). Using OC data, there was a small effect in favour of antidepressants because dropouts (who are assumed not to have achieved remission in the medication group) are not counted in the analysis. It cannot be assumed, however that those who dropped out did not achieve remission, making the results unclear. It should also be noted that this effect was driven by the positive findings in the TADS 2004 study, but these were not replicated by Melvin 2006. Nor is this finding supported by the analysis using a cut‐off on continuous measures to define remission. There was also no evidence of superiority of medication over psychological therapy in the longer‐term (Melvin 2006; TADS 2004). Significantly fewer instances of suicidal ideation were reported in participants receiving psychological therapy compared with medication post‐intervention, and at three to six months follow‐up. Psychological therapy may be associated with less suicidal ideation, however additional data are needed to substantiate this claim.
The differences in short‐term findings between the two studies may be related to the use of different antidepressant medications (Melvin 2006 used sertraline and TADS 2004 used fluoxetine). Meta‐analyses ( Whittington 2004) have asserted fluoxetine as the more effective SSRI for reducing depressive symptoms in children and adolescents. From the TADS 2004 study, it appears that fluoxetine may lead to a faster reduction in symptoms; however, it appears no more beneficial than psychological therapy over time. Sertraline was no more effective than psychological therapy. Acceptability of treatment, measured by dropout rate, did not differ between medication, and psychological therapy approaches. Again, the finding that medication may lead to faster reduction in symptoms should be interpreted with caution, given the inconsistent results between TADS 2004 and Melvin 2006, and the diversity in the direction of results across various outcome measures.
Combination therapy versus either psychologival therapy or antidepressant medication alone
Given the above findings, a combination of treatment approaches could be expected to provide both a faster treatment response and potential protection against suicidality, and thus be superior to medication or psychological intervention alone. We did not find compelling data to support this view. The results differed by outcome measure.
Combination therapy versus antidepressant medication
-
The TADS 2004 study did show that combination therapy was superior to medication alone, immediately after intervention, but this was only a significant effect for remission using a cut‐off score on a rating scale, and did not persist at follow‐up.
-
When a clinical interview was used to define remission, while the effects favoured combination therapy up to six to nine months follow‐up, the effect did not reach significance (Clarke 2005; Melvin 2006; TADS 2004), and there were differences in the direction of effect for each of the studies included (possibly due to the different medications used in each trial), making the effects of different intervention strategies on remission unclear. Again, it should be noted that two of these trials reported this outcome using observed case data (Melvin 2006; TADS 2004).
-
In contrast, the ADAPT 2007 study favoured medication alone. The collaborative context in which medication was delivered in the ADAPT 2007 study may have influenced this result. Participants receiving medication in this study did so within a well co‐ordinated case management approach.
-
The effect of the different intervention approaches on clinician rated depression symptoms were unclear. There were some differences between groups on self rated depression, with large variability within the data; the ADAPT 2007 and Clarke 2005 trials favoured medication alone at post‐treatment, whereas Melvin 2006; TADS 2004 and Kim 2012 favoured combination therapy.
-
At 12 months follow‐up, meta‐analysis based on two trials (Clarke 2005; TADS 2004) favoured combination therapy, resulting in significantly lower self reported depressive symptoms in the longer‐term.
-
In one study that measured this outcome (TADS 2004), rates of suicidal ideation at 12 months showed that combination therapy may provide some protective benefits against suicidal behaviour over time. Note that these differences were not apparent immediately after intervention. The effects of the treatment strategies were unclear on continuous measures of suicidal ideation.
Combination therapy versus psychological therapy
-
Based on two trials (Melvin 2006; TADS 2004), the effect of the two intervention approaches to increase remission rates (by clinical interview), was unclear. It should be noted that the direction of effect in these trials differed and may be due to the use of different SSRI compounds (fluoxetine in TADS 2004 and sertraline in Melvin 2006), and again data were based on observed cases only.
-
The TADS 2004 trial was the only study to provide data for remission based on a cut‐off score, clinician rated depressive symptoms and self rated depressive symptoms. At post‐intervention, there were significantly higher remission rates in those receiving combination therapy; however, this benefit appeared to be short‐lived. .
-
While not significant there was some evidence of a small effect of combination therapy on clinician rated depressive symptoms from TADS 2004.
-
The effects on self reported depressive symptoms were unclear with the direction of the effect differing for trials.
-
There was no difference in rates of suicidal behaviours or in suicidal ideation.
Combination therapy versus psychological therapy plus placebo
These trials all included participants with a comorbid diagnosis of either anxiety or addiction.
-
Remission rates as defined by a cut‐off score, were higher in those receiving combination therapy at post‐intervention only.
-
Clinician rated depressive symptoms were lower at post‐intervention in those who received combination therapy compared with psychological therapy plus placebo, based on three trials (Bernstein 2000; Cornelius 2009; Riggs 2007).
-
Although the effect was not as strong for self reported depressive symptoms, results from all three trials favoured combination therapy in general.
-
There was no evidence of effect on suicide‐related outcomes.
Overall, these trials suggest that medication is exerting a small effect on depression, over and above that of a placebo pill, in the short‐term. This experimental design is interesting and methodologically robust.
As can be seen, there is limited evidence about the effects of different treatment approaches. In the acute phase of treatment, medication may ensure a faster treatment response; however, the benefit of medication over psychotherapy or a combination approach does not appear to be maintained over time. The limited evidence in this review suggests that psychological interventions may have the potential to provide some protection against suicidal ideation in the long‐term, and may also result in effectiveness similar to other treatment approaches in the long‐term. These tentative conclusions should be interpreted with caution given the considerable heterogeneity between trials, the variety of ways in which remission is defined across studies, and the inconsistent results across other outcome measures.
Recent guidelines for the treatment of depression in adolescents and young adults in Australia recommend psychotherapy as a first line treatment in this population. Only when symptoms are severe, should pharmacological approaches be considered, and then only in combination with ongoing psychotherapy (McDermott 2010). These recommendations are consistent with a number of guidelines produced internationally. The results of this review, while not contradicting these recommendations, introduce some uncertainty and highlight the need for more evidence to inform the treatment of youth depression. In the absence of conclusive evidence, guideline developers have to take into account a number of factors, including the need to guide clinicians in their approach to treatment.
Overall completeness and applicability of evidence
With few trials available in each comparison and the availability of data limited, it is difficult to draw conclusions at present about the most effective course of treatment for young people with depression.
Many of the significant outcomes derived from the meta‐analyses were driven by data from the TADS 2004 study. Although this trial is large and the design robust, its generalisability is limited because a significant proportion of participants were recruited for the study through advertisements and may not reflect those young people seen in clinical practice.
Although all studies in the review contained participants with a formal diagnosis of depression on a standardised and validated scale according to DSM‐III or DSM‐IV criteria, there was considerable variability in the study populations. For example, anxiety disorders were comorbid in 50% of the studies (ADAPT 2007; Bernstein 2000; Melvin 2006; TADS 2004; TASA 2009) and alcohol/substance use comorbid in two trials (Deas 2000; Riggs 2007) and one trial was of young males with problematic online gaming (Kim 2012). In one trial all participants were formally diagnosed with an anxiety disorder and school refusal syndrome (Bernstein 2000). While inclusion of these trials widens the diversity of the sample in terms of clinical presentation, it should be noted that in clinical practice, clients who present to services may be even more complex in their presentation. Comorbid diagnoses are common within the adolescent population, and the severity of depression in participants is also varied. The ADAPT 2007 trial also required that a young person had failed to respond to a trial of psychosocial intervention in order to meet entry criteria. This subsample of participants has been described as having "persistent ....depression'' (Harrington 2002), and thus in essence may respond better to a different class of treatment as a function of depression persistence. The difference in study population between ADAPT 2007 (conducted in a clinical population), and TADS 2004 (with high recruitment via advertising,) may limit the appropriateness of performing meta‐analysis on these two populations together.
There was also considerable variation in the type of medication used in the trials. The majority used SSRIs (including fluoxetine, venlafaxine and sertraline), with a couple of trials using a variety of SSRIs, one trial using a TCA, and one an NDRI. Meta‐analyses have shown that SSRIs and newer antidepressants show small but statsitically significant differences on several outcomes compared with placebo (Hetrick 2012) and TCAs have no evidence of efficacy (Hazell 2002). Combining studies with medications that have varying efficacy limits the conclusions that can be drawn from this data set.
Many of the trials reported on adverse effects, and suicide‐related behaviours were also included within that battery of outcomes. However, there was considerable variability in the way in which these data were collected or reported, and it was challenging to extract appropriate and homogenous data suitable for meta‐analysis. It is important to report data concerning suicidality across all treatment approaches in a consistent way so that meaningful comparisons can be made. Brent 2009 found rates of suicidal and non‐suicidal self injury were higher in young people who were systematically monitored for such outcomes. This highlights the importance of collecting suicide‐related measures systematically.
Although there were data on follow‐up to 12 months the diversity in trial design meant that few data could be aggregated.
We were unable to explore the potential modifying effects of age and severity of depression on the results because this type of data was also unavailable.
A strength of our review is that we used remission from disorder, rather than response to treatment because it is a more stringent measure and one that is more closely related to the goals of most people seeking treatment.
Quality of the evidence
We included large scale RCTs such as TADS 2004 (n = 439) and ADAPT 2007 (n = 208) in this review.
In general, the reporting of the conduct of trials allowed adequate evaluation of the risk of bias. Around 50% of trials had adequate sequence generation and allocation concealment. In the majority of trials, outcome assessors were blind to intervention, reducing the chance of experimenter bias. However, as is the nature with administering psychological interventions, many participants in the research trials would have been aware that they were receiving a psychological intervention, which raises the potential for bias in itself. ITT analysis was routinely used in the trials to account for missing data and reported as such. However, for the primary outcome of 'remission by clinical interview' two trials, from which the majority of data were derived, report this on the basis of observed case data only. It is unclear what the impact of missing participants is on the outcome in this case.
There are also potential biases that arise from the design of studies. For example, Clarke 2005 allowed uncontrolled medication (any SSRI of any dose) within the medication arm. A study of comparable design, ADAPT 2007, contained much stricter guidelines around medication management during the experimental period. Furthermore, participants in the medication only group were also administered medication within the context of ongoing clinical care, during which time there was some limited focus on recent family and peer conflicts that could constitute more intensive case management when compared with Clarke 2005. The trial by Kim 2012 similarly included weekly 10‐minute sessions of contact with psychiatrists who asked about progress with regard to online gaming in the medication‐only group. Demonstrating the effectiveness of CBT over and above such an assertive trial of medication, which includes a significant amount of supportive attention from psychiatrists, is likely to be difficult. Variability in the type and quality of the CBT implemented in these trials results in additional difficulties with interpretation. For example, several commentaries have suggested that the CBT implemented in TADS included too many techniques and allowed too much flexibility, meaning that core CBT skills were not delivered in a sufficient dose (Hetrick 2014). The potential to reach conclusions about the relative efficacy of any intervention is compromised by this sort of variability across comparisons.
Potential biases in the review process
The review authors wrote to trialists in order to obtain data relating to the outcomes specific to this review, and sought to locate all published and unpublished trials testing the effect of a psychological therapy or medication against a combination of the two. We obtained some data from some trialists, and we have noted this where applicable. However, not all authors were able to provide data for our outcomes of interest.
Agreements and disagreements with other studies or reviews
Two recent meta‐analyses investigating the efficacy of combined treatment with cognitive behavioural therapy (CBT) in adolescent depression concluded that adding CBT to antidepressants resulted in little additional benefit over and above medication alone (Dubrika 2010; Hetrick 2011). The reviews differed from ours in two ways, only trials which tested new generation SSRIs were included, and trials with 'treatment resistant' participants were included. Authors of these reviews cautioned against making firm conclusions given the limitations of the data. It should be noted that both reviews included the ADAPT 2007 trial. As highlighted above, the context within which participants received medication alone (compared to combination treatment) in this trial was collaborative, and co‐ordinated in nature, meaning that any potential benefits of adjunctive CBT to medication could have been masked by this procedure.
A number of recent reviews have concluded that SSRIs are associated with an increase in suicidal behaviour in children and adolescents (Dubicka 2006; Hammad 2006; Hetrick 2012). There are limited data from this review that suggest that suicidal ideation is more common in participants treated with medication in isolation, compared with psychological therapy at post‐intervention and three‐ to six‐month follow‐up, or a combination of the two at 36‐week follow‐up. The data also suggest that suicidal ideation decreased less with medication only. It is possible that psychological therapy may exert a protective effect against suicidal behaviours when combined with medication.

PRISMA flow diagram: CCDANCTR update search June 2014
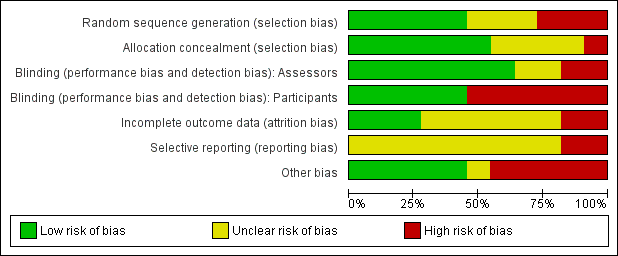
Methodological quality graph: review authors' judgements about each methodological quality item presented as percentages across all included studies.

Comparison 1 Psychological therapy versus antidepressant medication, Outcome 1 Remission by clinical interview (post‐intervention) ITT.
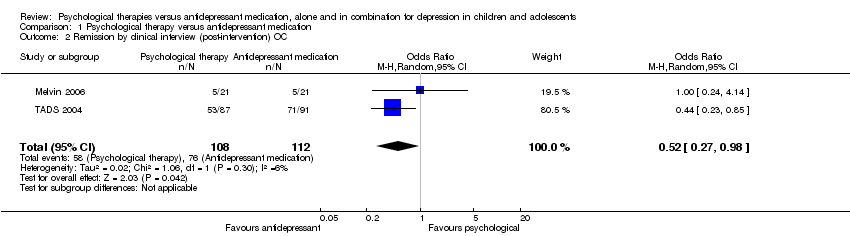
Comparison 1 Psychological therapy versus antidepressant medication, Outcome 2 Remission by clinical interview (post‐intervention) OC.

Comparison 1 Psychological therapy versus antidepressant medication, Outcome 3 Remission by clinical interview (six to nine months follow‐up) ITT.

Comparison 1 Psychological therapy versus antidepressant medication, Outcome 4 Remission by clinical interview (six to nine months follow‐up) OC.
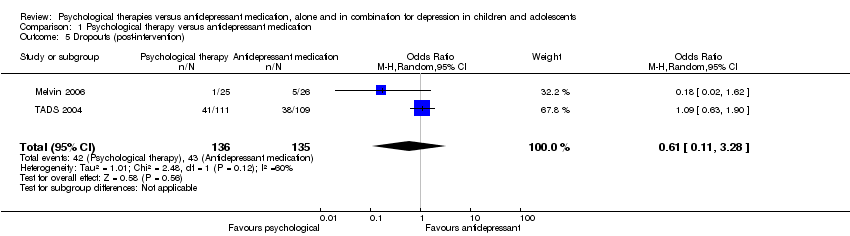
Comparison 1 Psychological therapy versus antidepressant medication, Outcome 5 Dropouts (post‐intervention).

Comparison 1 Psychological therapy versus antidepressant medication, Outcome 6 Dropouts (six to nine months follow‐up).

Comparison 1 Psychological therapy versus antidepressant medication, Outcome 7 Suicidal ideation (post‐intervention).

Comparison 1 Psychological therapy versus antidepressant medication, Outcome 8 Suicidal ideation (six to nine months follow‐up).

Comparison 1 Psychological therapy versus antidepressant medication, Outcome 9 Suicidal ideation (post‐intervention).
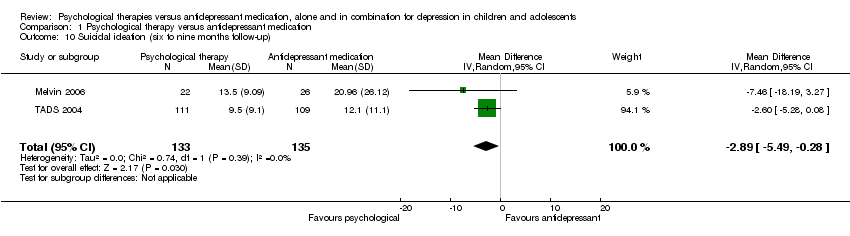
Comparison 1 Psychological therapy versus antidepressant medication, Outcome 10 Suicidal ideation (six to nine months follow‐up).
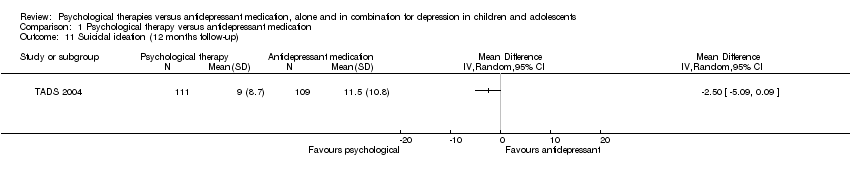
Comparison 1 Psychological therapy versus antidepressant medication, Outcome 11 Suicidal ideation (12 months follow‐up).

Comparison 1 Psychological therapy versus antidepressant medication, Outcome 12 Remission by cut‐off (post‐intervention).

Comparison 1 Psychological therapy versus antidepressant medication, Outcome 13 Remission by cut‐off (six to nine months follow‐up).

Comparison 1 Psychological therapy versus antidepressant medication, Outcome 14 Remission by cut‐off (12 months follow‐up).

Comparison 1 Psychological therapy versus antidepressant medication, Outcome 15 Depression symptoms clinician rated (CDRS‐R) (post‐intervention).

Comparison 1 Psychological therapy versus antidepressant medication, Outcome 16 Depression symptoms clinician rated (CDRS‐R) (six to nine months follow‐up).
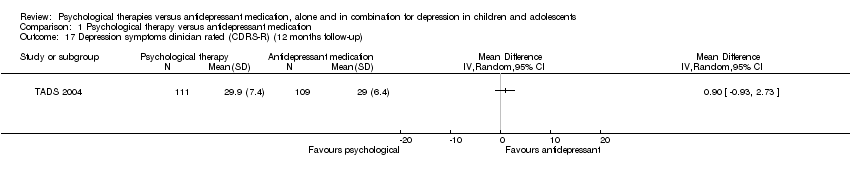
Comparison 1 Psychological therapy versus antidepressant medication, Outcome 17 Depression symptoms clinician rated (CDRS‐R) (12 months follow‐up).

Comparison 1 Psychological therapy versus antidepressant medication, Outcome 18 Depression symptoms self rated (post‐intervention).
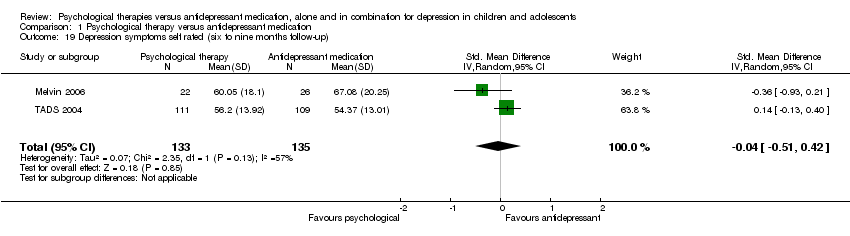
Comparison 1 Psychological therapy versus antidepressant medication, Outcome 19 Depression symptoms self rated (six to nine months follow‐up).

Comparison 1 Psychological therapy versus antidepressant medication, Outcome 20 Depression symptoms self rated (12 months follow‐up).

Comparison 1 Psychological therapy versus antidepressant medication, Outcome 21 Functioning (post‐intervention).
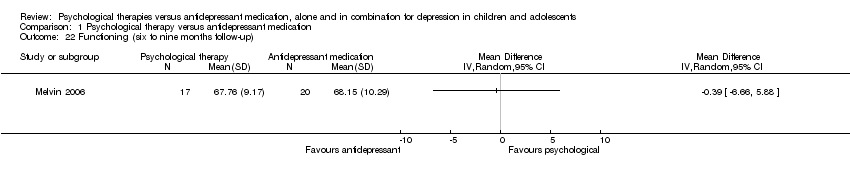
Comparison 1 Psychological therapy versus antidepressant medication, Outcome 22 Functioning (six to nine months follow‐up).
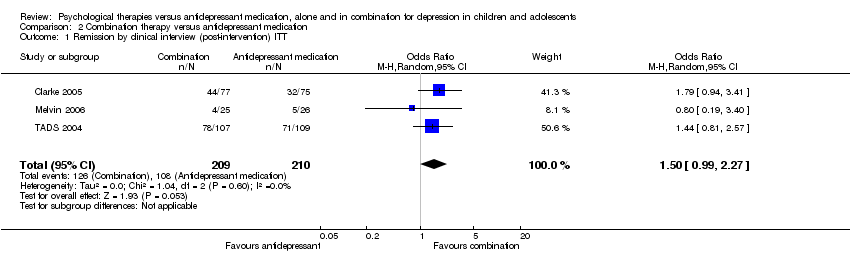
Comparison 2 Combination therapy versus antidepressant medication, Outcome 1 Remission by clinical interview (post‐intervention) ITT.
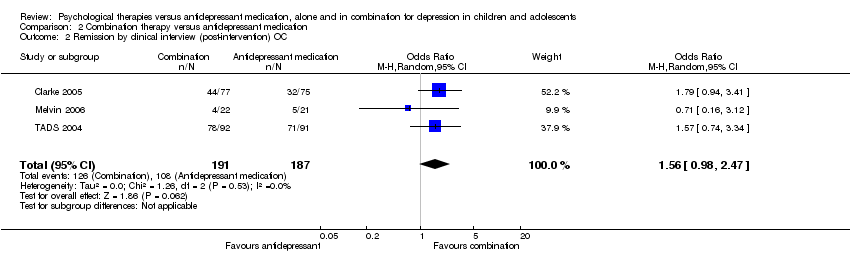
Comparison 2 Combination therapy versus antidepressant medication, Outcome 2 Remission by clinical interview (post‐intervention) OC.

Comparison 2 Combination therapy versus antidepressant medication, Outcome 3 Remission by clinical interview (six to nine months follow‐up) ITT.
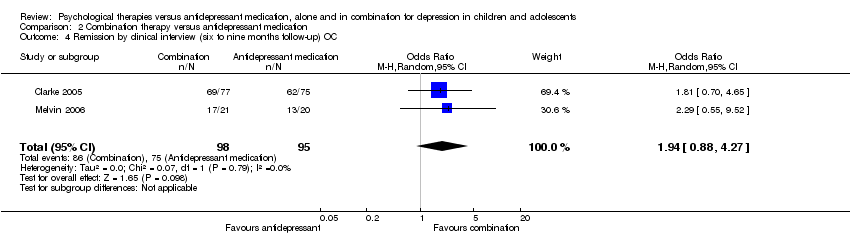
Comparison 2 Combination therapy versus antidepressant medication, Outcome 4 Remission by clinical interview (six to nine months follow‐up) OC.
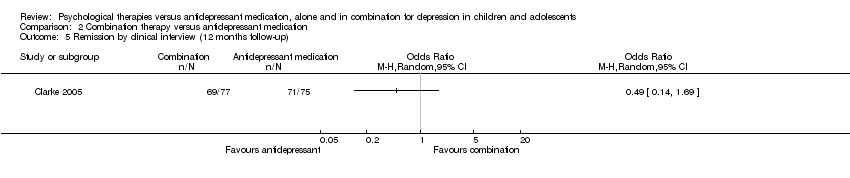
Comparison 2 Combination therapy versus antidepressant medication, Outcome 5 Remission by clinical interview (12 months follow‐up).

Comparison 2 Combination therapy versus antidepressant medication, Outcome 6 Dropouts (post‐intervention).

Comparison 2 Combination therapy versus antidepressant medication, Outcome 7 Dropouts (six to nine months follow‐up).

Comparison 2 Combination therapy versus antidepressant medication, Outcome 8 Dropouts (12 months follow‐up).
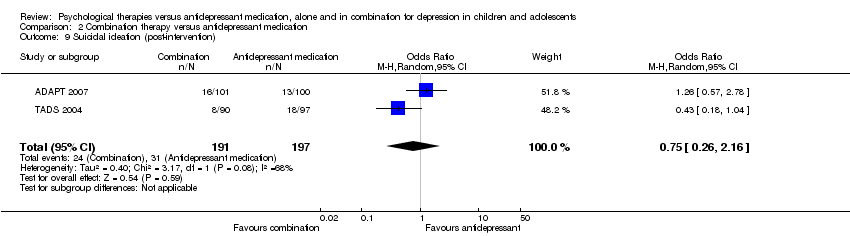
Comparison 2 Combination therapy versus antidepressant medication, Outcome 9 Suicidal ideation (post‐intervention).

Comparison 2 Combination therapy versus antidepressant medication, Outcome 10 Suicidal ideation (six to nine months follow‐up).

Comparison 2 Combination therapy versus antidepressant medication, Outcome 11 Suicidal ideation (12 months follow‐up).
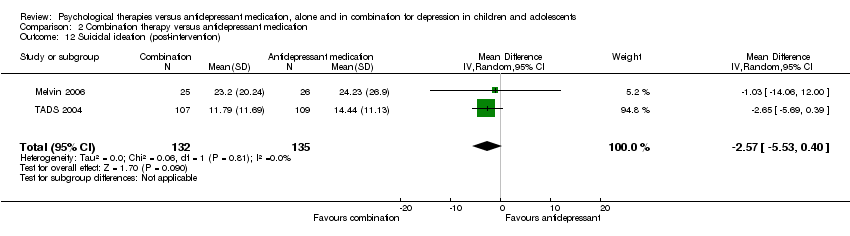
Comparison 2 Combination therapy versus antidepressant medication, Outcome 12 Suicidal ideation (post‐intervention).

Comparison 2 Combination therapy versus antidepressant medication, Outcome 13 Suicidal ideation (six to nine months follow‐up).

Comparison 2 Combination therapy versus antidepressant medication, Outcome 14 Suicidal ideation (12 months follow‐up).

Comparison 2 Combination therapy versus antidepressant medication, Outcome 15 Remission by cut‐off (post‐intervention).
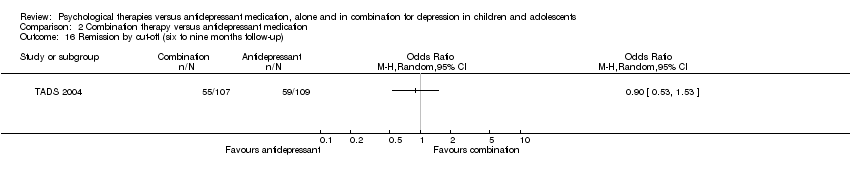
Comparison 2 Combination therapy versus antidepressant medication, Outcome 16 Remission by cut‐off (six to nine months follow‐up).

Comparison 2 Combination therapy versus antidepressant medication, Outcome 17 Remission by cut‐off (12 months follow‐up).
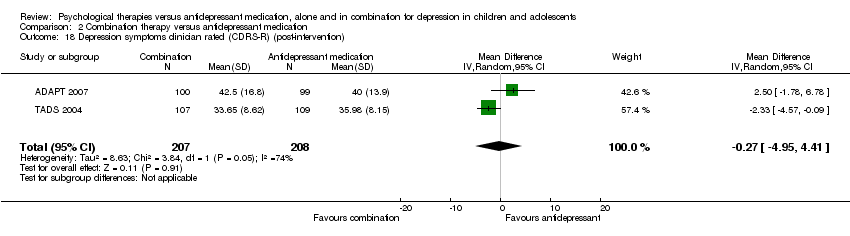
Comparison 2 Combination therapy versus antidepressant medication, Outcome 18 Depression symptoms clinician rated (CDRS‐R) (post‐intervention).
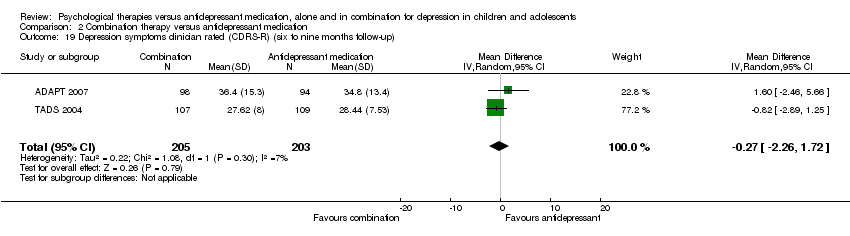
Comparison 2 Combination therapy versus antidepressant medication, Outcome 19 Depression symptoms clinician rated (CDRS‐R) (six to nine months follow‐up).

Comparison 2 Combination therapy versus antidepressant medication, Outcome 20 Depression symptoms clinician rated (CDRS‐R) (12 months follow‐up).

Comparison 2 Combination therapy versus antidepressant medication, Outcome 21 Depression symptoms self rated (post‐intervention).
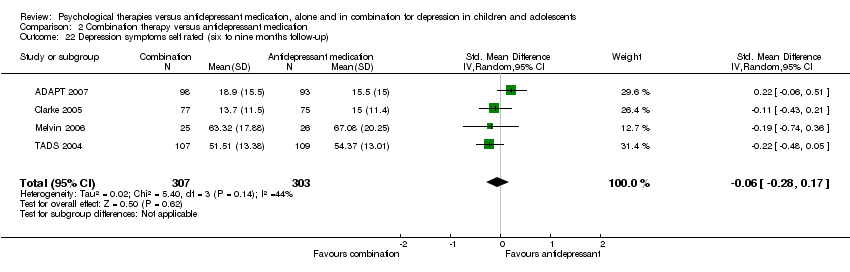
Comparison 2 Combination therapy versus antidepressant medication, Outcome 22 Depression symptoms self rated (six to nine months follow‐up).

Comparison 2 Combination therapy versus antidepressant medication, Outcome 23 Depression symptoms self rated (12 months follow‐up).

Comparison 2 Combination therapy versus antidepressant medication, Outcome 24 Functioning (post‐intervention).

Comparison 2 Combination therapy versus antidepressant medication, Outcome 25 Functioning (six to nine months follow‐up).

Comparison 2 Combination therapy versus antidepressant medication, Outcome 26 Functioning (12 months follow‐up).
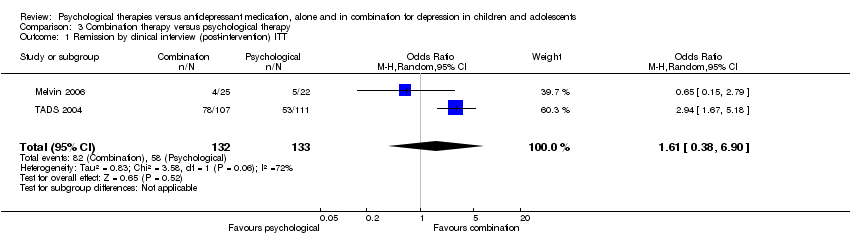
Comparison 3 Combination therapy versus psychological therapy, Outcome 1 Remission by clinical interview (post‐intervention) ITT.
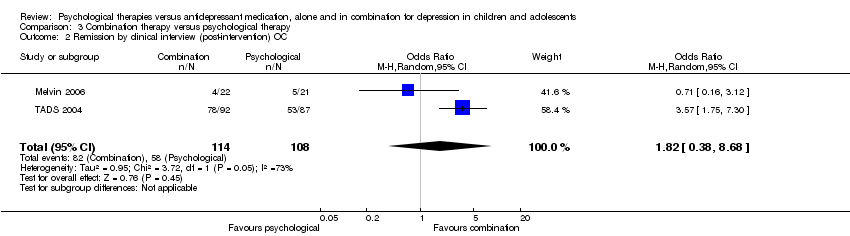
Comparison 3 Combination therapy versus psychological therapy, Outcome 2 Remission by clinical interview (post‐intervention) OC.

Comparison 3 Combination therapy versus psychological therapy, Outcome 3 Remission by clinical interview (six to nine months follow‐up) ITT.

Comparison 3 Combination therapy versus psychological therapy, Outcome 4 Remission by clinical interview (six to nine months follow‐up) OC.
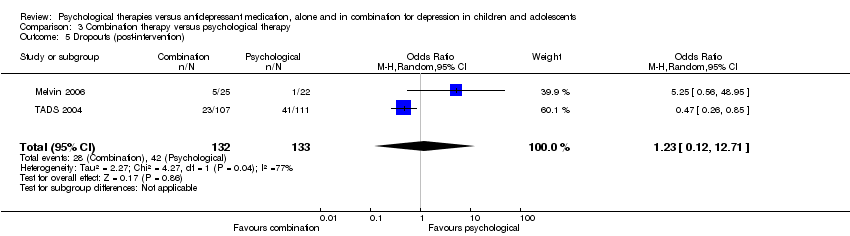
Comparison 3 Combination therapy versus psychological therapy, Outcome 5 Dropouts (post‐intervention).

Comparison 3 Combination therapy versus psychological therapy, Outcome 6 Dropouts (six to nine months follow‐up).

Comparison 3 Combination therapy versus psychological therapy, Outcome 7 Suicidal ideation (post‐intervention).

Comparison 3 Combination therapy versus psychological therapy, Outcome 8 Suicidal ideation (six to nine months follow‐up).

Comparison 3 Combination therapy versus psychological therapy, Outcome 9 Suicidal ideation (post‐intervention).

Comparison 3 Combination therapy versus psychological therapy, Outcome 10 Suicidal ideation (six to nine months follow‐up).

Comparison 3 Combination therapy versus psychological therapy, Outcome 11 Suicidal ideation (12 months follow‐up).

Comparison 3 Combination therapy versus psychological therapy, Outcome 12 Remission by cut‐off (post‐intervention).

Comparison 3 Combination therapy versus psychological therapy, Outcome 13 Remission by cut‐off (six to nine months follow‐up).
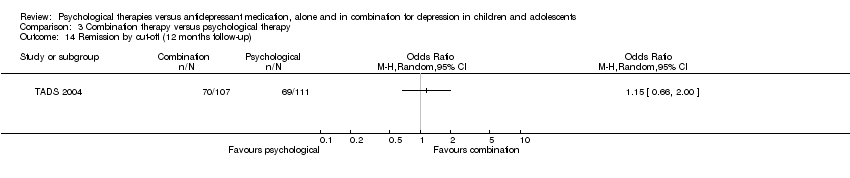
Comparison 3 Combination therapy versus psychological therapy, Outcome 14 Remission by cut‐off (12 months follow‐up).

Comparison 3 Combination therapy versus psychological therapy, Outcome 15 Depression symptoms clinician rated (CDRS‐R) (post‐intervention).
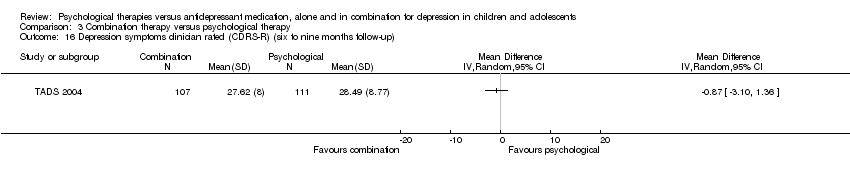
Comparison 3 Combination therapy versus psychological therapy, Outcome 16 Depression symptoms clinician rated (CDRS‐R) (six to nine months follow‐up).

Comparison 3 Combination therapy versus psychological therapy, Outcome 17 Depression symptoms clinician rated (CDRS‐R) (12 months follow‐up).
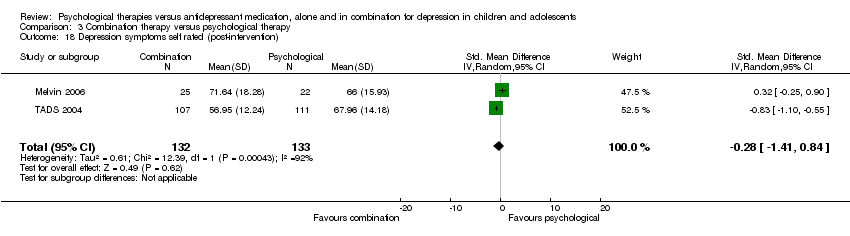
Comparison 3 Combination therapy versus psychological therapy, Outcome 18 Depression symptoms self rated (post‐intervention).
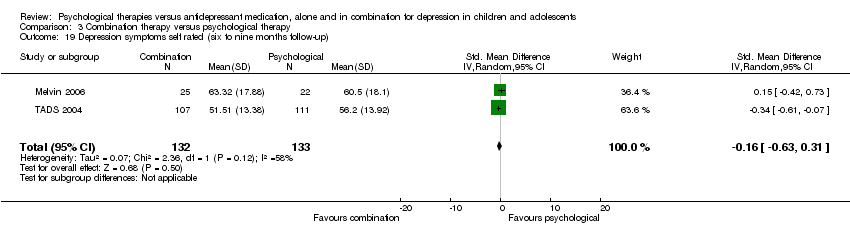
Comparison 3 Combination therapy versus psychological therapy, Outcome 19 Depression symptoms self rated (six to nine months follow‐up).

Comparison 3 Combination therapy versus psychological therapy, Outcome 20 Depression symptoms self rated (12 months follow‐up).

Comparison 3 Combination therapy versus psychological therapy, Outcome 21 Functioning (post‐intervention).

Comparison 3 Combination therapy versus psychological therapy, Outcome 22 Functioning (six to nine months follow‐up).

Comparison 4 Combination therapy versus psychological therapy plus placebo, Outcome 1 Dropouts (post‐intervention).

Comparison 4 Combination therapy versus psychological therapy plus placebo, Outcome 2 Suicidal ideation (post‐intervention).

Comparison 4 Combination therapy versus psychological therapy plus placebo, Outcome 3 Remission by cut‐off (post‐intervention).
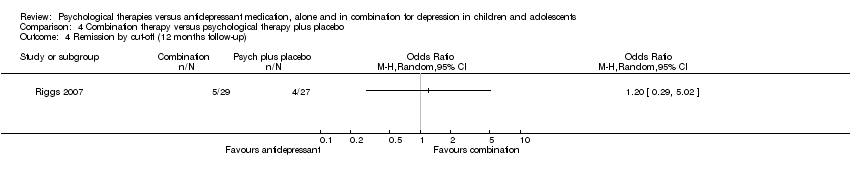
Comparison 4 Combination therapy versus psychological therapy plus placebo, Outcome 4 Remission by cut‐off (12 months follow‐up).

Comparison 4 Combination therapy versus psychological therapy plus placebo, Outcome 5 Depression symptoms clinician rated (CDRS‐R) (post‐intervention).
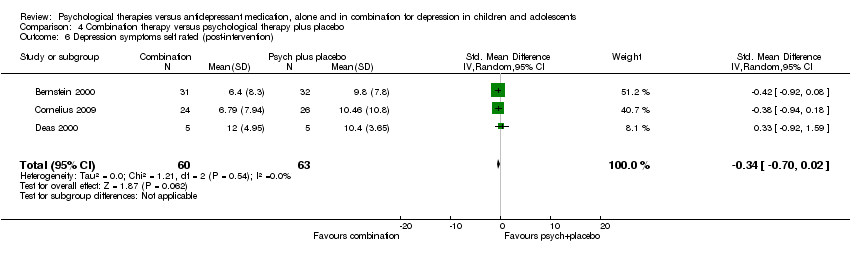
Comparison 4 Combination therapy versus psychological therapy plus placebo, Outcome 6 Depression symptoms self rated (post‐intervention).
| Outcome or subgroup title | No. of studies | No. of participants | Statistical method | Effect size |
| 1 Remission by clinical interview (post‐intervention) ITT Show forest plot | 2 | 268 | Odds Ratio (M‐H, Random, 95% CI) | 0.62 [0.28, 1.35] |
| 2 Remission by clinical interview (post‐intervention) OC Show forest plot | 2 | 220 | Odds Ratio (M‐H, Random, 95% CI) | 0.52 [0.27, 0.98] |
| 3 Remission by clinical interview (six to nine months follow‐up) ITT Show forest plot | 1 | Odds Ratio (M‐H, Random, 95% CI) | Totals not selected | |
| 4 Remission by clinical interview (six to nine months follow‐up) OC Show forest plot | 1 | Odds Ratio (M‐H, Random, 95% CI) | Totals not selected | |
| 5 Dropouts (post‐intervention) Show forest plot | 2 | 271 | Odds Ratio (M‐H, Random, 95% CI) | 0.61 [0.11, 3.28] |
| 6 Dropouts (six to nine months follow‐up) Show forest plot | 2 | 223 | Odds Ratio (M‐H, Random, 95% CI) | 1.17 [0.63, 2.19] |
| 7 Suicidal ideation (post‐intervention) Show forest plot | 1 | Odds Ratio (M‐H, Random, 95% CI) | Totals not selected | |
| 8 Suicidal ideation (six to nine months follow‐up) Show forest plot | 1 | Odds Ratio (M‐H, Random, 95% CI) | Totals not selected | |
| 9 Suicidal ideation (post‐intervention) Show forest plot | 2 | 268 | Mean Difference (IV, Random, 95% CI) | ‐3.12 [‐5.91, ‐0.33] |
| 10 Suicidal ideation (six to nine months follow‐up) Show forest plot | 2 | 268 | Mean Difference (IV, Random, 95% CI) | ‐2.89 [‐5.49, ‐0.28] |
| 11 Suicidal ideation (12 months follow‐up) Show forest plot | 1 | Mean Difference (IV, Random, 95% CI) | Totals not selected | |
| 12 Remission by cut‐off (post‐intervention) Show forest plot | 1 | Odds Ratio (M‐H, Random, 95% CI) | Totals not selected | |
| 13 Remission by cut‐off (six to nine months follow‐up) Show forest plot | 1 | Odds Ratio (M‐H, Random, 95% CI) | Totals not selected | |
| 14 Remission by cut‐off (12 months follow‐up) Show forest plot | 1 | Odds Ratio (M‐H, Random, 95% CI) | Totals not selected | |
| 15 Depression symptoms clinician rated (CDRS‐R) (post‐intervention) Show forest plot | 1 | Mean Difference (IV, Random, 95% CI) | Totals not selected | |
| 16 Depression symptoms clinician rated (CDRS‐R) (six to nine months follow‐up) Show forest plot | 1 | Mean Difference (IV, Random, 95% CI) | Totals not selected | |
| 17 Depression symptoms clinician rated (CDRS‐R) (12 months follow‐up) Show forest plot | 1 | Mean Difference (IV, Random, 95% CI) | Totals not selected | |
| 18 Depression symptoms self rated (post‐intervention) Show forest plot | 2 | 255 | Std. Mean Difference (IV, Random, 95% CI) | 0.16 [‐0.69, 1.01] |
| 19 Depression symptoms self rated (six to nine months follow‐up) Show forest plot | 2 | 268 | Std. Mean Difference (IV, Random, 95% CI) | ‐0.04 [‐0.51, 0.42] |
| 20 Depression symptoms self rated (12 months follow‐up) Show forest plot | 1 | Mean Difference (IV, Random, 95% CI) | Totals not selected | |
| 21 Functioning (post‐intervention) Show forest plot | 1 | Mean Difference (IV, Random, 95% CI) | Totals not selected | |
| 22 Functioning (six to nine months follow‐up) Show forest plot | 1 | Mean Difference (IV, Random, 95% CI) | Totals not selected | |
| Outcome or subgroup title | No. of studies | No. of participants | Statistical method | Effect size |
| 1 Remission by clinical interview (post‐intervention) ITT Show forest plot | 3 | 419 | Odds Ratio (M‐H, Random, 95% CI) | 1.50 [0.99, 2.27] |
| 2 Remission by clinical interview (post‐intervention) OC Show forest plot | 3 | 378 | Odds Ratio (M‐H, Random, 95% CI) | 1.56 [0.98, 2.47] |
| 3 Remission by clinical interview (six to nine months follow‐up) ITT Show forest plot | 2 | 203 | Odds Ratio (M‐H, Random, 95% CI) | 1.93 [0.93, 4.00] |
| 4 Remission by clinical interview (six to nine months follow‐up) OC Show forest plot | 2 | 193 | Odds Ratio (M‐H, Random, 95% CI) | 1.94 [0.88, 4.27] |
| 5 Remission by clinical interview (12 months follow‐up) Show forest plot | 1 | Odds Ratio (M‐H, Random, 95% CI) | Totals not selected | |
| 6 Dropouts (post‐intervention) Show forest plot | 5 | 699 | Odds Ratio (M‐H, Random, 95% CI) | 0.84 [0.51, 1.39] |
| 7 Dropouts (six to nine months follow‐up) Show forest plot | 3 | 420 | Odds Ratio (M‐H, Random, 95% CI) | 0.94 [0.54, 1.64] |
| 8 Dropouts (12 months follow‐up) Show forest plot | 1 | Odds Ratio (M‐H, Random, 95% CI) | Totals not selected | |
| 9 Suicidal ideation (post‐intervention) Show forest plot | 2 | 388 | Odds Ratio (M‐H, Random, 95% CI) | 0.75 [0.26, 2.16] |
| 10 Suicidal ideation (six to nine months follow‐up) Show forest plot | 2 | 344 | Odds Ratio (M‐H, Random, 95% CI) | 0.53 [0.06, 4.58] |
| 11 Suicidal ideation (12 months follow‐up) Show forest plot | 1 | Odds Ratio (M‐H, Random, 95% CI) | Totals not selected | |
| 12 Suicidal ideation (post‐intervention) Show forest plot | 2 | 267 | Mean Difference (IV, Random, 95% CI) | ‐2.57 [‐5.53, 0.40] |
| 13 Suicidal ideation (six to nine months follow‐up) Show forest plot | 2 | 267 | Mean Difference (IV, Random, 95% CI) | ‐1.89 [‐4.50, 0.72] |
| 14 Suicidal ideation (12 months follow‐up) Show forest plot | 1 | Mean Difference (IV, Random, 95% CI) | Totals not selected | |
| 15 Remission by cut‐off (post‐intervention) Show forest plot | 1 | Odds Ratio (M‐H, Random, 95% CI) | Totals not selected | |
| 16 Remission by cut‐off (six to nine months follow‐up) Show forest plot | 1 | Odds Ratio (M‐H, Random, 95% CI) | Totals not selected | |
| 17 Remission by cut‐off (12 months follow‐up) Show forest plot | 2 | 319 | Odds Ratio (M‐H, Random, 95% CI) | 1.45 [0.60, 3.52] |
| 18 Depression symptoms clinician rated (CDRS‐R) (post‐intervention) Show forest plot | 2 | 415 | Mean Difference (IV, Random, 95% CI) | ‐0.27 [‐4.95, 4.41] |
| 19 Depression symptoms clinician rated (CDRS‐R) (six to nine months follow‐up) Show forest plot | 2 | 408 | Mean Difference (IV, Random, 95% CI) | ‐0.27 [‐2.26, 1.72] |
| 20 Depression symptoms clinician rated (CDRS‐R) (12 months follow‐up) Show forest plot | 1 | Mean Difference (IV, Random, 95% CI) | Totals not selected | |
| 21 Depression symptoms self rated (post‐intervention) Show forest plot | 5 | 683 | Std. Mean Difference (IV, Random, 95% CI) | ‐0.14 [‐0.36, 0.09] |
| 22 Depression symptoms self rated (six to nine months follow‐up) Show forest plot | 4 | 610 | Std. Mean Difference (IV, Random, 95% CI) | ‐0.06 [‐0.28, 0.17] |
| 23 Depression symptoms self rated (12 months follow‐up) Show forest plot | 2 | 368 | Std. Mean Difference (IV, Random, 95% CI) | ‐0.26 [‐0.46, ‐0.05] |
| 24 Functioning (post‐intervention) Show forest plot | 3 | 396 | Std. Mean Difference (IV, Random, 95% CI) | 0.09 [‐0.11, 0.28] |
| 25 Functioning (six to nine months follow‐up) Show forest plot | 3 | 385 | Std. Mean Difference (IV, Random, 95% CI) | 0.08 [‐0.12, 0.28] |
| 26 Functioning (12 months follow‐up) Show forest plot | 1 | Mean Difference (IV, Random, 95% CI) | Totals not selected | |
| Outcome or subgroup title | No. of studies | No. of participants | Statistical method | Effect size |
| 1 Remission by clinical interview (post‐intervention) ITT Show forest plot | 2 | 265 | Odds Ratio (M‐H, Random, 95% CI) | 1.61 [0.38, 6.90] |
| 2 Remission by clinical interview (post‐intervention) OC Show forest plot | 2 | 222 | Odds Ratio (M‐H, Random, 95% CI) | 1.82 [0.38, 8.68] |
| 3 Remission by clinical interview (six to nine months follow‐up) ITT Show forest plot | 1 | Odds Ratio (M‐H, Random, 95% CI) | Totals not selected | |
| 4 Remission by clinical interview (six to nine months follow‐up) OC Show forest plot | 1 | Odds Ratio (M‐H, Random, 95% CI) | Totals not selected | |
| 5 Dropouts (post‐intervention) Show forest plot | 2 | 265 | Odds Ratio (M‐H, Random, 95% CI) | 1.23 [0.12, 12.71] |
| 6 Dropouts (six to nine months follow‐up) Show forest plot | 2 | 231 | Odds Ratio (M‐H, Random, 95% CI) | 0.75 [0.40, 1.42] |
| 7 Suicidal ideation (post‐intervention) Show forest plot | 1 | Odds Ratio (M‐H, Random, 95% CI) | Totals not selected | |
| 8 Suicidal ideation (six to nine months follow‐up) Show forest plot | 1 | Odds Ratio (M‐H, Random, 95% CI) | Totals not selected | |
| 9 Suicidal ideation (post‐intervention) Show forest plot | 2 | 265 | Mean Difference (IV, Random, 95% CI) | 0.60 [‐2.25, 3.45] |
| 10 Suicidal ideation (six to nine months follow‐up) Show forest plot | 2 | 265 | Mean Difference (IV, Random, 95% CI) | 1.78 [‐2.29, 5.85] |
| 11 Suicidal ideation (12 months follow‐up) Show forest plot | 1 | Mean Difference (IV, Random, 95% CI) | Totals not selected | |
| 12 Remission by cut‐off (post‐intervention) Show forest plot | 1 | Odds Ratio (M‐H, Random, 95% CI) | Totals not selected | |
| 13 Remission by cut‐off (six to nine months follow‐up) Show forest plot | 1 | Odds Ratio (M‐H, Random, 95% CI) | Totals not selected | |
| 14 Remission by cut‐off (12 months follow‐up) Show forest plot | 1 | Odds Ratio (M‐H, Random, 95% CI) | Totals not selected | |
| 15 Depression symptoms clinician rated (CDRS‐R) (post‐intervention) Show forest plot | 1 | Mean Difference (IV, Random, 95% CI) | Totals not selected | |
| 16 Depression symptoms clinician rated (CDRS‐R) (six to nine months follow‐up) Show forest plot | 1 | Mean Difference (IV, Random, 95% CI) | Totals not selected | |
| 17 Depression symptoms clinician rated (CDRS‐R) (12 months follow‐up) Show forest plot | 1 | Mean Difference (IV, Random, 95% CI) | Totals not selected | |
| 18 Depression symptoms self rated (post‐intervention) Show forest plot | 2 | 265 | Std. Mean Difference (IV, Random, 95% CI) | ‐0.28 [‐1.41, 0.84] |
| 19 Depression symptoms self rated (six to nine months follow‐up) Show forest plot | 2 | 265 | Std. Mean Difference (IV, Random, 95% CI) | ‐0.16 [‐0.63, 0.31] |
| 20 Depression symptoms self rated (12 months follow‐up) Show forest plot | 1 | Mean Difference (IV, Random, 95% CI) | Totals not selected | |
| 21 Functioning (post‐intervention) Show forest plot | 1 | Mean Difference (IV, Random, 95% CI) | Totals not selected | |
| 22 Functioning (six to nine months follow‐up) Show forest plot | 1 | Mean Difference (IV, Random, 95% CI) | Totals not selected | |
| Outcome or subgroup title | No. of studies | No. of participants | Statistical method | Effect size |
| 1 Dropouts (post‐intervention) Show forest plot | 4 | 249 | Odds Ratio (M‐H, Random, 95% CI) | 0.98 [0.42, 2.28] |
| 2 Suicidal ideation (post‐intervention) Show forest plot | 1 | Mean Difference (IV, Random, 95% CI) | Totals not selected | |
| 3 Remission by cut‐off (post‐intervention) Show forest plot | 2 | 173 | Odds Ratio (M‐H, Random, 95% CI) | 2.15 [1.15, 4.02] |
| 4 Remission by cut‐off (12 months follow‐up) Show forest plot | 1 | Odds Ratio (M‐H, Random, 95% CI) | Totals not selected | |
| 5 Depression symptoms clinician rated (CDRS‐R) (post‐intervention) Show forest plot | 3 | 239 | Std. Mean Difference (IV, Random, 95% CI) | ‐0.52 [‐0.78, ‐0.26] |
| 6 Depression symptoms self rated (post‐intervention) Show forest plot | 3 | 123 | Std. Mean Difference (IV, Random, 95% CI) | ‐0.34 [‐0.70, 0.02] |