| 1 Exercise capacity (mean change in metres) Show forest plot | 4 | | Mean Difference (IV, Fixed, 95% CI) | Subtotals only |
|
| 1.1 Functional ‐ six‐minute walk test | 3 | 62 | Mean Difference (IV, Fixed, 95% CI) | 10.85 [‐10.82, 32.51] |
| 1.2 Peak ‐ incremental shuttle walk test | 2 | 59 | Mean Difference (IV, Fixed, 95% CI) | 9.36 [‐15.22, 33.95] |
| 1.3 Endurance ‐ endurance shuttle walk test | 2 | 59 | Mean Difference (IV, Fixed, 95% CI) | 313.17 [232.35, 393.99] |
| 2 Quality of life (mean change in total scores) Show forest plot | 4 | 89 | Std. Mean Difference (IV, Fixed, 95% CI) | ‐0.15 [‐0.58, 0.28] |
|
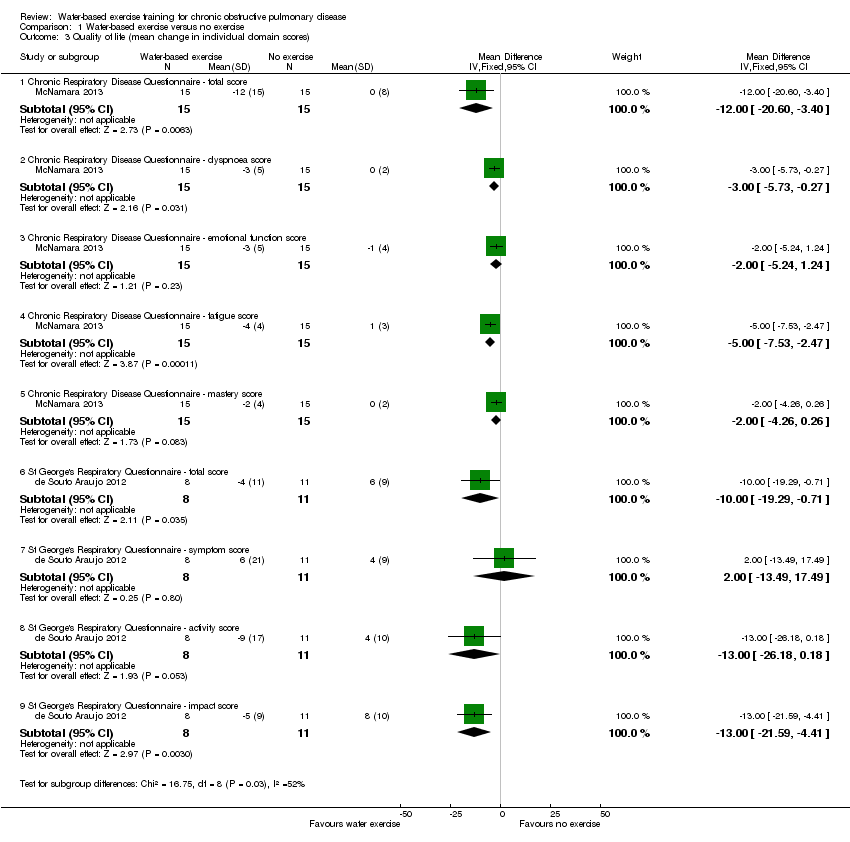
| 3 Quality of life (mean change in individual domain scores) Show forest plot | 4 | | Mean Difference (IV, Fixed, 95% CI) | Subtotals only |
|
| 3.1 Chronic Respiratory Disease Questionnaire ‐ total score | 1 | 30 | Mean Difference (IV, Fixed, 95% CI) | ‐8.0 [‐16.38, 0.38] |
| 3.2 Chronic Respiratory Disease Questionnaire ‐ dyspnoea score | 1 | 30 | Mean Difference (IV, Fixed, 95% CI) | ‐2.0 [‐4.73, 0.73] |
| 3.3 Chronic Respiratory Disease Questionnaire ‐ emotional function score | 1 | 30 | Mean Difference (IV, Fixed, 95% CI) | ‐2.0 [‐5.24, 1.24] |
| 3.4 Chronic Respiratory Disease Questionnaire ‐ fatigue score | 1 | 30 | Mean Difference (IV, Fixed, 95% CI) | ‐3.0 [‐5.26, ‐0.74] |
| 3.5 Chronic Respiratory Disease Questionnaire ‐ mastery score | 1 | 30 | Mean Difference (IV, Fixed, 95% CI) | ‐1.0 [‐3.26, 1.26] |
| 3.6 St George's Respiratory Questionnaire ‐ total score | 3 | 60 | Mean Difference (IV, Fixed, 95% CI) | 0.31 [‐4.14, 4.75] |
| 3.7 St George's Respiratory Questionnaire ‐ symptom score | 3 | 59 | Mean Difference (IV, Fixed, 95% CI) | 7.84 [‐3.06, 18.74] |
| 3.8 St George's Respiratory Questionnaire ‐ activity score | 3 | 59 | Mean Difference (IV, Fixed, 95% CI) | ‐2.82 [‐7.67, 2.04] |
| 3.9 St George's Respiratory Questionnaire ‐ impact score | 3 | 59 | Mean Difference (IV, Fixed, 95% CI) | ‐0.49 [‐4.44, 3.45] |
| 4 Pulmonary function (mean change) Show forest plot | 3 | | Mean Difference (IV, Fixed, 95% CI) | Subtotals only |
|
| 4.1 FEV1 (litres) | 2 | 41 | Mean Difference (IV, Fixed, 95% CI) | 0.08 [‐0.04, 0.19] |
| 4.2 FEV1 (% predicted) | 3 | 62 | Mean Difference (IV, Fixed, 95% CI) | 0.21 [‐2.88, 3.31] |
| 4.3 FVC (litres) | 2 | 41 | Mean Difference (IV, Fixed, 95% CI) | 0.12 [‐0.04, 0.28] |
| 4.4 FVC (% predicted) | 2 | 51 | Mean Difference (IV, Fixed, 95% CI) | 2.89 [‐4.24, 10.02] |
| 4.5 FEV1/FVC ratio (%) | 3 | 62 | Mean Difference (IV, Fixed, 95% CI) | 2.22 [‐1.89, 6.34] |
| 5 Respiratory muscle strength (mean change) Show forest plot | 2 | | Mean Difference (IV, Fixed, 95% CI) | Subtotals only |
|
| 5.1 MIP (cm H2O) | 2 | 51 | Mean Difference (IV, Fixed, 95% CI) | 0.06 [‐7.21, 7.34] |
| 5.2 MIP (% predicted) | 2 | 51 | Mean Difference (IV, Fixed, 95% CI) | 3.40 [‐5.77, 12.58] |
| 5.3 MEP (cm H2O) | 2 | 51 | Mean Difference (IV, Fixed, 95% CI) | ‐6.80 [‐16.42, 2.83] |
| 5.4 MEP (% predicted) | 2 | 51 | Mean Difference (IV, Fixed, 95% CI) | ‐3.88 [‐13.88, 6.12] |
| 6 Body composition (mean change in kilograms) Show forest plot | 2 | 59 | Mean Difference (IV, Fixed, 95% CI) | ‐1.29 [‐2.65, 0.07] |
|
| 7 Attendance (mean number) Show forest plot | 2 | | Std. Mean Difference (IV, Fixed, 95% CI) | Subtotals only |
|
| 7.1 Attendance at supervised exercise sessions | 2 | 41 | Std. Mean Difference (IV, Fixed, 95% CI) | 0.44 [‐0.18, 1.07] |