| 1 Pain (muscle soreness: various scales Likert and VAS) Show forest plot | 12 | | Std. Mean Difference (IV, Fixed, 95% CI) | Subtotals only |
|
| 1.1 Immediately post intervention | 7 | 128 | Std. Mean Difference (IV, Fixed, 95% CI) | ‐0.07 [‐0.43, 0.28] |
| 1.2 24 hours | 10 | 218 | Std. Mean Difference (IV, Fixed, 95% CI) | ‐0.55 [‐0.84, ‐0.27] |
| 1.3 48 hours | 8 | 179 | Std. Mean Difference (IV, Fixed, 95% CI) | ‐0.66 [‐0.97, ‐0.35] |
| 1.4 72 hours | 4 | 104 | Std. Mean Difference (IV, Fixed, 95% CI) | ‐0.93 [‐1.36, ‐0.51] |
| 1.5 96 hours | 5 | 97 | Std. Mean Difference (IV, Fixed, 95% CI) | ‐0.58 [1.00, ‐0.16] |
| 2 Pain ‐ random effects analysis (muscle soreness: various scales Likert and VAS) Show forest plot | 12 | | Std. Mean Difference (IV, Random, 95% CI) | Subtotals only |
|
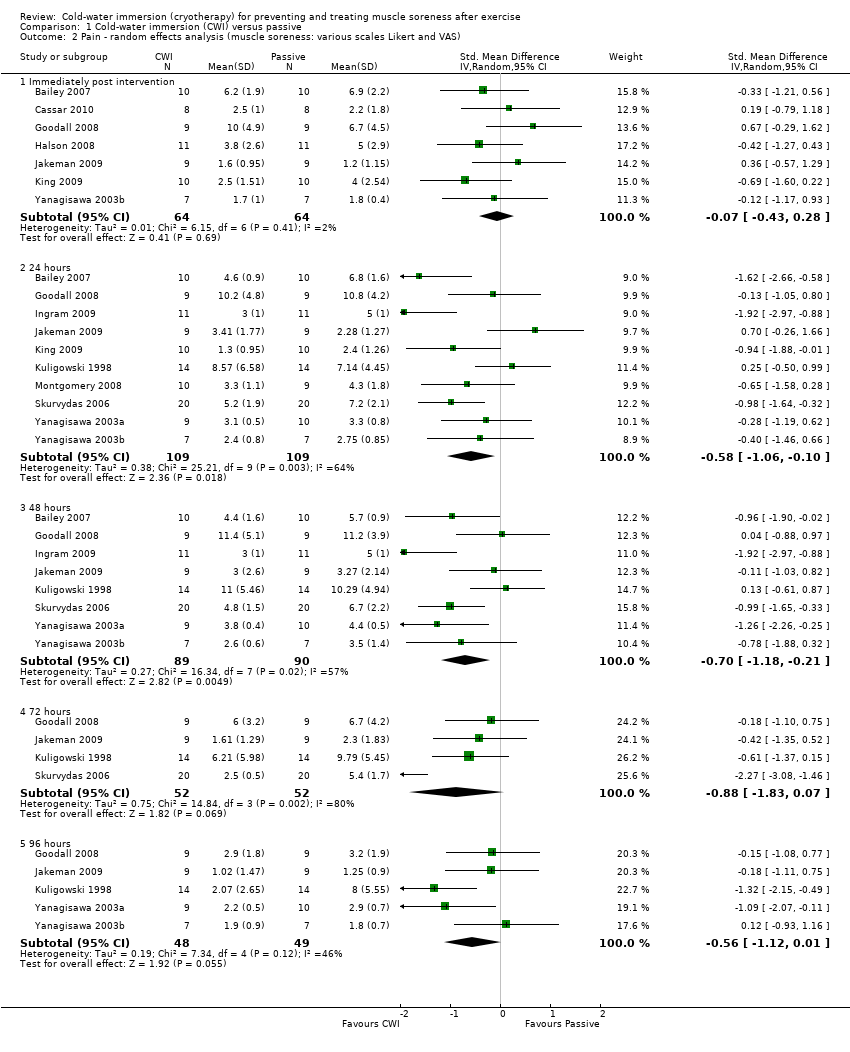
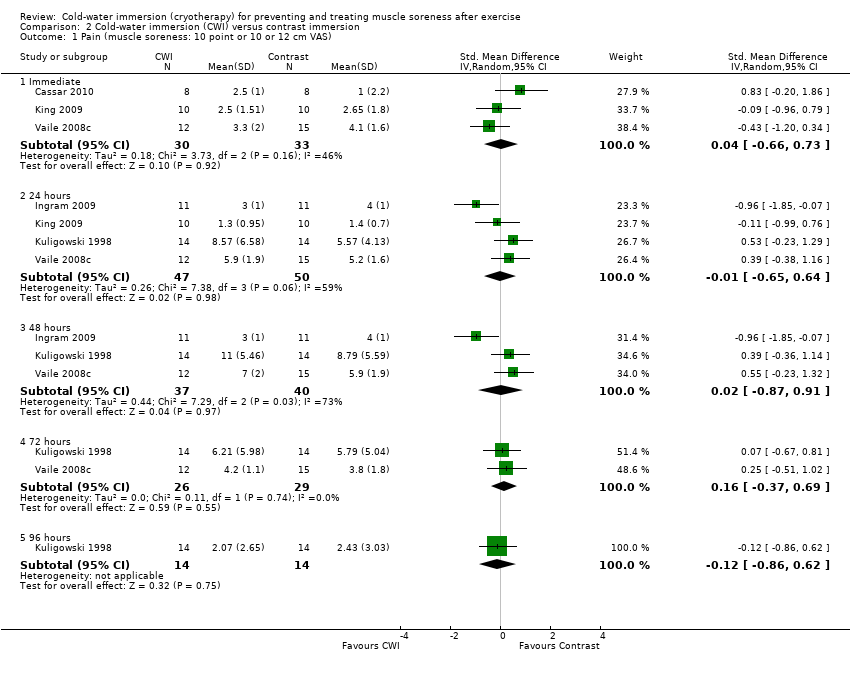
| 2.1 Immediately post intervention | 7 | 128 | Std. Mean Difference (IV, Random, 95% CI) | ‐0.07 [‐0.43, 0.28] |
| 2.2 24 hours | 10 | 218 | Std. Mean Difference (IV, Random, 95% CI) | ‐0.58 [‐1.06, ‐0.10] |
| 2.3 48 hours | 8 | 179 | Std. Mean Difference (IV, Random, 95% CI) | ‐0.70 [‐1.18, ‐0.21] |
| 2.4 72 hours | 4 | 104 | Std. Mean Difference (IV, Random, 95% CI) | ‐0.88 [‐1.83, 0.07] |
| 2.5 96 hours | 5 | 97 | Std. Mean Difference (IV, Random, 95% CI) | ‐0.56 [‐1.12, 0.01] |
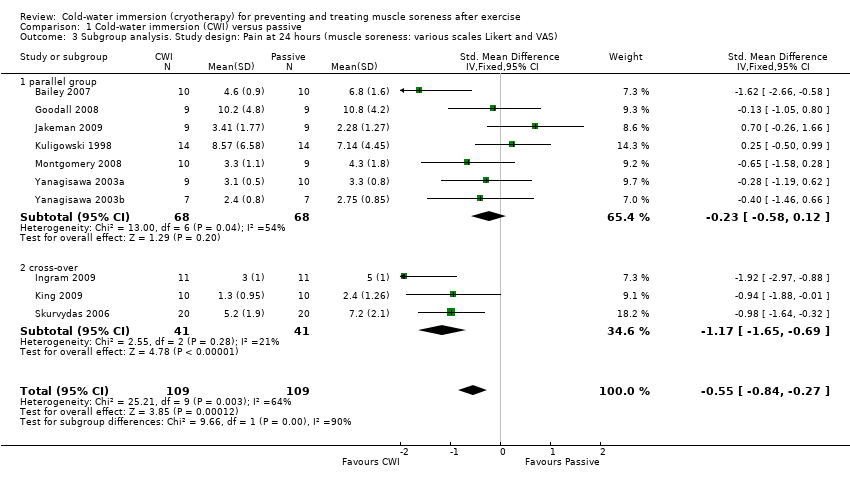
| 3 Subgroup analysis. Study design: Pain at 24 hours (muscle soreness: various scales Likert and VAS) Show forest plot | 10 | 218 | Std. Mean Difference (IV, Fixed, 95% CI) | ‐0.55 [‐0.84, ‐0.27] |
|
| 3.1 parallel group | 7 | 136 | Std. Mean Difference (IV, Fixed, 95% CI) | ‐0.23 [‐0.58, 0.12] |
| 3.2 cross‐over | 3 | 82 | Std. Mean Difference (IV, Fixed, 95% CI) | ‐1.17 [‐1.65, ‐0.69] |
| 4 Subgroup analysis. Study design: Pain at 48 hours (muscle soreness: various scales Likert and VAS) Show forest plot | 8 | 179 | Std. Mean Difference (IV, Fixed, 95% CI) | ‐0.66 [‐0.97, ‐0.35] |
|
| 4.1 parallel group | 6 | 117 | Std. Mean Difference (IV, Fixed, 95% CI) | ‐0.40 [‐0.77, ‐0.02] |
| 4.2 cross‐over | 2 | 62 | Std. Mean Difference (IV, Fixed, 95% CI) | ‐1.26 [‐1.81, ‐0.70] |
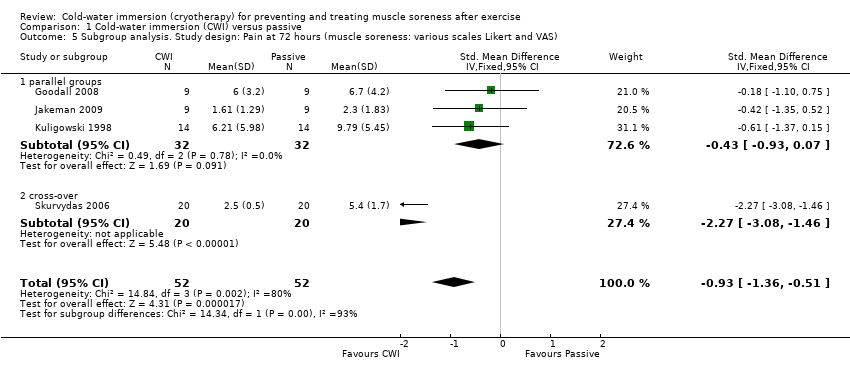
| 5 Subgroup analysis. Study design: Pain at 72 hours (muscle soreness: various scales Likert and VAS) Show forest plot | 4 | 104 | Std. Mean Difference (IV, Fixed, 95% CI) | ‐0.93 [‐1.36, ‐0.51] |
|
| 5.1 parallel groups | 3 | 64 | Std. Mean Difference (IV, Fixed, 95% CI) | ‐0.43 [‐0.93, 0.07] |
| 5.2 cross‐over | 1 | 40 | Std. Mean Difference (IV, Fixed, 95% CI) | ‐2.27 [‐3.08, ‐1.46] |
| 6 Subgroup analysis. Immersion frequency: Pain at 24 hours (muscle soreness: various scales Likert and VAS) Show forest plot | 10 | 218 | Std. Mean Difference (IV, Fixed, 95% CI) | ‐0.55 [‐0.84, ‐0.27] |
|
| 6.1 Single CWI | 6 | 110 | Std. Mean Difference (IV, Fixed, 95% CI) | ‐0.51 [‐0.90, ‐0.11] |
| 6.2 Multiple CWI | 4 | 108 | Std. Mean Difference (IV, Fixed, 95% CI) | ‐0.60 [‐1.00, ‐0.20] |
| 7 Subgroup analysis. Immersion frequency: Pain at 48 hours (muscle soreness: various scales Likert and VAS) Show forest plot | 8 | 179 | Std. Mean Difference (IV, Fixed, 95% CI) | ‐0.66 [‐0.97, ‐0.35] |
|
| 7.1 Single CWI | 4 | 71 | Std. Mean Difference (IV, Fixed, 95% CI) | ‐0.75 [‐1.25, ‐0.26] |
| 7.2 Multiple CWI | 4 | 108 | Std. Mean Difference (IV, Fixed, 95% CI) | ‐0.60 [‐1.01, ‐0.20] |
| 8 Subgroup analysis. Exercise type: Pain at 24 hours (muscle soreness: various scales Likert and VAS) Show forest plot | 10 | 218 | Std. Mean Difference (IV, Fixed, 95% CI) | ‐0.55 [‐0.84, ‐0.27] |
|
| 8.1 Lab controlled muscle damage (DOMS) | 6 | 137 | Std. Mean Difference (IV, Fixed, 95% CI) | ‐0.22 [‐0.57, 0.12] |
| 8.2 Other sporting activity | 4 | 81 | Std. Mean Difference (IV, Fixed, 95% CI) | ‐1.23 [‐1.72, ‐0.74] |
| 9 Subgroup analysis. Exercise type: Pain at 48 hours (muscle soreness: various scales Likert and VAS) Show forest plot | 8 | 179 | Std. Mean Difference (IV, Fixed, 95% CI) | ‐0.66 [‐0.97, ‐0.35] |
|
| 9.1 Lab controlled muscle damage (DOMS) | 6 | 137 | Std. Mean Difference (IV, Fixed, 95% CI) | ‐0.48 [‐0.83, ‐0.14] |
| 9.2 Other sporting activity | 2 | 42 | Std. Mean Difference (IV, Fixed, 95% CI) | ‐1.39 [‐2.09, ‐0.69] |
| 10 Tenderness (pain on palpation) Show forest plot | 1 | | Mean Difference (IV, Fixed, 95% CI) | Totals not selected |
|
| 10.1 24 hours | 1 | | Mean Difference (IV, Fixed, 95% CI) | 0.0 [0.0, 0.0] |
| 10.2 48 hours | 1 | | Mean Difference (IV, Fixed, 95% CI) | 0.0 [0.0, 0.0] |
| 10.3 72 hours | 1 | | Mean Difference (IV, Fixed, 95% CI) | 0.0 [0.0, 0.0] |
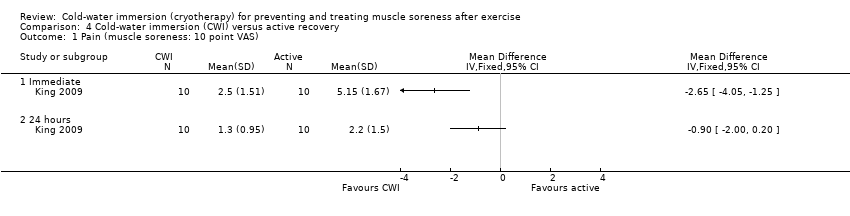
| 11 Subjective recovery (10 point or 10 cm VAS) Show forest plot | 2 | | Mean Difference (IV, Fixed, 95% CI) | Subtotals only |
|
| 11.1 Physical recovery (Immediately post intervention) | 2 | 42 | Mean Difference (IV, Fixed, 95% CI) | 0.97 [‐0.10, 2.05] |
| 11.2 Mental recovery (immediately post intervention) | 1 | 22 | Mean Difference (IV, Fixed, 95% CI) | 0.60 [‐0.86, 2.06] |
| 12 Fatigue (10 point / 10 cm VAS) Show forest plot | 3 | | Mean Difference (IV, Fixed, 95% CI) | Subtotals only |
|
| 12.1 Fatigue (immediately post intervention) | 2 | 38 | Mean Difference (IV, Fixed, 95% CI) | ‐1.70 [‐2.49, ‐0.90] |
| 12.2 Fatigue (24 hrs post intervention) | 1 | 19 | Mean Difference (IV, Fixed, 95% CI) | ‐0.70 [‐1.88, 0.48] |
| 13 Strength (Final value: Nm) Show forest plot | 6 | | Mean Difference (IV, Fixed, 95% CI) | Subtotals only |
|
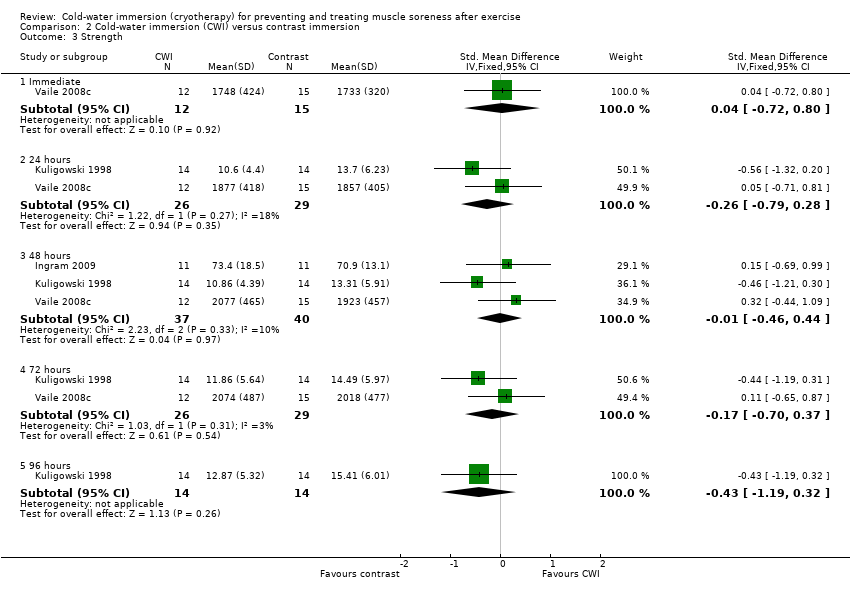
| 13.1 Immediate | 3 | 58 | Mean Difference (IV, Fixed, 95% CI) | ‐19.92 [‐33.24, ‐6.59] |
| 13.2 24 hours | 4 | 81 | Mean Difference (IV, Fixed, 95% CI) | ‐1.94 [‐6.44, 2.56] |
| 13.3 48 hours | 5 | 103 | Mean Difference (IV, Fixed, 95% CI) | ‐1.44 [‐5.46, 2.57] |
| 13.4 72 hours | 3 | 61 | Mean Difference (IV, Fixed, 95% CI) | ‐0.89 [‐5.33, 3.56] |
| 13.5 96 hours | 2 | 46 | Mean Difference (IV, Fixed, 95% CI) | ‐0.58 [‐4.06, 2.89] |
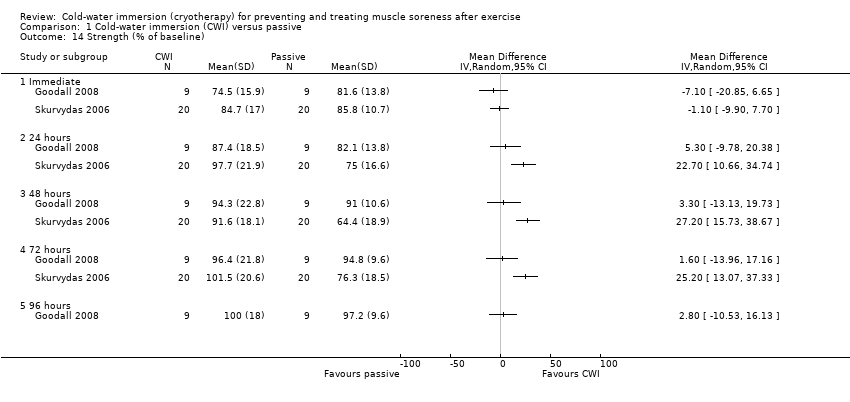
| 14 Strength (% of baseline) Show forest plot | 2 | | Mean Difference (IV, Random, 95% CI) | Totals not selected |
|
| 14.1 Immediate | 2 | | Mean Difference (IV, Random, 95% CI) | 0.0 [0.0, 0.0] |
| 14.2 24 hours | 2 | | Mean Difference (IV, Random, 95% CI) | 0.0 [0.0, 0.0] |
| 14.3 48 hours | 2 | | Mean Difference (IV, Random, 95% CI) | 0.0 [0.0, 0.0] |
| 14.4 72 hours | 2 | | Mean Difference (IV, Random, 95% CI) | 0.0 [0.0, 0.0] |
| 14.5 96 hours | 1 | | Mean Difference (IV, Random, 95% CI) | 0.0 [0.0, 0.0] |
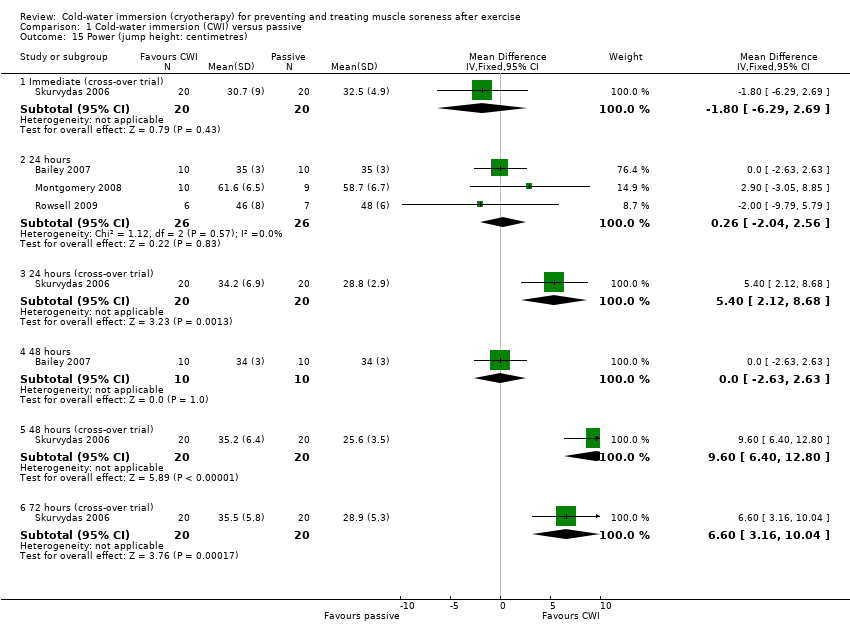
| 15 Power (jump height: centimetres) Show forest plot | 4 | | Mean Difference (IV, Fixed, 95% CI) | Subtotals only |
|
| 15.1 Immediate (cross‐over trial) | 1 | 40 | Mean Difference (IV, Fixed, 95% CI) | ‐1.80 [‐6.29, 2.69] |
| 15.2 24 hours | 3 | 52 | Mean Difference (IV, Fixed, 95% CI) | 0.26 [‐2.04, 2.56] |
| 15.3 24 hours (cross‐over trial) | 1 | 40 | Mean Difference (IV, Fixed, 95% CI) | 5.40 [2.12, 8.68] |
| 15.4 48 hours | 1 | 20 | Mean Difference (IV, Fixed, 95% CI) | 0.0 [‐2.63, 2.63] |
| 15.5 48 hours (cross‐over trial) | 1 | 40 | Mean Difference (IV, Fixed, 95% CI) | 9.60 [6.40, 12.80] |
| 15.6 72 hours (cross‐over trial) | 1 | 40 | Mean Difference (IV, Fixed, 95% CI) | 6.60 [3.16, 10.04] |
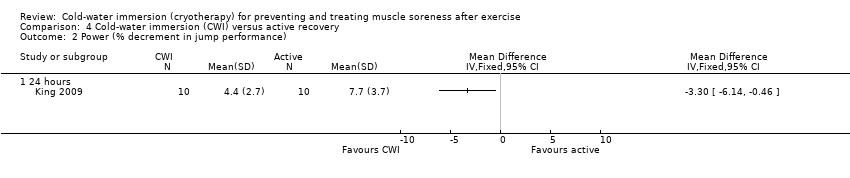
| 16 Power (% decrease in jump height over 5 jumps) Show forest plot | 1 | | Mean Difference (IV, Fixed, 95% CI) | Totals not selected |
|
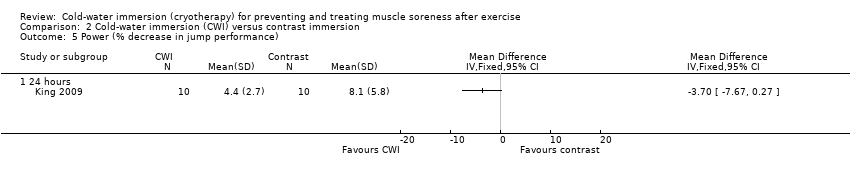
| 16.1 24 hours | 1 | | Mean Difference (IV, Fixed, 95% CI) | 0.0 [0.0, 0.0] |
| 17 Power (cycle ergometer power: Watts) Show forest plot | 1 | | Mean Difference (IV, Fixed, 95% CI) | Totals not selected |
|
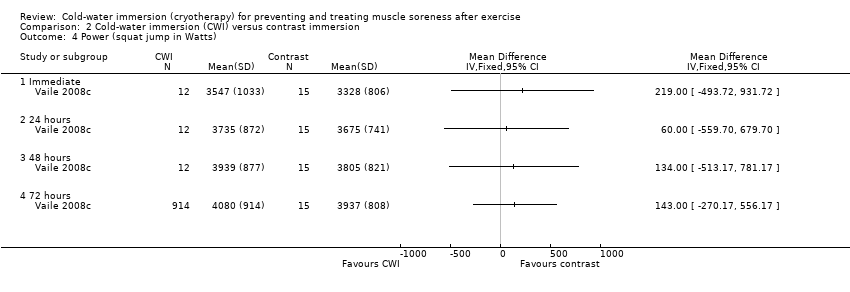
| 17.1 Peak power output (Immediate) | 1 | | Mean Difference (IV, Fixed, 95% CI) | 0.0 [0.0, 0.0] |
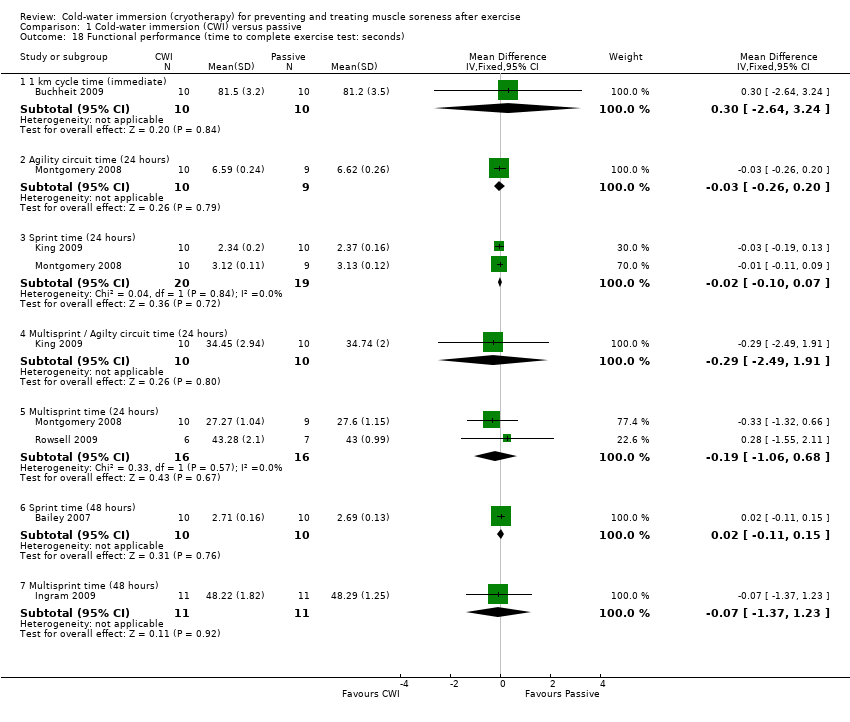
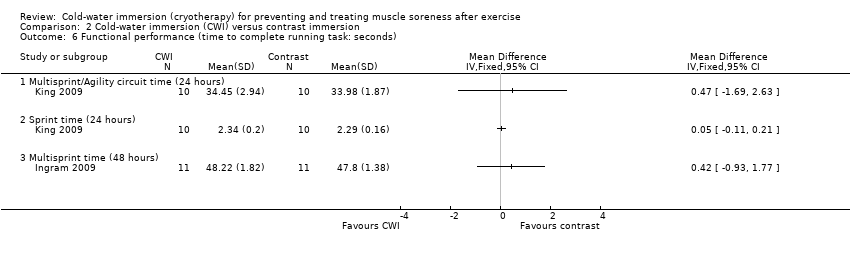
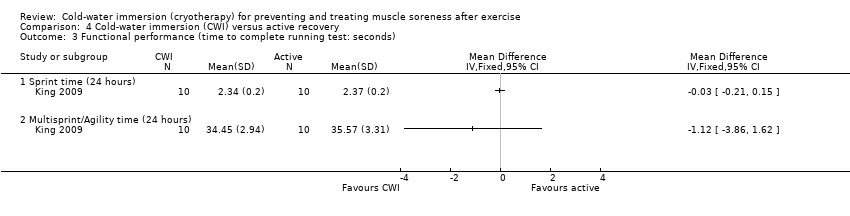
| 18 Functional performance (time to complete exercise test: seconds) Show forest plot | 6 | | Mean Difference (IV, Fixed, 95% CI) | Subtotals only |
|
| 18.1 1 km cycle time (immediate) | 1 | 20 | Mean Difference (IV, Fixed, 95% CI) | 0.30 [‐2.64, 3.24] |
| 18.2 Agility circuit time (24 hours) | 1 | 19 | Mean Difference (IV, Fixed, 95% CI) | ‐0.03 [‐0.26, 0.20] |
| 18.3 Sprint time (24 hours) | 2 | 39 | Mean Difference (IV, Fixed, 95% CI) | ‐0.02 [‐0.10, 0.07] |
| 18.4 Multisprint / Agilty circuit time (24 hours) | 1 | 20 | Mean Difference (IV, Fixed, 95% CI) | ‐0.29 [‐2.49, 1.91] |
| 18.5 Multisprint time (24 hours) | 2 | 32 | Mean Difference (IV, Fixed, 95% CI) | ‐0.19 [‐1.06, 0.68] |
| 18.6 Sprint time (48 hours) | 1 | 20 | Mean Difference (IV, Fixed, 95% CI) | 0.02 [‐0.11, 0.15] |
| 18.7 Multisprint time (48 hours) | 1 | 22 | Mean Difference (IV, Fixed, 95% CI) | ‐0.07 [‐1.37, 1.23] |
| 19 Functional performance (time to fatigue) Show forest plot | 1 | | Mean Difference (IV, Fixed, 95% CI) | Totals not selected |
|
| 19.1 % decrease from baseline (immediate) | 1 | | Mean Difference (IV, Fixed, 95% CI) | 0.0 [0.0, 0.0] |
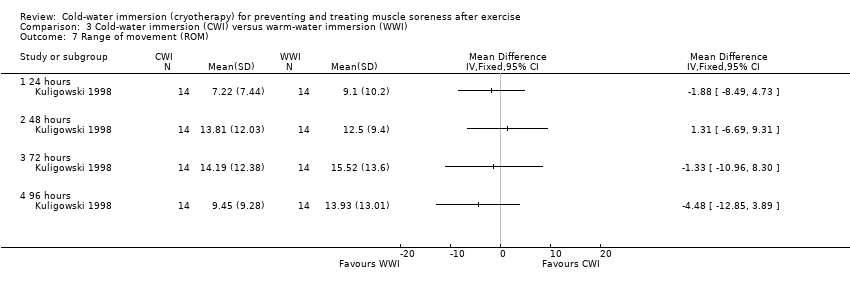
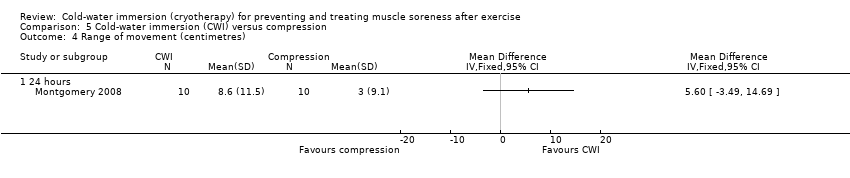
| 20 Range of movement (ROM) Show forest plot | 4 | | Mean Difference (IV, Fixed, 95% CI) | Totals not selected |
|
| 20.1 Degrees (Immediate) | 2 | | Mean Difference (IV, Fixed, 95% CI) | 0.0 [0.0, 0.0] |
| 20.2 Degrees (24 hours) | 3 | | Mean Difference (IV, Fixed, 95% CI) | 0.0 [0.0, 0.0] |
| 20.3 Centimetres (24 hours) | 1 | | Mean Difference (IV, Fixed, 95% CI) | 0.0 [0.0, 0.0] |
| 20.4 Degrees (48 hours) | 3 | | Mean Difference (IV, Fixed, 95% CI) | 0.0 [0.0, 0.0] |
| 20.5 Degrees (72 hours) | 2 | | Mean Difference (IV, Fixed, 95% CI) | 0.0 [0.0, 0.0] |
| 20.6 Degrees (96 hours) | 3 | | Mean Difference (IV, Fixed, 95% CI) | 0.0 [0.0, 0.0] |
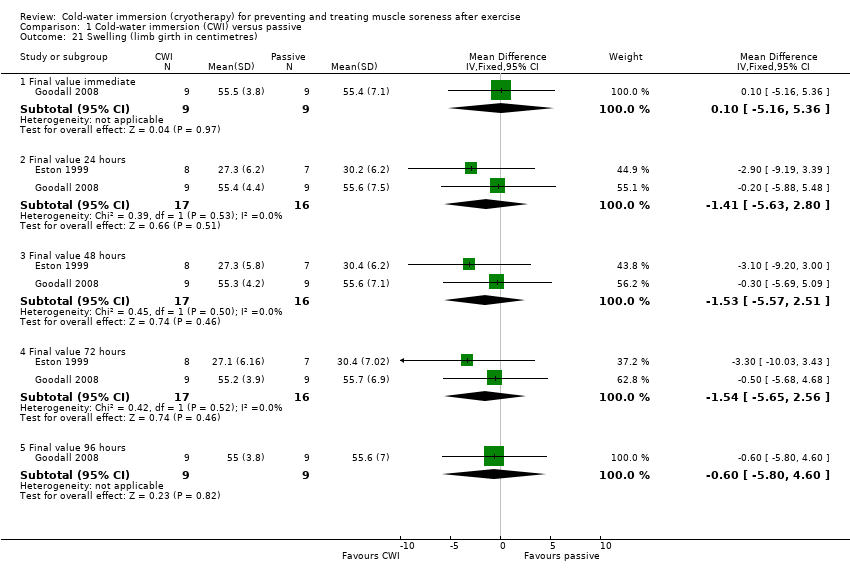
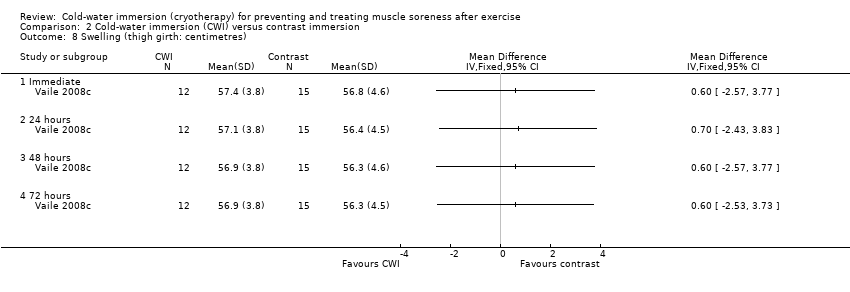
| 21 Swelling (limb girth in centimetres) Show forest plot | 2 | | Mean Difference (IV, Fixed, 95% CI) | Subtotals only |
|
| 21.1 Final value immediate | 1 | 18 | Mean Difference (IV, Fixed, 95% CI) | 0.10 [‐5.16, 5.36] |
| 21.2 Final value 24 hours | 2 | 33 | Mean Difference (IV, Fixed, 95% CI) | ‐1.41 [‐5.63, 2.80] |
| 21.3 Final value 48 hours | 2 | 33 | Mean Difference (IV, Fixed, 95% CI) | ‐1.53 [‐5.57, 2.51] |
| 21.4 Final value 72 hours | 2 | 33 | Mean Difference (IV, Fixed, 95% CI) | ‐1.54 [‐5.65, 2.56] |
| 21.5 Final value 96 hours | 1 | 18 | Mean Difference (IV, Fixed, 95% CI) | ‐0.60 [‐5.80, 4.60] |
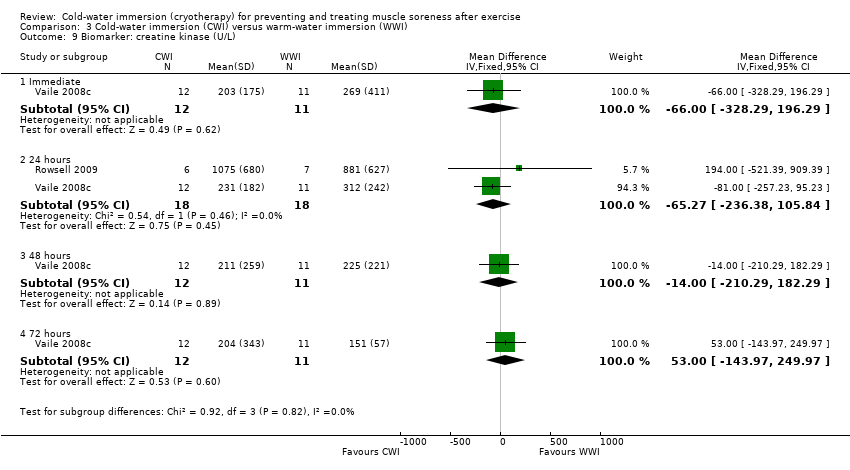
| 22 Biomarker: creatine kinase Show forest plot | 10 | | Std. Mean Difference (IV, Random, 95% CI) | Subtotals only |
|
| 22.1 Immediately post | 4 | 68 | Std. Mean Difference (IV, Random, 95% CI) | 0.01 [‐0.66, 0.67] |
| 22.2 24 hours | 7 | 146 | Std. Mean Difference (IV, Random, 95% CI) | ‐0.20 [‐1.03, 0.63] |
| 22.3 48 hours | 7 | 152 | Std. Mean Difference (IV, Random, 95% CI) | ‐0.50 [‐1.36, 0.37] |
| 22.4 72 hours | 3 | 51 | Std. Mean Difference (IV, Random, 95% CI) | 0.14 [‐0.52, 0.79] |
| 22.5 96 hours | 3 | 55 | Std. Mean Difference (IV, Random, 95% CI) | 0.01 [‐0.70, 0.73] |
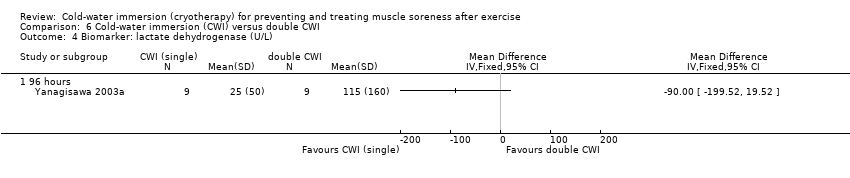
| 23 Biomarker: lactate dehydrogenase Show forest plot | 2 | | Mean Difference (IV, Fixed, 95% CI) | Totals not selected |
|
| 23.1 U/L (immediate) | 1 | | Mean Difference (IV, Fixed, 95% CI) | 0.0 [0.0, 0.0] |
| 23.2 % change 96 hours | 1 | | Mean Difference (IV, Fixed, 95% CI) | 0.0 [0.0, 0.0] |
| 24 Biomarker: myoglobin Show forest plot | 3 | | Std. Mean Difference (IV, Fixed, 95% CI) | Subtotals only |
|
| 24.1 Immediate | 2 | 36 | Std. Mean Difference (IV, Fixed, 95% CI) | ‐0.51 [‐1.18, 0.17] |
| 24.2 24 hours | 2 | 33 | Std. Mean Difference (IV, Fixed, 95% CI) | ‐0.66 [‐1.36, 0.05] |
| 24.3 48 hours | 1 | 20 | Std. Mean Difference (IV, Fixed, 95% CI) | ‐0.74 [‐1.66, 0.17] |
| 25 Biomarker: interleukin‐6 (pg/ml) Show forest plot | 1 | | Std. Mean Difference (IV, Fixed, 95% CI) | Totals not selected |
|
| 25.1 Immediate | 1 | | Std. Mean Difference (IV, Fixed, 95% CI) | 0.0 [0.0, 0.0] |
| 26 Biomarker: C‐reactive protein (mg/dL / mg/L) Show forest plot | 3 | | Std. Mean Difference (IV, Fixed, 95% CI) | Subtotals only |
|
| 26.1 Immediate | 2 | 30 | Std. Mean Difference (IV, Fixed, 95% CI) | 0.32 [‐0.40, 1.04] |
| 26.2 24 hours | 1 | 22 | Std. Mean Difference (IV, Fixed, 95% CI) | ‐0.23 [‐1.07, 0.61] |
| 26.3 48 hours | 1 | 22 | Std. Mean Difference (IV, Fixed, 95% CI) | ‐0.21 [‐1.05, 0.63] |
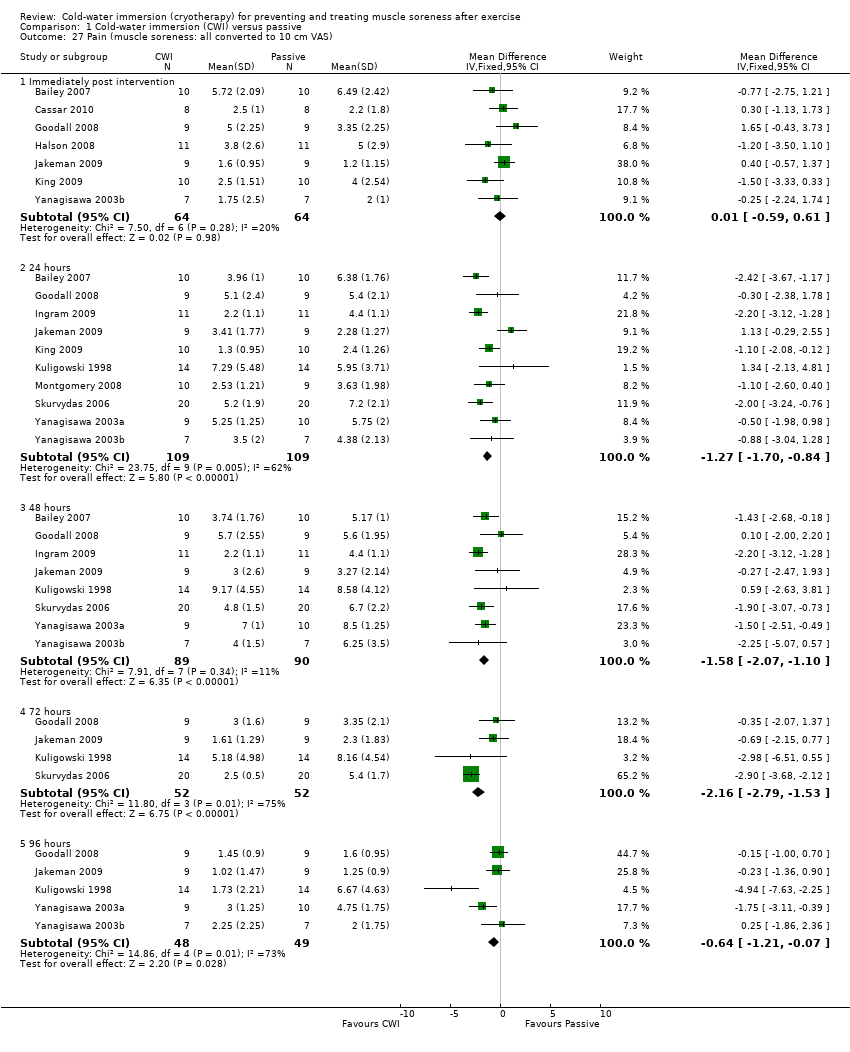
| 27 Pain (muscle soreness: all converted to 10 cm VAS) Show forest plot | 12 | | Mean Difference (IV, Fixed, 95% CI) | Subtotals only |
|
| 27.1 Immediately post intervention | 7 | 128 | Mean Difference (IV, Fixed, 95% CI) | 0.01 [‐0.59, 0.61] |
| 27.2 24 hours | 10 | 218 | Mean Difference (IV, Fixed, 95% CI) | ‐1.27 [‐1.70, ‐0.84] |
| 27.3 48 hours | 8 | 179 | Mean Difference (IV, Fixed, 95% CI) | ‐1.58 [‐2.07, ‐1.10] |
| 27.4 72 hours | 4 | 104 | Mean Difference (IV, Fixed, 95% CI) | ‐2.16 [‐2.79, ‐1.53] |
| 27.5 96 hours | 5 | 97 | Mean Difference (IV, Fixed, 95% CI) | ‐0.64 [‐1.21, ‐0.07] |