Tratamiento de reemplazo de enzimas pancreáticas para pacientes con fibrosis quística
Información
- DOI:
- https://doi.org/10.1002/14651858.CD008227.pub2Copiar DOI

- Base de datos:
-
- Cochrane Database of Systematic Reviews
- Versión publicada:
-
- 13 octubre 2014see what's new
- Tipo:
-
- Intervention
- Etapa:
-
- Review
- Grupo Editorial Cochrane:
-
Grupo Cochrane de Fibrosis quística y enfermedades genéticas
- Copyright:
-
- Copyright © 2014 The Cochrane Collaboration. Published by John Wiley & Sons, Ltd.
Cifras del artículo
Altmetric:
Citado por:
Autores
Contributions of authors
Protocol stage: Paramita Cifelli and Robyn Huggins partly drafted the protocol with significant contributions from Alan Smyth.
Review stage: Usha Rani Somaraju and Arturo Solis Moya both selected trials for inclusion in the review, extracted data and assessed the risk of bias. Usha Rani Somaraju drafted the review with comments from Arturo Solis Moya. Usha Rani Somaraju is guarantor of the review.
Declarations of interest
None of the authors has any interests to declare.
Acknowledgements
Nikki Jahnke and Tracey Remmington have both given considerable advice and support in the drafting of the protocol. Nikki Jahnke also extended considerable support for the development of the review.
The current review team would like to thank the authors who worked on the protocol for this review ‐ Paramita Cifelli, Robyn Huggins and Alan Smyth. They would also like to thank Dhruv Rastogi for his contribution to the early stages of the full review.
Version history
| Published | Title | Stage | Authors | Version |
| 2020 Aug 06 | Pancreatic enzyme replacement therapy for people with cystic fibrosis | Review | Usha Rani R Somaraju, Arturo Solis-Moya | |
| 2016 Nov 23 | Pancreatic enzyme replacement therapy for people with cystic fibrosis | Review | Usha Rani Somaraju, Arturo Solis‐Moya | |
| 2014 Oct 13 | Pancreatic enzyme replacement therapy for people with cystic fibrosis | Review | Usha Rani Somaraju, Arturo Solis‐Moya | |
| 2010 Jan 20 | Pancreatic enzyme replacement therapy for people with cystic fibrosis | Protocol | Paramita Cifelli, Robyn Huggins, Alan R Smyth, Dhruv Rastogi | |
Keywords
MeSH
Medical Subject Headings (MeSH) Keywords
- Abdominal Pain [epidemiology];
- Age Factors;
- Capsules [administration & dosage];
- Cystic Fibrosis [*therapy];
- Delayed-Action Preparations;
- Enzyme Replacement Therapy [adverse effects, *standards];
- Gastrointestinal Agents [therapeutic use];
- Microspheres;
- Nutritional Status;
- Pancreas [enzymology];
- Randomized Controlled Trials as Topic;
- Weight Gain;
Medical Subject Headings Check Words
Adult; Child; Humans;
PICO
![Forest plot of comparison: 2 ECM versus ECT, outcome: 2.2 Stool frequency [number/day].](/es/cdsr/doi/10.1002/14651858.CD008227.pub2/media/CDSR/CD008227/rel0002/CD008227/image_n/nCD008227-AFig-FIG01.png)
Forest plot of comparison: 2 ECM versus ECT, outcome: 2.2 Stool frequency [number/day].
![Forest plot of comparison: 2 ECM versus ECT, outcome: 2.3 Abdominal pain [% days].](/es/cdsr/doi/10.1002/14651858.CD008227.pub2/media/CDSR/CD008227/rel0002/CD008227/image_n/nCD008227-AFig-FIG02.png)
Forest plot of comparison: 2 ECM versus ECT, outcome: 2.3 Abdominal pain [% days].
![Forest plot of comparison: 2 ECM versus ECT, outcome: 2.4 FFE [g/day].](/es/cdsr/doi/10.1002/14651858.CD008227.pub2/media/CDSR/CD008227/rel0002/CD008227/image_n/nCD008227-AFig-FIG03.png)
Forest plot of comparison: 2 ECM versus ECT, outcome: 2.4 FFE [g/day].
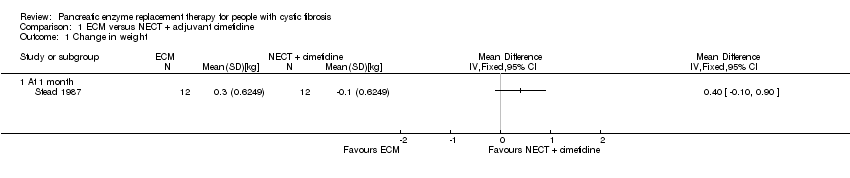
Comparison 1 ECM versus NECT + adjuvant cimetidine, Outcome 1 Change in weight.
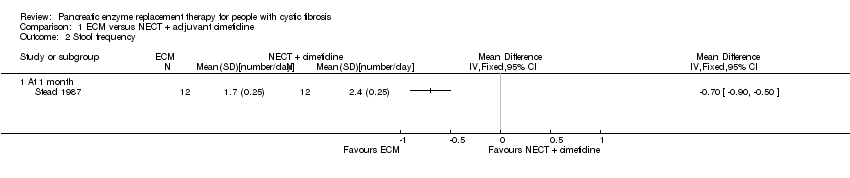
Comparison 1 ECM versus NECT + adjuvant cimetidine, Outcome 2 Stool frequency.

Comparison 1 ECM versus NECT + adjuvant cimetidine, Outcome 3 Abdominal pain.

Comparison 1 ECM versus NECT + adjuvant cimetidine, Outcome 4 FFE.

Comparison 2 ECM versus ECT, Outcome 1 Change in weight.
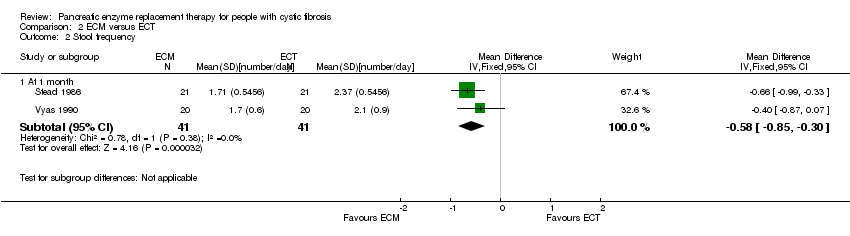
Comparison 2 ECM versus ECT, Outcome 2 Stool frequency.
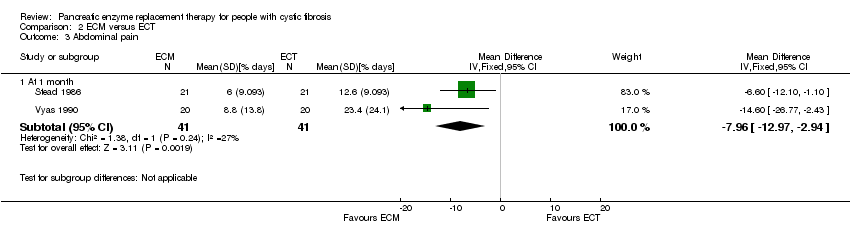
Comparison 2 ECM versus ECT, Outcome 3 Abdominal pain.

Comparison 2 ECM versus ECT, Outcome 4 FFE.

Comparison 3 ECM versus ECMM, Outcome 1 FFE.

Comparison 4 Creon® versus Pancrease®, Outcome 1 Co‐efficient of fat absorption.

Comparison 5 ECM versus TPE, Outcome 1 FFE.
| Term/abbreviation | Definition |
| BMI | body mass index |
| CF | cystic fibrosis |
| CFA | coefficient of fat absorption |
| chyme | the semi‐fluid mass of partly digested food expelled by the stomach into the duodenum |
| DIOS | distal intestinal obstruction syndrome |
| ECM | enteric coated microspheres |
| FFE | faecal fat excretion |
| hyperuricaemia | an excess of uric acid in the blood |
| hyperuricosuria | the presence of excessive amounts of uric acid in the urine |
| Ileocecum | the combined ileum (end of the small intestine) and cecum (start of the large intestine) |
| NECM | non‐enteric coated microspheres |
| PERT | pancreatic enzyme replacement therapy |
| PI | pancreatic insufficiency |
| porcine | relating to or suggesting swine (pigs) |
| RCT | randomised controlled trial |
| steatorrhoea | loss of fat in the stools |
| Outcome or subgroup title | No. of studies | No. of participants | Statistical method | Effect size |
| 1 Change in weight Show forest plot | 1 | Mean Difference (IV, Fixed, 95% CI) | Totals not selected | |
| 1.1 At 1 month | 1 | Mean Difference (IV, Fixed, 95% CI) | 0.0 [0.0, 0.0] | |
| 2 Stool frequency Show forest plot | 1 | Mean Difference (IV, Fixed, 95% CI) | Totals not selected | |
| 2.1 At 1 month | 1 | Mean Difference (IV, Fixed, 95% CI) | 0.0 [0.0, 0.0] | |
| 3 Abdominal pain Show forest plot | 1 | Mean Difference (IV, Fixed, 95% CI) | Totals not selected | |
| 3.1 At 1 month | 1 | Mean Difference (IV, Fixed, 95% CI) | 0.0 [0.0, 0.0] | |
| 4 FFE Show forest plot | 1 | Mean Difference (IV, Fixed, 95% CI) | Totals not selected | |
| 4.1 At 1 month | 1 | Mean Difference (IV, Fixed, 95% CI) | 0.0 [0.0, 0.0] | |
| Outcome or subgroup title | No. of studies | No. of participants | Statistical method | Effect size |
| 1 Change in weight Show forest plot | 2 | Mean Difference (IV, Fixed, 95% CI) | Subtotals only | |
| 1.1 At 1 month | 2 | 82 | Mean Difference (IV, Fixed, 95% CI) | 0.32 [‐0.03, 0.67] |
| 2 Stool frequency Show forest plot | 2 | Mean Difference (IV, Fixed, 95% CI) | Subtotals only | |
| 2.1 At 1 month | 2 | 82 | Mean Difference (IV, Fixed, 95% CI) | ‐0.58 [‐0.85, ‐0.30] |
| 3 Abdominal pain Show forest plot | 2 | Mean Difference (IV, Fixed, 95% CI) | Subtotals only | |
| 3.1 At 1 month | 2 | 82 | Mean Difference (IV, Fixed, 95% CI) | ‐7.96 [‐12.97, ‐2.94] |
| 4 FFE Show forest plot | 2 | Mean Difference (IV, Fixed, 95% CI) | Subtotals only | |
| 4.1 At 1 month | 2 | 66 | Mean Difference (IV, Fixed, 95% CI) | ‐11.79 [‐17.42, ‐6.15] |
| Outcome or subgroup title | No. of studies | No. of participants | Statistical method | Effect size |
| 1 FFE Show forest plot | 1 | Mean Difference (IV, Fixed, 95% CI) | Totals not selected | |
| 1.1 At 1 month | 1 | Mean Difference (IV, Fixed, 95% CI) | 0.0 [0.0, 0.0] | |
| Outcome or subgroup title | No. of studies | No. of participants | Statistical method | Effect size |
| 1 Co‐efficient of fat absorption Show forest plot | 1 | Mean Difference (IV, Fixed, 95% CI) | Totals not selected | |
| 1.1 At 1 month | 1 | Mean Difference (IV, Fixed, 95% CI) | 0.0 [0.0, 0.0] | |
| Outcome or subgroup title | No. of studies | No. of participants | Statistical method | Effect size |
| 1 FFE Show forest plot | 1 | Mean Difference (IV, Fixed, 95% CI) | Totals not selected | |
| 1.1 At 1 month | 1 | Mean Difference (IV, Fixed, 95% CI) | 0.0 [0.0, 0.0] | |