Scolaris Content Display Scolaris Content Display

Study flow diagram.
Figuras y tablas -
Figure 1

Study flow diagram.

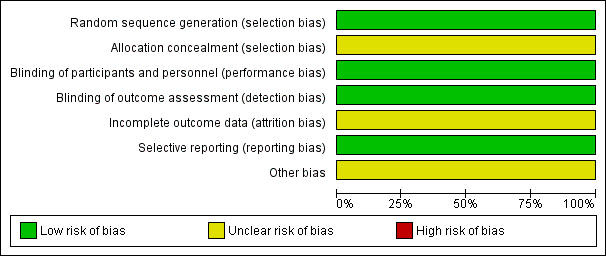
Risk of bias graph: review authors' judgments about each risk of bias item presented as percentages across all included studies.
Figuras y tablas -
Figure 2

Risk of bias graph: review authors' judgments about each risk of bias item presented as percentages across all included studies.

Summary of findings for the main comparison. Autologous hematopoietic stem cell transplantation following high‐dose chemotherapy for nonrhabdomyosarcoma soft tissue sarcoma

Autologous hematopoietic stem cell transplantation following high‐dose chemotherapy for nonrhabdomyosarcoma soft tissue sarcoma

Patient or population: people with non‐rhabdomyosarcoma soft tissue sarcoma

Settings: specialized hospital

Intervention: autologous hematopoietic stem cell transplantation following HDCT

Comparison: SDCT

Outcomes

Illustrative comparative risks* (95% CI)

Relative effect
(95% CI)

No of participants
(studies)

Quality of the evidence
(GRADE)

Comments

Assumed risk

Corresponding risk

SDCT

Autologous HSCT following HDCT

Overall survival

Follow‐up: median 55 months

489 per 1000

571 per 1000
(375 to 785)

HR 1.26
(0.7 to 2.29)

83
(1 study)

⊕⊕⊕⊕
High

Treatment‐related mortality

Follow‐up: 24 months

See comment

See comment

Not estimable

83
(1 study)

⊕⊕⊕⊕
High

1 event 2 years after HDCT and 0 events after SDCT

Disease‐free survival
Follow‐up: 3 years

See comment

See comment

Not estimable

See comment

Not reported

Progression‐free survival

Follow‐up: median 55 months

756 per 1000

849 per 1000
(681 to 955)

HR 1.34
(0.81 to 2.2)

83
(1 study)

⊕⊕⊕⊕
High

Non‐hematologic toxicity grade 3 to 4

See comment

See comment

Not estimable

See comment

Not adequately reported, people from within and without the randomization were mixed in the control arm.

Health‐related quality of life

See comment

See comment

Not estimable

See comment

Not reported

*The basis for the assumed risk (e.g. the median control group risk across studies) is provided in footnotes. The corresponding risk (and its 95% confidence interval) is based on the assumed risk in the comparison group and the relative effect of the intervention (and its 95% CI).
CI: confidence interval; HDCT: high‐dose chemotherapy; HR: hazard ratio; HSCT: hematopoietic stem cell transplantation; SDCT: standard‐dose chemotherapy.

GRADE Working Group grades of evidence
High quality: Further research is very unlikely to change our confidence in the estimate of effect.
Moderate quality: Further research is likely to have an important impact on our confidence in the estimate of effect and may change the estimate.
Low quality: Further research is very likely to have an important impact on our confidence in the estimate of effect and is likely to change the estimate.
Very low quality: We are very uncertain about the estimate.

Figuras y tablas -
Summary of findings for the main comparison. Autologous hematopoietic stem cell transplantation following high‐dose chemotherapy for nonrhabdomyosarcoma soft tissue sarcoma
Table 1. Tumor entities reported by Bui‐Nguyen 2012

Sarcoma type

Sarcoma type 'Others'

Both arms

HDCT arm

SDCT arm

Leiomyosarcoma

16

7

9

Liposarcoma

10

6

4

Synovial sarcoma

9

2

7

Angiosarcoma

6

2

4

Malignant peripheral nerve sheath tumor

2

1

1

Clear cell sarcoma

1

1

0

Desmoplastic small round cell sarcoma

1

0

1

Rhabdomyosarcoma

9

4

5

Malignant fibrous histiocytoma

16

8

8

Extraskeletal osteosarcoma

1

0

1

Melanoma*

1

1

0

'Others'

Leiomyosarcoma

1

1

0

Fibrosarcoma

1

1

0

Myofibrosarcoma

1

0

1

Undifferentiated sarcoma

2

1

1

Desmoplastic small round cell sarcoma

2

2

0

Gastrointestinal stromal tumor

1

0

1

Malignant Triton tumor

1

0

1

Unclassified sarcoma

1

1

0

Myoepithelioma*

2

2

0

Endometrial stromal sarcoma*

3

1

2

Total

87

41

46

Not listed in the WHO classification

6

4

2

HDCT: high‐dose chemotherapy; SDCT: standard‐dose chemotherapy; WHO: World Health Organization.

Bui‐Nguyen: the table lists the sarcoma types assigned to each individual of all randomized participants of the study by Bui‐Nguyen 2012.

*Soft tissue sarcomas: tumor entities not listed in either versions of the WHO classification (Fletcher 2002; Fletcher 2013), or soft tissue tumors not categorized as malignant are italicized. Myoepithelioma is categorized as an intermediate soft tissue tumor. Melanoma and endometrial stromal sarcoma are not listed in the classification.

Figuras y tablas -
Table 1. Tumor entities reported by Bui‐Nguyen 2012