Técnicas no invasivas de estimulación cerebral para el dolor crónico
Información
- DOI:
- https://doi.org/10.1002/14651858.CD008208.pub5Copiar DOI

- Base de datos:
-
- Cochrane Database of Systematic Reviews
- Versión publicada:
-
- 13 abril 2018see what's new
- Tipo:
-
- Intervention
- Etapa:
-
- Review
- Grupo Editorial Cochrane:
-
Grupo Cochrane de Dolor y cuidados paliativos
- Copyright:
-
- Copyright © 2018 The Authors. Cochrane Database of Systematic Reviews published by John Wiley & Sons, Ltd. on behalf of The Cochrane Collaboration.
- This is an open access article under the terms of the Creative Commons Attribution‐Non‐Commercial‐No‐Derivatives Licence, which permits use and distribution in any medium, provided the original work is properly cited, the use is non‐commercial and no modifications or adaptations are made.
Cifras del artículo
Altmetric:
Citado por:
Autores
Contributions of authors
For this update
NOC: co‐implemented the search strategy alongside the Cochrane PaPaS Group Information Specialist, applied eligibility criteria, assessed studies, extracted and analysed data, and led the write‐up of the review.
BW: acted as the second review author, applied eligibility criteria, assessed studies, extracted data and assisted with the write‐up of the review.
LM: provided statistical advice and support throughout the review.
LDS: acted as a third review author for conflicts in applying eligibility criteria and assessing included studies.
SS: aupported the implementation and reporting of the review throughout.
All review authors read and commented upon the systematic review and commented on and approved the final manuscript.
For previous versions of this review
NOC: conceived and designed the review protocol, co‐implemented the search strategy alongside the Cochrane PaPaS Group Information Specialist, applied eligibility criteria, assessed studies, extracted and analysed data, and led the write‐up of the review.
BW: closely informed the protocol design and acted as the second review author, applied eligibility criteria, assessed studies, extracted data and assisted with the write‐up of the review.
LM: provided statistical advice and support throughout the review and contributed to the design of the protocol.
LDS: was involved in the conception and design of the review and acted as a third review author for conflicts in applying eligibility criteria and assessing included studies.
SS: informed the design of the protocol and has supported the implementation and reporting of the review throughout.
All review authors read and commented upon the systematic review and commented on and approved the final manuscript.
Sources of support
Internal sources
-
Brunel University London, UK.
Salary for authors NOC, LDS
-
Edge Hill University, UK.
Salary for author SS
-
University College London, UK.
Salary for author LM
-
University of Notre Dame Australia, Australia.
Salary for author BMW
External sources
-
No sources of support supplied
Declarations of interest
NOC: none known
LM: none known
SS: none known
LHD: none known
BW: none known
Acknowledgements
For this update
We would like to extend particular thanks to Cochrane Pain, Palliative and Supportive Care for their assistance throughout the review, in particular Anna Erskine (nee Hobson) and Joanne Abbott. We would also like to thank the following authors for generously providing additional data for this review upon request: Dr Paradee Auvichayapa, Dr Abrahão Fontes Baptista, Dr Jeffrey Hargrove, Dr Catherine Mercier. We would like to thank Professor Turo Nurmikko and Janet Wale for their valuable peer review comments.
For 2014 update
We would like to extend particular thanks to the Cochrane Pain, Palliative and Supportive Care Group for their assistance throughout the review, in particular Anna Erskine (née Hobson) and Joanne Abbott. We would also like to thank the following authors for generously providing additional data for this review upon request: Dr David Avery, Dr Andrea Antal, Professor Mark Jensen, Dr Francesco Mori, Dr Marcelo Riberto, Prof Youichi Saitoh and Ann Gillian Taylor.
For 2010 version of review
The authors would like to thank James Langridge of the Brunel University Library for sharing his expertise in the use of electronic databases, Arturo Lawson, Ana Bela Nascimento, Andrea Wand, Pete and Maria Heine and Dr Evgeny Makarov for assistance with interpretation.
We would also like to thank the following authors for generously providing additional data for this review upon request: Dr Nathalie André‐Obadia, Dr Didier Bouhassira, Dr Ruth Defrin, Dr Bradford Fenton, Dr Felipe Fregni, Dr Linda Gabis/Dr Ranann Raz, Dr Eman Khedr, Prof. Jean‐Pascale Lefaucheur, Dr Burkhard Pleger, Prof. Jens Rollnik, Prof Youichi Saitoh.
Cochrane Review Group funding acknowledgement: this project was supported by the National Institute for Health Research, via Cochrane Infrastructure funding to Cochrane Pain, Palliative and Supportive Care (PaPaS). The views and opinions expressed therein are those of the authors and do not necessarily reflect those of the Systematic Reviews Programme, NIHR, NHS or the Department of Health.
Version history
| Published | Title | Stage | Authors | Version |
| 2018 Apr 13 | Non‐invasive brain stimulation techniques for chronic pain | Review | Neil E O'Connell, Louise Marston, Sally Spencer, Lorraine H DeSouza, Benedict M Wand | |
| 2018 Mar 16 | Non‐invasive brain stimulation techniques for chronic pain | Review | Neil E O'Connell, Louise Marston, Sally Spencer, Lorraine H DeSouza, Benedict M Wand | |
| 2014 Apr 11 | Non‐invasive brain stimulation techniques for chronic pain | Review | Neil E O'Connell, Benedict M Wand, Louise Marston, Sally Spencer, Lorraine H DeSouza | |
| 2010 Sep 08 | Non‐invasive brain stimulation techniques for chronic pain | Review | Neil E O'Connell, Benedict M Wand, Louise Marston, Sally Spencer, Lorraine H DeSouza | |
| 2010 Jan 20 | Non‐invasive brain stimulation techniques for chronic pain in adults | Protocol | Neil E O'Connell, Benedict M Wand, Louise Marston, Sally Spencer, Lorraine H DeSouza | |
Differences between protocol and review
For this update
For this update we searched ClinialTrials.gov and the World Health Organization International Clinical Trials Registry Platform, as these searches offer superior coverage to those outlined in our original protocol, and because the meta‐register of controlled trials is no longer operational. We assessed the quality of the body of evidence using GRADE and added three 'Summary of findings' tables.
For the 2014 update
We did not search the database Scopus in the 2014 update or this update as the other searches had covered the full scope of this database.
In compliance with new author guidelines from Cochrane Pain, Palliative and Supportive Care and the recommendations of Moore 2010 we added two criteria, 'study size' and 'study duration', to our 'Risk of bias' assessment using the thresholds for judgement suggested by Moore 2010:
-
size (we rated studies with fewer than 50 participants per arm as being at high risk of bias, those with between 50 and 199 participants per arm at unclear risk of bias, and 200 or more participants per arm at low risk of bias);
-
duration (we rated studies with follow‐up of less than two weeks as being at high risk of bias, two to seven weeks at unclear risk of bias and eight weeks or longer at low risk of bias).
For the 2010 update
As described in detail in Unit of analysis issues, on advice from a Cochrane statistician we meta‐analysed parallel and cross‐over studies using the generic inverse variance method rather than combining them without this statistical adjustment as was specified in the protocol. Subsequently the planned sensitivity analysis investigating the influence of study design was not deemed necessary. However on advice from a Cochrane statistician we performed a sensitivity analysis to assess the impact of our approach to imputation of standard errors for cross‐over studies.
In order to meet our second objective of considering the influence of varying stimulation parameters, we included studies regardless of the number of stimulation sessions delivered, including single‐dose studies.
The following decision was taken on encountering multiple outcomes within the same time period: for short‐term outcomes where more than one data point was available, we used the first post‐stimulation measure; where multiple treatments were given, we took the first outcome at the end of the treatment period. For medium‐term outcomes where more than one data point was available we used the measure that was closest to the mid‐point of this time period. We decided to pool data from studies with a low or unclear risk of bias as we felt that the analysis specified in the protocol (including only those studies with an overall low risk of bias) was too stringent and would not allow any statistical assessment of the data.
We did not use overall risk of bias in sensitivity analyses as we found that it lacked sensitivity. Instead we considered individual criteria in the 'Risk of bias' assessment for sensitivity analyses. However, we excluded studies with a 'high' risk of bias for any criterion from the meta‐analysis except study size and study duration.
For this update we have altered the 'Risk of bias' assessment to reflect new evidence regarding the adequacy of blinding of studies of tDCS. Details of this can be found in Assessment of risk of bias in included studies and Description of the intervention.
Keywords
MeSH
Medical Subject Headings (MeSH) Keywords
Medical Subject Headings Check Words
Humans;
PICO

Study flow diagram

Methodological quality summary: review authors' judgements about each methodological quality item for each included study

Risk of bias graph: review authors' judgements about each risk of bias item presented as percentages across all included studies

Funnel plot of comparison 3. Transcranial direct current stimulation (tDCS), outcome 3.1. Pain: short‐term follow‐up

Funnel plot of comparison 3. Transcranial direct current stimulation (tDCS), outcome 3.5. Pain: short‐term follow‐up, subgroup analysis: motor cortex studies only
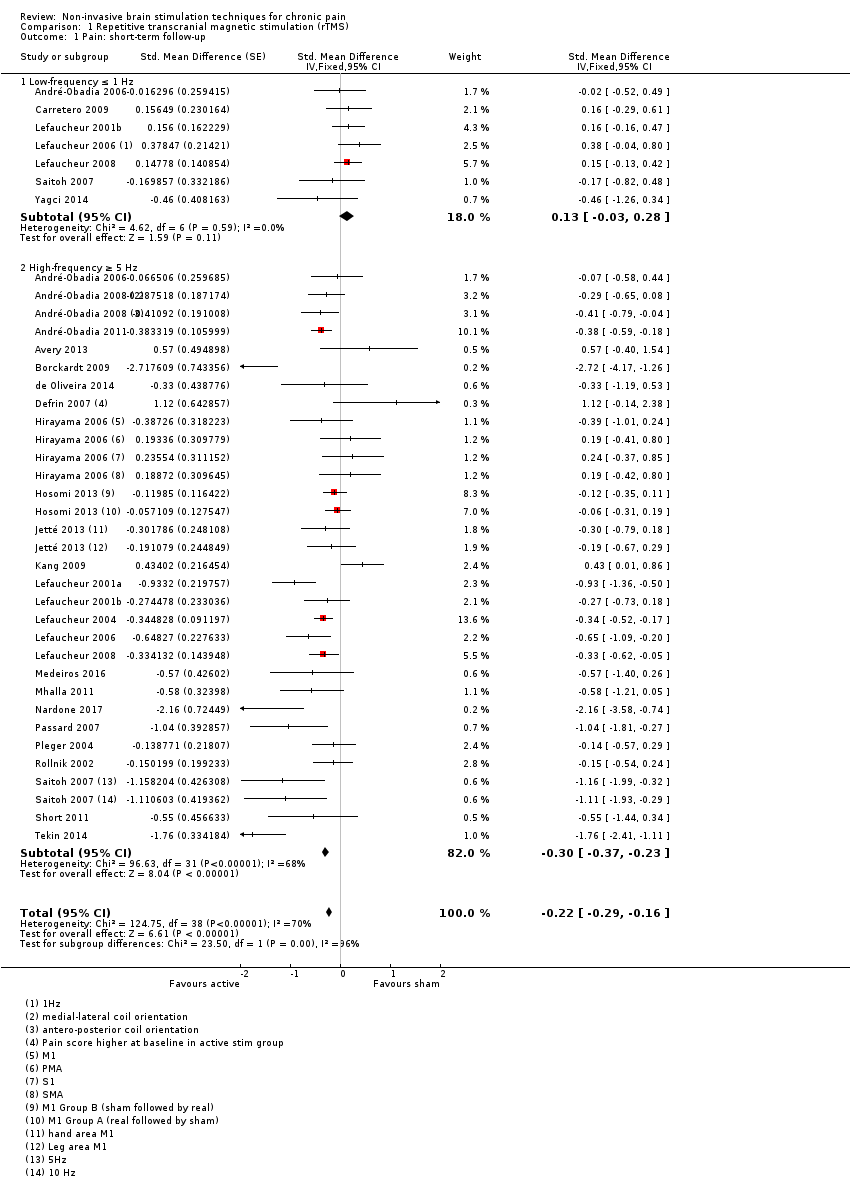
Comparison 1 Repetitive transcranial magnetic stimulation (rTMS), Outcome 1 Pain: short‐term follow‐up.

Comparison 1 Repetitive transcranial magnetic stimulation (rTMS), Outcome 2 Pain: short‐term follow‐up, subgroup analysis: multiple‐dose vs single‐dose studies.

Comparison 1 Repetitive transcranial magnetic stimulation (rTMS), Outcome 3 Pain: short‐term follow‐up, subgroup analysis, neuropathic pain participants only.

Comparison 1 Repetitive transcranial magnetic stimulation (rTMS), Outcome 4 Pain: short‐term follow‐up, subgroup analysis, non‐neuropathic pain participants only.
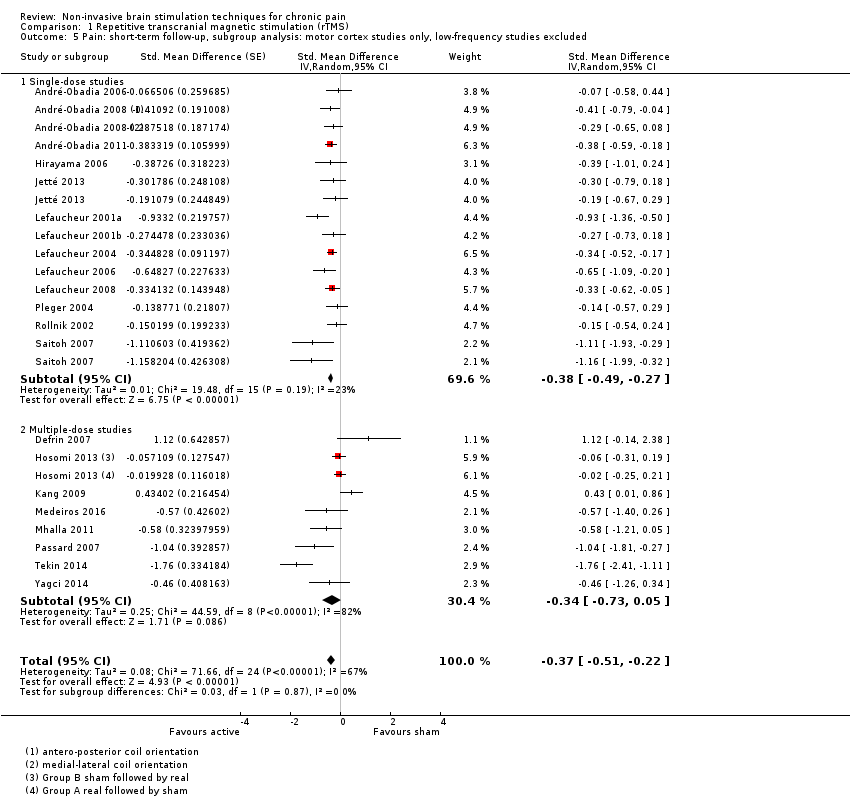
Comparison 1 Repetitive transcranial magnetic stimulation (rTMS), Outcome 5 Pain: short‐term follow‐up, subgroup analysis: motor cortex studies only, low‐frequency studies excluded.

Comparison 1 Repetitive transcranial magnetic stimulation (rTMS), Outcome 6 Sensitivity analysis ‐ imputed correlation coefficient increased. Pain: short‐term follow‐up.

Comparison 1 Repetitive transcranial magnetic stimulation (rTMS), Outcome 7 Sensitivity analysis ‐ imputed correlation coefficient decreased. Pain: short‐term follow‐up.

Comparison 1 Repetitive transcranial magnetic stimulation (rTMS), Outcome 8 Sensitivity analysis ‐ imputed correlation increased. Pain: short‐term follow‐up, subgroup analysis: motor cortex studies only, low‐frequency studies excluded.
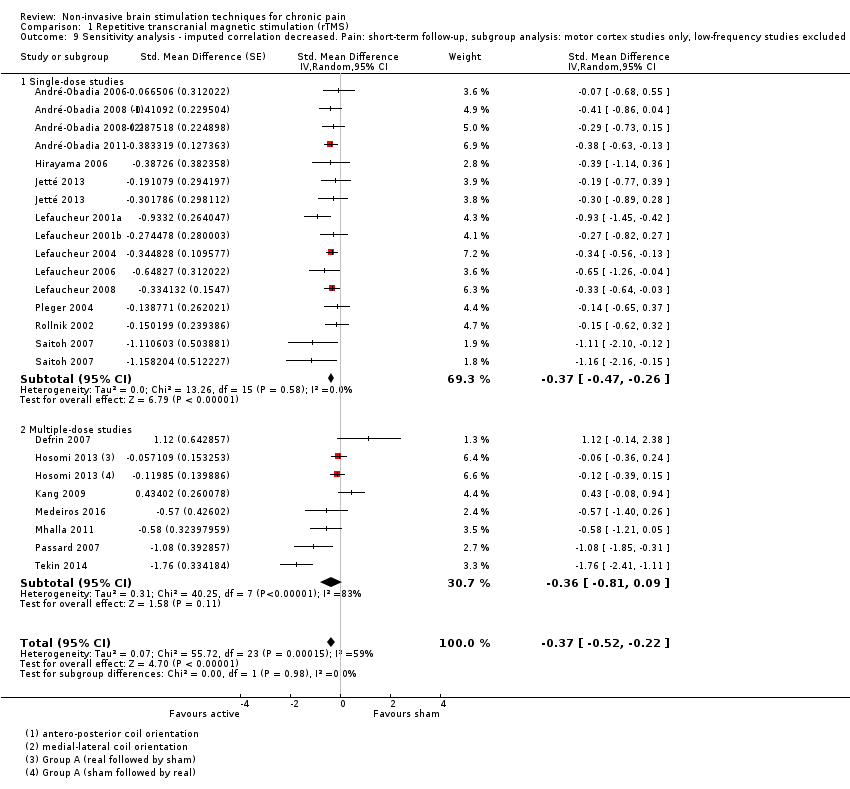
Comparison 1 Repetitive transcranial magnetic stimulation (rTMS), Outcome 9 Sensitivity analysis ‐ imputed correlation decreased. Pain: short‐term follow‐up, subgroup analysis: motor cortex studies only, low‐frequency studies excluded.

Comparison 1 Repetitive transcranial magnetic stimulation (rTMS), Outcome 10 Sensitivity analysis ‐ inclusion of high risk of bias studies. Pain: short‐term follow‐up.
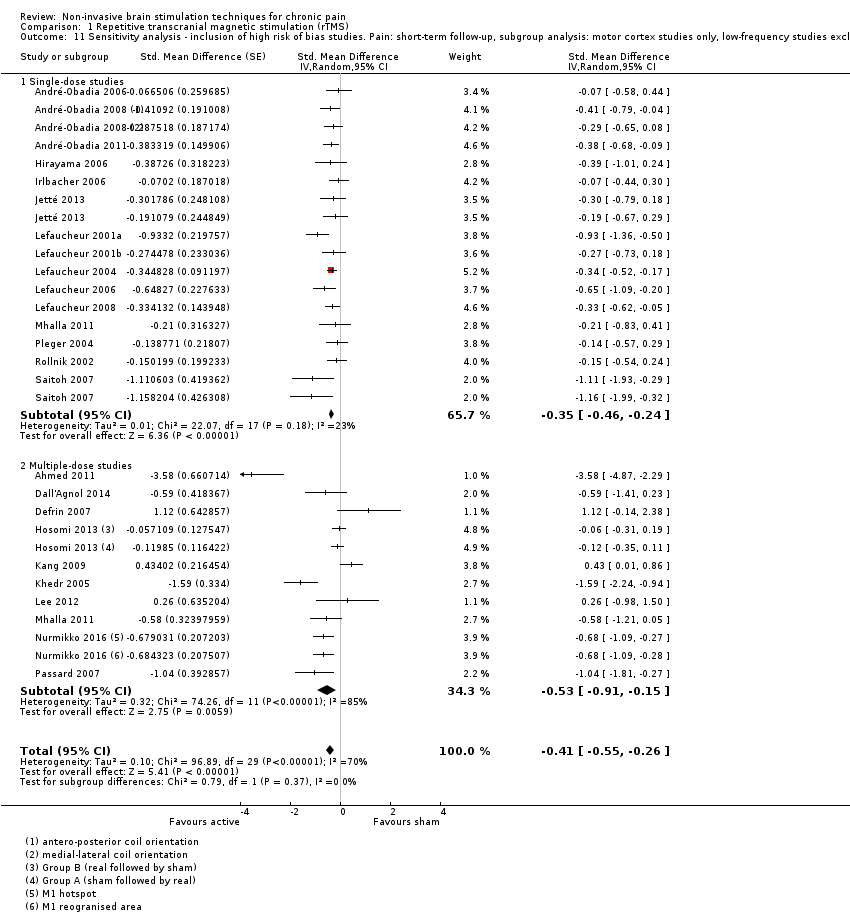
Comparison 1 Repetitive transcranial magnetic stimulation (rTMS), Outcome 11 Sensitivity analysis ‐ inclusion of high risk of bias studies. Pain: short‐term follow‐up, subgroup analysis: motor cortex studies only, low‐frequency studies excluded.

Comparison 1 Repetitive transcranial magnetic stimulation (rTMS), Outcome 12 Pain: short‐term follow‐up, subgroup analysis: prefrontal cortex studies only.

Comparison 1 Repetitive transcranial magnetic stimulation (rTMS), Outcome 13 Sensitivity analysis ‐ inclusion of high risk of bias studies. Pain: short‐term follow‐up, subgroup analysis: prefrontal cortex studies only.

Comparison 1 Repetitive transcranial magnetic stimulation (rTMS), Outcome 14 Pain: short term responder analysis 30% pain reduction.

Comparison 1 Repetitive transcranial magnetic stimulation (rTMS), Outcome 15 Sensitivity analysis‐ inclusion of high risk of bias studies. Disability: medium‐term follow‐up.

Comparison 1 Repetitive transcranial magnetic stimulation (rTMS), Outcome 16 Pain: medium‐term follow‐up.
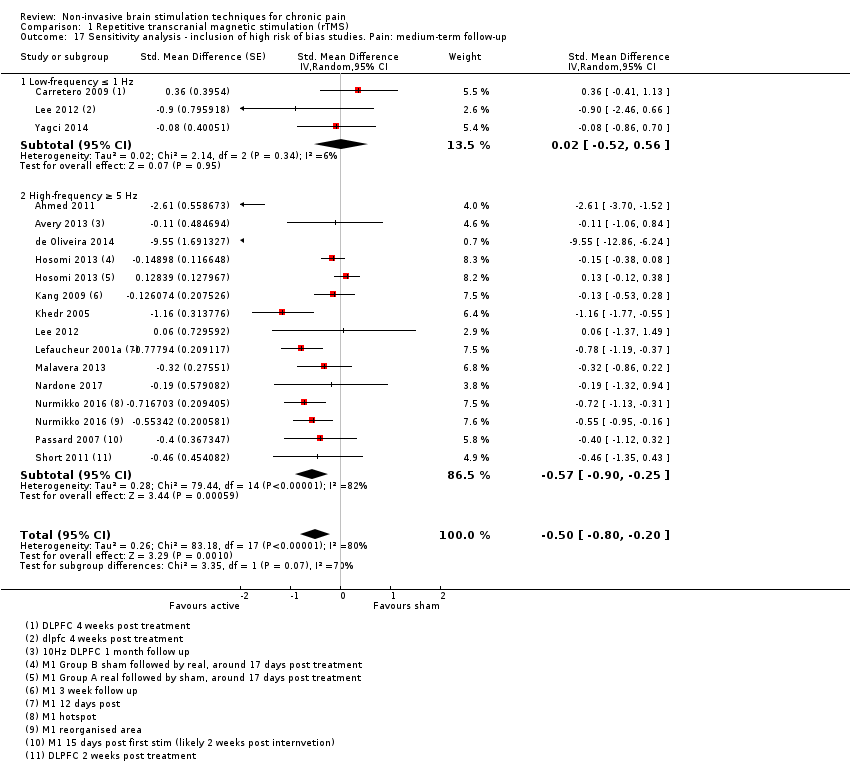
Comparison 1 Repetitive transcranial magnetic stimulation (rTMS), Outcome 17 Sensitivity analysis ‐ inclusion of high risk of bias studies. Pain: medium‐term follow‐up.

Comparison 1 Repetitive transcranial magnetic stimulation (rTMS), Outcome 18 Pain: medium‐term follow‐up, subgroup analysis: motor cortex studies only.

Comparison 1 Repetitive transcranial magnetic stimulation (rTMS), Outcome 19 Pain: medium‐term follow‐up, subgroup analysis: prefrontal cortex studies only.
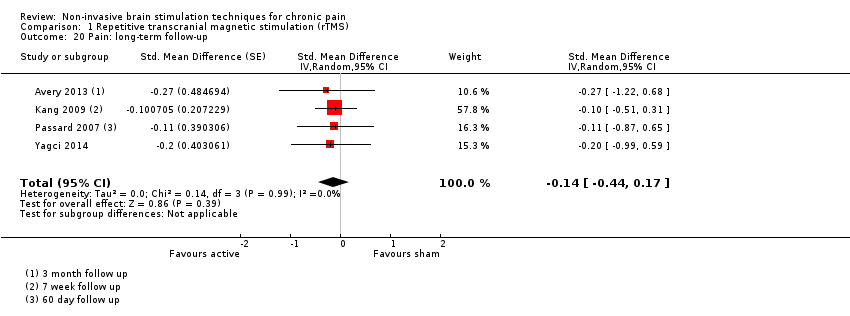
Comparison 1 Repetitive transcranial magnetic stimulation (rTMS), Outcome 20 Pain: long‐term follow‐up.

Comparison 1 Repetitive transcranial magnetic stimulation (rTMS), Outcome 21 Sensitivity analysis ‐ inclusion of high risk of bias studies. Pain: long‐term follow‐up.

Comparison 1 Repetitive transcranial magnetic stimulation (rTMS), Outcome 22 Disability: short‐term follow‐up.
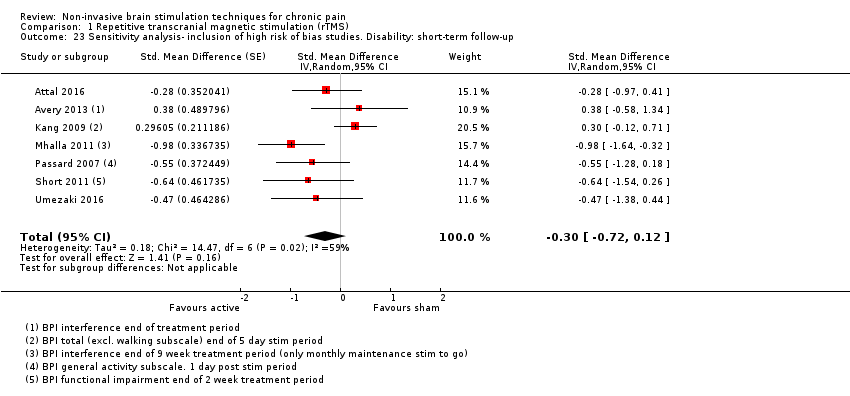
Comparison 1 Repetitive transcranial magnetic stimulation (rTMS), Outcome 23 Sensitivity analysis‐ inclusion of high risk of bias studies. Disability: short‐term follow‐up.

Comparison 1 Repetitive transcranial magnetic stimulation (rTMS), Outcome 24 Disability: medium‐term follow‐up.
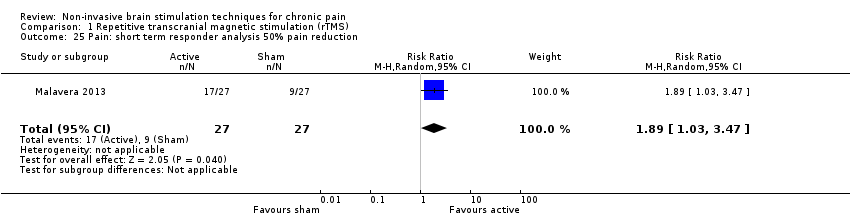
Comparison 1 Repetitive transcranial magnetic stimulation (rTMS), Outcome 25 Pain: short term responder analysis 50% pain reduction.

Comparison 1 Repetitive transcranial magnetic stimulation (rTMS), Outcome 26 Disability: long‐term follow‐up.
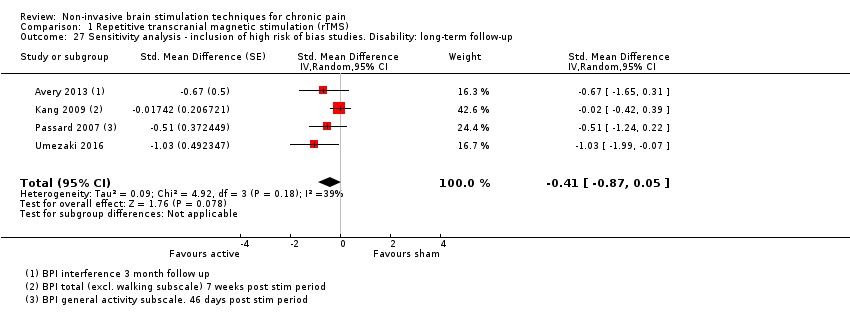
Comparison 1 Repetitive transcranial magnetic stimulation (rTMS), Outcome 27 Sensitivity analysis ‐ inclusion of high risk of bias studies. Disability: long‐term follow‐up.

Comparison 1 Repetitive transcranial magnetic stimulation (rTMS), Outcome 28 Quality of life: short‐term follow‐up (Fibromyalgia Impact Questionnaire).

Comparison 1 Repetitive transcranial magnetic stimulation (rTMS), Outcome 29 Quality of life: medium‐term follow‐up (Fibromyalgia Impact Questionnaire).

Comparison 1 Repetitive transcranial magnetic stimulation (rTMS), Outcome 30 Sensitivity analysis ‐ inclusion of high risk of bias studies. Quality of life: medium‐term follow‐up (Fibromyalgia Impact Questionnaire).

Comparison 1 Repetitive transcranial magnetic stimulation (rTMS), Outcome 31 Quality of life: long‐term follow‐up.
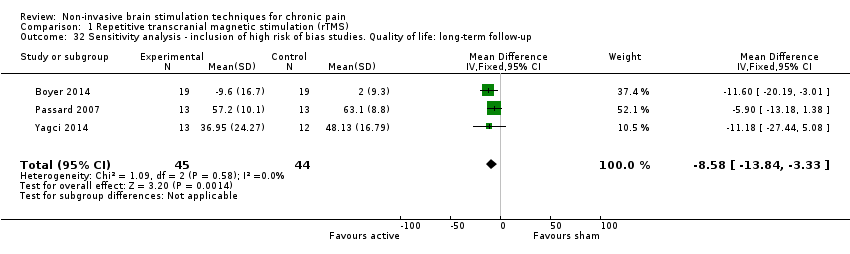
Comparison 1 Repetitive transcranial magnetic stimulation (rTMS), Outcome 32 Sensitivity analysis ‐ inclusion of high risk of bias studies. Quality of life: long‐term follow‐up.
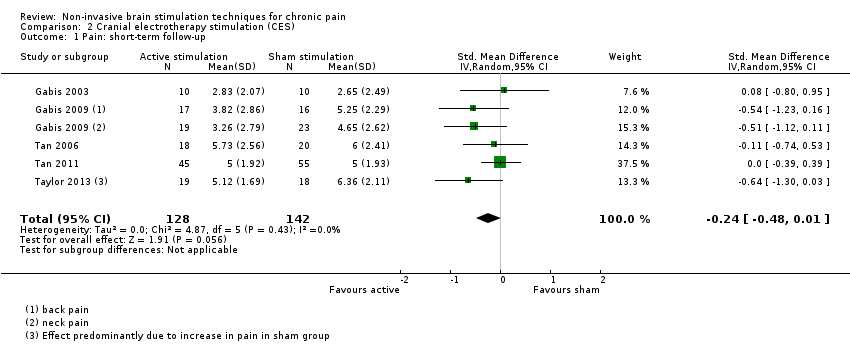
Comparison 2 Cranial electrotherapy stimulation (CES), Outcome 1 Pain: short‐term follow‐up.

Comparison 2 Cranial electrotherapy stimulation (CES), Outcome 2 Quality of life: short term follow up.

Comparison 3 Transcranial direct current stimulation (tDCS), Outcome 1 Pain: short‐term follow‐up.
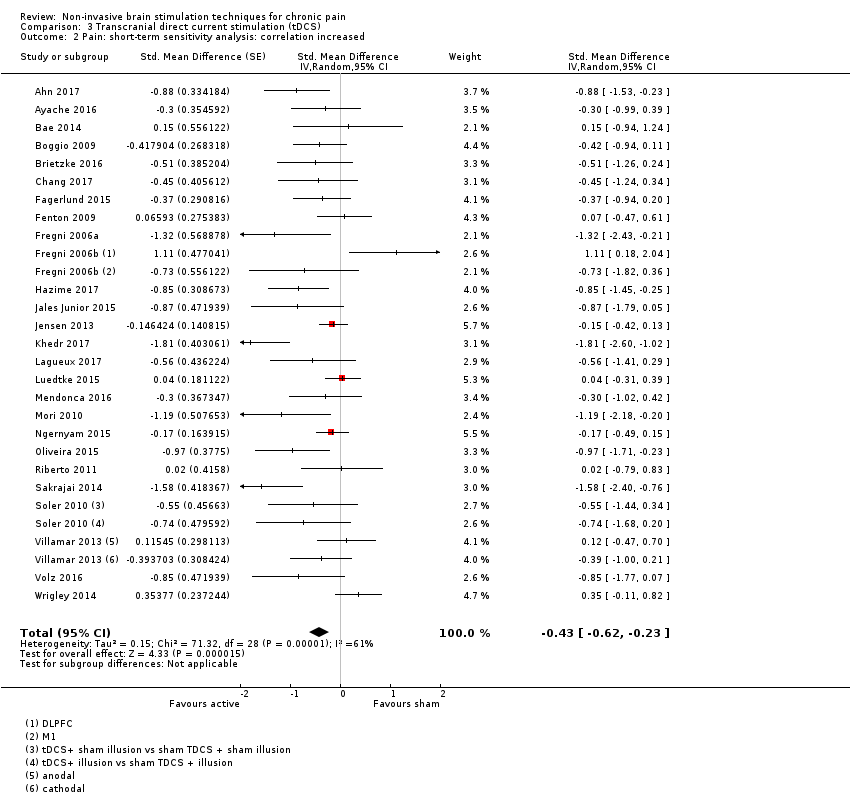
Comparison 3 Transcranial direct current stimulation (tDCS), Outcome 2 Pain: short‐term sensitivity analysis: correlation increased.
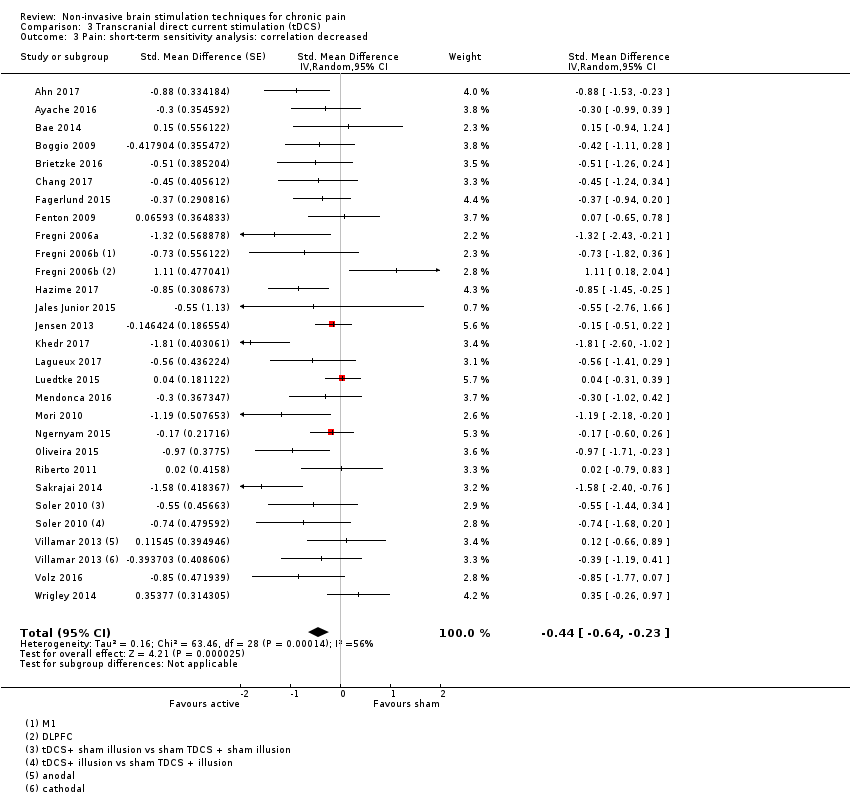
Comparison 3 Transcranial direct current stimulation (tDCS), Outcome 3 Pain: short‐term sensitivity analysis: correlation decreased.

Comparison 3 Transcranial direct current stimulation (tDCS), Outcome 4 Pain: short term sensitivity analysis, inclusion of high risk of bias studies.

Comparison 3 Transcranial direct current stimulation (tDCS), Outcome 5 Pain: short‐term follow‐up, subgroup analysis: motor cortex studies only.

Comparison 3 Transcranial direct current stimulation (tDCS), Outcome 6 Pain: short‐term follow‐up, subgroup analysis: motor cortex studies only, sensitivity analysis: correlation increased.

Comparison 3 Transcranial direct current stimulation (tDCS), Outcome 7 Pain: short‐term follow‐up, subgroup analysis: motor cortex studies only, sensitivity analysis: correlation decreased.

Comparison 3 Transcranial direct current stimulation (tDCS), Outcome 8 Pain: short‐term follow‐up, subgroup analysis, neuropathic and non neuropathic pain.

Comparison 3 Transcranial direct current stimulation (tDCS), Outcome 9 Pain: short term follow‐up responder analysis 30% pain reduction.

Comparison 3 Transcranial direct current stimulation (tDCS), Outcome 10 Pain: short term follow‐up responder analysis 50% pain reduction.
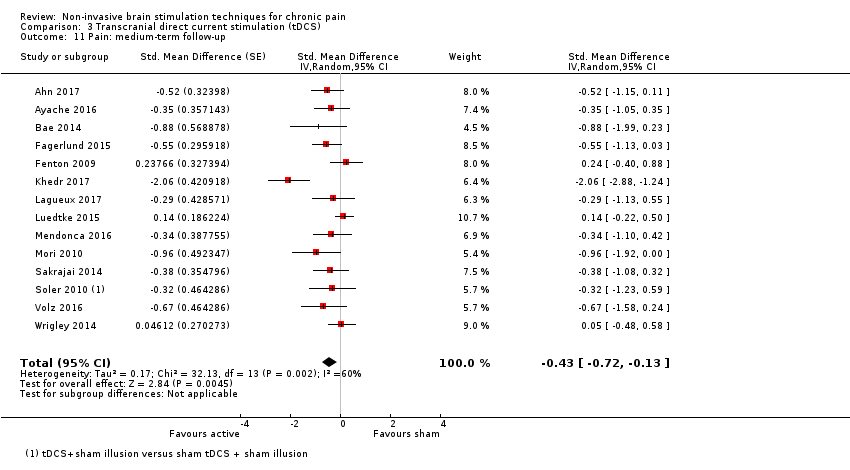
Comparison 3 Transcranial direct current stimulation (tDCS), Outcome 11 Pain: medium‐term follow‐up.

Comparison 3 Transcranial direct current stimulation (tDCS), Outcome 12 Pain: medium term follow‐up responder analysis 30% pain reduction.

Comparison 3 Transcranial direct current stimulation (tDCS), Outcome 13 Pain: medium term follow‐up responder analysis 50% pain reduction.

Comparison 3 Transcranial direct current stimulation (tDCS), Outcome 14 Sensitivity analysis ‐ inclusion of high risk of bias studies. Pain: medium‐term follow‐up.

Comparison 3 Transcranial direct current stimulation (tDCS), Outcome 15 Pain: long‐term follow‐up.

Comparison 3 Transcranial direct current stimulation (tDCS), Outcome 16 Disability: short‐term follow‐up.

Comparison 3 Transcranial direct current stimulation (tDCS), Outcome 17 Disability: medium‐term follow‐up.
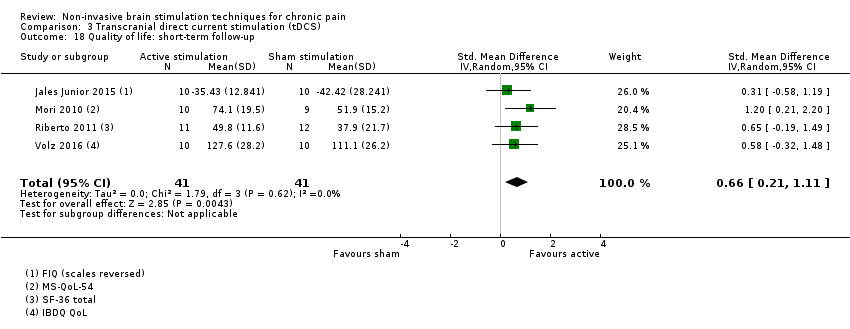
Comparison 3 Transcranial direct current stimulation (tDCS), Outcome 18 Quality of life: short‐term follow‐up.
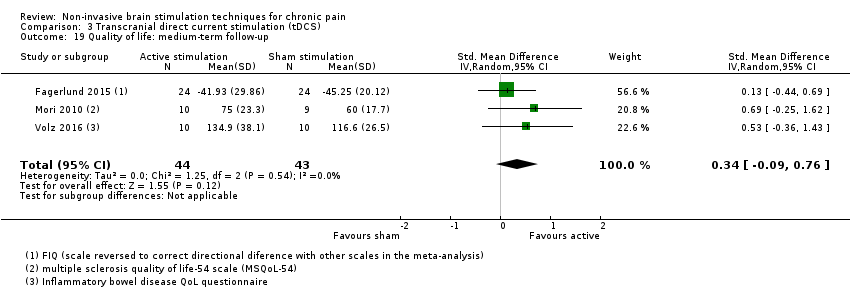
Comparison 3 Transcranial direct current stimulation (tDCS), Outcome 19 Quality of life: medium‐term follow‐up.

Comparison 4 Reduced impedance non‐invasive cortical electrostimulation (RINCE), Outcome 1 Pain: short‐term follow‐up.

Comparison 4 Reduced impedance non‐invasive cortical electrostimulation (RINCE), Outcome 2 Sensitivity analysis ‐ inclusion of high risk of bias studies. Pain: short‐term follow‐up.
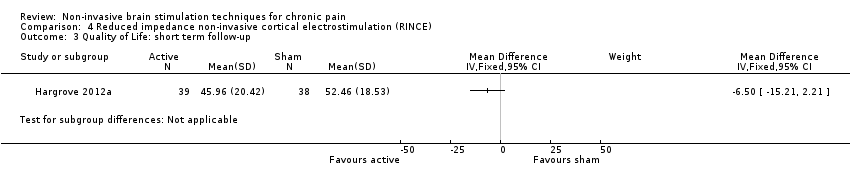
Comparison 4 Reduced impedance non‐invasive cortical electrostimulation (RINCE), Outcome 3 Quality of Life: short term follow‐up.

Comparison 4 Reduced impedance non‐invasive cortical electrostimulation (RINCE), Outcome 4 Sensitivity analysis ‐ inclusion of high risk of bias studies. Quality of life: short term follow‐up.

Comparison 5 Transcranial random noise stimulation, Outcome 1 Pain.
| rTMS compared with sham for chronic pain | ||||
| Patient or population: adults with chronic pain Settings: laboratory/ clinic Intervention: active rTMS Comparison: sham rTMS | ||||
| Outcomes | Effect size | Relative and absolute effect (average % improvement (reduction) in pain (95% CIs) in relation to post‐treatment score from sham group)* *Where 95%CIs do not cross the line of no effect. | No of participants | Quality of the evidence |
| Pain intensity (0 to < 1 week postintervention) measured using visual analogue scales or numerical rating scales | SMD ‐0.22 (‐0.29 to ‐0.16) | This equates to a 7% (95% CI 5% to 9%) reduction in pain intensity, or a 0.40 (95% CI 0.53 to 0.32) point reduction on a 0 to 10 pain intensity scale. | 655 (27) | ⊕⊕⊝⊝ low1 |
| Disability (0 to < 1 week postintervention) measured using self‐reported disability/pain interference scales | SMD ‐0.29, 95% CI ‐0.87 to 0.29 | ‐ | 119 (5) | ⊕⊝⊝⊝ very low2 |
| Quality of life (0 to < 1 week postintervention) measured using Fibromyalgia Impact Questionnaire | MD ‐10.80, 95% CI ‐15.04 to ‐6.55 | ‐ | 105 (4) | ⊕⊕⊝⊝ low3 |
| CI: confidence interval; MD: mean difference; rTMS: repetitive transcranial magnetic stimulation; SMD: standardised mean difference | ||||
| GRADE Working Group grades of evidence High quality: we are very confident that the true effect lies close to that of the estimate of the effect; Moderate quality: we are moderately confident in the effect estimate; the true effect is likely to be close to the estimate of effect, but there is a possibility that it is substantially different; Low quality: our confidence in the effect estimate is limited; the true effect may be substantially different from the estimate of the effect; Very low quality: we have very little confidence in the effect estimate; the true effect is likely to be substantially different from the estimate of effect. | ||||
| 1Downgraded once for study limitations due to high or unclear risk of bias and once for inconsistency due to heterogeneity. | ||||
| CES compared with sham for chronic pain | ||||
| Patient or population: adults with chronic pain Settings: laboratory/ clinic Intervention: active CES Comparison: sham CES | ||||
| Outcomes | Effect size | Relative effect (average % improvement (reduction) in pain (95% CIs) in relation to post‐treatment score from sham group)* *Where 95%CIs do not cross the line of no effect. | No of participants | Quality of the evidence |
| Pain intensity (0 to < 1 week postintervention) measured using visual analogue scales or numerical rating scales | SMD ‐0.24 (‐0.48 to 0.01) | ‐ | 270 (5) | ⊕⊕⊝⊝ low1 |
| Disability (0 to < 1 week postintervention) measured using self‐reported disability/pain interference scales | No data available | No data available | No data available | No data available |
| Quality of life (0 to < 1 week postintervention) measured using Fibromyalgia Impact Questionnaire | MD ‐25.05 (‐37.82 to ‐12.28) | ‐ | 36 (1) | ⊕⊝⊝⊝ very low2 |
| CI: confidence interval; CES: cranial electrotherapy stimulation; MD: mean difference; SMD: standardised mean difference | ||||
| GRADE Working Group grades of evidence High quality: we are very confident that the true effect lies close to that of the estimate of the effect; Moderate quality: we are moderately confident in the effect estimate; the true effect is likely to be close to the estimate of effect, but there is a possibility that it is substantially different; Low quality: our confidence in the effect estimate is limited; the true effect may be substantially different from the estimate of the effect; Very low quality: we have very little confidence in the effect estimate; the true effect is likely to be substantially different from the estimate of effect. | ||||
| 1Downgraded once for study limitations due to high or unclear risk of bias and once for imprecision due to low participant numbers. | ||||
| tDCS compared with sham for chronic pain | ||||
| Patient or population: adults with chronic pain Settings: laboratory/ clinic Intervention: active tDCS Comparison: sham tDCS | ||||
| Outcomes | Effect size | Relative effect (average % improvement (reduction) in pain (95% CIs) in relation to post‐treatment score from sham group)* *Where 95%CIs do not cross the line of no effect. | No of participants | Quality of the evidence |
| Pain intensity (0 to < 1 week postintervention) measured using visual analogue scales or numerical rating scales | SMD ‐0.43 (‐0.63 to ‐0.22) | This equates to a 17% (95% CI 9% to 25%) reduction in pain intensity or a 0.82 (95% CI 0.42 to 1.2) point reduction on a 0 to 10 pain intensity scale. | 747 (27) | ⊕⊝⊝⊝ very low1 |
| Disability (0 to < 1 week postintervention) measured using self‐reported disability/pain interference scales | SMD ‐0.01, (95% CI ‐0.28 to 0.26) | ‐ | 212 (4) | ⊕⊕⊝⊝ low2 |
| Quality of life (0 to < 1 week postintervention) measured using different scales across studies | SMD 0.66, 95% CI 0.21 to 1.11 | ‐ | 82 (4) | ⊕⊕⊝⊝ low2 |
| CI: confidence interval; MD: mean difference; SMD: standardised mean difference; tDCS: transcranial direct current stimulation | ||||
| GRADE Working Group grades of evidence High quality: we are very confident that the true effect lies close to that of the estimate of the effect; Moderate quality: we are moderately confident in the effect estimate; the true effect is likely to be close to the estimate of effect, but there is a possibility that it is substantially different; Low quality: our confidence in the effect estimate is limited; the true effect may be substantially different from the estimate of the effect; Very low quality: we have very little confidence in the effect estimate; the true effect is likely to be substantially different from the estimate of effect. | ||||
| 1Downgraded once for study limitations due to high or unclear risk of bias, once for inconsistency due to heterogeneity and once for evidence of possible publication bias. | ||||
| Study | Location of stimulation | Coil orientation | Frequency (Hz) | Intensity (% RMT) | Number of trains | Duration of trains | Inter‐train intervals (sec) | Number of pulses per session | Treatment sessions per group |
| M1 stump region | 45° angle from sagittal line | 20 | 80 | 10 | 10 sec | 50 | 2000 | 5, x 1 daily | |
| M1 contralateral to painful side | Anteroposterior induced current | 10 | 80 | 30 | 10 | 20 | 3000 | 3, x1 daily | |
| M1 contralateral to painful side | Posteroanterior | 20, 1 | 90 | 20 Hz: 20 1 Hz: 1 | 20 Hz: 4 sec 1 Hz: 26 min | 20 Hz: 84 | 1600 | 1 | |
| M1 contralateral to painful side | Posteroanterior Medial‐lateral | 20 | 90 | 20 | 4 sec | 84 | 1600 | 1 | |
| M1 hand area, not clearly reported but likely contralateral to painful side | Not specified | 20 | 90 | 20 | 4 sec | 84 | 1600 | 1 | |
| Left DLPFC | Not specified | 10 | 120 | 75 | 4 | 26 | 3000 | 15 | |
| Left PFC | Not specified | 10 | 100 | 40 | 10 sec | 20 | 4000 | 3 over a 5‐day period | |
| Left M1 | anteroposterior | 10 | 90 | 20 | 10 | 50 | 2000 | 14, 10 sessions in 2 weeks followed by maintenance phase of 1 session at weeks 4, 6, 8, and 10 | |
| Right DLPFC | Not specified | 1 | 110 | 20 | 60 sec | 45 | 1200 | Up to 20 on consecutive working days | |
| Left M1 | 45° angle from sagittal line | 10 | 80 | 16 | 10 | 26 | 1600 | 10, timescale not specified | |
| M1 midline | Not specified | 5 | 115 | 500 | 10 sec | 30 | ? 500* | 10, x 1 daily | |
| Left DLPFC/premotor | not specified | 10 | 120 | 25 | 5 sec | 25 | 1250 | 10, x 1 daily (working days) for 2 weeks | |
| Left and right SII | Not specified | 1 or 20 | 90 | Not specified | Not specified | Not specified | 1600 | 1 | |
| Right SII | Not specified | 1 | 70% maximum stimulator output intensity (not RMT) | 1 | Not specified | Not specified | 1600 | 10, x 1 daily (weekdays only) | |
| M1, S1, PMA, SMA | Not specified | 5 | 90 | 10 | 10 sec | 50 | 500 | 1 | |
| M1 corresponding to painful region | Not specified | 5 | 90 | 10 | 10 sec | 50 | 500 | 10, x 1 daily (weekdays only) | |
| M1 contralateral to painful side | Not specified | 5, 1 | 95 | Not specified | Not specified | Not specified | 500 | 1 | |
| M1 hand or leg area with neuro navigation | 45º postero‐lateral | 10 | 90 | 40 | 5 | 25 | 2000 | 1, per stimulation condition | |
| Right M1 | 45º postero‐lateral | 10 | 80 | 20 | 5 sec | 55 | 1000 | 5, x 1 daily | |
| M1 contralateral to painful side | Not specified | 20 | 80 | 10 | 10 sec | 50 | 2000 | 5, x 1 daily | |
| Right DLPFC (low‐frequency) Left M1 (high‐frequency) | Not specified | 10, 1 | 10 Hz: 80 1 Hz: 110 | 10 Hz: 25 1 Hz: 2 | 10 Hz: 8 sec 1 Hz: 800 sec | 10 Hz: 10 1 Hz: 60 | 10 Hz: 2000 1 Hz: 1600 | 10, x 1 daily (weekdays only) | |
| M1 contralateral to painful side | Not specified | 10 | 80 | 20 | 5 sec | 55 | 1000 | 1 | |
| M1 contralateral to painful side | Posteroanterior | 10, 0.5 | 80 | 10 Hz: 20 0.5 Hz: 1 | 10 Hz: 5 sec 0.5 Hz: 20 min | 10 Hz: 55 | 10 Hz: 1000 0.5 Hz: 600 | 1 | |
| M1 contralateral to painful side | Posteroanterior | 10 | 80 | 20 | 5 sec | 55 | 1000 | 1 | |
| M1 contralateral to painful side | Posteroanterior | 10, 1 | 90 | 10 Hz: 20 1 Hz: 1 | 10 Hz: 6 sec 1 Hz: 20 min | 10 Hz: 54 | 10 Hz: 1200 1 Hz: 1200 | 1 | |
| M1 contralateral to painful side | Posteroanterior | 10, 1 | 90 | 10 Hz: 20 1 Hz: 1 | 10 Hz: 6 sec 1 Hz: 20 min | 10 Hz: 54 | 10 Hz: 1200 1 Hz: 1200 | 1 | |
| M1 contralateral to painful side | 45° angle from sagittal line | 10 | 90 | 20 | 6 | 54 | 1200 | 10, x 1 daily (weekdays only) | |
| Left M1 | 45° angle from sagittal line | 10 | 80 | not reported | not reported | not reported | 1600 | 10, x 1 daily | |
| Left M1 | Posteroanterior | 10 | 80 | 15 | 10 sec | 50 | 1500 | 14, 5 x 1 daily (working days), then 3 x 1 weekly, then 3 x 1 fortnightly, then 3 x 1 monthly | |
| Left PFC | Posteroanterior | 10 | 120 | 25 | 5 sec | 25 | 1250 | 10, x5 per week for 2 weeks | |
| M1 hotspot contralateral to pain M1 in reorganised area contralateral to pain | Posteroanterior | 10 | 90 | 20 | 10 sec | 60 | 2000 | 5, x 3‐5 times per week | |
| M1 deep central sulcus | H‐coil | 20 | 100 | 30 | 2.5 sec | 30 | 1500 | 5, x 1 daily on consecutive days | |
| M1 contralateral to painful side | Posteroanterior | 10 | 80 | 25 | 8 sec | 52 | 2000 | 10, x 1 daily (working days) | |
| M1 contralateral to painful side | Posteroanterior | 10 | 100 | 25 | 10 sec | 60 | 2500 | 10, x 1 daily (working days) | |
| M1 hand area | Not specified | 10 | 110 | 10 | 1.2 sec | 10 | 120 | 1 | |
| M1 midline | Not specified | 20 | 80 | 20 | 2 sec | Not specified | 800 | 1 | |
| M1 over motor representation of painful area | Not specified | 10, 5, 1 | 90 | 10 Hz; 5 5 Hz: 10 1 Hz: 1 | 10 Hz: 10 sec 5 Hz: 10 sec 1 Hz: 500 sec | 10 Hz: 50 5 Hz: 50 | 500 | 1 | |
| Left DLPFC | Parasagittal | 10 | 120 | 80 | 5 sec | 10 sec | 4000 | 10, x 1 daily (working days) for 2 weeks | |
| M1 midline | 45° angle from sagittal line | 10 | 100 | 30 | 5 | 12 | 1500 | 10, x 1 daily (not clear if only work days) | |
| Targeted to ACC | 4‐coil configuration | 1 Hz (10 Hz data excluded as not randomised) | 110 | Not reported | Not reported | Not reported | 1800 | 20, x 1 daily (working days) | |
| Left DLPFC | Not specified | 10 | 100 | 10 | 5 | 10 | 3000 | 10, x1 daily (working days) | |
| Left M1 | Not specified | 1 | 90 | 20 | 60 | 45 | 1200 | 10, x1 daily (working days) | |
| M1 midline | Handle pointing posteriorly | 10 | 10 | 30 | 5 | 25 | 1500 | 10, x1 daily (working days) | |
| ACC: anterior cingulate cortex; DLPFC: dorsolateral prefrontal cortex; M1: primary motor cortex; PFC: prefrontal cortex; PMA: pre‐motor area; RMT: resting motor threshold; dS1: primary somatosensory cortex; SII: secondary somatosensory cortex; SMA: supplementary motor area *Inconsistency between stimulation parameters and reported total number of pulses in study report. See Included studies section for mored detail. | |||||||||
| Study | Electrode placement | Frequency (Hz) | Pulse width (ms) | Waveform shape | Intensity | Duration (min) | Treatment sessions per group |
| Ear clip electrodes | 10 | 2 | Not specified | 12 μA | 53 | x 2 daily for 4 days | |
| Ear clip electrodes | 0.5 | Not specified | Modified square‐wave biphasic | 100 μA | 60 | ? daily for 3 weeks | |
| Mastoid processes and forehead | 77 | 3.3 | Biphasic asymmetric | ≤ 4 mA | 30 | x 1 daily for 8 days | |
| Mastoid processes and forehead | 77 | 3.3 | Biphasic asymmetric | ≤ 4 mA | 30 | x 1 daily for 8 days | |
| Mastoid processes and forehead | Not specified | Not specified | 2 conditions: symmetric, asymmetric | 11 to 15 mA | 40 | x 1 daily for 5 days | |
| Ear clip electrodes | 0.5 | Not specified | Biphasic square wave | 100 μA | 60 | x 1 daily for 30 days | |
| Ear clip electrodes | Not specified | Not specified | Not specified | 100 μA | 40 | x 1 daily for 6 weeks | |
| Ear clip electrodes | 0.5 | Not specified | Not specified | 10 to 600 μA | 20 | 12 (timing not specified) | |
| Ear clip electrodes | Not specified | Not specified | Not specified | 100 to 500 μA | 60 | x 1 daily for 21 days | |
| Ear clip electrodes | Not specified | Not specified | Not specified | 100 μA | 60 | x 1 daily for 21 days | |
| Ear clip electrodes | 0.5 | Not specified | Modified square‐wave biphasic | 100 μA | 60 | x 1 daily for 8 weeks |
| Study | Location of stimulation (Anode) | Electrode pad size | Intensity (mA) | Anodal or cathodal? | Stimulus duration (min) | Treatment sessions per group |
| M1 contralateral to painful side | 35 cm2 | 2 mA | Anodal | 20 | 5, x 1 daily | |
| M1 left hand area | 35 cm2 | 1 mA | Anodal | 20 | 5, x 1 daily | |
| Left DLPFC | 25 cm2 | 2mA | Anodal | 20 | 3, x 1 daily | |
| M1 contralateral to painful side | 35 cm2 | 2 mA | Anodal | 20 | x 3 per week for 3 weeks | |
| M1 contralateral to painful side | 35 cm2 | 2 mA | Anodal | 30 | 1 | |
| Left M1 | 25‐35 cm2 | 2 mA | Anodal | 20 | 5, x 1 daily | |
| M1 contralateral to painful side | 35 cm2 | 1 mA | Anodal | 20 | 16, x 2 weekly for 8 weeks | |
| M1 contralateral to painful side | HD‐tDCS | 2 mA | Anodal | 20 | 5, x 1 daily | |
| M1, side not specified | 35 cm2 | 2mA | Anodal | 20 | 5, x 1 daily | |
| M1 dominant hemisphere | 35 cm2 | 1 mA | Anodal | 20 | 2 | |
| M1 contralateral to painful side or dominant hand | 35 cm2 | 2 mA | Anodal | 20 | 5, x 1 daily | |
| M1 and DLPFC contralateral to painful side or dominant hand | 35 cm2 | 2 mA | Anodal | 20 | 5, x 1 daily | |
| M1 contralateral to painful side | 40 cm2 | 1mA | Anodal | 20 | Daily, self‐administered for 14 days | |
| M1 contralateral to painful side | 35 cm2 | 2 mA | Anodal | 20 | 5, x 1 daily | |
| M1 contralateral to painful side | 35 cm2 | 2 mA | Anodal | 20 | 12, x 3 per week for 4 weeks | |
| Left M1 | 15 cm2 | 1mA | Anodal | 20 | x 1 weekly for 10 weeks | |
| M1 left | 35cm2 | 2 mA | Anodal | 20 | 1 | |
| M1 contralateral to painful side | 24 cm2 | 2 mA | Anodal | 20 | 10, x 1 daily, 5 days per week for 2 weeks | |
| M1, side not specified DLPFC | 25 cm2 | 2mA | Anodal | 20 | 5, x 1 daily | |
| M1 contralateral to painful side | 35 cm2 | 2 mA | Anodal | 20 | 14, x 5 weekly for 2 weeks, x 1 weekly for 4 weeks | |
| M1 left side not specified | 35 cm2 | 2 mA | Anodal | 20 | 5, x 1 daily | |
| Group 1: anodal left M1 Group 2: cathodal left M1 Group 3: anodal supraorbital Group 4: cathodal supraorbital Group 5: sham | 35 cm2 | 2 mA | Anodal or cathodal | 20 | 1 | |
| Left M1 | 35 cm2 | 2 mA | Anodal | 20 | 5, x 1 daily | |
| M1 contralateral to painful side | 35 cm2 | 2 mA | Anodal | 20 | 5, x 1 daily | |
| M1 contralateral to painful side | 35 cm2 | 2 mA | Anodal | 20 | 1 | |
| M1 contralateral to painful side | 35 cm2 | 2 mA | Anodal | 20 | 5, x 1 daily, then x 2 weekly for 3 weeks, up to 10 sessions | |
| M1 contralateral to painful side | 35 cm2 | 2 mA | Anodal | 20 | x 1 per condition | |
| M1 contralateral to painful side or dominant hand | 35 cm2 | 2 mA | Anodal | 20 | 10, x 1 weekly | |
| M1 contralateral to painful side | 35 cm2 | 1 mA | Anodal | 20 | 5, x 1 daily | |
| M1 contralateral to painful side or dominant hand | 35 cm2 | 2 mA | Anodal | 20 | 10, x 1 daily (weekdays only) | |
| Left M1 | 25 cm2 | 2 mA | Anodal | 20 | 5, x 1 daily | |
| M1 contralateral to painful side | 35 cm2 | 2 mA | Anodal | 20 | 5, x 1 daily | |
| M1 and DLPFC contralateral to painful side or dominant hand | 35 cm2 | 2 mA | Anodal | 20 | 5, x 1 daily | |
| M1 left | HD‐tDCS 4 x 1‐ring montage | 2 mA | Anodal or cathodal | 20 | x 1 per condition | |
| M1 contralateral to painful side or dominant hand | 35 cm2 | 2 mA | Anodal | 20 | 5, x 1 daily | |
| M1 contralateral to painful side | 35 cm2 | 2 mA | Anodal | 20 | 5, x 1 daily | |
| DLPFC: dorsolateral prefrontal cortex; HD‐tDCS: high definition tDCS; M1: primary motor cortex | ||||||
| Outcome or subgroup title | No. of studies | No. of participants | Statistical method | Effect size |
| 1 Pain: short‐term follow‐up Show forest plot | 27 | Std. Mean Difference (Fixed, 95% CI) | ‐0.22 [‐0.29, ‐0.16] | |
| 1.1 Low‐frequency ≤ 1 Hz | 7 | Std. Mean Difference (Fixed, 95% CI) | 0.13 [‐0.03, 0.28] | |
| 1.2 High‐frequency ≥ 5 Hz | 25 | Std. Mean Difference (Fixed, 95% CI) | ‐0.30 [‐0.37, ‐0.23] | |
| 2 Pain: short‐term follow‐up, subgroup analysis: multiple‐dose vs single‐dose studies Show forest plot | 27 | Std. Mean Difference (Random, 95% CI) | ‐0.26 [‐0.40, ‐0.13] | |
| 2.1 Single‐dose studies | 13 | Std. Mean Difference (Random, 95% CI) | ‐0.23 [‐0.36, ‐0.10] | |
| 2.2 Multiple‐dose studies | 14 | Std. Mean Difference (Random, 95% CI) | ‐0.40 [‐0.76, ‐0.05] | |
| 3 Pain: short‐term follow‐up, subgroup analysis, neuropathic pain participants only Show forest plot | 17 | Std. Mean Difference (Fixed, 95% CI) | ‐0.20 [‐0.28, ‐0.13] | |
| 3.1 Low‐frequency ≤ 1 Hz | 5 | Std. Mean Difference (Fixed, 95% CI) | 0.15 [‐0.02, 0.32] | |
| 3.2 High‐frequency ≥ 5 Hz | 17 | Std. Mean Difference (Fixed, 95% CI) | ‐0.28 [‐0.36, ‐0.20] | |
| 4 Pain: short‐term follow‐up, subgroup analysis, non‐neuropathic pain participants only Show forest plot | 8 | Std. Mean Difference (Fixed, 95% CI) | ‐0.39 [‐0.61, ‐0.17] | |
| 4.1 Low‐frequency ≤ 1 Hz | 1 | Std. Mean Difference (Fixed, 95% CI) | 0.16 [‐0.29, 0.61] | |
| 4.2 High‐frequency ≥ 5 Hz | 7 | Std. Mean Difference (Fixed, 95% CI) | ‐0.56 [‐0.81, ‐0.31] | |
| 5 Pain: short‐term follow‐up, subgroup analysis: motor cortex studies only, low‐frequency studies excluded Show forest plot | 21 | Std. Mean Difference (Random, 95% CI) | ‐0.37 [‐0.51, ‐0.22] | |
| 5.1 Single‐dose studies | 13 | Std. Mean Difference (Random, 95% CI) | ‐0.38 [‐0.49, ‐0.27] | |
| 5.2 Multiple‐dose studies | 8 | Std. Mean Difference (Random, 95% CI) | ‐0.34 [‐0.73, 0.05] | |
| 6 Sensitivity analysis ‐ imputed correlation coefficient increased. Pain: short‐term follow‐up Show forest plot | 29 | Std. Mean Difference (Random, 95% CI) | ‐0.27 [‐0.40, ‐0.14] | |
| 6.1 Low‐frequency ≤ 1 Hz | 7 | Std. Mean Difference (Random, 95% CI) | 0.15 [0.01, 0.29] | |
| 6.2 High‐frequency ≥ 5 Hz | 28 | Std. Mean Difference (Random, 95% CI) | ‐0.35 [‐0.49, ‐0.22] | |
| 7 Sensitivity analysis ‐ imputed correlation coefficient decreased. Pain: short‐term follow‐up Show forest plot | 28 | Std. Mean Difference (Random, 95% CI) | ‐0.26 [‐0.40, ‐0.13] | |
| 7.1 Low‐frequency ≤ 1 Hz | 7 | Std. Mean Difference (Random, 95% CI) | 0.13 [‐0.06, 0.33] | |
| 7.2 High‐frequency ≥ 5 Hz | 26 | Std. Mean Difference (Random, 95% CI) | ‐0.34 [‐0.49, ‐0.19] | |
| 8 Sensitivity analysis ‐ imputed correlation increased. Pain: short‐term follow‐up, subgroup analysis: motor cortex studies only, low‐frequency studies excluded Show forest plot | 20 | Std. Mean Difference (Random, 95% CI) | ‐0.37 [‐0.50, ‐0.24] | |
| 8.1 Single‐dose studies | 13 | Std. Mean Difference (Random, 95% CI) | ‐0.39 [‐0.50, ‐0.28] | |
| 8.2 Multiple‐dose studies | 7 | Std. Mean Difference (Random, 95% CI) | ‐0.33 [‐0.71, 0.04] | |
| 9 Sensitivity analysis ‐ imputed correlation decreased. Pain: short‐term follow‐up, subgroup analysis: motor cortex studies only, low‐frequency studies excluded Show forest plot | 20 | Std. Mean Difference (Random, 95% CI) | ‐0.37 [‐0.52, ‐0.22] | |
| 9.1 Single‐dose studies | 13 | Std. Mean Difference (Random, 95% CI) | ‐0.37 [‐0.47, ‐0.26] | |
| 9.2 Multiple‐dose studies | 7 | Std. Mean Difference (Random, 95% CI) | ‐0.36 [‐0.81, 0.09] | |
| 10 Sensitivity analysis ‐ inclusion of high risk of bias studies. Pain: short‐term follow‐up Show forest plot | 31 | Std. Mean Difference (Fixed, 95% CI) | ‐0.27 [‐0.34, ‐0.20] | |
| 10.1 Low‐frequency ≤ 1 Hz | 10 | Std. Mean Difference (Fixed, 95% CI) | 0.07 [‐0.07, 0.22] | |
| 10.2 High‐frequency ≥ 5 Hz | 28 | Std. Mean Difference (Fixed, 95% CI) | ‐0.36 [‐0.44, ‐0.29] | |
| 11 Sensitivity analysis ‐ inclusion of high risk of bias studies. Pain: short‐term follow‐up, subgroup analysis: motor cortex studies only, low‐frequency studies excluded Show forest plot | 24 | Std. Mean Difference (Random, 95% CI) | ‐0.41 [‐0.55, ‐0.26] | |
| 11.1 Single‐dose studies | 15 | Std. Mean Difference (Random, 95% CI) | ‐0.35 [‐0.46, ‐0.24] | |
| 11.2 Multiple‐dose studies | 10 | Std. Mean Difference (Random, 95% CI) | ‐0.53 [‐0.91, ‐0.15] | |
| 12 Pain: short‐term follow‐up, subgroup analysis: prefrontal cortex studies only Show forest plot | 6 | Std. Mean Difference (Random, 95% CI) | ‐0.67 [‐1.48, 0.15] | |
| 12.1 Low frequency ≤ 1 Hz | 1 | Std. Mean Difference (Random, 95% CI) | 0.16 [‐0.29, 0.61] | |
| 12.2 High frequency ≥ 5 Hz | 5 | Std. Mean Difference (Random, 95% CI) | ‐0.92 [‐1.95, 0.12] | |
| 13 Sensitivity analysis ‐ inclusion of high risk of bias studies. Pain: short‐term follow‐up, subgroup analysis: prefrontal cortex studies only Show forest plot | 7 | Std. Mean Difference (Random, 95% CI) | ‐0.64 [‐1.36, 0.08] | |
| 13.1 Multiple‐dose studies | 7 | Std. Mean Difference (Random, 95% CI) | ‐0.64 [‐1.36, 0.08] | |
| 14 Pain: short term responder analysis 30% pain reduction Show forest plot | 2 | 89 | Risk Ratio (M‐H, Random, 95% CI) | 2.11 [1.17, 3.80] |
| 15 Sensitivity analysis‐ inclusion of high risk of bias studies. Disability: medium‐term follow‐up Show forest plot | 5 | Std. Mean Difference (Random, 95% CI) | ‐0.42 [‐1.01, 0.17] | |
| 16 Pain: medium‐term follow‐up Show forest plot | 11 | Std. Mean Difference (Random, 95% CI) | ‐0.28 [‐0.61, 0.05] | |
| 16.1 Low‐frequency ≤ 1 Hz | 2 | Std. Mean Difference (Random, 95% CI) | 0.14 [‐0.41, 0.69] | |
| 16.2 High‐frequency ≥ 5 Hz | 9 | Std. Mean Difference (Random, 95% CI) | ‐0.36 [‐0.73, 0.00] | |
| 17 Sensitivity analysis ‐ inclusion of high risk of bias studies. Pain: medium‐term follow‐up Show forest plot | 15 | Std. Mean Difference (Random, 95% CI) | ‐0.50 [‐0.80, ‐0.20] | |
| 17.1 Low‐frequency ≤ 1 Hz | 3 | Std. Mean Difference (Random, 95% CI) | 0.02 [‐0.52, 0.56] | |
| 17.2 High‐frequency ≥ 5 Hz | 13 | Std. Mean Difference (Random, 95% CI) | ‐0.57 [‐0.90, ‐0.25] | |
| 18 Pain: medium‐term follow‐up, subgroup analysis: motor cortex studies only Show forest plot | 6 | Std. Mean Difference (Random, 95% CI) | ‐0.22 [‐0.46, 0.02] | |
| 18.1 Low frequency ≤ 1Hz | 1 | Std. Mean Difference (Random, 95% CI) | ‐0.08 [‐0.86, 0.70] | |
| 18.2 High‐frequency ≥ 5 Hz | 5 | Std. Mean Difference (Random, 95% CI) | ‐0.23 [‐0.49, 0.03] | |
| 19 Pain: medium‐term follow‐up, subgroup analysis: prefrontal cortex studies only Show forest plot | 5 | Std. Mean Difference (Random, 95% CI) | ‐1.08 [‐2.49, 0.32] | |
| 19.1 Low frequency ≤ 1 Hz | 1 | Std. Mean Difference (Random, 95% CI) | 0.36 [‐0.41, 1.13] | |
| 19.2 High‐frequency ≥ 5 Hz | 4 | Std. Mean Difference (Random, 95% CI) | ‐1.74 [‐3.66, 0.19] | |
| 20 Pain: long‐term follow‐up Show forest plot | 4 | Std. Mean Difference (Random, 95% CI) | ‐0.14 [‐0.44, 0.17] | |
| 21 Sensitivity analysis ‐ inclusion of high risk of bias studies. Pain: long‐term follow‐up Show forest plot | 5 | Std. Mean Difference (Random, 95% CI) | ‐0.40 [‐0.89, 0.10] | |
| 22 Disability: short‐term follow‐up Show forest plot | 5 | Std. Mean Difference (Random, 95% CI) | ‐0.29 [‐0.87, 0.29] | |
| 23 Sensitivity analysis‐ inclusion of high risk of bias studies. Disability: short‐term follow‐up Show forest plot | 7 | Std. Mean Difference (Random, 95% CI) | ‐0.30 [‐0.72, 0.12] | |
| 24 Disability: medium‐term follow‐up Show forest plot | 4 | Std. Mean Difference (Random, 95% CI) | ‐0.37 [‐1.07, 0.33] | |
| 25 Pain: short term responder analysis 50% pain reduction Show forest plot | 1 | 54 | Risk Ratio (M‐H, Random, 95% CI) | 1.89 [1.03, 3.47] |
| 26 Disability: long‐term follow‐up Show forest plot | 3 | Std. Mean Difference (Random, 95% CI) | ‐0.23 [‐0.62, 0.16] | |
| 27 Sensitivity analysis ‐ inclusion of high risk of bias studies. Disability: long‐term follow‐up Show forest plot | 4 | Std. Mean Difference (Random, 95% CI) | ‐0.41 [‐0.87, 0.05] | |
| 28 Quality of life: short‐term follow‐up (Fibromyalgia Impact Questionnaire) Show forest plot | 4 | 105 | Mean Difference (IV, Random, 95% CI) | ‐10.80 [‐15.04, ‐6.55] |
| 29 Quality of life: medium‐term follow‐up (Fibromyalgia Impact Questionnaire) Show forest plot | 4 | 105 | Mean Difference (IV, Fixed, 95% CI) | ‐11.49 [‐16.73, ‐6.25] |
| 30 Sensitivity analysis ‐ inclusion of high risk of bias studies. Quality of life: medium‐term follow‐up (Fibromyalgia Impact Questionnaire) Show forest plot | 5 | 143 | Mean Difference (IV, Fixed, 95% CI) | ‐8.93 [‐13.49, ‐4.37] |
| 31 Quality of life: long‐term follow‐up Show forest plot | 2 | 51 | Mean Difference (IV, Fixed, 95% CI) | ‐6.78 [‐13.43, ‐0.14] |
| 32 Sensitivity analysis ‐ inclusion of high risk of bias studies. Quality of life: long‐term follow‐up Show forest plot | 3 | 89 | Mean Difference (IV, Fixed, 95% CI) | ‐8.58 [‐13.84, ‐3.33] |
| Outcome or subgroup title | No. of studies | No. of participants | Statistical method | Effect size |
| 1 Pain: short‐term follow‐up Show forest plot | 5 | 270 | Std. Mean Difference (IV, Random, 95% CI) | ‐0.24 [‐0.48, 0.01] |
| 2 Quality of life: short term follow up Show forest plot | 1 | Mean Difference (IV, Random, 95% CI) | Subtotals only | |
| Outcome or subgroup title | No. of studies | No. of participants | Statistical method | Effect size |
| 1 Pain: short‐term follow‐up Show forest plot | 26 | Std. Mean Difference (Random, 95% CI) | ‐0.43 [‐0.63, ‐0.22] | |
| 1.1 Single‐dose studies | 4 | Std. Mean Difference (Random, 95% CI) | ‐0.18 [‐0.38, 0.02] | |
| 1.2 Multiple‐dose studies | 22 | Std. Mean Difference (Random, 95% CI) | ‐0.51 [‐0.77, ‐0.25] | |
| 2 Pain: short‐term sensitivity analysis: correlation increased Show forest plot | 26 | Std. Mean Difference (Random, 95% CI) | ‐0.43 [‐0.62, ‐0.23] | |
| 3 Pain: short‐term sensitivity analysis: correlation decreased Show forest plot | 26 | Std. Mean Difference (Random, 95% CI) | ‐0.44 [‐0.64, ‐0.23] | |
| 4 Pain: short term sensitivity analysis, inclusion of high risk of bias studies Show forest plot | 31 | Std. Mean Difference (Random, 95% CI) | ‐0.48 [‐0.67, ‐0.29] | |
| 4.1 Single‐dose studies | 4 | Std. Mean Difference (Random, 95% CI) | ‐0.18 [‐0.38, 0.02] | |
| 4.2 Multiple‐dose studies | 27 | Std. Mean Difference (Random, 95% CI) | ‐0.56 [‐0.79, ‐0.32] | |
| 5 Pain: short‐term follow‐up, subgroup analysis: motor cortex studies only Show forest plot | 25 | Std. Mean Difference (Random, 95% CI) | ‐0.47 [‐0.67, ‐0.28] | |
| 5.1 Single‐dose studies | 4 | Std. Mean Difference (Random, 95% CI) | ‐0.18 [‐0.38, 0.02] | |
| 5.2 Multiple‐dose studies | 21 | Std. Mean Difference (Random, 95% CI) | ‐0.58 [‐0.84, ‐0.33] | |
| 6 Pain: short‐term follow‐up, subgroup analysis: motor cortex studies only, sensitivity analysis: correlation increased Show forest plot | 26 | Std. Mean Difference (Random, 95% CI) | ‐0.45 [‐0.64, ‐0.26] | |
| 6.1 Single‐dose studies | 4 | Std. Mean Difference (Random, 95% CI) | ‐0.18 [‐0.37, 0.01] | |
| 6.2 Multiple‐dose studies | 22 | Std. Mean Difference (Random, 95% CI) | ‐0.55 [‐0.81, ‐0.30] | |
| 7 Pain: short‐term follow‐up, subgroup analysis: motor cortex studies only, sensitivity analysis: correlation decreased Show forest plot | 26 | Std. Mean Difference (Random, 95% CI) | ‐0.40 [‐0.58, ‐0.22] | |
| 7.1 Single‐dose studies | 4 | Std. Mean Difference (Random, 95% CI) | ‐0.18 [‐0.38, 0.03] | |
| 7.2 Multiple‐dose studies | 22 | Std. Mean Difference (Random, 95% CI) | ‐0.49 [‐0.72, ‐0.26] | |
| 8 Pain: short‐term follow‐up, subgroup analysis, neuropathic and non neuropathic pain Show forest plot | 25 | Std. Mean Difference (Random, 95% CI) | ‐0.37 [‐0.56, ‐0.19] | |
| 8.1 Neuropathic | 9 | Std. Mean Difference (Random, 95% CI) | ‐0.26 [‐0.53, 0.01] | |
| 8.2 Non neuropathic | 16 | Std. Mean Difference (Random, 95% CI) | ‐0.42 [‐0.67, ‐0.17] | |
| 9 Pain: short term follow‐up responder analysis 30% pain reduction Show forest plot | 2 | Risk Ratio (M‐H, Random, 95% CI) | Subtotals only | |
| 10 Pain: short term follow‐up responder analysis 50% pain reduction Show forest plot | 2 | Risk Ratio (M‐H, Random, 95% CI) | Subtotals only | |
| 11 Pain: medium‐term follow‐up Show forest plot | 14 | Std. Mean Difference (Random, 95% CI) | ‐0.43 [‐0.72, ‐0.13] | |
| 12 Pain: medium term follow‐up responder analysis 30% pain reduction Show forest plot | 1 | Risk Ratio (M‐H, Random, 95% CI) | Subtotals only | |
| 13 Pain: medium term follow‐up responder analysis 50% pain reduction Show forest plot | 2 | Risk Ratio (M‐H, Random, 95% CI) | Subtotals only | |
| 14 Sensitivity analysis ‐ inclusion of high risk of bias studies. Pain: medium‐term follow‐up Show forest plot | 16 | Std. Mean Difference (Random, 95% CI) | ‐0.45 [‐0.72, ‐0.18] | |
| 15 Pain: long‐term follow‐up Show forest plot | 3 | Std. Mean Difference (Random, 95% CI) | ‐0.01 [‐0.43, 0.41] | |
| 16 Disability: short‐term follow‐up Show forest plot | 4 | 212 | Std. Mean Difference (IV, Random, 95% CI) | ‐0.01 [‐0.28, 0.26] |
| 17 Disability: medium‐term follow‐up Show forest plot | 1 | Std. Mean Difference (IV, Random, 95% CI) | Subtotals only | |
| 18 Quality of life: short‐term follow‐up Show forest plot | 4 | 82 | Std. Mean Difference (IV, Random, 95% CI) | 0.66 [0.21, 1.11] |
| 19 Quality of life: medium‐term follow‐up Show forest plot | 3 | 87 | Std. Mean Difference (IV, Random, 95% CI) | 0.34 [‐0.09, 0.76] |
| Outcome or subgroup title | No. of studies | No. of participants | Statistical method | Effect size |
| 1 Pain: short‐term follow‐up Show forest plot | 1 | Mean Difference (IV, Fixed, 95% CI) | Subtotals only | |
| 2 Sensitivity analysis ‐ inclusion of high risk of bias studies. Pain: short‐term follow‐up Show forest plot | 2 | 115 | Std. Mean Difference (IV, Random, 95% CI) | ‐0.59 [‐0.99, ‐0.18] |
| 3 Quality of Life: short term follow‐up Show forest plot | 1 | Mean Difference (IV, Fixed, 95% CI) | Subtotals only | |
| 4 Sensitivity analysis ‐ inclusion of high risk of bias studies. Quality of life: short term follow‐up Show forest plot | 2 | 115 | Std. Mean Difference (IV, Random, 95% CI) | ‐0.45 [‐0.91, 0.02] |
| Outcome or subgroup title | No. of studies | No. of participants | Statistical method | Effect size |
| 1 Pain Show forest plot | 1 | Std. Mean Difference (Fixed, 95% CI) | ‐0.19 [‐0.64, 0.26] | |