Statins for primary prevention of venous thromboembolism
Abstract
Background
Venous thromboembolism (VTE) is common in clinical practice. The efficacy of statins in the primary prevention of VTE remains unproven. This is an update of the review first published in 2011.
Objectives
To assess the efficacy of statins in the primary prevention of VTE.
Search methods
For this update the Cochrane Peripheral Vascular Diseases (PVD) Group Trials Search Co‐ordinator searched the Specialised Register (last searched February 2014) and CENTRAL (2014, Issue 1).
Selection criteria
Randomised controlled trials (RCTs) that assessed statins in the primary prevention of VTE were considered. The outcomes we evaluated were the rates of VTE, cardiovascular and cerebrovascular events, death and adverse events. Two authors (L Li, JH Tian) independently selected RCTs against the inclusion criteria. Disagreements were resolved by discussion with a third author (KH Yang).
Data collection and analysis
Data extraction was independently carried out by two authors (L Li, JH Tian). Disagreements were resolved by discussion with a third author (PZ Zhang). Two authors (L Li, JH Tian) independently assessed the risk of bias according to a standard quality checklist provided by the PVD Group.
Main results
For this update we included one RCT with 17,802 participants that assessed rosuvastatin compared with placebo for the prevention of VTE. The quality of the evidence was moderate because of imprecision, as the required sample size for the outcomes of this review was not achieved. Analysis showed that when compared with placebo rosuvastatin reduced the incidence of VTE (odds ratio (OR) 0.57, 95% confidence interval (CI) 0.37 to 0.86) and deep vein thrombosis (DVT) (OR 0.45, 95% CI 0.25 to 0.79), the risk of any (fatal and non‐fatal) myocardial infarction (MI) (OR 0.45, 95% CI 0.30 to 0.69), and any (fatal and non‐fatal) stroke (OR 0.51, 95% CI 0.34 to 0.78). There was no difference in the incidence of pulmonary embolism (PE) (OR 0.77, 95% CI 0.41 to 1.46), fatal MI (OR 1.50, 95% CI 0.53 to 4.22), fatal stroke (OR 0.30, 95% CI 0.08 to 1.09) or death after VTE (OR 0.50, 95% CI 0.20 to 1.24). The incidence of any serious adverse events was no different between the rosuvastatin and placebo groups (OR 1.07, 95% CI 0.95 to 1.20).
Authors' conclusions
Available evidence showed that rosuvastatin was associated with a reduced incidence of VTE, but the evidence was limited to a single RCT and any firm conclusions and suggestions could be not drawn. Randomised controlled trials of statins (including rosuvastatin) are needed to evaluate their efficacy in the prevention of VTE.
PICO
Plain language summary
Statins for preventing blood clot formation within veins
Background
Venous thrombosis or thromboembolism (VTE) is a condition in which a blood clot (thrombus) forms in a vein and causes a blockage. The blockage most commonly occurs in the 'deep veins' of the lower legs, thighs or pelvis and is called deep vein thrombosis (DVT). If part of or the entire clot breaks away and is carried through the blood (venous) system it is called an embolism. Should the clot reach the lungs, it is known as a pulmonary embolism (PE) and is life threatening. VTE affects about 3,705,000 people worldwide annually and is one of the most preventable causes of hospital deaths. Statins are well known cholesterol‐lowering drugs that are used in heart disease. They have other protective effects including anti‐clotting properties and may be effective in the prevention of VTE. The objective of this review was to assess the efficacy of statins in the primary prevention of VTE.
Key results
Our review included one published randomised controlled trial, involving 17,802 participants, which reported outcomes of VTE. This trial investigated rosuvastatin compared with placebo for the primary prevention of VTE. Analysis showed that, compared with placebo, rosuvastatin reduced the incidence of VTE and DVT, the risk of any (fatal and non‐fatal) myocardial infarction, and any (fatal and non‐fatal) stroke. There were no differences between rosuvastatin and placebo in the incidence of pulmonary embolism, fatal myocardial infarction, fatal stroke, and death after VTE. The incidence of any serious adverse events was not different between rosuvastatin and placebo. No firm conclusions or suggestions could be made from these findings. More randomised controlled trials of statins (including rosuvastatin) are needed to evaluate the efficacy of statins in the prevention of VTE.
Quality of the evidence
The quality of the evidence was moderate because of imprecision, as the required sample size for the outcomes of this review was not achieved.
Authors' conclusions
Summary of findings
| Statin versus placebo for primary prevention of venous thromboembolism | ||||||
| Patient or population: 17,802 patients with low to normal levels of low density lipoprotein (LDL) cholesterol (< 130 mg/dL) | ||||||
| Outcomes | Illustrative comparative risks* (95% CI) | Relative effect | No of participants | Quality of the evidence | Comments | |
| Assumed risk | Corresponding risk | |||||
| Control | Statin versus placebo | |||||
| All cases of VTE | Study population | OR 0.57 | 17802 | ⊕⊕⊕⊝ | ||
| 7 per 1000 | 4 per 1000 | |||||
| Moderate | ||||||
| 7 per 1000 | 4 per 1000 | |||||
| Pulmonary embolism | See comment | See comment | Not estimable | 17802 | ⊕⊕⊕⊝ | |
| Deep vein thrombosis | See comment | See comment | Not estimable | 17802 | ⊕⊕⊕⊝ | |
| Any MI | Study population | OR 0.45 | 17802 | ⊕⊕⊕⊝ | ||
| 8 per 1000 | 3 per 1000 | |||||
| Moderate | ||||||
| 8 per 1000 | 4 per 1000 | |||||
| Any stroke | Study population | OR 0.51 | 17802 | ⊕⊕⊕⊝ | ||
| 7 per 1000 | 4 per 1000 | |||||
| Moderate | ||||||
| 7 per 1000 | 4 per 1000 | |||||
| Death | Study population | OR 0.8 | 17802 | ⊕⊕⊕⊝ | ||
| 28 per 1000 | 22 per 1000 | |||||
| Moderate | ||||||
| 28 per 1000 | 23 per 1000 | |||||
| Any serious adverse event | Study population | OR 1.07 | 17802 | ⊕⊕⊕⊝ | ||
| 66 per 1000 | 70 per 1000 | |||||
| Moderate | ||||||
| 66 per 1000 | 70 per 1000 | |||||
| *The basis for the assumed risk (e.g. the median control group risk across studies) is provided in footnotes. The corresponding risk (and its 95% confidence interval) is based on the assumed risk in the comparison group and the relative effect of the intervention (and its 95% CI). | ||||||
| GRADE Working Group grades of evidence | ||||||
| 1 Total sample size is lower than the calculated optimal information size (OIS). Therefore the evidence was downgraded based on imprecision | ||||||
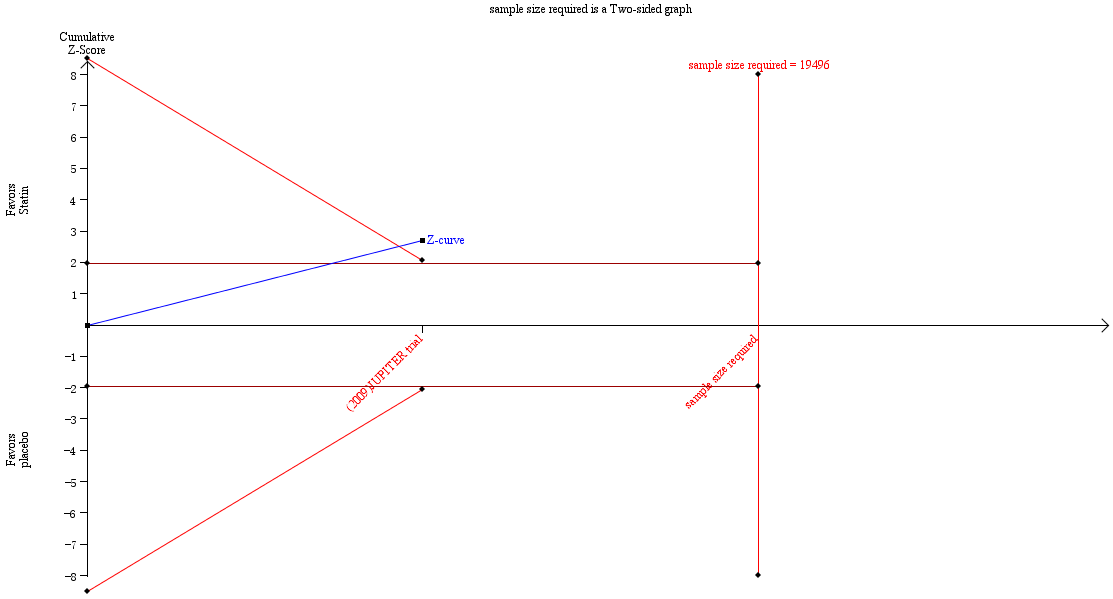
Trial sequential analysis results for the incidence of VTE.
Background
Description of the condition
Venous thromboembolism (VTE) is a clinical entity which has two different manifestations, deep venous thrombosis and pulmonary embolism. Venous thrombosis is a condition in which a blood clot (thrombus) forms in an intact vein as red blood cells, fibrin and, to a lesser extent, platelets and leucocytes (white blood cells) form a mass. Blood flow through the affected vein is limited by the clot, causing swelling and pain. Venous thrombosis most commonly occurs in the 'deep veins' in the lower legs, thighs, or pelvis, so it is usually called deep vein thrombosis (DVT). An embolism is created if a part or all of the blood clot breaks off from the site where it is created and travels through the venous system. If the clot lodges in the lungs a very serious condition arises, pulmonary embolism (PE).
The crude annual incidence per 1000 population is 0.83 for VTE, 0.52 for DVT, and 0.31 for PE. The annual incidence per 1000 population after age adjustment to the World Health Organization World Standard Population is 0.57 for VTE, 0.35 for DVT, and 0.21 for PE. If the crude annual incidence of VTE is externally valid, then VTE affects about 17,000 Australians and 3,705,000 people all over the world annually (calculated as 65,000 million all over) (Ho 2008; Raju 2009). Retrospective studies reported mortality rates following VTE of 5% to 23% (Goldhaber 2004), although in symptomatic patients with adequate anticoagulation mortality was 1% to 2% (Douketis 1998). It was estimated that more than 900,000 Americans develop DVT each year, and 500,000 of these develop PE with 30% of PEs being fatal (Heit 2005). About two‐thirds of all VTE events were related to hospitalisation. Heit et al reported that VTE is the third most common cause of hospital‐related deaths in the United States and the most common preventable cause of hospital deaths (Heit 2002).
Thrombosis prophylaxis can be achieved by physical or pharmacological means. The decision on which prophylaxis is used depends on patient risk factors, the availability of recommended medication, and the clinical judgment of the treating doctor (Chapman 2009). The most effective anticoagulants (recommended for prophylaxis in the highest risk patients) are the low molecular weight heparins and fondaparinux (Alpert 2001; Diuguid 2001). Mechanical prophylaxis (that is intermittent pneumatic compression stockings or graduated compression stockings) is recommended for patients with a higher than normal risk of bleeding or as an adjunct to more efficacious pharmacological prophylaxis (Chapman 2009; Diuguid 2001).
Description of the intervention
Statins are 3‐hydroxy‐3‐methylglutaryl (HMG)‐coenzyme A (CoA) reductase inhibitors and they are the most powerful cholesterol‐lowering drugs available. They have also been shown to exhibit several vascular protective effects, with antithrombotic properties (Undas 2005). As a result, the benefits of statins might accrue not only from their effects on lipid levels but also through their influence on thrombosis and inflammation (Albert 2001; Kaba 2004; Undas 2005).
The Heart and Estrogen/Progestin Replacement Study (HERS), a randomised trial of postmenopausal hormone therapy in American women with cardiovascular disease, first observed a lower risk of VTE in women using statins (Grady 2000). In this trial of 2763 women there were nearly 1000 women using statins and the relative risk (RR) of VTE was 0.5. In a study of administrative data, Ray reported that statins users in Ontario had a 22% lower risk of VTE than those prescribed thyroid replacement therapy (Ray 2001a). An analysis by Yang of the General Practice Research Database (GPRD) in the UK was not able to detect an association between statins use, or other lipid‐lowering drug use, and the risk of unprovoked VTE, but the study was limited by the analysis of a small number of cases (Yang 2002). Huerta also examined GPRD data using a longer time period and assessing over 6550 cases, and reported a 15% lower risk of VTE with the use of statins although this was not statistically significant (odds ratio (OR) 0.85) (Huerta 2007). In a study by Ramcharan 2009 of 4538 patients who had previously experienced a single episode of DVT or PE and 5914 control patients, 3.3% of participants using statins experienced a VTE as compared with 5.7% of controls, which yielded a 59% lower risk of VTE with statins use. This association was not seen with other lipid‐lowering medications, which were not associated with a lower, or higher, risk of VTE. Two prospective observational studies showed that substantial and significant reductions in the risk of VTE were associated with the use of statins, a 50% reduction in the risk among statin users in the HERS (Grady 2000) and a 22% reduction among statin users in Ontario, Canada as calculated on the basis of administrative claims data (Ray 2001a). Four case‐control studies also showed reductions in the risk of venous thrombosis, ranging from 26% to 58%, associated with the use of statins (Doggen 2004; Lacut 2004; Lacut 2008; Ramcharan 2009; Sørensen 2009) (Table 1).
| Study | Type | No. of participants | Drug | Result |
| RCT (secondary outcome) | 8901/8901 | Rosuvastatin 20 mg daily versus placebo | HR 0.57 (95% CI 0.37 to 0.86) | |
| Case‐control | 4538/5914 | Any statin | OR 0.55 (95% CI 0.46 to 0.67) | |
| Case‐control | 5824/58240 | Any statin | OR 0.74 (95% CI 0.63 to 0.85) | |
| Cohort study | 129,288/600,241 | Any statin | HR no statin versus statin 1.18 (95% CI 1.06 to 1.31) | |
| Case‐control | 377/377 | Any statin | OR 0.42 (95% CI 0.23 to 0.76) | |
| Case‐control | 677/677 | Any statin | OR 0.53 (95% CI 0.37 to 0.78) | |
| Non‐randomised comparison (part of HERS) | 1712/1051 | Any statin | HR 0.40 (95% CI 0.18 to 0.91) | |
| Retrospective cohort study | 22,993/61,100 | Any statin | IRR current/recent statin use 0.8 (95% CI 0.3 to 2.7) | |
| Retrospective cohort study | 77,993/47,869 | Any statin | HR 0.78 (95% CI 0.69 to 0.87) | |
| Case‐control | 6,550/10,000 | Any statin | OR 0.70 (95% CI 0.50 to 0.97) | |
| Case‐control | 465/1962 | Simvastatin, pravastatin | Simvastatin OR 0.51 (95% CI 0.29 to 0.91) Pravastatin OR 1.85 (95% CI 0.65 to 5.26) |
CI: confidence interval
HERS: Heart and Estrogen/Progestin Replacement Study (HERS)
HR: hazard ratio
IRR: incidence rate ratio
OR: odds ratio
However, some people think that statins cannot be recommended for use in either the prevention or the treatment of VTE, and that research studies should attempt to quantify the risk reduction for VTE with statin use (Ray 2001b). We intended to clarify the efficacy and safety of statins in this review.
How the intervention might work
Plausible biological links can be found between statin therapy and reduction of thrombotic risk, mainly targeting the immune system, blood coagulation, endothelium, lipid metabolism and inflammation (Lippi 2013). Statins can exhibit antithrombotic properties that are not associated with changes in lipid profile. Increasing evidence indicates that statins modulate the blood coagulation cascade at multiple levels, leading to reduced thrombogenicity (Undas 2005). Statins inhibit platelet aggregation and maintain a favourable balance between prothrombotic and fibrinolytic mechanisms (Ray 2003b). Differences between individual statin medications may be due to differences in metabolism (Corsini 1999). For example, simvastatin impairs the activation of prothrombin, factor V (FV) and FXIII, and enhances FVa inactivation by activated protein C (Undas 2001), which may lead to a reduced risk of venous thrombosis. A recent systematic review showed that statin therapy reduces interleukin 6 (IL‐6) induced expression of C‐reactive protein (CRP) and monocyte chemoattractant protein‐1 (MCP‐1), which has been linked to vein wall fibrosis, promoting post‐thrombotic syndrome (PTS) and recurrent DVT in patients (Rodriguez 2012). Meanwhile, this review suggests that the anti‐thrombotic effects are likely to be exhibited through the anti‐inflammatory properties of statins (Rodriguez 2012).
Why it is important to do this review
The optimal drug in the primary prevention of VTE is one that is efficacious, associated with minimal bleeding risk, and easy to administer. Statins fulfil the latter two criteria, but their efficacy and side effects remain unproven (Ray 2003b). In this review we wanted to assess their efficacy and safety by evaluating randomised controlled trials (RCTs) using statins for the primary prevention of VTE.
Objectives
To assess the efficacy of statins in the primary prevention of venous thromboembolism (VTE).
Methods
Criteria for considering studies for this review
Types of studies
Randomised controlled trials (RCTs) were considered, without language and publication status restrictions.
In this review, only primary prevention trials were included. We used the primary prevention definition provided in the US Preventive Services Task Force Guide to Clinical Preventive Services (USPSTF): to provide primary prevention measures to individuals to prevent the onset of a targeted condition. Primary prevention measures include activities that help avoid a given healthcare problem.
We excluded studies if they did not assess the primary outcome of this review, the rate of VTE (DVT and PE), as an outcome in the study. The primary outcome of the review could be assessed as either a primary, secondary or exploratory outcome of the study.
Types of participants
Participants were healthy people, patients with diseases other than VTE, or people with risk factors (see Appendix 1).
Types of interventions
We included all types of statin treatment as compared to all types of control interventions, including placebo.
Types of outcome measures
Primary outcomes
-
The rate of VTE (DVT and PE)
VTE is detected by imaging using venous ultrasonography or venography for confirmation of DVT, and angiography, computed tomography (CT) or a ventilation and perfusion scan (V/Q) for confirmation of PE; or any other recognised confirmatory tests for either DVT or PE. VTE was also divided into unprovoked and provoked venous thrombosis. Unprovoked venous thrombosis was defined as occurring in the absence of known malignancy (diagnosed either before or up to three months after the venous thrombosis), trauma, hospitalisation or surgery within the three months before the event. Provoked venous thrombosis included events that occurred in patients with cancer or during, or shortly after, trauma, hospitalisation or surgery.
Secondary outcomes
-
The rate of cardiovascular and cerebrovascular events (myocardial infarction (MI), stroke, arterial revascularisation, etc.)
-
The rate of death (all deaths, death after VTE)
-
Adverse events:
-
-
adverse events (myopathy, tendon manifestations, etc.);
-
serious adverse events (SAEs).
-
SAEs were any adverse events that resulted in any of the following outcomes: death, a life threatening adverse event, inpatient hospitalisation or prolongation of existing hospitalisation, a persistent or significant disability or incapacity, or a congenital anomaly or birth defect. Important medical events that may not result in death, be life threatening, or require hospitalisation may be considered as serious.
Search methods for identification of studies
There were no language or publication status restrictions.
Electronic searches
For this update the Cochrane Peripheral Vascular Diseases Group Trials Search Co‐ordinator (TSC) searched the Specialised Register (last searched February 2014) and the Cochrane Central Register of Controlled Trials (CENTRAL) (2014, Issue 1), part of The Cochrane Library (www.thecochranelibrary.com). See Appendix 2 for details of the search strategy used to search CENTRAL. The Specialised Register is maintained by the TSC and is constructed from weekly electronic searches of MEDLINE, EMBASE, CINAHL, AMED, and through handsearching relevant journals. The full list of the databases, journals and conference proceedings which have been searched, as well as the search strategies used are described in the Specialised Register section of the Cochrane Peripheral Vascular Diseases Group module in The Cochrane Library (www.thecochranelibrary.com).
Searching other resources
In addition, we searched the reference lists of retrieved articles and other related literature reviews.
Data collection and analysis
Selection of studies
We used the search strategies described to obtain titles and abstracts of studies that were potentially relevant to the review. Two authors (L Li, JH Tian) independently selected RCTs of statins in the prevention of VTE by screening titles and abstracts against the predetermined eligibility criteria to discard studies that were not applicable.
If we could not decide whether the articles satisfied the inclusion criteria from the abstracts, the full texts of the trials were obtained. If there were two or more publications relating to one trial, only the publication with the most complete data or the pooled data from all the publications was included. Disagreements were resolved by discussion with a third author (KH Yang).
Data extraction and management
Data extraction was independently carried out by the same two authors (L Li, JH Tian) and the results were checked for accuracy by a third author (PZ Zhang). Disagreements were resolved by discussion. A paper data extraction form provided by the Peripheral Vascular Diseases (PVD) Group was used to record the following characteristics:
-
title;
-
authors;
-
publication status (if published, which journal, year of publication, the volume, the issue and the pages; if not published, year in which study was conducted and other relevant details);
-
study design;
-
blinding;
-
method of randomisation;
-
method of concealment of allocation;
-
exclusions post‐randomisation;
-
losses to follow‐up;
-
intention‐to‐treat analysis;
-
country;
-
setting or location of trial;
-
type of participants;
-
risk factors of participants;
-
number of participants;
-
number of participants allocated to each type of intervention;
-
stated inclusion and exclusion criteria;
-
age of participants;
-
sex of participants;
-
doses and routes of administration;
-
duration of the follow‐up;
-
type of VTE;
-
primary and secondary outcomes;
-
references to relevant studies.
Assessment of risk of bias in included studies
To avoid bias, we assessed the methodological quality of each trial according to a standard quality checklist provided by the PVD Group. Two authors (L Li, JH Tian) independently assessed the risk of bias of each trial as described below, recorded the information in a table, and provided a narrative description in the text. If there was insufficient information about the study methods, we contacted the authors for further information. If the trial authors did not respond within four or more weeks, we assessed the risk of bias from the available information. Disagreements were resolved by consensus. The following items were assessed as 'low risk' (low risk of bias), 'unclear risk' (uncertain risk of bias), or 'high risk' (high risk of bias).
A. The selection bias was evaluated based on the randomisation procedure and allocation concealment
1) Randomisation method
Low risk (low risk of bias): the method allowed participants of studies to have the same chance of receiving each intervention and the investigators described a random component in the sequence generation process, such as referring to a random number table, using a computer random number generator, coin tossing, shuffling cards or envelopes, throwing dice, drawing of lots.
High risk (high risk of bias): the investigators described a non‐random component in the sequence generation process. Usually the description involved some systematic, non‐random approach, such as by odd or even date of birth, some rule based on date (or day) of admission, hospital or clinic record number. Other non‐random approaches are used much less frequently than the systematic approaches mentioned above and tend to be obvious. They usually involve judgment or some method of non‐random categorisation of participants, such as allocation by the judgment of the clinician, preference of the participant, the results of a laboratory test or a series of tests, or availability of the intervention. If an open random allocation schedule (for example a list of random numbers) was used or assignment envelopes were used without appropriate safeguards (for example if envelopes were unsealed or non‐opaque, or not sequentially numbered), or any other explicitly unconcealed procedure, we classified the randomisation method as at 'high risk of bias'.
Unclear risk: insufficient information was available about the sequence generation process to permit judgment of 'low risk' or 'high risk', for example insufficient information about the randomisation procedure, such as randomisation stated but no information given on the method used.
2) Allocation concealment
Low risk (low risk of bias): if the randomisation method that was described would not allow investigators or participants to know or influence the intervention group before eligible participants entered into the study (for example central allocation, including telephone, web‐based and pharmacy‐controlled randomisation; sequentially‐numbered drug containers of identical appearance; sequentially numbered, opaque, sealed envelopes).
High risk (high risk of bias): if an open random allocation schedule (for example a list of random numbers) was used, assignment envelopes were used without appropriate safeguards (for example if envelopes were unsealed or non‐opaque, or not sequentially numbered), by alternation or rotation, date of birth or case record number, or any other explicitly unconcealed procedure.
Unclear risk: insufficient information about allocation concealment, such as allocation concealment stated but no information available on the method used, or the authors did not report on allocation.
The randomisation procedure and allocation schedule are usually impossible to achieve low risk of bias in for quasi‐randomised controlled trials (QRCTs), so we evaluated these as 'high risk of bias'.
B. We evaluated performance bias based on blinding of patients and people administering the treatment
Low risk (low risk of bias): the study described methods of blinding patients and people administering the treatment that were appropriate, so that participants and people administering the treatment did not know the exact treatment for each group until the blinding was broken; either participants or some key study personnel were not blinded but outcome assessment was blinded and the non‐blinding of others was unlikely to introduce bias.
High risk (high risk of bias): no blinding was used for the participants and people administering the treatment.
Unclear risk: insufficient information to permit judgment of 'low risk' or 'high risk', or no useful information obtained from the authors.
C. Attrition bias was assessed by looking at the follow‐up to see if at least 80% of participants in all groups were included in the final analysis and an intention‐to‐treat analysis was used
Low risk (low risk of bias): < 20% of participants withdrawn or lost to follow‐up because of side effects of treatment or other reasons, and also the reasons for why participants were lost and withdrawn were stated. Intention‐to‐treat analysis was specifically reported.
High risk (high risk of bias): > 20% of participants withdrawn or lost to follow‐up because of side effects of treatment or other reasons, and also the reasons why lost and withdrawn were not stated. Intention‐to‐treat analysis was not used if there were participants withdrawn or lost to follow‐up.
Unclear risk: the losses to follow‐up were not reported or could not be judged from the article.
D. Detection bias was assessed by evaluating the method of outcome assessment or blinding of outcome assessor
Low risk (low risk of bias): same methods of ascertainment for both groups and blinding of outcome assessor for assessing the outcomes.
High risk (high risk of bias): different methods of ascertainment for both groups, or non‐blinding of outcome assessor for assessing the outcomes.
Unclear risk: methods of ascertainment for both groups and blinding of outcome assessor for assessing the outcomes were not reported.
E. Other biases were evaluated based on incomplete outcome data and selective outcome reporting
1) Incomplete outcome data
Low risk (low risk of bias): no missing outcome data; missing outcome data balanced between groups with similar reasons and numbers lost for the missing data across groups; missing outcomes not enough to have a clinically relevant impact on the final results; missing data have been imputed using appropriate methods.
High risk (high risk of bias): reason for missing outcome data related to true outcome, with either imbalance in numbers or reasons across the groups; missing outcomes enough to induce clinically relevant bias in the results; inappropriate methods were used to deal with the missing data.
Unclear risk: cannot judge from the information obtained from the article.
2) Selective outcome reporting
Low risk (low risk of bias): all the study's pre‐specified (primary and secondary) outcomes were reported in the article (if the study protocol was available) or all expected outcomes were mentioned in the published reports (the study protocol was not available).
High risk (high risk of bias): one or more of the study's pre‐specified primary or expected outcomes failed to be included or was not reported.
Unclear risk: there was insufficient information to judge 'low risk' or 'high risk'.
Measures of treatment effect
According to the Cochrane Handbook for Systematic Reviews of Interventions (Higgins 2011), we defined measures of treatment effects as follows. For dichotomous outcomes, we expressed results as odds ratio (OR) with 95% confidence interval (CI). If there were continuous scales of measurement to assess the effects of treatment, we used the mean difference (MD), or the standardised mean difference (SMD) if different scales were used. We analysed heterogeneity using the I2 statistic based on N ‐ 1 degrees of freedom with an alpha of 0.05 for statistical significance (Higgins 2011).
Unit of analysis issues
Individual participants were the unit of analysis because we intended to include individually randomised controlled trials with a parallel design.
Dealing with missing data
We attempted to contact all the authors (if e‐mails, telephone numbers, or fax details were available) of the original studies for the missing data. If the authors of the study did not respond within four or more weeks, we extracted all the available data from the publication. If data were missing because of dropping out of participants or losses to follow‐up, we planned to conduct a primary analysis based on the provided data and a sensitivity analysis with missing data imputed based on the worst‐case and best‐case scenarios.
Assessment of heterogeneity
We examined heterogeneity among trials using the I2 statistic. An I2 statistic estimate greater than 50% was considered as substantial or considerable heterogeneity. Its causes were investigated by performing subgroup analyses, or sensitivity analyses by excluding studies thought to cause the heterogeneity.
Assessment of reporting biases
If possible, we planned to assess reporting biases by using funnel plots.
Data synthesis
We used the software (RevMan 5) provided by The Cochrane Collaboration for statistical analysis, based on an intention‐to‐treat analysis. We considered meta‐analysis to determine the appropriate measure of effect if the search yielded a group of trials sufficiently homogeneous in terms of measured outcomes. According to the level of heterogeneity between trials, we used either a fixed‐effect or random‐effects model where appropriate. We pooled the outcomes and examined the differences between the two models. We planned to report the results qualitatively if we found significant heterogeneity and we could not find the reasons for the heterogeneity.
Trial sequential analysis
Meta‐analyses may result in type 1 errors due to sparse data and repeated significance testing when meta‐analyses are updated with new trials (Brok 2008). Trial sequential monitoring boundaries were determined using trial sequential analysis (TSA) software (Thorlund 2011). If the cumulative Z‐curve crosses a trial sequential monitoring boundary (TSMB), a sufficient level of evidence is reached and no further trials may be needed. However, there is insufficient evidence to reach a conclusion if the cumulative Z‐curve does not cross the TSMB or does not surpass the futility boundaries before the required information size is reached (Bjelakovic 2014). We also calculated a required information size, which is the least number of participants in a meta analysis to detect or reject a certain intervention effect, and adjusted the required information size to account for statistical between‐trial heterogeneity with a diversity adjustment factor (Wetterslev 2009). In our meta‐analysis, the diversity‐adjusted required information size was based on the event proportion in the control group; the assumption of a plausible RR reduction of 20%; a risk of type I error of 5%; a risk of type II error of 20%; and the assumed diversity of the meta‐analysis (Wetterslev 2009).
Subgroup analysis and investigation of heterogeneity
We intended to undertake relevant subgroup analyses of the review data. We conducted subgroup analysis for different ages, gender and population (healthy people versus people considered to be at risk).
Sensitivity analysis
We used sensitivity analysis to explore the impact of missing data or different studies on the stability of the treatment effect.
Summary of findings table
We employed the GRADE approach to interpret findings (Guyatt 2008), and the GRADE profiler (GRADEPRO) allowed us to import data from Review Manager 5.3 to create a summary of findings table. This table provides outcome‐specific information concerning the overall quality of evidence from studies included in the comparison, the magnitude of effect of the interventions examined, and the sum of available data on the outcomes that we considered, given our trial sequential analyses (Bjelakovic 2014). The following outcomes were included in the summary of findings table: all VTE, PE, DVT, MI, stroke, death and serious adverse events.
Results
Description of studies
Results of the search
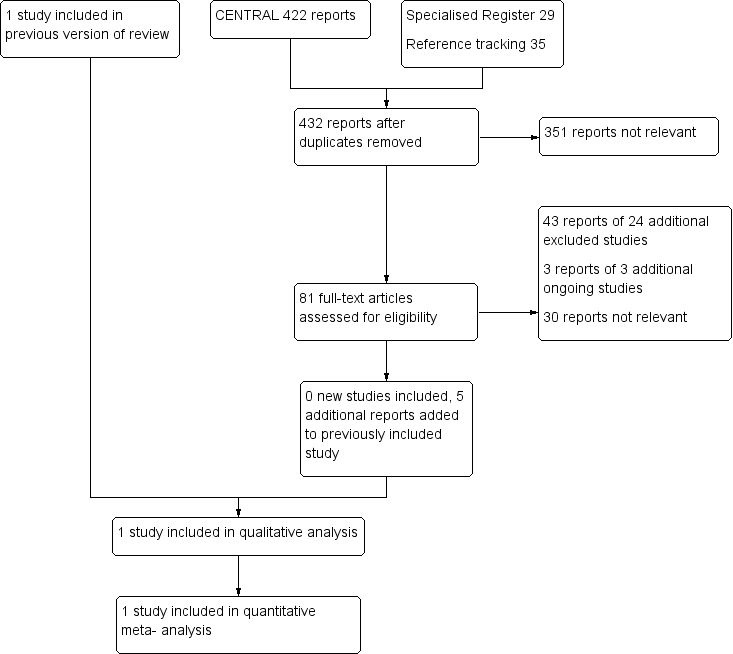
See Figure 2 for details of the search results.

Study flow diagram.
Included studies
See Characteristics of included studies.
No additional studies were included in this update. There is one included study (JUPITER trial), which investigated rosuvastatin. This study used rosuvastatin 20 mg daily for healthy people aged 50 years and older without a history of cardiovascular or cerebrovascular events. Characteristics of the included study are presented in the Characteristics of included studies table.
Excluded studies
See Characteristics of excluded studies.
For this update there were 24 additional studies excluded (ACCEPT‐D; AFCAPS/TexCAPS; AIM‐HIGH; ASTRONOMER; Caramelli 2002; CARDS; ChiCTR‐TNRC‐08000263; DECREASE III; ELIMIT; Ge 2011; Haak 2001; HPS2‐THRIVE; Jeong 2013; LEADe; Liu 2011; MEGA; METEOR; PROCEDURE; PROSPER; RATIONAL; Rosen 2013; Shai 2014; van der Loo 2011; West 2010). This made a total of 36 excluded studies (ACCEPT‐D; AFCAPS/TexCAPS; AIM‐HIGH; ASTRONOMER; Caramelli 2002; CARDS; ChiCTR‐TNRC‐08000263; DECREASE III; Doggen 2004; ELIMIT; Ge 2011; Haak 2001; HERS; HPS2‐THRIVE; Huerta 2007; Jeong 2013; Lacut 2004; Lacut 2008; LEADe; Liu 2011; MEGA; METEOR; NCT00437892; PROCEDURE; PROSPER; Ramcharan 2009; RATIONAL; Ray 2001a; Rosen 2013; Shai 2014; Smeeth 2009; Stangier 2009; Sørensen 2009; van der Loo 2011; West 2010; Yang 2002). Four reports which had previously been excluded were assessed as not relevant in this update.
Eight of the excluded studies were case‐control studies (Doggen 2004; Huerta 2007; Lacut 2004; Lacut 2008; PROSPER; Ramcharan 2009; Shai 2014; Sørensen 2009); five were cohort studies (ChiCTR‐TNRC‐08000263; HERS; Ray 2001a; Smeeth 2009; Yang 2002); 17 were not VTE primary prevention studies (ASTRONOMER; Caramelli 2002;CARDS; DECREASE III; ELIMIT; Ge 2011; Haak 2001; Jeong 2013; Liu 2011; MEGA; METEOR; PROCEDURE; RATIONAL; Rosen 2013; Stangier 2009; van der Loo 2011; NCT00437892); and six studies focused on both statins and other interventions (ACCEPT‐D; AFCAPS/TexCAPS; AIM‐HIGH; HPS2‐THRIVE; LEADe; West 2010).
For this update there were three additional ongoing studies (NCT00259662; NCT01063426; NCT01524653), making a total of four ongoing studies (NCT00259662; NCT01021488; NCT01063426; NCT01524653).
Risk of bias in included studies
The risk of bias assessment for the included study is presented in Characteristics of included studies and Figure 3.

Risk of bias summary: review authors' judgements about each risk of bias item for each included study.
Allocation
The method of randomisation was on the basis of a computer generated list. Randomisation was performed with the use of an interactive voice‐response system and was stratified according to centre (JUPITER trial).
Blinding
A closeout visit occurred after study termination, at which time participants were unblinded. All reported primary endpoints were adjudicated by an independent endpoint committee blinded to the randomised treatment assignment. Adverse events were monitored and reported in a blinded manner until the date of the closeout visit and discontinuation of therapy (JUPITER trial).
Incomplete outcome data
We compared the study protocol and study publications and found no missed reporting of outcomes. Therefore, there were no incomplete outcome data in this included study.
Selective reporting
We compared the study protocol and the study and we found that all pre‐specified outcomes were reported in the relevant publications. Therefore, there was no selective reporting in this included study.
Other potential sources of bias
The trial was financially supported by AstraZeneca. The authors of all publications reported that the sponsor collected the trial data and monitored the study sites but played no role in the conduct of the analyses or drafting of the manuscript (JUPITER trial). Therefore, funding should not have introduced potential biases in this trial.
Effects of interventions
As outlined in the protocol, we have presented the results for dichotomous outcomes using ORs with 95% CIs and for continuous outcomes using the mean difference (MD) with 95% CI, or the standardised mean difference (SMD) if different scales were used.
The rates of VTE
Symptomatic PE or DVT occurred in 94 participants during a median follow‐up time of 1.9 years. The rates of VTE were 0.18 and 0.32 events per 100 person‐years of follow‐up in the rosuvastatin and placebo groups, respectively (hazard ratio (HR) 0.57, 95% CI 0.37 to 0.86; P = 0.007).
Our analysis showed that, compared with placebo, rosuvastatin could reduce the incidence of all cases of VTE (rosuvastatin 34/8901, placebo 60/8901; OR 0.57, 95% CI 0.37 to 0.86) (Analysis 1.1, Figure 4), provoked VTE (rosuvastatin 15/8901, placebo 29/8901; OR 0.52, 95% CI 0.28 to 0.96) (Analysis 1.2), and DVT only (rosuvastatin 17/8901, placebo 38/8901; OR 0.45, 95% CI 0.25 to 0.79) (Analysis 1.3). There was no difference between rosuvastatin and placebo in the incidence of unprovoked VTE (rosuvastatin 19/8901, placebo 31/8901; OR 0.61, 95% CI 0.35 to 1.08) (Analysis 1.4) and PE (rosuvastatin 17/8901, placebo 22/8901; OR 0.77, 95% CI 0.41 to 1.46) (Analysis 1.5).

Forest plot of comparison: 1 Rosuvastatin versus placebo, outcome: 1.1 All cases of VTE.
We found that, compared with placebo, rosuvastatin could reduce the incidence of all VTE in men (OR 0.50, 95% CI 0.30 to 0.84) (Analysis 1.6) and patients aged 50 to 69 years (OR 0.55, 95% CI 0.31 to 0.96) (Analysis 1.7) but there was no difference between rosuvastatin and placebo in the incidence of all VTE in women (OR 0.74, 95% CI 0.35 to 1.56) (Analysis 1.6) and patients aged 70 to 97 years (OR 0.59, 95% CI 0.31 to 1.11) (Analysis 1.7).
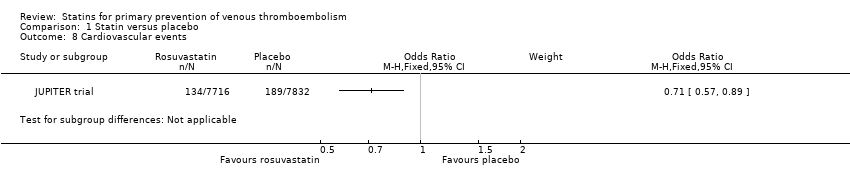
The rates of cardiovascular and cerebrovascular events
From our analysis, we found that, compared with placebo, rosuvastatin could reduce the risk of cardiovascular events in a healthy population (OR 0.71, 95% CI 0.57 to 0.89) (Analysis 1.8), any MI (OR 0.45, 95% CI 0.30 to 0.69) (Analysis 1.9), any stroke (OR 0.51, 95% CI 0.34 to 0.78) (Analysis 1.11) and arterial revascularisation (OR 0.54, 95% CI 0.40 to 0.72) (Analysis 1.13). There was no difference between rosuvastatin and placebo in fatal MI (OR 1.50, 95% CI 0.53 to 4.22) (Analysis 1.10) and fatal stroke (OR 0.30, 95% CI 0.08 to 1.09) (Analysis 1.12).
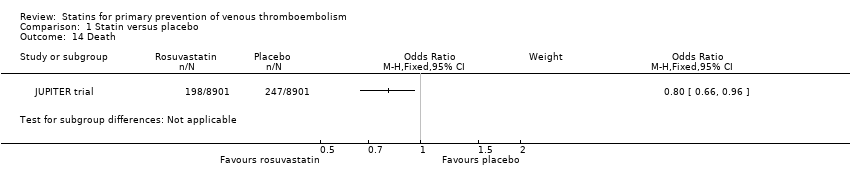
The rates of death
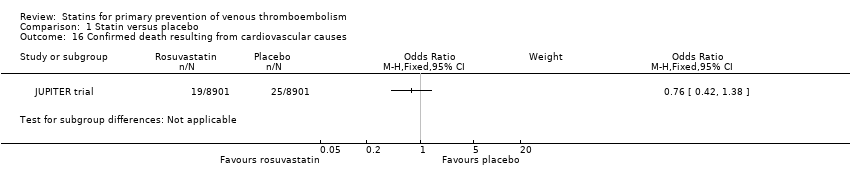
Rosuvastatin could reduce the incidence of any death (OR 0.80, 95% CI 0.66 to 0.96) (Analysis 1.14, Figure 5) but there was no difference between rosuvastatin and placebo in the incidence of death after VTE (OR 0.50, 95% CI 0.20 to 1.24) (Analysis 1.15) or death resulting from cardiovascular causes (OR 0.76, 95% CI 0.42 to 1.38) (Analysis 1.16).

Forest plot of comparison: 1 Statin versus placebo, outcome: 1.14 Death.
Adverse events
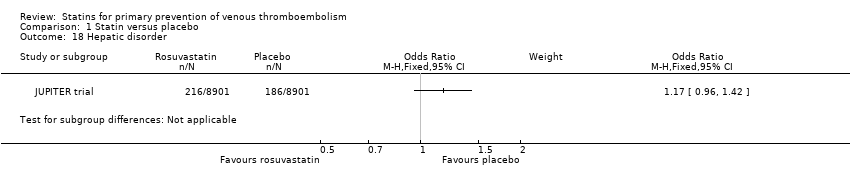
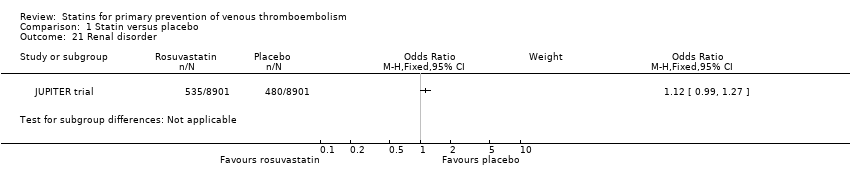
There was no difference between rosuvastatin and placebo in the incidence of any serious adverse event (OR 1.07, 95% CI 0.95 to 1.20) (Analysis 1.17, Figure 6). Similar results were reported in hepatic disorder (OR 1.17, 95% CI 0.96 to 1.42) (Analysis 1.18); myopathy (OR 1.11, 95% CI 0.45 to 2.74) (Analysis 1.19); rhabdomyolysis (OR 3.00, 95% CI 0.12 to 73.66) (Analysis 1.20); renal disorder (OR 1.12, 95% CI 0.99 to 1.27) (Analysis 1.21); bleeding (OR 0.94, 95% CI 0.79 to 1.11) (Analysis 1.22); muscular weakness, stiffness or pain (OR 1.04, 95% CI 0.96 to 1.13) (Analysis 1.23); or gastrointestinal disorder (OR 1.03, 95% CI 0.96 to 1.11) (Analysis 1.24).

Forest plot of comparison: 1 Rosuvastatin versus placebo, outcome: 1.17 Any serious adverse event.
Trial sequential analysis (TSA)
Figure 1 showed the trial sequential analysis (TSA) results for the main outcome: the incidence of VTE. The cumulative Z‐curve crossed the trial sequential monitoring boundaries and the required information size was not reached. This suggests that evidence was sufficient, although the sample size was not large enough. TSA results for the remaining outcomes in the summary of findings Table for the main comparison are described in Appendix 3.
Summary of findings
A summary of the results is presented in summary of findings Table for the main comparison.
Discussion
Summary of main results
Even though there are other statins that can be used for preventing VTE (Doggen 2004; HERS; Huerta 2007; Lacut 2004; Lacut 2008; Ramcharan 2009;Ray 2001a; Smeeth 2009; Sørensen 2009; Yang 2002), due to of a lack of RCTs evaluating the effects of statins in the primary prevention of VTE we only included one RCT of rosuvastatin (JUPITER trial) in this systematic review.
Our analysis showed that, compared with placebo, rosuvastatin could reduce the incidence of all cases of VTE and provoked VTE and DVT, but there was no difference between rosuvastatin and placebo in the incidence of unprovoked VTE or PE. We found that rosuvastatin could reduce the incidence of all VTE in men and patients aged 50 to 69 years but there was no difference between rosuvastatin and placebo in the incidence of all VTE in women or patients aged 70 to 97 years. Rosuvastatin could reduce the risk of any MI, any stroke, arterial revascularisation, and cardiovascular events, but there was no difference between rosuvastatin and placebo in the risk of fatal MI and fatal stroke. The incidence of any death was reduced with rosuvastatin but there was no difference between rosuvastatin and placebo in the incidence of death after VTE and confirmed deaths resulting from cardiovascular events. There was no difference between rosuvastatin and placebo in the incidence of any serious adverse events. Similar results were reported for adverse effects including bleeding, muscular weakness, stiffness or pain, myopathy, rhabdomyolysis, gastrointestinal disorders, renal disorders and hepatic disorders.
Overall completeness and applicability of evidence
Only one RCT that included 17,802 healthy participants assessed the efficacy of statins for the prevention of VTE. After subgroup analysis, it appears that some participants with risk factors for VTE could benefit from rosuvastatin treatment, but the results of this study might not apply to patients with risk factors which were not investigated by this trial. In addition, this trial was stopped early on the advice of the independent data and safety monitoring board, after a median follow‐up of less than two years, based on the size and precision of the observed treatment benefit as well as effects on the rates of death in patients treated with rosuvastatin compared with placebo. As a result, the effects of longer‐term therapy cannot be ascertained. Rosuvastatin was not associated with adverse events such as bleeding, muscular weakness, stiffness or pain, or gastrointestinal disorders. Such adverse events are of importance to patients and these adverse events might force patients to stop taking rosuvastatin. Therefore, even though rosuvastatin showed exciting beneficial effects for preventing VTE in some patient groups, there are limitations to applying the results to other patient groups.
Even though all the data from this review came from just one study, the participants were from 26 countries worldwide. However there were very few participants in some countries, for example Uruguay, Switzerland, Romania and Chile. Most of the participants were from Canada, South Africa, United Kingdom and the United States. As a result, the results represented only a part of the world.
A recent systematic review (Rodriguez 2012) showed that statin therapy reduces IL‐6 induced expression of CRP and MCP‐1, which has been linked to vein wall fibrosis, promoting post‐thrombotic syndrome (PTS) and recurrent DVT in patients. This could explain why statins may reduce the incidence of VTE, but the available evidence about statins in the primary prevention of VTE is limited. Due to insufficient evidence, we could not conclude that statin use can reduce the incidence of VTE. However, based on the JUPITER trial, statin use by the general healthy population may reduce the risk of VTE.
Quality of the evidence
The one included study is a randomised, double‐blind, placebo‐controlled trial which used a computer to generate the randomisation sequence; the random allocation sequence was implemented with the use of an interactive voice‐response system. All the primary endpoints that were evaluated were adjudicated by an independent endpoint committee blinded to the randomised treatment assignment. We compared the study protocol and study publications and found no missing outcomes or selective reporting. Even though the trial was financially supported by AstraZeneca, the authors of all publications reported that the sponsor collected the trial data and monitored the study sites but played no role in the conduct of the analyses or drafting of the manuscripts. As a result, funding should not have introduced biases in this trial. In addition, there was no indirectness of evidence (indirect population, intervention, control, outcomes) (Higgins 2011), unexplained heterogeneity or inconsistency of results (including problems with subgroup analyses) (Higgins 2011), or high probability of publication bias in this study. The very few limitations in the design and implementation of the study therefore suggest a low likelihood of bias. However, for all outcomes in the summary of findings Table for the main comparison (Appendix 3) the required sample size was not achieved, so the quality of the evidence for each outcome was downgraded for imprecision (Guyatt 2011). As a result, all outcomes in the summary of findings Table for the main comparison had moderate levels of quality of evidence.
Potential biases in the review process
Extensive electronic searches were conducted to search for relevant articles. As the databases we searched mostly included papers in the English language, it is possible that papers describing trials of statins for preventing VTE in other languages may not have been located. This review included published data only, and the unpublished data of the ongoing studies was not available. As our meta‐analysis was based on published data, there may be selective reporting biases. This review is not a comprehensive review of the effects of statins on cardiovascular outcomes as we assessed these outcomes based on studies that assessed statins in the primary prevention of VTE. So there might be selection bias for the cardiovascular outcomes.
Agreements and disagreements with other studies or reviews
Our results were consistent with other meta‐analyses, which showed that statin use could reduce the incidence of all cases of VTE, provoked VTE, and DVT only; but that it did not reduce the incidence of unprovoked VTE and PE (Agarwal 2010; Pai 2011; Ray 2003b; Squizzato 2010). These results are consistent with case‐control studies and cohort studies showing reduced risks of VTE (HERS; Huerta 2007; Lacut 2004; Lacut 2008; Ramcharan 2009; Ray 2001a; Smeeth 2009; Sørensen 2009). In a study by Doggen 2004, simvastatin was associated with a reduced risk of PE (OR 0.51, 95% CI 0.29 to 0.91) but pravastatin was not (OR 1.85, 95% CI 0.65 to 5.26). In a retrospective cohort study (Yang 2002), current statin use was not associated with a reduced risk of idiopathic VTE (RR 0.8, 95% CI 0.3 to 2.7). However, another meta‐analysis of published and unpublished evidence from RCTs showed that allocation to statin therapy did not significantly reduce the risk of VTE events, with no evidence of heterogeneity between effects on DVT and effects on PE (Rahimi 2012). It is possible that including unpublished data on statin use in the primary prevention of VTE might change the effect size (Rahimi 2012). Our meta‐analysis only included one RCT that compared a statin with placebo in the primary prevention of VTE, and the study showed that statin use could reduce the incidence of VTE. These conflicting results mean that we still need further well designed and reported VTE primary prevention studies to test the prevention effects of statins.

Trial sequential analysis results for the incidence of VTE.
Study flow diagram.

Risk of bias summary: review authors' judgements about each risk of bias item for each included study.

Forest plot of comparison: 1 Rosuvastatin versus placebo, outcome: 1.1 All cases of VTE.

Forest plot of comparison: 1 Statin versus placebo, outcome: 1.14 Death.

Forest plot of comparison: 1 Rosuvastatin versus placebo, outcome: 1.17 Any serious adverse event.

Comparison 1 Statin versus placebo, Outcome 1 All cases of VTE.

Comparison 1 Statin versus placebo, Outcome 2 Provoked VTE.

Comparison 1 Statin versus placebo, Outcome 3 Deep vein thrombosis.

Comparison 1 Statin versus placebo, Outcome 4 Unprovoked VTE.

Comparison 1 Statin versus placebo, Outcome 5 Pulmonary embolism.
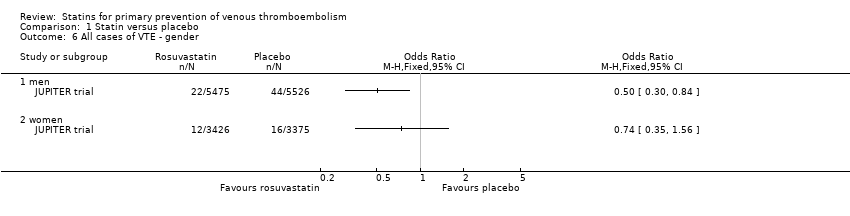
Comparison 1 Statin versus placebo, Outcome 6 All cases of VTE ‐ gender.

Comparison 1 Statin versus placebo, Outcome 7 All cases of VTE ‐ age.
Comparison 1 Statin versus placebo, Outcome 8 Cardiovascular events.

Comparison 1 Statin versus placebo, Outcome 9 Any MI.

Comparison 1 Statin versus placebo, Outcome 10 Fatal MI.

Comparison 1 Statin versus placebo, Outcome 11 Any stroke.

Comparison 1 Statin versus placebo, Outcome 12 Fatal stroke.

Comparison 1 Statin versus placebo, Outcome 13 Arterial revascularisation.
Comparison 1 Statin versus placebo, Outcome 14 Death.

Comparison 1 Statin versus placebo, Outcome 15 Death after VTE.
Comparison 1 Statin versus placebo, Outcome 16 Confirmed death resulting from cardiovascular causes.

Comparison 1 Statin versus placebo, Outcome 17 Any serious adverse event.
Comparison 1 Statin versus placebo, Outcome 18 Hepatic disorder.

Comparison 1 Statin versus placebo, Outcome 19 Myopathy.

Comparison 1 Statin versus placebo, Outcome 20 Rhabdomyolysis.
Comparison 1 Statin versus placebo, Outcome 21 Renal disorder.
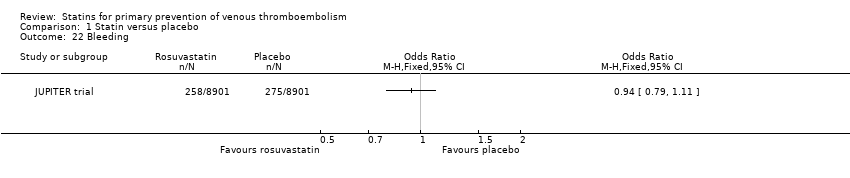
Comparison 1 Statin versus placebo, Outcome 22 Bleeding.

Comparison 1 Statin versus placebo, Outcome 23 Muscular weakness, stiffness, or pain.
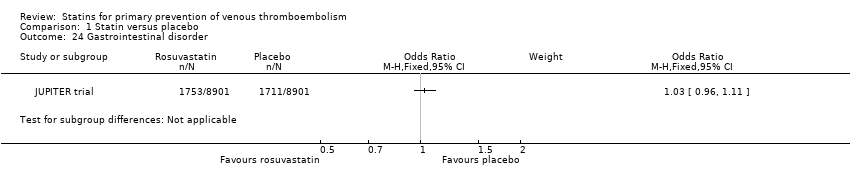
Comparison 1 Statin versus placebo, Outcome 24 Gastrointestinal disorder.
| Statin versus placebo for primary prevention of venous thromboembolism | ||||||
| Patient or population: 17,802 patients with low to normal levels of low density lipoprotein (LDL) cholesterol (< 130 mg/dL) | ||||||
| Outcomes | Illustrative comparative risks* (95% CI) | Relative effect | No of participants | Quality of the evidence | Comments | |
| Assumed risk | Corresponding risk | |||||
| Control | Statin versus placebo | |||||
| All cases of VTE | Study population | OR 0.57 | 17802 | ⊕⊕⊕⊝ | ||
| 7 per 1000 | 4 per 1000 | |||||
| Moderate | ||||||
| 7 per 1000 | 4 per 1000 | |||||
| Pulmonary embolism | See comment | See comment | Not estimable | 17802 | ⊕⊕⊕⊝ | |
| Deep vein thrombosis | See comment | See comment | Not estimable | 17802 | ⊕⊕⊕⊝ | |
| Any MI | Study population | OR 0.45 | 17802 | ⊕⊕⊕⊝ | ||
| 8 per 1000 | 3 per 1000 | |||||
| Moderate | ||||||
| 8 per 1000 | 4 per 1000 | |||||
| Any stroke | Study population | OR 0.51 | 17802 | ⊕⊕⊕⊝ | ||
| 7 per 1000 | 4 per 1000 | |||||
| Moderate | ||||||
| 7 per 1000 | 4 per 1000 | |||||
| Death | Study population | OR 0.8 | 17802 | ⊕⊕⊕⊝ | ||
| 28 per 1000 | 22 per 1000 | |||||
| Moderate | ||||||
| 28 per 1000 | 23 per 1000 | |||||
| Any serious adverse event | Study population | OR 1.07 | 17802 | ⊕⊕⊕⊝ | ||
| 66 per 1000 | 70 per 1000 | |||||
| Moderate | ||||||
| 66 per 1000 | 70 per 1000 | |||||
| *The basis for the assumed risk (e.g. the median control group risk across studies) is provided in footnotes. The corresponding risk (and its 95% confidence interval) is based on the assumed risk in the comparison group and the relative effect of the intervention (and its 95% CI). | ||||||
| GRADE Working Group grades of evidence | ||||||
| 1 Total sample size is lower than the calculated optimal information size (OIS). Therefore the evidence was downgraded based on imprecision | ||||||
| Study | Type | No. of participants | Drug | Result |
| RCT (secondary outcome) | 8901/8901 | Rosuvastatin 20 mg daily versus placebo | HR 0.57 (95% CI 0.37 to 0.86) | |
| Case‐control | 4538/5914 | Any statin | OR 0.55 (95% CI 0.46 to 0.67) | |
| Case‐control | 5824/58240 | Any statin | OR 0.74 (95% CI 0.63 to 0.85) | |
| Cohort study | 129,288/600,241 | Any statin | HR no statin versus statin 1.18 (95% CI 1.06 to 1.31) | |
| Case‐control | 377/377 | Any statin | OR 0.42 (95% CI 0.23 to 0.76) | |
| Case‐control | 677/677 | Any statin | OR 0.53 (95% CI 0.37 to 0.78) | |
| Non‐randomised comparison (part of HERS) | 1712/1051 | Any statin | HR 0.40 (95% CI 0.18 to 0.91) | |
| Retrospective cohort study | 22,993/61,100 | Any statin | IRR current/recent statin use 0.8 (95% CI 0.3 to 2.7) | |
| Retrospective cohort study | 77,993/47,869 | Any statin | HR 0.78 (95% CI 0.69 to 0.87) | |
| Case‐control | 6,550/10,000 | Any statin | OR 0.70 (95% CI 0.50 to 0.97) | |
| Case‐control | 465/1962 | Simvastatin, pravastatin | Simvastatin OR 0.51 (95% CI 0.29 to 0.91) Pravastatin OR 1.85 (95% CI 0.65 to 5.26) | |
| CI: confidence interval | ||||
| Outcome or subgroup title | No. of studies | No. of participants | Statistical method | Effect size |
| 1 All cases of VTE Show forest plot | 1 | Odds Ratio (M‐H, Fixed, 95% CI) | Subtotals only | |
| 2 Provoked VTE Show forest plot | 1 | Odds Ratio (M‐H, Fixed, 95% CI) | Totals not selected | |
| 3 Deep vein thrombosis Show forest plot | 1 | Odds Ratio (M‐H, Fixed, 95% CI) | Totals not selected | |
| 4 Unprovoked VTE Show forest plot | 1 | Odds Ratio (M‐H, Fixed, 95% CI) | Totals not selected | |
| 5 Pulmonary embolism Show forest plot | 1 | Odds Ratio (M‐H, Fixed, 95% CI) | Totals not selected | |
| 6 All cases of VTE ‐ gender Show forest plot | 1 | Odds Ratio (M‐H, Fixed, 95% CI) | Totals not selected | |
| 6.1 men | 1 | Odds Ratio (M‐H, Fixed, 95% CI) | 0.0 [0.0, 0.0] | |
| 6.2 women | 1 | Odds Ratio (M‐H, Fixed, 95% CI) | 0.0 [0.0, 0.0] | |
| 7 All cases of VTE ‐ age Show forest plot | 1 | Odds Ratio (M‐H, Fixed, 95% CI) | Totals not selected | |
| 7.1 Aged 70 ‐ 97 y | 1 | Odds Ratio (M‐H, Fixed, 95% CI) | 0.0 [0.0, 0.0] | |
| 7.2 Aged 50 ‐ 69 y | 1 | Odds Ratio (M‐H, Fixed, 95% CI) | 0.0 [0.0, 0.0] | |
| 8 Cardiovascular events Show forest plot | 1 | Odds Ratio (M‐H, Fixed, 95% CI) | Subtotals only | |
| 9 Any MI Show forest plot | 1 | Odds Ratio (M‐H, Fixed, 95% CI) | Subtotals only | |
| 10 Fatal MI Show forest plot | 1 | Odds Ratio (M‐H, Fixed, 95% CI) | Subtotals only | |
| 11 Any stroke Show forest plot | 1 | Odds Ratio (M‐H, Fixed, 95% CI) | Subtotals only | |
| 12 Fatal stroke Show forest plot | 1 | Odds Ratio (M‐H, Fixed, 95% CI) | Subtotals only | |
| 13 Arterial revascularisation Show forest plot | 1 | Odds Ratio (M‐H, Fixed, 95% CI) | Subtotals only | |
| 14 Death Show forest plot | 1 | Odds Ratio (M‐H, Fixed, 95% CI) | Subtotals only | |
| 15 Death after VTE Show forest plot | 1 | Odds Ratio (M‐H, Fixed, 95% CI) | Totals not selected | |
| 16 Confirmed death resulting from cardiovascular causes Show forest plot | 1 | Odds Ratio (M‐H, Fixed, 95% CI) | Subtotals only | |
| 17 Any serious adverse event Show forest plot | 1 | Odds Ratio (M‐H, Fixed, 95% CI) | Subtotals only | |
| 18 Hepatic disorder Show forest plot | 1 | Odds Ratio (M‐H, Fixed, 95% CI) | Subtotals only | |
| 19 Myopathy Show forest plot | 1 | Odds Ratio (M‐H, Fixed, 95% CI) | Totals not selected | |
| 20 Rhabdomyolysis Show forest plot | 1 | Odds Ratio (M‐H, Fixed, 95% CI) | Totals not selected | |
| 21 Renal disorder Show forest plot | 1 | Odds Ratio (M‐H, Fixed, 95% CI) | Subtotals only | |
| 22 Bleeding Show forest plot | 1 | Odds Ratio (M‐H, Fixed, 95% CI) | Totals not selected | |
| 23 Muscular weakness, stiffness, or pain Show forest plot | 1 | Odds Ratio (M‐H, Fixed, 95% CI) | Subtotals only | |
| 24 Gastrointestinal disorder Show forest plot | 1 | Odds Ratio (M‐H, Fixed, 95% CI) | Subtotals only | |